Abstract
Background:
Patients with acute ischaemic stroke (AIS) undergoing endovascular treatment may have a poor prognosis, even with successful recanalization. This study aims to evaluate a machine learning model based on CT-thrombosis radiomics to assess clinically ineffective reperfusion (CIR) after endovascular treatment (EVT) in patients with AIS.
Methods:
A total of 144 patients from two centres were included in this study, spanning from December 2021 to October 2024. The participants were randomly divided into a training set (70%) and a test set (30%). Patient outcomes were defined as clinically ineffective reperfusion (thrombolysis in cerebral infarction, TICI ≥2b, three-month post-surgery modified Rankin Scale, mRS ≥3) and effective reperfusion (TICI ≥2b, three-month post-surgery mRS <3). A total of 1,702 features were extracted from the intrathrombus and perithrombus regions. The minimum redundancy maximum relevance (mRMR) and least absolute shrinkage and selection operator (LASSO) algorithm were used for feature selection to construct the machine learning model, with the AUC of the receiver operating characteristic (ROC) curve used for model evaluation.
Results:
In the test set, the random forest (RF) model demonstrated the highest diagnostic performance among all the models (RF_INTRA AUC = 0.78, RF_PERI AUC = 0.76, RF_F AUC = 0.83).
Conclusion:
The machine learning model based on intrathrombus and perithrombus radiomics features can accurately predict clinically ineffective reperfusion in patients after EVT. However, further study is needed to validate these findings in larger, independent cohorts and explore the broader clinical applicability of the model.
Introduction
Acute ischaemic stroke (AIS) is a cerebrovascular disease associated with a high burden of disability and mortality (1, 2). Endovascular therapy (EVT) is an established intervention for managing acute large vessel occlusion (3, 4). However, EVT is associated with complications, such as post-thrombectomy bleeding and cerebral oedema caused by ischaemia-reperfusion (5, 6). Therefore, not all patients with AIS benefit from EVT. Consequently, it is crucial to find effective methods of identifying patients suitable for EVT and accurately predicting successful reperfusion.
Traditional prognostic imaging markers, such as hyper-dense middle cerebral artery signs (7), large core infarcts (8), and CT perfusion mismatch (9), are considered indicators of patient prognosis. However, these existing imaging biomarkers rely on subjective interpretation, resulting in varying conclusions among clinicians, limiting their reliability in predicting successful reperfusion. Therefore, an objective and accurate approach to predicting successful reperfusion is urgently needed.
Radiomics (10), is a quantitative imaging analysis technique designed to facilitate the extraction of numerous quantitative features from medical images. These features aid in disease diagnosis, treatment outcome prediction, and assessment of therapeutic efficacy.
Machine learning complements radiomics by efficiently processing large datasets, automatically optimising the model performance, and identifying complex patterns. Advanced models such as support vector machine (SVM) and K-nearest neighbors (KNN) often outperform traditional statistical models in terms of predictive efficacy (11). Current research on thrombus radiomics has primarily focused on thrombus composition (12), identification of cardiovascular stroke (13), and prediction of the first-pass effect (14) and has yielded notable promising results. However, a gap persists in leveraging this approach for predicting effective recanalization.
In this study, we developed a machine learning model based on the radiomics features derived from the thrombus and surrounding tissue to accurately predict whether CIR occurs after EVT in patients with AIS. Our goal was to facilitate the identification of patients with AIS who are unsuitable for EVT and to provide informed guidance for future clinical practice.
Materials and methods
Patients
We conducted a retrospective analysis of all patients with AIS admitted to the two participating hospital stroke centres between December 2021 and October 2024 (Centre A, n = 109; Centre B, n = 35). The inclusion criteria were as follows: (1) acute ischaemic stroke caused by large-vessel occlusion; (2) visible thrombosis on CT; (3) undergoing EVT; and (4) availability of complete clinical and imaging data. Exclusion criteria included: (1) incomplete imaging data or low-quality images unsuitable for radiomic feature extraction; and (2) loss to follow-up at 3 months post-surgery. CIR was defined as achieving a TICI score of ≥2b post-thrombectomy and a modified Rankin Scale (mRS) score ≥3 at three-month follow-up. This study followed the Helsinki guidelines and received approval from the institutional ethics review board. Informed consent was obtained from all patients.
Image acquisition and thrombus segmentation
CT and CTA images were obtained using 64-slice, 128-row CT scans (Siemens, Germany) with a slice thickness of 0.5 mm. Preoperative CTA images were matched to postoperative DSA images using ANTS software to accurately identify the thrombus (Figure 1). Thrombus segmentation was performed based on the matching results of CTA and postoperative DSA; the location of the thrombus was annotated using NCCT and CTA (Figure 1). Segmentation was conducted by two experienced clinicians using 3D Slicer (version 4.9.0, National Institutes of Health) with verification by another senior physician. Appropriate measures were taken to minimise patient discomfort during the procedures. Following thrombus segmentation, Python (version 2.7.13) was used to automatically segment the perithrombus areas within a 1 mm boundary. Additionally, researchers were blinded to the patients’ clinical information.
Figure 1
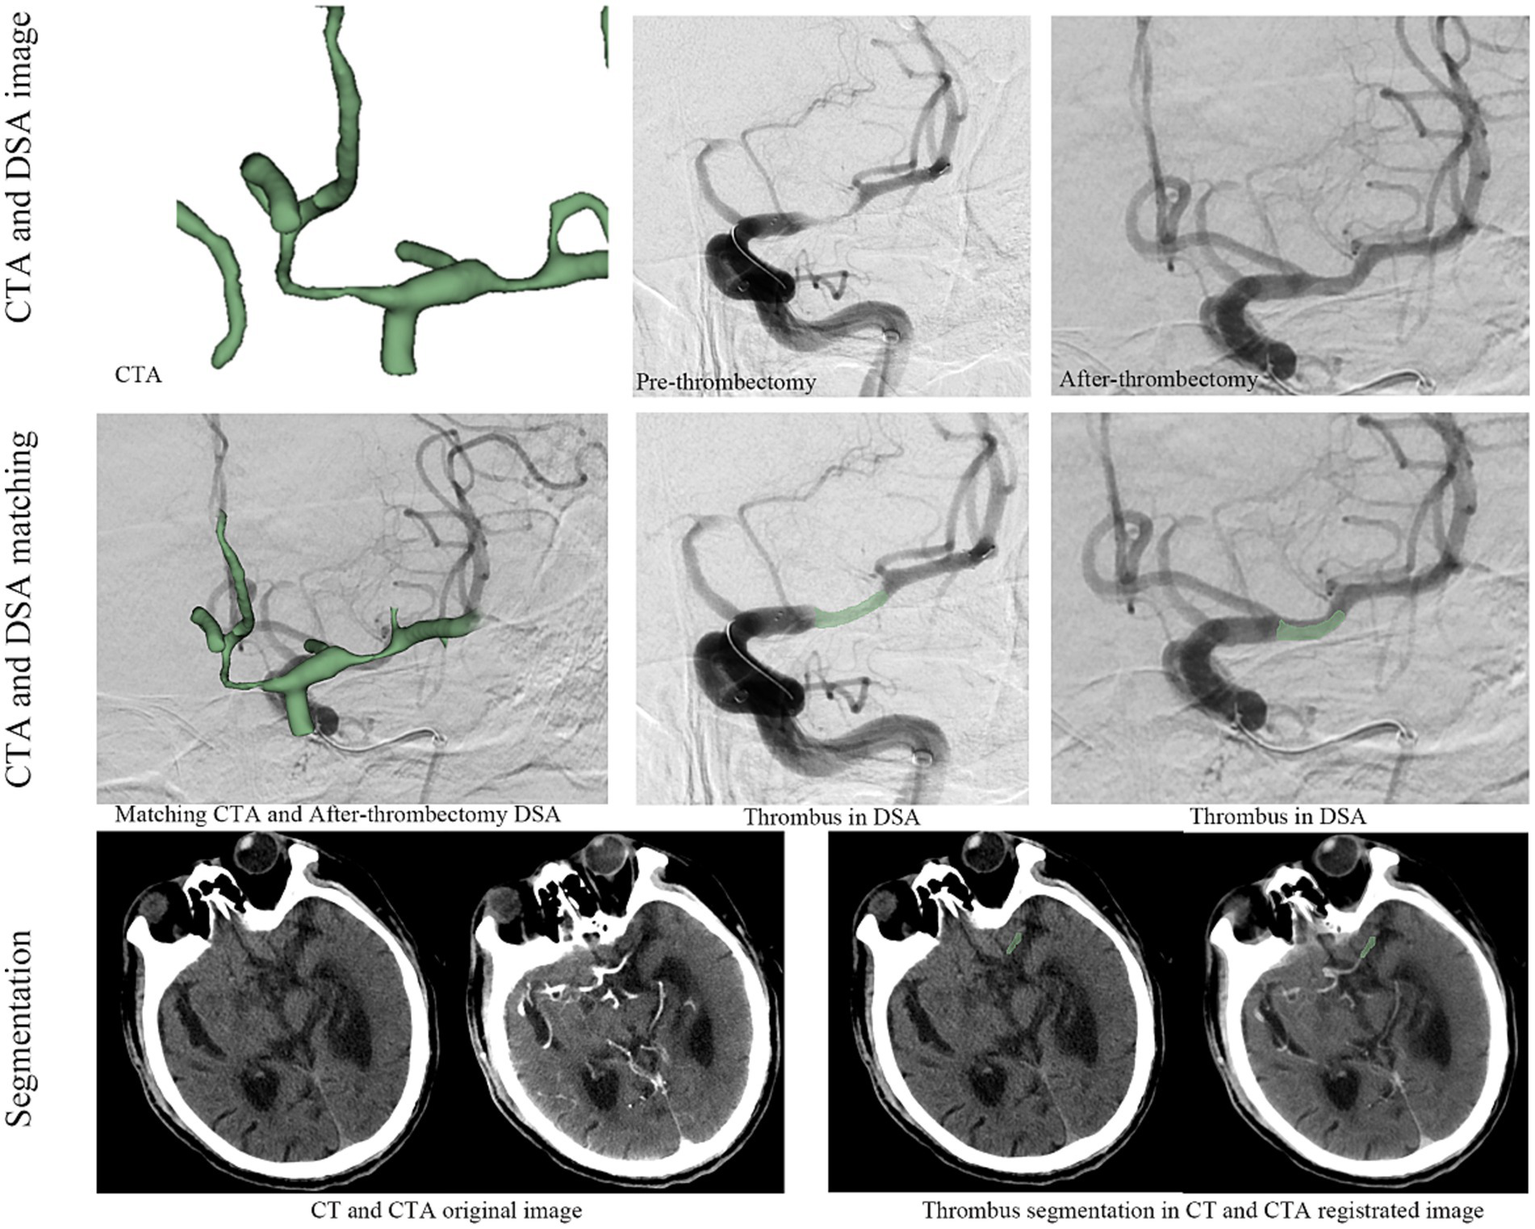
The workflow for thrombus radiomics feature extraction.
Radiomics parameters (RFs) extraction and selection
All images were resampled to a voxel size of 1 mm × 1 mm × 1 mm, and radiomics parameters were extracted using radiomics. Thrombus segmentation and radiomics parameter extraction were conducted by two experienced clinicians. Data consistency was evaluated using the intraclass correlation coefficient (ICC), with parameters having an ICC >0.8 included in subsequent analyses. Z-scores were used to standardise the data across the entire dataset, and the minimum redundancy maximum relevance (mRMR) algorithm (Figure 2) was used to select the top 10 variables for further study. The least absolute shrinkage and selection operator (LASSO) was applied to refine the selection of variables for subsequent model construction.
Figure 2
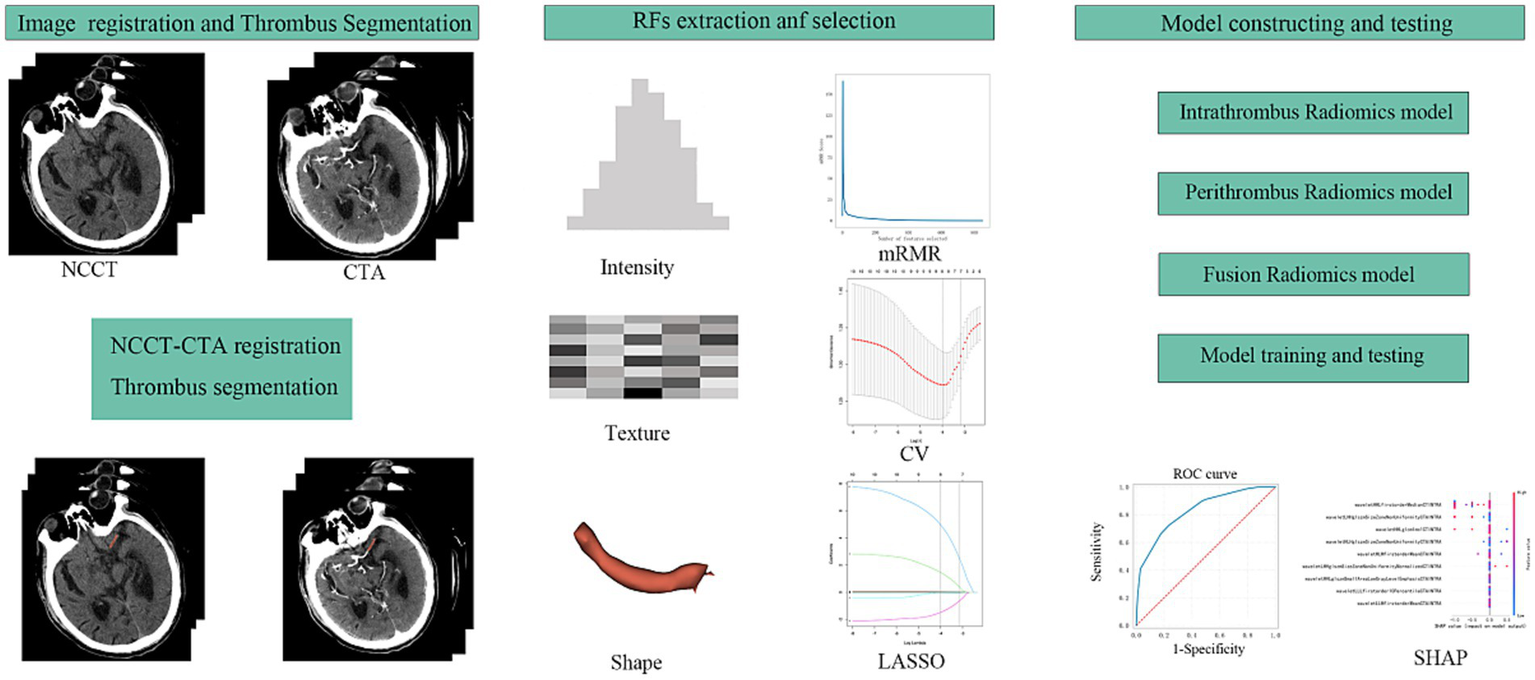
The workflow of this study design. RFs, radiomics features; mRMR, maximal relevance and minimal redundancy; CV, cross validation; LASSO, least absolute shrinkage selection operator; SHAP, SHapley Additive exPlanations.
Model building and evaluation
Datasets were randomly divided into training and testing sets in a 7:3 ratio. A 10-fold cross-validation was used applied to the training set for model development. Diagnostic performance was evaluated on the testing set using receiver operating characteristic (ROC) curves (Figure 2). Machine learning models were constructed for the intrathrombus and perithrombus areas, labelled RF_INTRA, DT_INTRA, SVM_INTRA, and KNN_INTRA for intrathrombus, and RF_PERI, DT_PERI, SVM_PERI, and KNN_PER for perithrombus. Fusion models (RF_F, DT_F, SVM_F, and KNN_F) were developed by integrating features from both regions.
We selected the point on the ROC curve with the minimum distance from the left-upper corner of the curve and used the corresponding sensitivities and specificities to calculate likelihood ratios. LR+ represents the ratio of the probability of a positive test result in patients with the condition to the probability in those without the condition, while LR− reflects the opposite. The formulas were as follows: LR+ = Sensitivity/(1 − Specificity), LR− = (1 − Sensitivity)/Specificity.
The clinical impact of LRs was interpreted using established thresholds: LR+ >10 or LR− <0.1 indicate strong evidence to rule in or rule out a diagnosis, respectively. LR+ 5–10 or LR− 0.1–0.2 suggest moderate diagnostic value. LR+ 2–5 or LR− 0.2–0.5 provide limited but potentially useful shifts in probability.
SHAP analysis
The SHAP algorithm was used to assess the contribution of each parameter in the RF-F model. The variable importance plot ranked the impact of each parameter on the model performance according to the SHAP values (Figure 3).
Figure 3
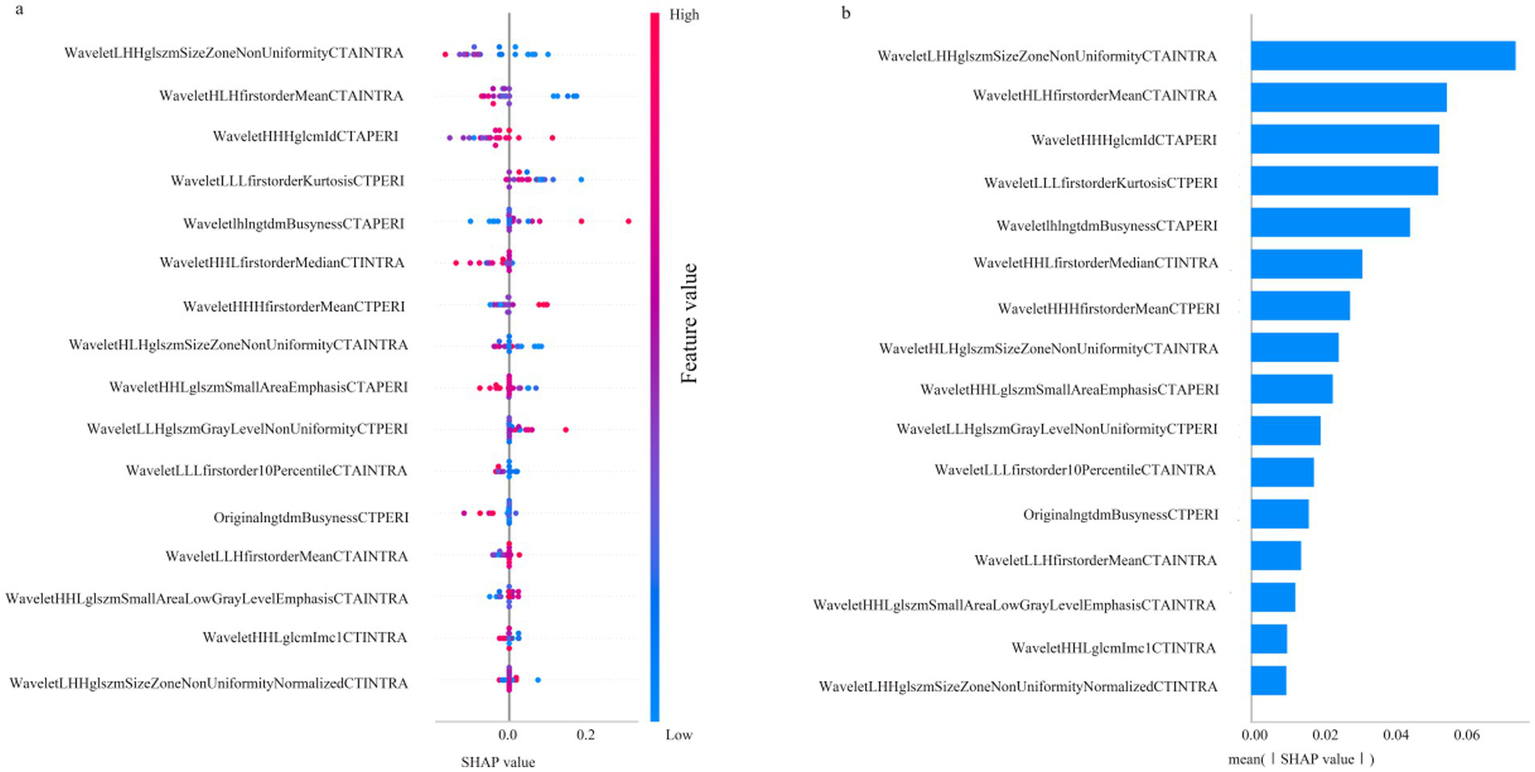
SHAP diagram of RF_F model. (a) SHAP honeycomb diagram of RF_F model. (b) SHAP value ranking of the variables in the RF_F model.
Statistical analysis
Statistical analyses were conducted using R software (version 4.2.2), primarily using the glmnet, e1071, and caTools packages. Quantitative data following normal distribution were reported as mean ± standard deviation (M ± SD), and group differences were compared using the t-test. Non-normally distributed quantitative data were reported as the M, Q1, and Q3, and group comparisons were conducted using the Mann–Whitney U test. Qualitative data were presented as frequencies (N) and percentages (%), with group differences assessed using the chi-square test or Fisher’s exact test for sample sizes <5. Statistical significance was set at p < 0.05. The Test value refers to the test statistic (e.g., *t*-value for *t*-tests or chi-square value for chi-square tests) generated during hypothesis testing. It quantifies the difference or association between groups.
Results
Patients characteristics
A total of 144 patients were included in this study, of whom 45 (31.25%) experienced clinically ineffective reperfusion after EVT. Table 1 presents the baseline characteristics of the effective and ineffective reperfusion groups. No significant differences were observed between the groups regarding age, sex, hypertension, diabetes, or NIHSS scores (p > 0.05).
Table 1
| Characteristics | Effective reperfusion (n = 99) | Clinically ineffective reperfusion (n = 45) | Test value | p-value |
|---|---|---|---|---|
| Age | 71 ± 13 | 76 ± 11 | 2.14 | 0.97 |
| Sex | 0.09 | 0.77 | ||
| Male | 51 | 22 | ||
| Female | 48 | 23 | ||
| Hypertension | 50 | 28 | 1.71 | 0.19 |
| Diabetes | 34 | 15 | 0.014 | 0.91 |
| NIHSS | 10 ± 9 | 17 ± 9 | 4.21 | 0.29 |
| Site | ||||
| ICA | 23 | 12 | — | >0.05 |
| MCA | 60 | 24 | — | >0.05 |
| M1 | 43 | 17 | — | — |
| M2 | 12 | 6 | — | — |
| M3 | 5 | 1 | — | — |
| ACA | 1 | 0 | — | >0.05 |
| VA | 11 | 6 | — | >0.05 |
| BA | 1 | 3 | — | >0.05 |
| PCA | 3 | 0 | — | >0.05 |
Patients’ baseline characteristics.
Feature extraction and selection
From the intrathrombus and perithrombus area, 1,702 features were extracted, including 28 shape features, 36 first-order features, 150 texture features, and 1,488 wavelet features. All parameters had an ICC greater than 0.8, ensuring their inclusion in subsequent analyses. The final variables used to develop the model were selected using the mRMR and LASSO algorithms, including:
waveletLHHglszmSizeZoneNonUniformityCTAINTRA, waveletHLHfirstorderMeanCTAINTRA, waveletHHLfirstorderMedianCTINTRA, waveletHHLglszmSmallAreaLowGrayLevelEmphasisCTAINTRA, waveletLLLfirstorder10PercentileCTAINTRA, waveletHHLglcmImc1CTINTRA, waveletLHHglszmSizeZoneNonUniformityNormalizedCTINTRA, waveletHLHglszmSizeZoneNonUniformityCTAINTRA, waveletLLHfirstorderMeanCTAINTRA, waveletLHLngtdmBusynessCTAPERI, waveletHHHfirstorderMeanCTPERI, originalngtdmBusynessCTPERI, waveletHHHglcmIdCTAPERI, waveletLLHglszmGrayLevelNonUniformityCTPERI, waveletLLLfirstorderKurtosisCTPERI, waveletHHLglszmSmallAreaEmphasisCTAPERI.
Models performances
Table 2 shows the model performance for intrathrombus, perithrombus, and fusion areas. For the intrathrombus region, the AUC values for RF-INTRA, DT-INTRA, SVM-INTRA, and KNN-INTRA are 0.78, 0.70, 0.67, and 0.69, respectively. For perithrombus models, the AUC values for RF-PERI, DT-PERI, SVM-PERI, and KNN-PERI are 0.76, 0.69, 0.73, and 0.64, respectively. Fusion models, which combined intrathrombus and perithrombus features, had AUC values for the RF-F, DT-F, SVM-F, and KNN-F models as 0.83, 0.73, 0.86, and 0.73, respectively (Figure 4). Among the models tested, only RF_INTRA, KNN_INTRA, and RF_PERI yielded LR+ values above 5, indicating potential clinical utility for ruling in disease. However, none of the models achieved LR− values below 0.2, suggesting limited utility for ruling out disease.
Table 2
| Model | Sensitivity | Specificity | AUC (95% CI) | LR+ | LR− |
|---|---|---|---|---|---|
| RF_INTRA | 0.77 | 1.0 | 0.78 (0.61–0.96) | ∞ | 0.23 |
| DT_INTRA | 0.45 | 0.85 | 0.70 (0.55–0.86) | 3.00 | 0.65 |
| SVM_INTRA | 0.85 | 0.33 | 0.67 (0.50–0.84) | 1.27 | 0.45 |
| KNN_INTRA | 0.40 | 0.94 | 0.69 (0.53–0.86) | 6.67 | 0.64 |
| RF_PERI | 0.3 | 0.95 | 0.76 (0.55–0.97) | 6.00 | 0.74 |
| DT_PERI | 0.3 | 1.0 | 0.69 (0.51–0.95) | ∞ | 0.70 |
| SVM_PERI | 0.62 | 0.62 | 0.73 (0.57–0.89) | 1.63 | 0.61 |
| KNN_PERI | 0.30 | 0.88 | 0.64 (0.50–0.82) | 0.94 | 1.03 |
The performances of different machine learning models.
Positive likelihood ratio (LR+), negative likelihood ratio (LR−).
Figure 4
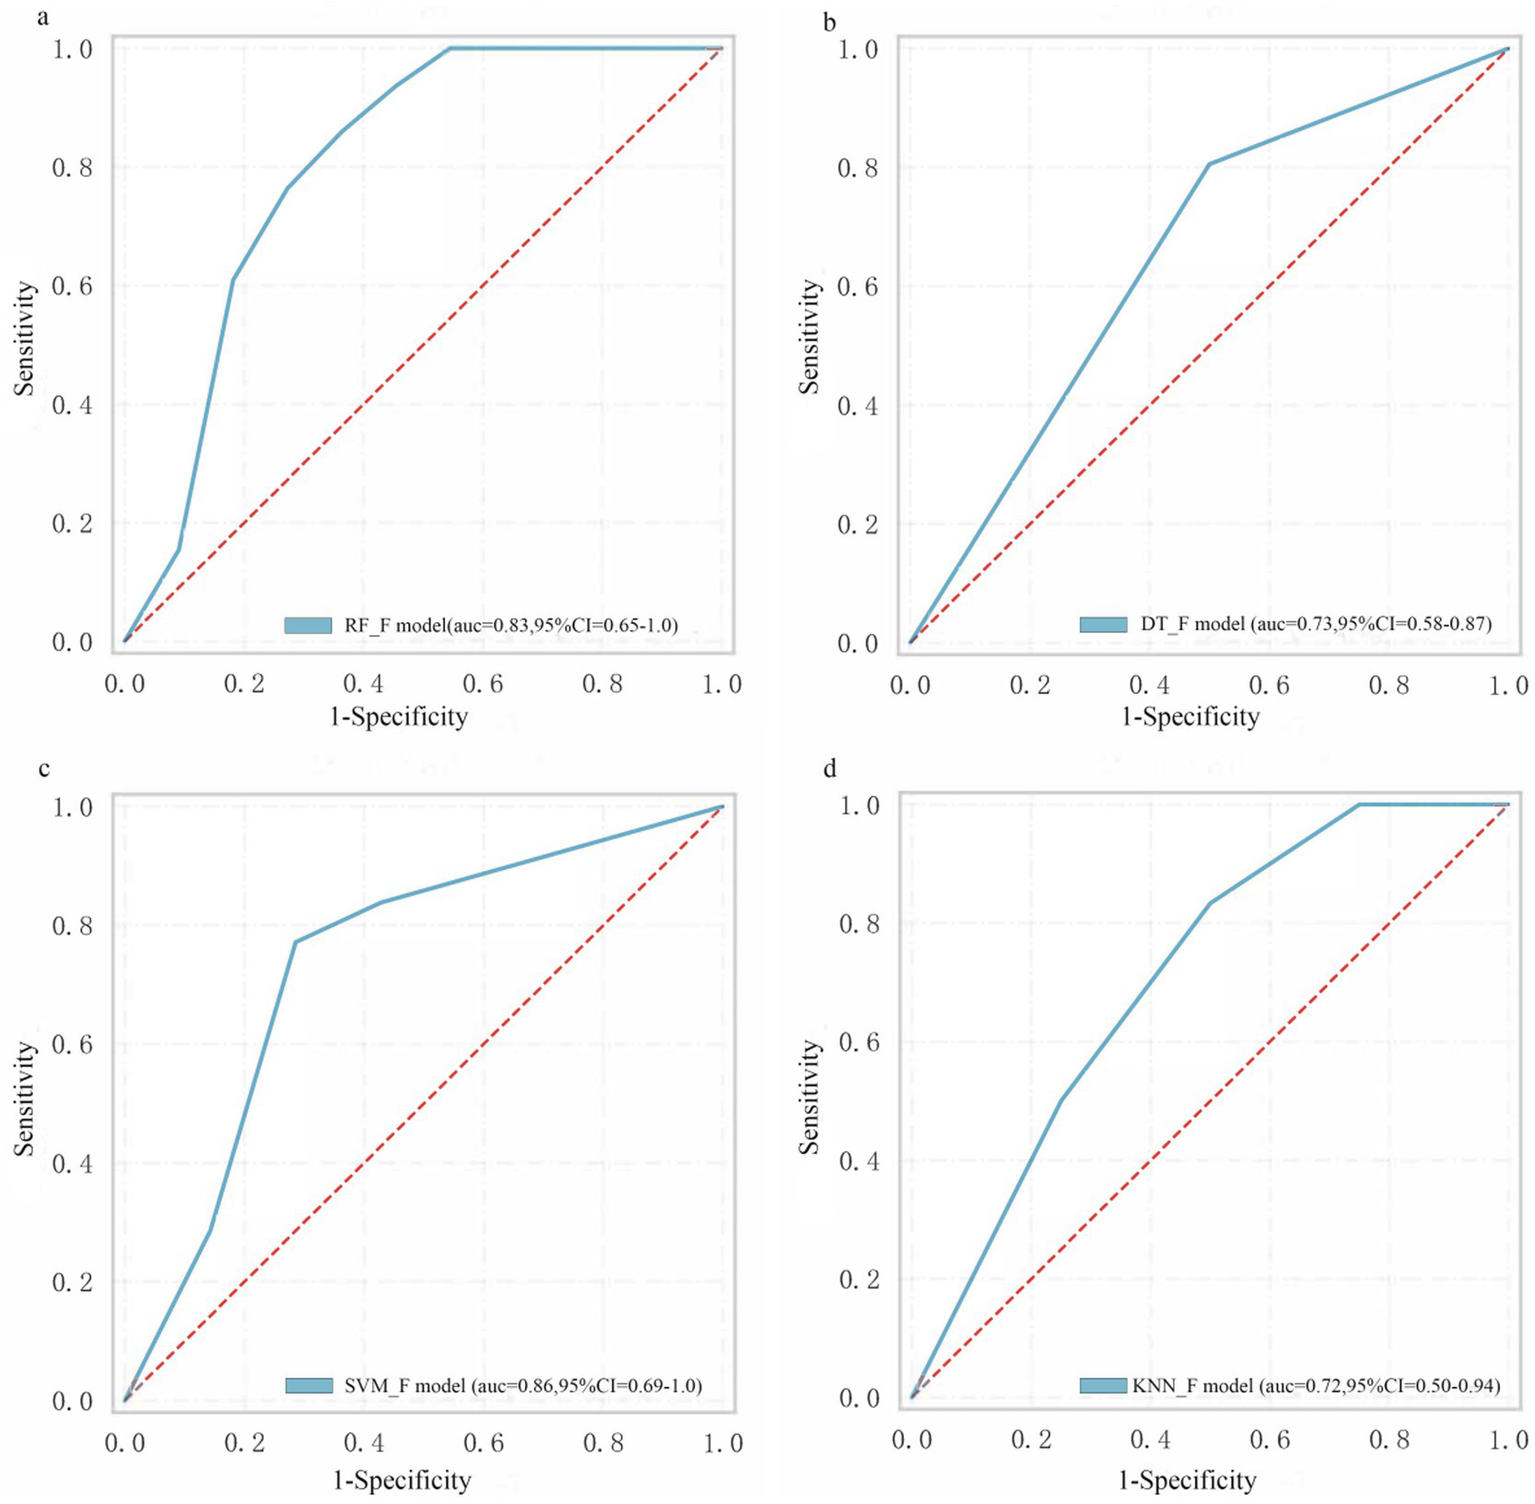
The performance of machine learning models. (a) RF_F model. (b) DT_F model. (c) SVM_F model. (d) KNN_F model.
According to Table 3, the RF_F model demonstrated the highest sensitivity (0.79) and specificity (0.71), along with the most favorable LR+ (2.72) and LR− (0.30) values. The SVM_F model showed comparable performance with sensitivity of 0.78, specificity of 0.69, LR+ of 2.52, and LR− of 0.32. The DT_F and KNN_F models exhibited relatively lower performance across all metrics, with DT_F having the lowest specificity (0.52) and KNN_F showing sensitivity and specificity values of 0.70 and 0.59, respectively.
Table 3
| Model | Sensitivity | Specificity | LR+ | LR− |
|---|---|---|---|---|
| RF_F | 0.79 | 0.71 | 2.72 | 0.3 |
| DT_F | 0.72 | 0.52 | 1.56 | 0.48 |
| SVM_F | 0.78 | 0.69 | 2.52 | 0.32 |
| KNN_F | 0.7 | 0.59 | 1.71 | 0.51 |
The performances of different machine learning models.
Positive likelihood ratio (LR+), negative likelihood ratio (LR−).
SHAP
Figure 3 illustrates the contribution of each parameter to the RF_F model, as analysed by the SHAP algorithm. Among the parameters, WaveletLHHglszmSizeZoneNonUniformityCTAINTRA emerged as the most significant variable, representing the primary RFs factor influencing the CIR, whileWaveletHHHglcmIdcCTAPERI is the most influential perithrombus RFs affecting the CIR.
Discussion
Endovascular intervention for AIS often benefits most patients; however, some may not achieve a favorable prognosis despite successful recanalization. Therefore, accurately identifying these patients is critical. In this study, we developed and validated a radiomics-based machine learning model, which uses thrombus and peri-thrombus areas to accurately predict CIR in patients with AIS undergoing EVT treatment. We also used the SHAP algorithm to interpret the RF-F model and found that waveletLHHglszmSizeZoneNonUniformityCTAINTRA is the most important parameter for predicting CIR.
Current thrombus radiomics research primarily investigates thrombus composition (12) and its association with the number of thrombectomy attempts (15). Studies have confirmed that thrombus radiomics is related to the likelihood of successful recanalization, while the number of intervention attempts correlates with key patient prognostic factors (16, 17). In this study, nine features were extracted from intra-thrombus and seven from peri-thrombus regions, enabling the development of machine learning models that reliably predict the successful recanalization post-EVT in patients. Histopathological analysis indicates that thrombectomy often induces vascular wall injury (18), causing intimal damage, vascular wall thickening, inflammation, and blood–brain barrier disruption (19–21), contributing to a poor prognosis. To address this, we included radiomics information from a 1 mm peri-thrombus region to provide insight into the intrinsic characteristics of the vascular wall and surrounding tissues, thereby developing a predictive model that provides accurate prognosis predictions.
This study combined the mRMR and LASSO algorithms to select prognostically significant, minimal correlated variables among the model parameters, enhancing the model’s predictive performance and accuracy.
Radiomic features from both the intra-thrombus and peri-thrombus regions were extracted, enabling a comprehensive characterization of thrombus composition, vascular wall status, and perivascular inflammatory response. A hybrid machine learning model integrating both regions was developed and demonstrated superior predictive performance compared to single-region models.
Specifically, the random forest (RF) models based on intra-thrombus, peri-thrombus, and combined radiomic features all exhibited good overall predictive performance. Among them, the RF_INTRA and RF_PERI models achieved positive likelihood ratios (LR+) of ∞ and 6.00, respectively, indicating strong clinical utility in confirming patients at high risk of poor cerebral infarct resolution (CIR) after EVT. The KNN_INTRA model also yielded a high LR+ of 6.67. However, none of the models reached an LR− below 0.2, suggesting limited value for ruling out poor outcomes with high confidence. These findings support the use of radiomics-based machine learning models as clinically useful tools for risk stratification, particularly when the test result is positive. The LR values provide a practical and interpretable framework for applying these models in individual clinical decision-making.
The SHAP algorithm was applied to interpret the RF_F model, further clarifying the influence of each variable on the model and ranking their importance. Wavelet LHHglszm Size Zone NonUniformity CTAINTRA was identified as the most important parameter influencing patient prognosis. This parameter reflects the uneven distribution of grayscale region sizes, with higher values indicating greater disparity, while the multiscale features introduced by the wavelet transform enable the assessment of image texture complexity and structure at different levels, revealing high heterogeneity within the thrombus.
This study had several limitations. First, the relatively small sample size limits the generalizability of the findings, necessitating validation with a large independent dataset. Second, while thrombus segmentation was performed manually, and rigorous statistical methods such as ICC analysis were applied during subsequent feature selection, some subjective bias remained.
In conclusion, this study highlights the value of radiomics in analysing thrombus and peri-thrombus features to predict CIR in AIS patients following EVT. The radiomics-based machine learning model offers a robust tool for identifying patients at risk of poor outcomes and holds promise for improving clinical decision-making. However, further study is needed to validate these findings in larger, independent cohorts and explore the broader clinical applicability of the model.
Statements
Data availability statement
The raw data supporting the conclusions of this article will be made available by the authors, without undue reservation.
Ethics statement
The studies involving humans were approved by the Institutional Ethics Review Board of Shanghai Fourth People’s Hospital. The studies were conducted in accordance with the local legislation and institutional requirements. The participants provided their written informed consent to participate in this study. Written informed consent was obtained from the individual(s) for the publication of any potentially identifiable images or data included in this article.
Author contributions
XH: Validation, Writing – original draft. SL: Writing – original draft. SY: Writing – original draft. ZD: Writing – original draft. PL: Writing – original draft. YF: Writing – review & editing.
Funding
The author(s) declare that financial support was received for the research and/or publication of this article. The study was supported by Hongkou District Key Discipline of Public Health Construction Projects (HKLCFC202402 and HKQWZD202404); Scientific Funding of Shanghai Fourth People’s Hospital (sykyqd06701, SY-YKYTS-2024-1003 and SY-XKZT-2025-1001); National Natural Science Foundation of China (82071279).
Conflict of interest
The authors declare that the research was conducted in the absence of any commercial or financial relationships that could be construed as a potential conflict of interest.
Generative AI statement
The authors declare that no Gen AI was used in the creation of this manuscript.
Any alternative text (alt text) provided alongside figures in this article has been generated by Frontiers with the support of artificial intelligence and reasonable efforts have been made to ensure accuracy, including review by the authors wherever possible. If you identify any issues, please contact us.
Publisher’s note
All claims expressed in this article are solely those of the authors and do not necessarily represent those of their affiliated organizations, or those of the publisher, the editors and the reviewers. Any product that may be evaluated in this article, or claim that may be made by its manufacturer, is not guaranteed or endorsed by the publisher.
References
1.
Herpich F Rincon F . Management of acute ischemic stroke. Crit Care Med. (2020) 48:1654–63. doi: 10.1097/CCM.0000000000004597
2.
GBD 2019 Stroke Collaborators . Global, regional, and national burden of stroke and its risk factors, 1990–2019: a systematic analysis for the Global burden of Disease Study 2019. Lancet Neurol. (2021) 20:795–820. doi: 10.1016/S1474-4422(21)00252-0
3.
Huo X Ma G Tong X Zhang X Pan Y Nguyen TN et al . Trial of endovascular therapy for acute ischemic stroke with large infarct. N Engl J Med. (2023) 388:1272–83. doi: 10.1056/NEJMoa2213379
4.
Sarraj A Gupta R . Endovascular treatment for ischemic strokes with large vessel occlusion: proven therapy and bright future. Stroke. (2015) 46:1431–2. doi: 10.1161/STROKEAHA.115.008525
5.
Peng G Huang C Chen W Xu C Liu M Xu H et al . Risk factors for decompressive craniectomy after endovascular treatment in acute ischemic stroke. Neurosurg Rev. (2020) 43:1357–64. doi: 10.1007/s10143-019-01167-4
6.
Nogueira RG Gupta R Jovin TG Levy EI Liebeskind DS Zaidat OO et al . Predictors and clinical relevance of hemorrhagic transformation after endovascular therapy for anterior circulation large vessel occlusion strokes: a multicenter retrospective analysis of 1122 patients. J Neurointerv Surg. (2015) 7:16–21. doi: 10.1136/neurintsurg-2013-010743
7.
Mowla A Razavi SM Lail NS Mohammadi P Shirani P Kavak KS et al . Hyperdense middle cerebral artery sign and response to combination of mechanical thrombectomy plus intravenous thrombolysis in acute stroke patients. J Neurol Sci. (2021) 429:117618. doi: 10.1016/j.jns.2021.117618
8.
Costalat V Lapergue B Albucher JF Labreuche J Henon H Gory B et al . Evaluation of acute mechanical revascularization in large stroke (ASPECTS ≤5) and large vessel occlusion within 7 h of last-seen-well: the LASTE multicenter, randomized, clinical trial protocol. Int J Stroke. (2024) 19:114–9. doi: 10.1177/17474930231191033
9.
Campbell BC Christensen S Levi CR Desmond PM Donnan GA Davis SM et al . Comparison of computed tomography perfusion and magnetic resonance imaging perfusion-diffusion mismatch in ischemic stroke. Stroke. (2012) 43:2648–53. doi: 10.1161/STROKEAHA.112.660548
10.
van Griethuysen JJM Fedorov A Parmar C Hosny A Aucoin N Narayan V et al . Computational radiomics system to decode the radiographic phenotype. Cancer Res. (2017) 77:e104–7. doi: 10.1158/0008-5472.CAN-17-0339
11.
Hu X Deng P Ma M Tang X Qian J Gong YH et al . A machine learning model based on results of a comprehensive radiological evaluation can predict the prognosis of basal ganglia cerebral hemorrhage treated with neuroendoscopy. Front Neurol. (2024) 15:1406271. doi: 10.3389/fneur.2024.1406271
12.
Hanning U Sporns PB Psychogios MN Jeibmann A Minnerup J Gelderblom M et al . Imaging-based prediction of histological clot composition from admission CT imaging. J Neurointerv Surg. (2021) 13:1053–7. doi: 10.1136/neurintsurg-2020-016774
13.
Jiang J Wei J Zhu Y Wei L Wei X Tian H et al . Clot-based radiomics model for cardioembolic stroke prediction with CT imaging before recanalization: a multicenter study. Eur Radiol. (2023) 33:970–80. doi: 10.1007/s00330-022-09116-4
14.
Sarioglu O Sarioglu FC Capar AE Sokmez DF Mete BD Belet U . Clot-based radiomics features predict first pass effect in acute ischemic stroke. Interv Neuroradiol. (2022) 28:160–8. doi: 10.1177/15910199211019176
15.
van Voorst H Bruggeman AAE Yang W Andriessen J Welberg E Dutra BG et al . Thrombus radiomics in patients with anterior circulation acute ischemic stroke undergoing endovascular treatment. J Neurointerv Surg. (2023) 15:e79–85. doi: 10.1136/jnis-2022-019085
16.
Alawieh A Vargas J Fargen KM Langley EF Starke RM de Leacy R et al . Impact of procedure time on outcomes of thrombectomy for stroke. J Am Coll Cardiol. (2019) 73:879–90. doi: 10.1016/j.jacc.2018.11.052
17.
Bourcier R Saleme S Labreuche J Mazighi M Fahed R Blanc R et al . More than three passes of stent retriever is an independent predictor of parenchymal hematoma in acute ischemic stroke. J Neurointerv Surg. (2019) 11:625–9. doi: 10.1136/neurintsurg-2018-014380
18.
Mereuta OM Abbasi M Fitzgerald S Dai D Kadirvel R Hanel RA et al . Histological evaluation of acute ischemic stroke thrombi may indicate the occurrence of vessel wall injury during mechanical thrombectomy. J Neurointerv Surg. (2022) 14:356–61. doi: 10.1136/neurintsurg-2021-017310
19.
Luby M Hsia AW Nadareishvili Z Cullison K Pednekar N Adil MM et al . Frequency of blood-brain barrier disruption post-endovascular therapy and multiple thrombectomy passes in acute ischemic stroke patients. Stroke. (2019) 50:2241–4. doi: 10.1161/STROKEAHA.119.025914
20.
Potreck A Mutke MA Weyland CS Pfaff JAR Ringleb PA Mundiyanapurath S et al . Combined perfusion and permeability imaging reveals different pathophysiologic tissue responses after successful thrombectomy. Transl Stroke Res. (2021) 12:799–807. doi: 10.1007/s12975-020-00885-y
21.
Bani-Sadr A Mechtouff L De Bourguignon C Mauffrey A Boutelier T Cho TH et al . Blood-brain barrier permeability and kinetics of inflammatory markers in acute stroke patients treated with thrombectomy. Neurology. (2023) 101:e502–11. doi: 10.1212/WNL.0000000000207460
Summary
Keywords
thrombus, radiomics, machine learning, clinically ineffective reperfusion, stroke
Citation
Hu X, Li S, Ye S, Ding Z, Li P and Fang Y (2025) Radiomics-based machine learning model for predicting clinically ineffective reperfusion in acute ischaemic stroke patients after endovascular treatment. Front. Neurol. 16:1606287. doi: 10.3389/fneur.2025.1606287
Received
05 April 2025
Accepted
20 August 2025
Published
18 September 2025
Volume
16 - 2025
Edited by
Andrea Morotti, Neurological Institute Foundation Casimiro Mondino (IRCCS), Italy
Reviewed by
Weimin Yang, First Affiliated Hospital of Zhengzhou University, China
Xianjin Shang, The First Affiliated Hospital (Yijishan Hospital) of Wannan Medical College, China
Barnet Eskin, Envision Physician Services Parsippany, United States
Updates
Copyright
© 2025 Hu, Li, Ye, Ding, Li and Fang.
This is an open-access article distributed under the terms of the Creative Commons Attribution License (CC BY). The use, distribution or reproduction in other forums is permitted, provided the original author(s) and the copyright owner(s) are credited and that the original publication in this journal is cited, in accordance with accepted academic practice. No use, distribution or reproduction is permitted which does not comply with these terms.
*Correspondence: Peng Li, peng825@126.com; Yibin Fang, fangyibin@tongji.edu.cn
†These authors have contributed equally to this work and share first authorship
Disclaimer
All claims expressed in this article are solely those of the authors and do not necessarily represent those of their affiliated organizations, or those of the publisher, the editors and the reviewers. Any product that may be evaluated in this article or claim that may be made by its manufacturer is not guaranteed or endorsed by the publisher.