 Ying Miao
 Yu Wang
 Yuting He
 Pijun Yan
 Qin Wan
- 1Department of Endocrinology and Metabolism, Affiliated Hospital of Southwest Medical University, Luzhou, China
- 2Metabolic Vascular Disease Key Laboratory of Sichuan Province, Luzhou, China
- 3Sichuan Clinical Research Center for Diabetes and Metabolism, Luzhou, China
- 4Sichuan Clinical Research Center for Nephropathy, Luzhou, China
- 5Cardiovascular and Metabolic Diseases Key Laboratory of Luzhou, Luzhou, China
- 6Department of Cardiology, Luzhou People’s Hospital, Luzhou, China
- 7Department of Neurology, Chengdu Sixth People's Hospital, Chengdu, China
Background: Ischemic stroke (IS) is a leading cause of death and disability, imposing a significant economic burden globally. Research has demonstrated that insulin resistance (IR) plays a key role in the development of atherosclerosis, platelet dysfunction, and a hypercoagulable state, all of which contribute to the pathogenesis and progression of IS. The triglyceride-glucose (TyG) index serves as a practical tool for assessing insulin sensitivity, with previous studies exploring its correlation with IS. However, the relationship between the novel TyG-body mass index (TyG-BMI), which combines TyG with body mass index (BMI) as a measure of general obesity, and IS remains unclear. Therefore, this study employs a prospective design to assess the predictive value of TyG-BMI for the 10-year risk of IS in individuals without intervention.
Methods: The study population was derived from the China Cardiometabolic Disease and Cancer Cohort (4C) Study, predominantly comprising participants from Luzhou City, Sichuan Province, and primarily targeting individuals aged 40 and above. Comprehensive data collection was conducted using both questionnaires and specialized medical equipment, covering physical measurements, blood pressure, and relevant biochemical markers. Participants with a history of stroke were excluded from the study. Based on the initial data, participants were divided into four groups according to the TyG-BMI quartiles. Spearman correlation analysis was used to examine the relationship between TyG-BMI and clinical and laboratory parameters. The Log-rank test was applied to analyze differences in the cumulative incidence of IS among the four groups. The Cox proportional hazards model was used to analyze the relationship between TyG-BMI and the 10-year incidence of new IS. Additionally, the ROC curve was employed to assess the predictive value of TyG-BMI for the 10-year incidence of new IS in the middle-aged and elderly population.
Results: This study included 9,406 participants, consisting of 3,139 males (33.4%) and 6,267 females (66.6%). During the non-interventional follow-up period of 10 years, 483 deaths were recorded, resulting in a mortality rate of 5.1%. In addition, 527 new cases of IS were reported, yielding an incidence rate of 5.6%. The Log-rank test revealed a significant increase in the cumulative incidence of IS across increasing TyG-BMI quartiles (p < 0.01). Furthermore, Cox regression analysis identified a significant correlation between TyG-BMI levels, as a risk factor, and the occurrence of IS. After adjusting for other risk factors, the risk of developing new IS in the Q2 group was 1.449 times that of the Q1 group (p = 0.012), while the risk in the Q3 group was 1.438 times that of the Q1 group (p = 0.014), and the risk in the Q4 group was 1.434 times that of the Q1 group (p = 0.020). ROC curve analysis showed that, in the overall study population, TyG-BMI demonstrated a predictive value for new IS over 10 years (AUC = 0.566, 95% CI = 0.542–0.590, p < 0.001), with a cutoff value of 204.1307, sensitivity of 64.3%, and specificity of 47.8%. In male participants, TyG-BMI showed a predictive value for new IS over 10 years (AUC = 0.537, 95% CI = 0.501–0.574, p = 0.067), with a cutoff value of 195.1996, sensitivity of 73.8%, and specificity of 37.0%. In female participants, TyG-BMI demonstrated a predictive value for new IS over 10 years (AUC = 0.583, 95% CI = 0.551–0.615, p < 0.001), with a cutoff value of 204.295, sensitivity of 65.8%, and specificity of 48.7%.
Conclusion: This study revealed a significant association between TyG-BMI and the 10-year incidence of new-onset IS among middle-aged and elderly individuals, indicating that TyG-BMI may serve as a valuable predictive marker for assessing IS risk in this population.
Introduction
Ischemic stroke (IS) is an acute cerebrovascular disorder resulting from insufficient blood supply to the brain, which is characterized by high rates of morbidity, disability, recurrence, and mortality (1). The Global Burden of Disease study has shown that the mortality associated with stroke and its complications has been increasing annually. Since 2015, stroke has become the leading cause of death and disability among middle-aged and elderly individuals in China (2, 3). According to the 2020 Seventh National Population Census of China, approximately 17.8 million people aged 40 and older have experienced a stroke, with an estimated 3.4 million new cases and 2.3 million stroke-related deaths (4). With shifts in diet and lifestyle, the incidence of stroke has been rising, and the disease is increasingly affecting younger populations. While advances in emergency medical care have lowered stroke mortality rates, the resulting neurovascular damage often leads to persistent sequelae such as swallowing difficulties and motor impairments, which significantly reduce the quality of life for patients and impose an additional burden on families and society. Consequently, early identification of high-risk groups for stroke has become more critical than ever (5, 6).
Obesity is a significant global public health issue. Studies have identified obesity as a modifiable risk factor for stroke (7) and have shown that it is strongly associated with an increased risk of atherosclerotic vascular disease (8). Some research has indicated that, after adjusting for known cardiovascular risk factors, body mass index (BMI) is not significantly correlated with stroke risk (8, 9). However, other studies suggest that BMI is an effective predictor of cardiovascular diseases (10).
Insulin resistance (IR) is recognized as one of the significant risk factors for IS. Numerous biomarkers are available for assessing IR, each varying in terms of technical sensitivity, limitations, and complexity. Currently, there are several methods and biomarkers used to evaluate IR in both clinical and research settings, and they differ in sensitivity, limitations, and complexity. The hyperinsulinemic-euglycemic clamp (HIEC) is widely considered the gold standard for assessing IR due to its high accuracy and sensitivity. However, its application in large-scale clinical practice is limited by its technical complexity, invasiveness, and high cost (11). Other indicators based on serum insulin levels, such as the homeostasis model assessment for insulin resistance (HOMA-IR), the oral glucose insulin sensitivity index, and the McAuley index (11, 12), are not suitable for diabetic patients undergoing insulin treatment. Additionally, the difficulty of performing insulin assays in laboratory settings in underdeveloped areas limits the applicability of these indicators in large-scale epidemiological studies. The triglyceride-glucose (TyG) index has been proposed as a simple and reliable alternative for assessing IR (13). Recently, several TyG-derived indices, calculated by multiplying the TyG index with anthropometric measures, have been introduced, and their predictive value for cardiovascular disease (CVD) risk has been explored (14). Stroke, a major type of CVD, is associated with the TyG index, though some study results remain inconsistent.
This study employs a prospective cohort design to investigate the predictive value and optimal cutoff points of the TyG-BMI index for assessing the risk of IS, with the goal of providing scientific evidence for the early prevention and management of IS.
Methods
Study population
The study population was drawn from the China Cardiometabolic Disease and Cancer Cohort (4C) Study, primarily consisting of participants from Luzhou City, Sichuan Province. Between April and November 2011, we recruited 10,150 individuals, all aged 40 years or older. The inclusion criteria were as follows: (1) Residing in the area for at least 5 years; (2) Voluntary participation in follow-up; (3) Age 40 years or older. The exclusion criteria included: (1) History of IS; (2) Age under 40 years; (3) Limited mobility; (4) Refusal to participate in follow-up; (5) Incomplete data. Following thorough screening, 9,406 individuals met the criteria and were included in the study cohort.
Baseline survey
A baseline survey was conducted in 2011, which included the following components: (1) Trained researchers conducted face-to-face interviews to gather information on participants’ gender, age, medical history (including hypertension, diabetes, and stroke), family history of diabetes, and smoking history.(2) Participants’ weight and height were measured before breakfast, followed by the calculation of body mass index (BMI). Seated systolic blood pressure (SBP) and diastolic blood pressure (DBP) were measured every 5 min, with three readings taken. The average of these readings was then calculated. (3) Participants fasted for at least 10 h before undergoing a 75-gram oral glucose tolerance test. Blood samples were collected at baseline (0 h) and 2 h after the test, and stored at −80°C. Blood glucose measurements included glycated hemoglobin A1c (HbA1c), fasting blood glucose (FBG), and 2-h postprandial blood glucose (PBG), all measured using the glucose oxidase method. The lipid profile was assessed by measuring low-density lipoprotein cholesterol (LDL-C), high-density lipoprotein cholesterol (HDL-C), total cholesterol (TC), and triglycerides (TG). Biochemical tests included alanine aminotransferase (ALT), aspartate aminotransferase (AST), gamma-glutamyl transferase (GGT), and creatinine (Crea) levels. All tests were conducted in accordance with the International Organization for Standardization (ISO) 15,189 guidelines in a certified central laboratory (15).
Follow-up survey
A five-year follow-up was conducted in 2016, comprising face-to-face visits, physical examinations, and laboratory tests. For participants who were unable to attend in-person assessments, follow-up was carried out via telephone. In 2021, a 10-year follow-up of the same study population was performed, during which data on chronic disease and mortality were obtained from the Luzhou Municipal Health Bureau and the Luzhou Center for Disease Control and Prevention (15).
Definitions
TyG and TyG-BMI were calculated using the following formulas: (1) BMI = body mass (kg) /height2 (m2) (15); (2) TyG = ln [triglycerides (mg/dL) × glucose (mg/dL) /2] (13); (3) TyG-BMI = TyG × BMI (15).
Statistical analysis
The primary characteristics of the sample were presented using descriptive statistics. Continuous variables were described as either the mean ± standard deviation (SD) or the median (interquartile range, IQR), depending on their distribution. Categorical variables were represented as counts (percentages). Comparisons of continuous variables were conducted using the Student’s t-test, Mann–Whitney U test, Kruskal-Wallis H test, or one-way ANOVA, depending on data normality. Chi-square tests were used for comparisons of categorical variables between groups. Pairwise comparisons among multiple groups were performed using the Bonferroni method. Cumulative incidence was calculated using the Kaplan–Meier method, and the log-rank test was used to compare the cumulative incidence across four groups based on TyG-BMI quartiles. A Cox proportional hazards model was further applied to assess the relationship between TyG-BMI and the 10-year incidence of new IS during non-intervention follow-up. In all statistical analyses, p-values were two-tailed, with significance set at p < 0.05. All analyses were performed using SPSS software (version 26.0).
Results
Baseline characteristics
The study enrolled 9,406 participants, including 3,139 men (33.4%) and 6,267 women (66.6%). During the 10-year non-interventional follow-up period, 483 participants died from various causes, resulting in a mortality rate of 5.1%, while 527 individuals developed new-onset IS, yielding an incidence rate of 5.6%. Baseline characteristics stratified by TyG-BMI quartiles are presented in Table 1. From the lowest (Q1) to the highest (Q4) quartile, there was a gradual increase in age, as well as in the prevalence of prediabetes, diabetes, and hypertension. Similarly, levels of systolic SBP, DBP, body weight, BMI, TG, TC, FPG, 2hPG, HbA1c, ALT, AST, GGT, and creatinine showed significant upward trends (all p < 0.05). Conversely, the proportion of participants with normal glucose metabolism and levels of HDL-C decreased progressively across the quartiles (p < 0.05). Additionally, the incidence of IS, pulse rate, height, and LDL-C varied significantly among the four groups (p < 0.05). In contrast, no significant differences were observed across quartiles in terms of sex distribution, prevalence of myocardial infarction, family history of diabetes, smoking habits, or alcohol consumption (all p > 0.05).
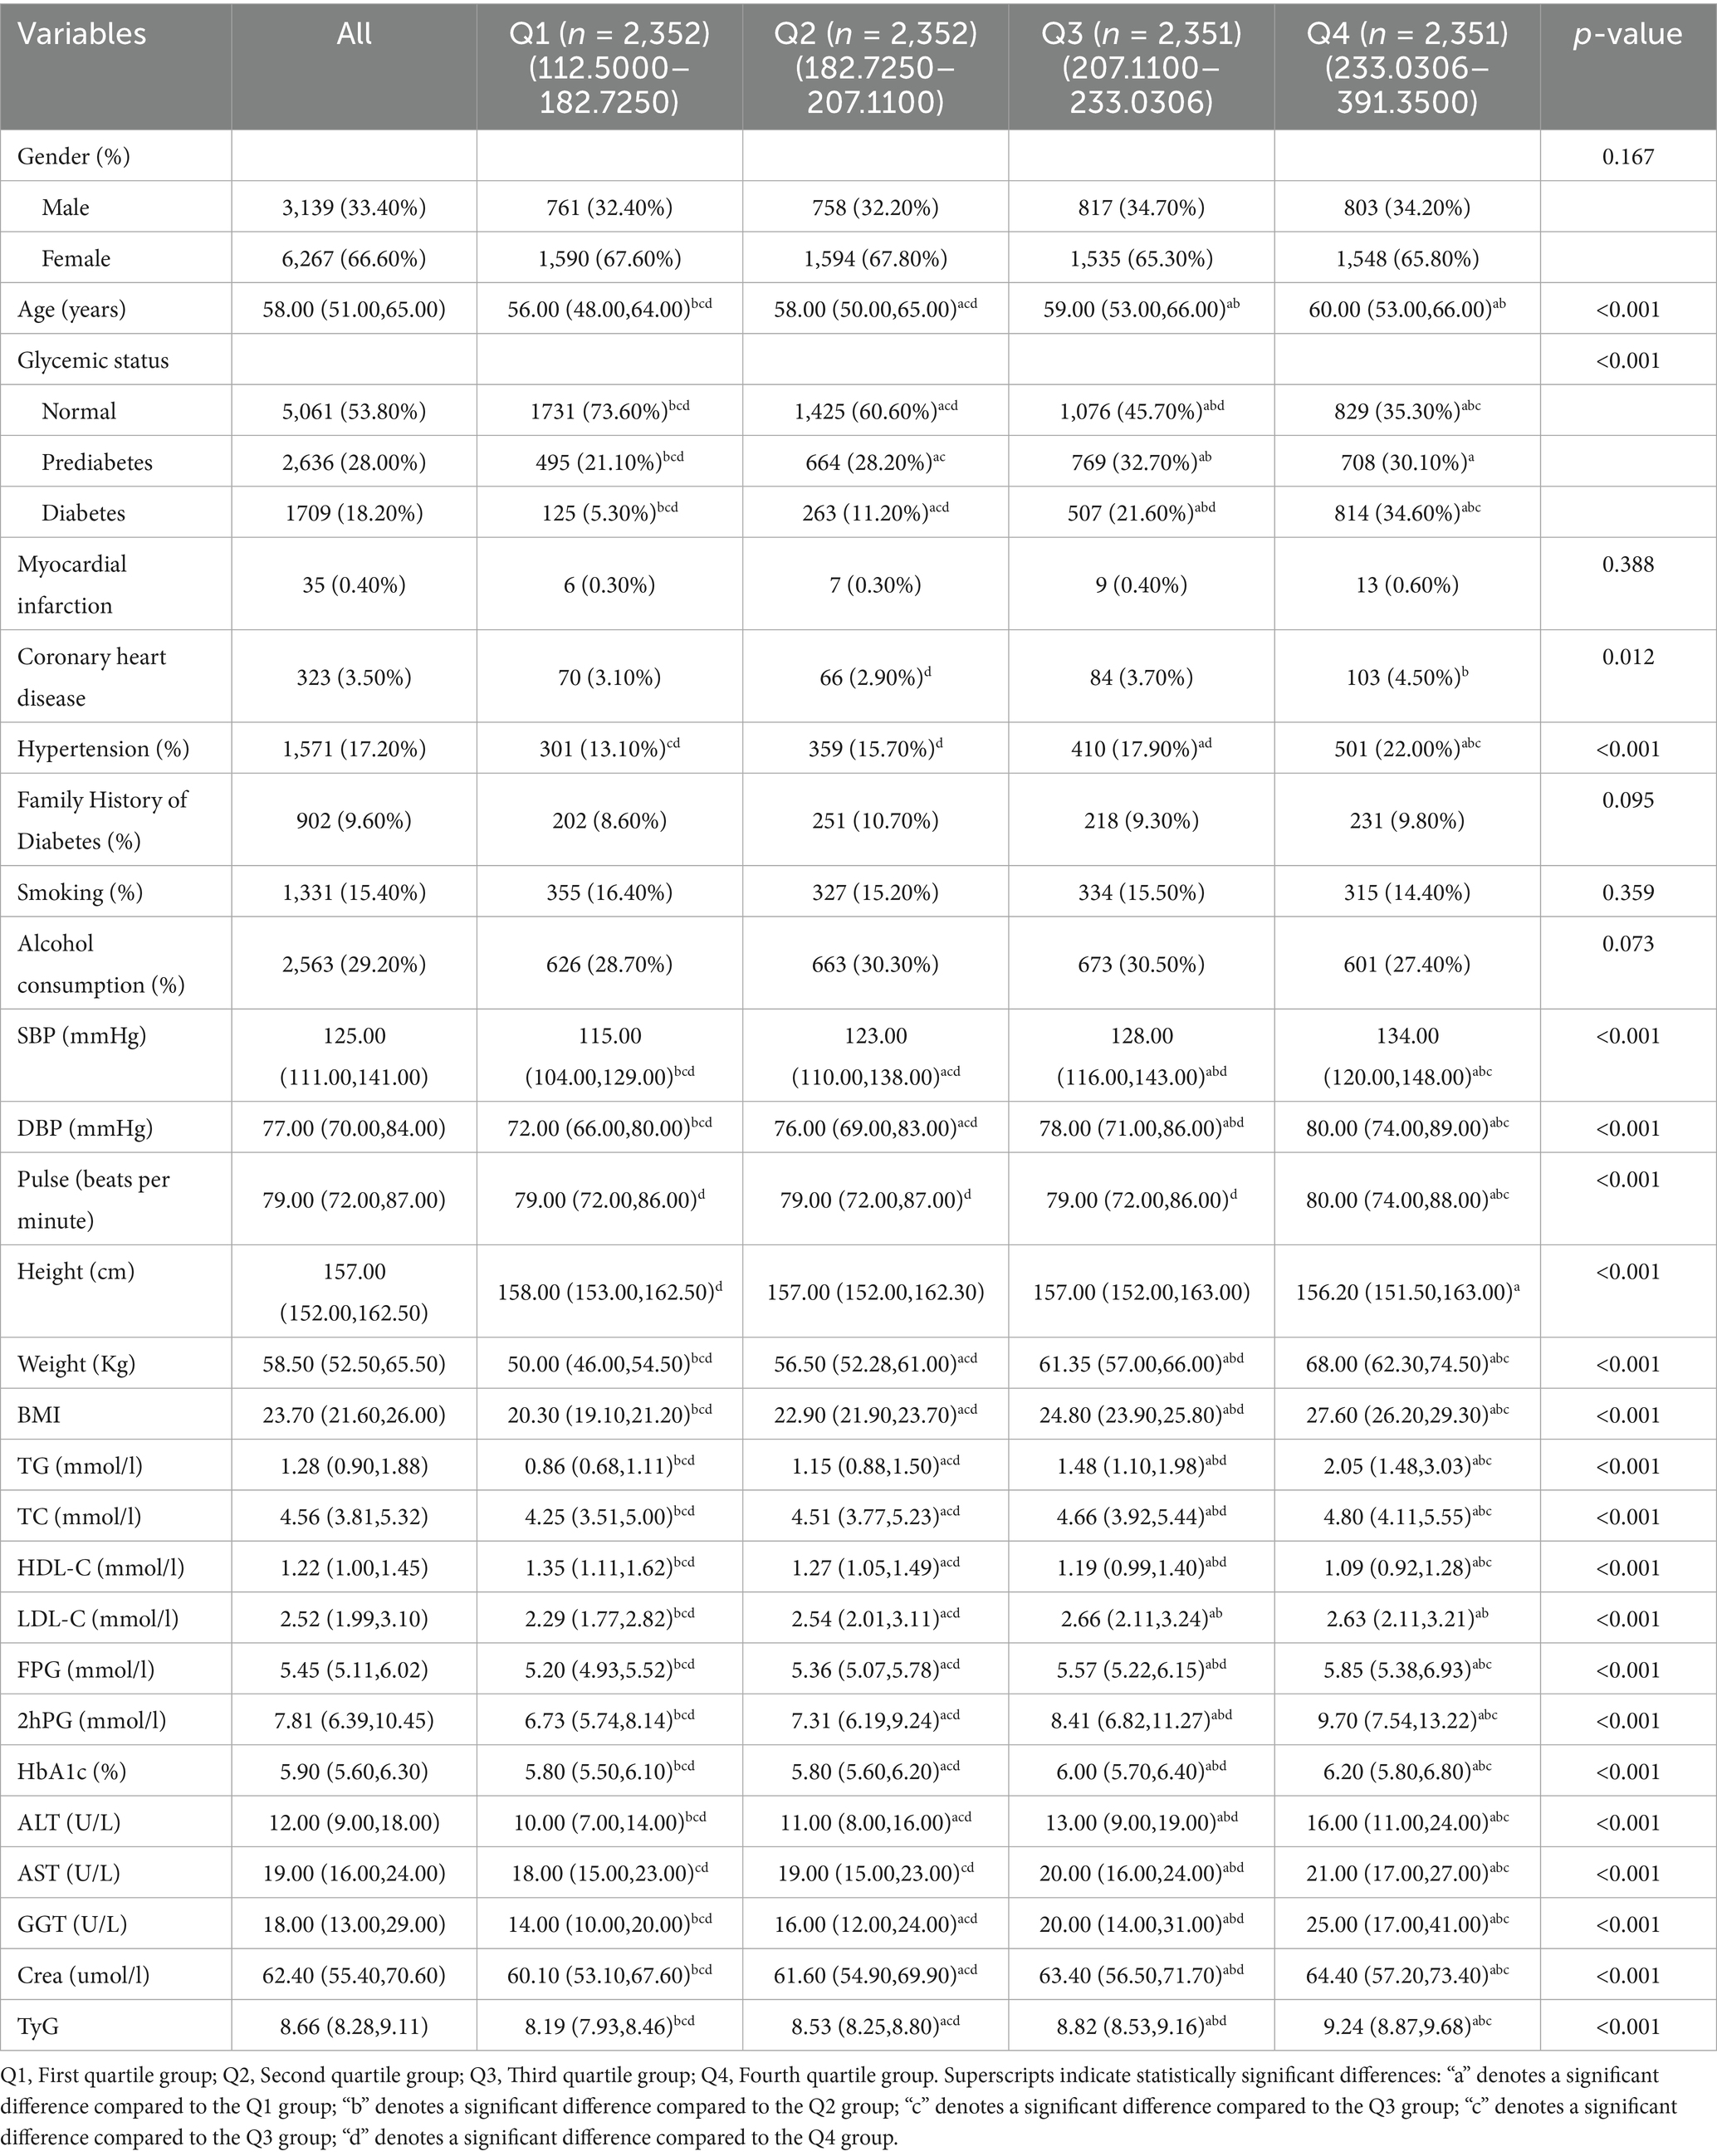
Table 1. Baseline characteristics of study subjects according to TyG-BMI categories.
TyG-BMI and its association with clinical and laboratory variables
Spearman correlation analysis was performed with TyG-BMI as a continuous variable. As shown in Table 2, TyG-BMI was significantly and positively correlated with a range of variables, including age, male sex, coronary heart disease, hypertension, SBP, DBP, pulse rate, body weight, BMI, TG, TC, LDL-C, FPG, 2hPG, HbA1c, ALT, AST, GGT, crea, and the TyG index (all p < 0.05). In contrast, TyG-BMI showed significant negative correlations with height and HDL-C (both p < 0.05).
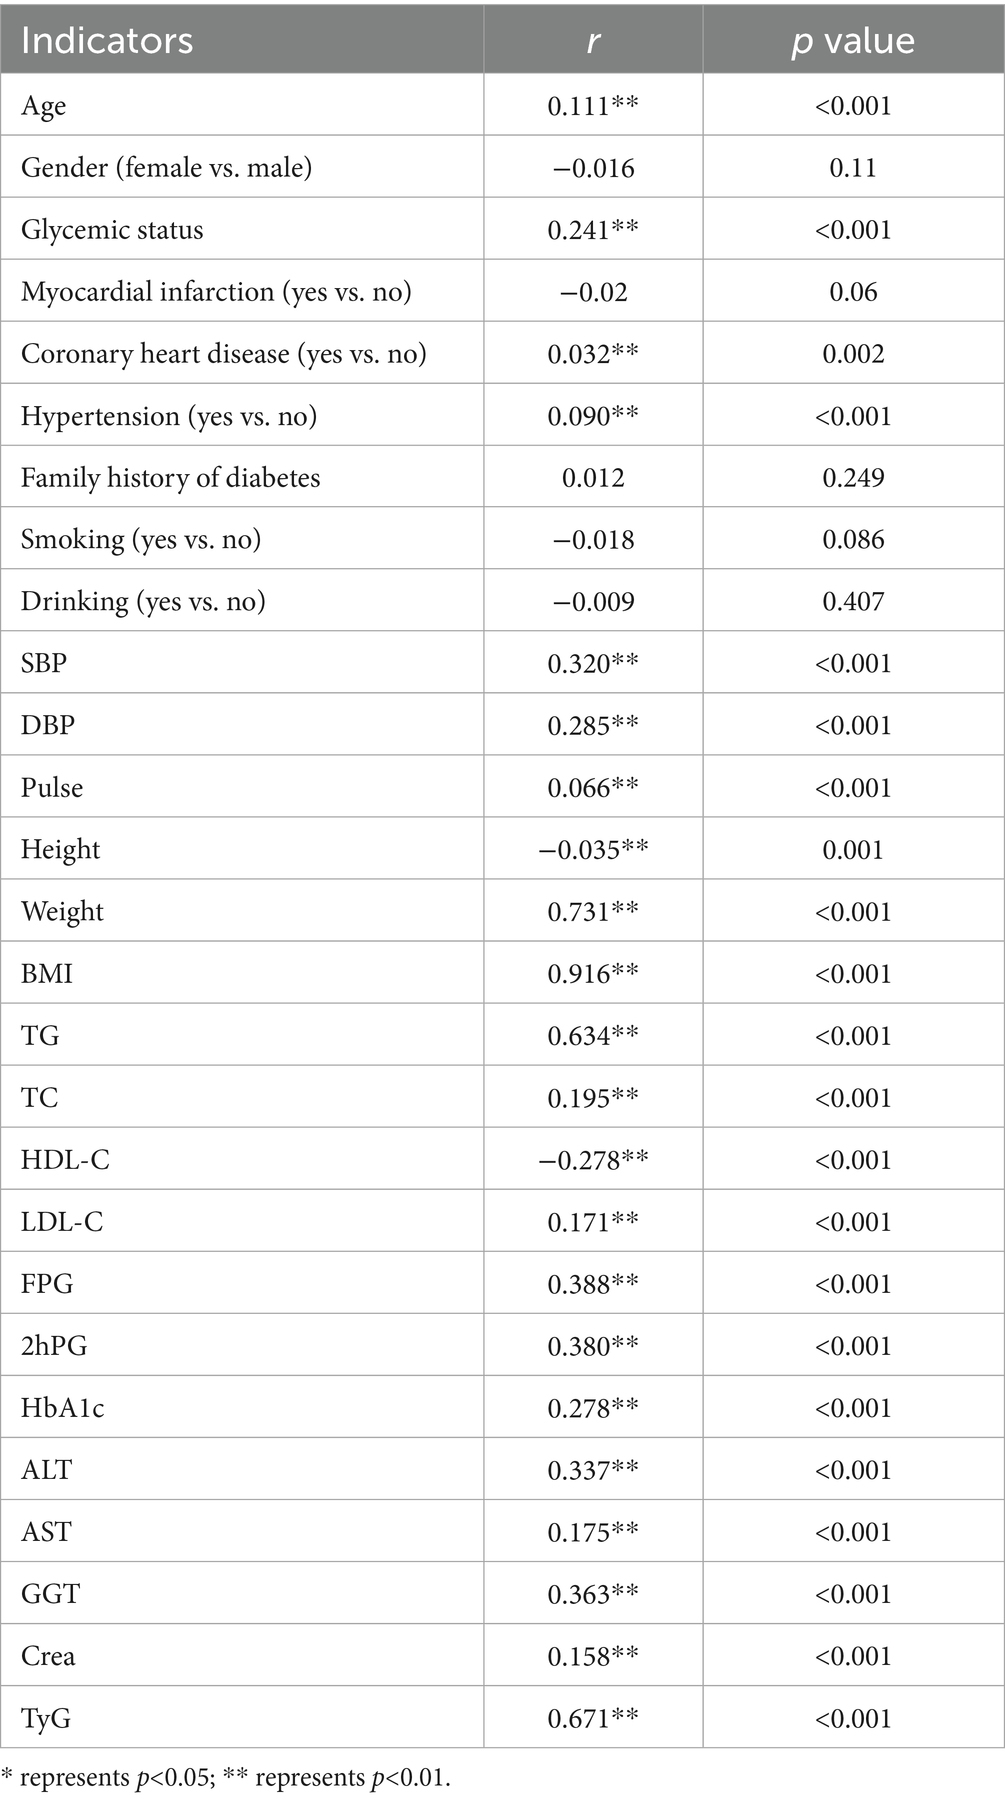
Table 2. TyG-BMI and its association with clinical and laboratory variables.
Log-rank test
Figure 1 illustrates the time-dependent trends in the cumulative incidence of IS across different TyG-BMI quartile groups. The log-rank test (χ2 = 31.545, p < 0.001) revealed significant differences in the cumulative incidence curves among the four groups. Participants in higher TyG-BMI quartiles exhibited a greater cumulative incidence of IS. Moreover, the disparity in incidence rates among the groups became increasingly pronounced over the follow-up period.
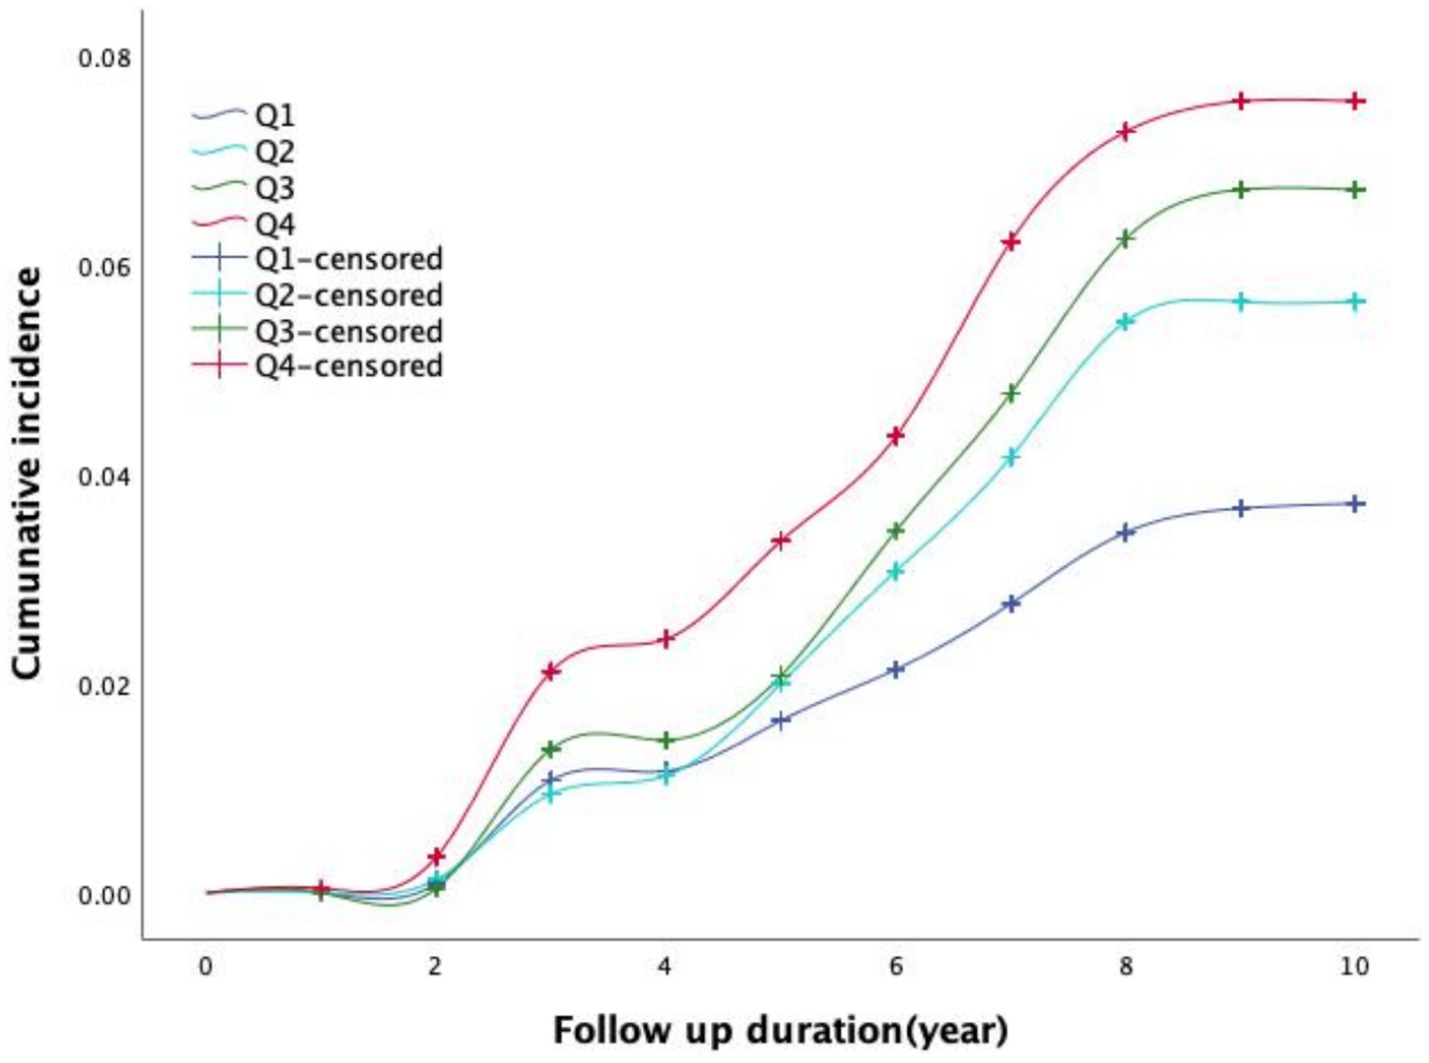
Figure 1. Cumulative incidence of ischemic stroke in different baseline TyG-BMI categories.
Univariate analysis of determinants of IS
Table 3 presents the associations between TyG-BMI and other variables with the risk of developing IS. The univariate analysis identified significant associations between IS and several factors, including gender, age, glycemic status, myocardial infarction, coronary heart disease, hypertension, family history of diabetes, weight, BMI, pulse, TG, HDL-C, ALT, AST, Cre, TyG, and TyG-BMI.
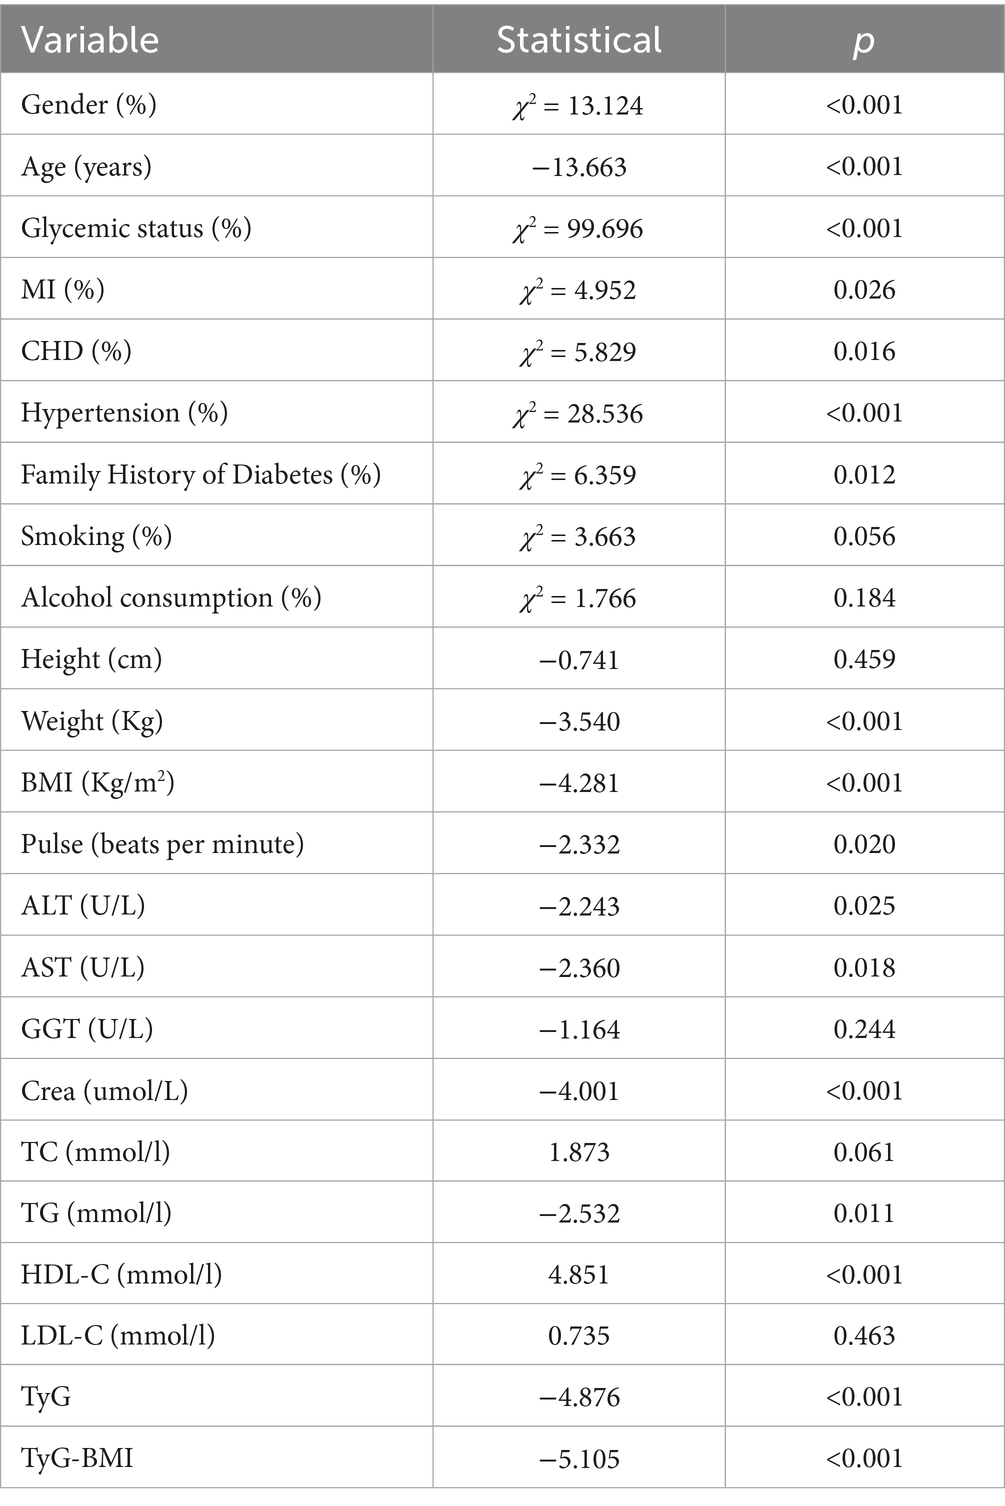
Table 3. Univariate analysis of risk factors for ischemic stroke in study subjects.
Association of TyG-BMI quartiles with the risk of IS
As shown in Table 4 and Figure 2, TyG-BMI was categorized into quartiles and analyzed using the Cox proportional hazards regression model. In Model 1 (unadjusted), individuals in the Q2 group had a 51% increased risk of developing new-onset ischemic stroke (IS) within 10 years compared to those in the Q1 group (HR = 1.51, p = 0.003). Similarly, the Q3 and Q4 groups had 79.2% (HR = 1.792, p < 0.001) and 103.5% (HR = 2.035, p < 0.001) increased risks, respectively. In Model 2, after adjusting for age and sex, the risks remained elevated: 42.1% for the Q2 group (HR = 1.421, p = 0.013), 63.4% for the Q3 group (HR = 1.634, p < 0.001), and 85.2% for the Q4 group (HR = 1.852, p < 0.001). In Model 3, which further adjusted for glucose metabolism status and hypertension, the risk remained significantly higher: 44.9% in the Q2 group (HR = 1.449, p = 0.012), 43.8% in the Q3 group (HR = 1.438, p = 0.014), and 43.4% in the Q4 group (HR = 1.434, p = 0.020), relative to the Q1 group.
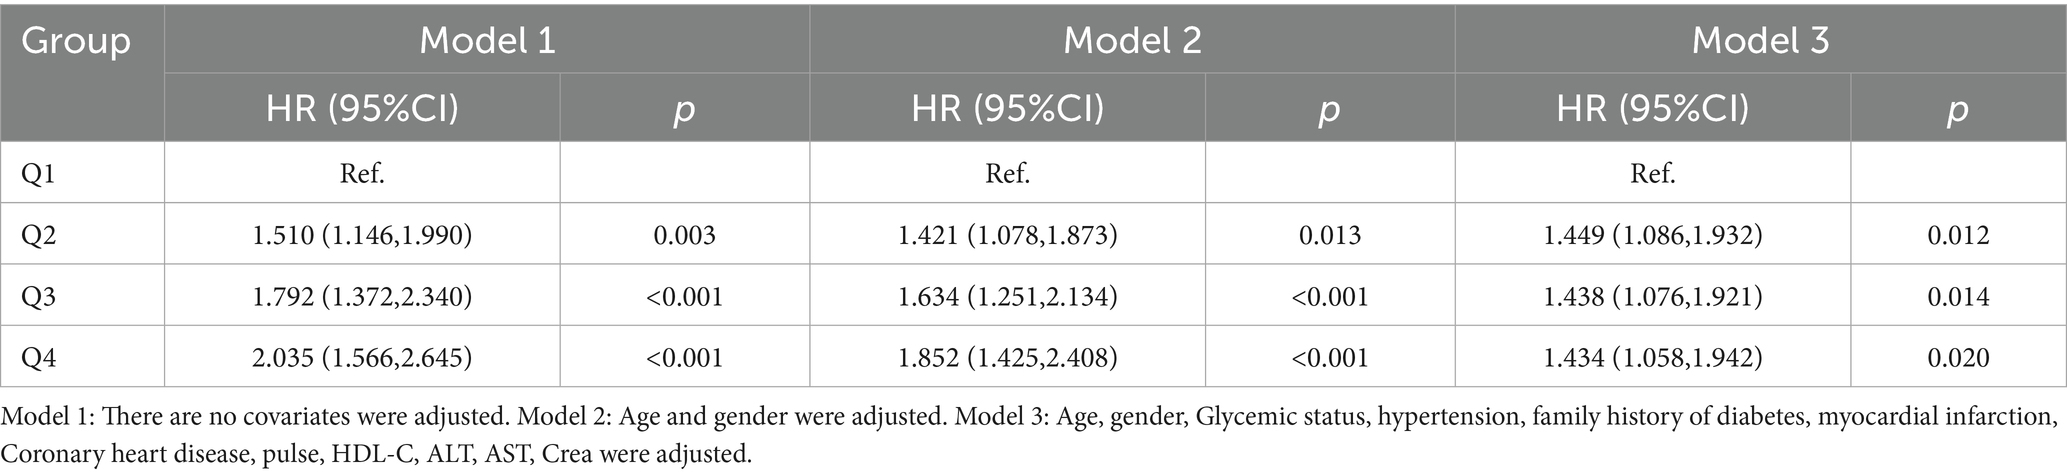
Table 4. Cox proportional hazard regression model for the association between TyG-BMI and the risk of new onset ischemic stroke.
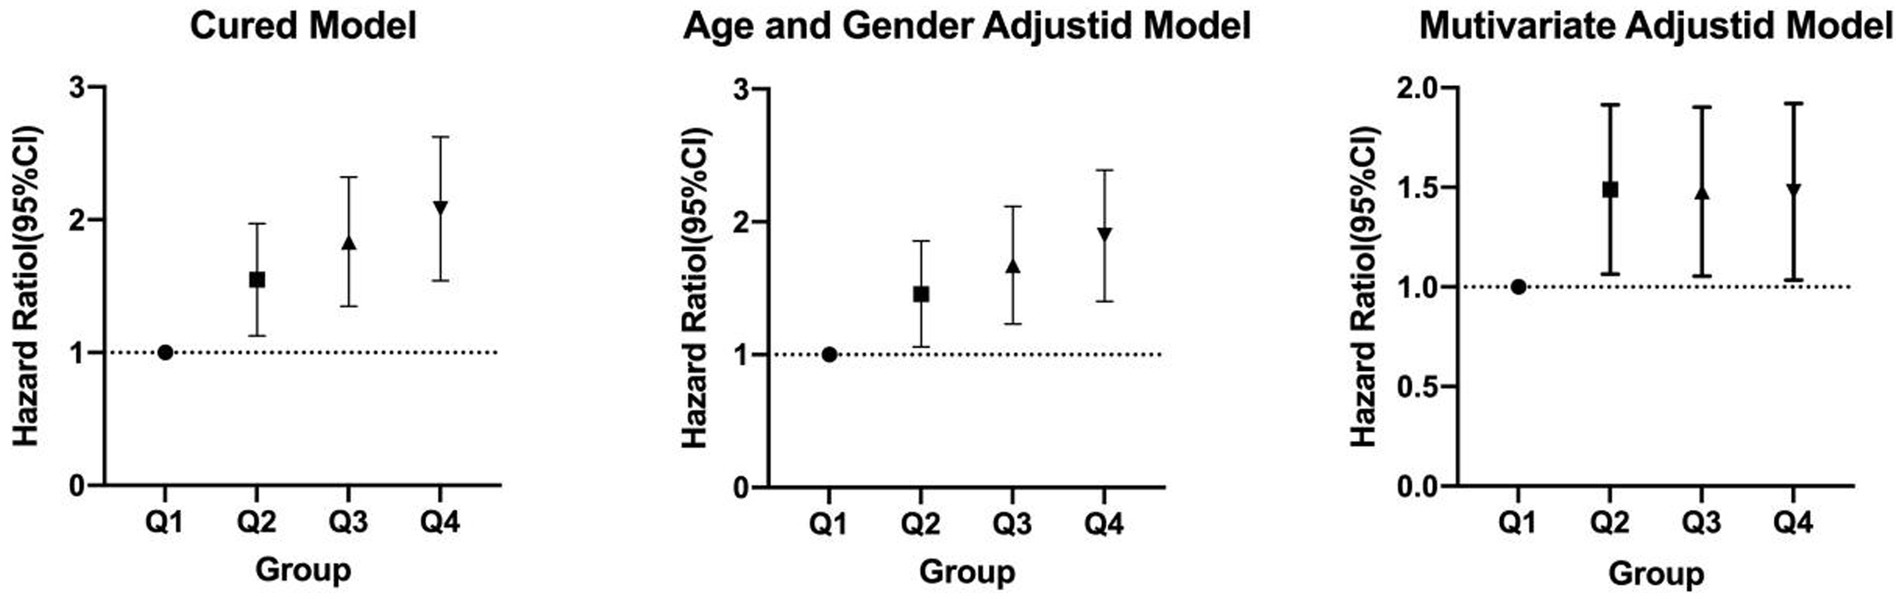
Figure 2. Cox proportional hazards regression analysis of TyG-BMI and the risk of incident ischemic stroke.
The predictive value of TyG-BMI for the 10-year incidence of new-onset IS
To explore the predictive value of TyG-BMI for IS, we analyzed the ROC curves (Figure 3). The results showed that, in the entire study population, TyG-BMI predicted the 10-year incidence of new-onset IS with an AUC of 0.566 (95% CI = 0.542–0.590, p < 0.001), a cutoff value of 204.1307, a sensitivity of 64.3%, and a specificity of 47.8%. Among male participants, TyG-BMI predicted the 10-year incidence of new-onset IS with an AUC of 0.537 (95% CI = 0.501–0.574, p = 0.067), a cutoff value of 195.1996, a sensitivity of 73.8%, and a specificity of 37.0%. In female participants, TyG-BMI predicted the 10-year incidence of new-onset IS with an AUC of 0.583 (95% CI = 0.551–0.615, p < 0.001), a cutoff value of 204.295, a sensitivity of 65.8%, and a specificity of 48.7%.
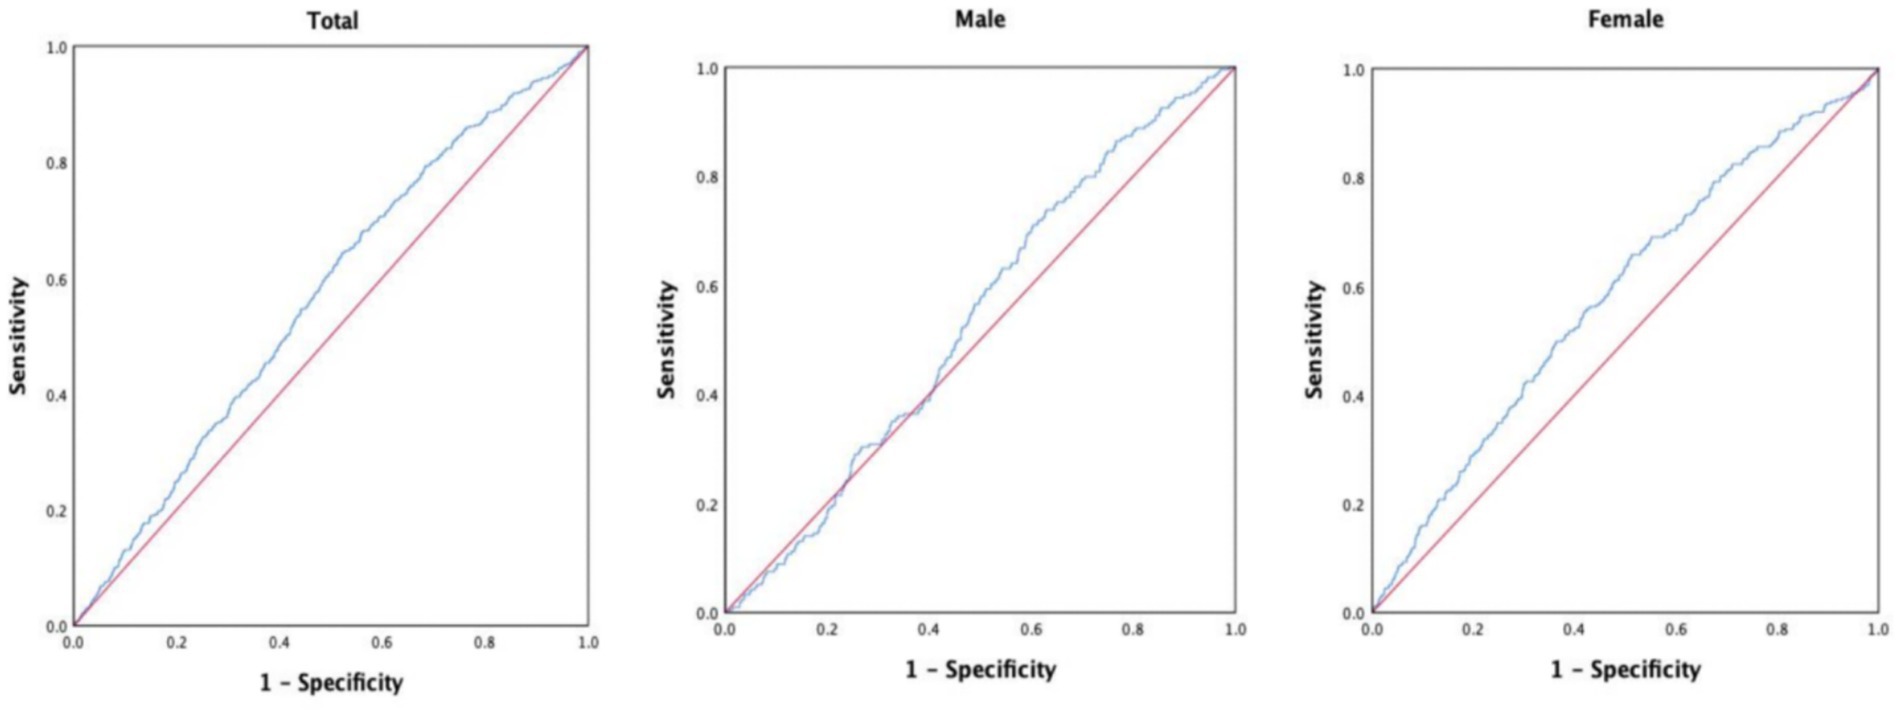
Figure 3. Area under the ROC curve for predicting the occurrence of ischemic stroke.
Discussion
This study is based on epidemiological research methods and established a non-interventional prospective cohort study. Through a follow-up period of up to 10 years, we investigated the incidence of IS among the participants. We aimed to explore the predictive value of TyG-BMI for the 10-year incidence of new-onset IS in the middle-aged and elderly population of Luzhou City. When examining disease risk factors, non-interventional prospective cohort studies offer clear advantages over cross-sectional studies. Through both univariate and multivariate analyses, we assessed the correlation between TyG-BMI and the risk of new-onset IS in the elderly population of Luzhou City with over 10 years of follow-up. Specifically, the correlation between TyG-BMI and new-onset IS was found to be strong, with the cumulative incidence of IS significantly increasing across TyG-BMI quartiles. Both univariate and multivariate analyses revealed a significant correlation between TyG-BMI and new-onset IS. ROC curve analysis demonstrated that the cutoff value of TyG-BMI for predicting 10-year new-onset IS in the entire study population was 204.1307 long-term predictor of IS in middle-aged and older adults, adding to the growing body of literature on insulin resistance-related indices and cerebrovascular risk. Previous cohort studies, such as one based on data from the UK Biobank, have demonstrated a progressive increase in stroke risk across ascending quartiles of TyG, TyG-BMI, and TyG-WC, reinforcing the potential value of these indices in stratifying cardiovascular and cerebrovascular risk over time (16). Furthermore, cross-sectional evidence from the China Health and Retirement Longitudinal Study (CHARLS) also supports this association. That study revealed that both TyG and TyG-BMI were significantly associated with elevated stroke risk, with adjusted odds ratios (ORs) ranging from 1.186 to 1.246 and consistent 95% confidence intervals, suggesting a robust link even after adjustment for multiple confounders (17). In addition to general population data, the predictive value of TyG-BMI has been corroborated in critically ill patients. A study utilizing the eICU database found that individuals in the high TyG-BMI group experienced significantly higher 28-day hospital and ICU mortality following ischemic stroke (HR = 1.734, p = 0.032 for hospital mortality; HR = 2.337, p = 0.048 for ICU mortality), highlighting the prognostic relevance of TyG-BMI even in acute clinical settings (18). Together, these findings support the consistency and generalizability of our results across different populations and study designs. Our study extends the current knowledge by providing prospective, 10-year follow-up data from a large Chinese cohort, further substantiating the TyG-BMI index as a simple yet powerful tool for long-term stroke risk prediction. Future research should continue to explore the biological mechanisms underlying these associations and assess whether TyG-BMI can serve as a modifiable risk marker in clinical practice.
IR is characterized by a reduced sensitivity to insulin, leading to compensatory increases in insulin secretion (19). This metabolic disorder affects the cerebrovascular system through various mechanisms, thereby increasing the risk of IS (19). Under normal conditions, insulin promotes vasodilation by stimulating the synthesis of nitric oxide (NO) (20). However, in the IR state, this signaling pathway is impaired, resulting in reduced bioavailability of NO, which in turn leads to vasoconstriction, inflammatory responses, and thrombosis. Furthermore, IR can upregulate the expression of cell adhesion molecules, facilitating the adhesion and migration of white blood cells, thus further accelerating the development of (21, 22). In individuals with IR, elevated levels of plasminogen activator inhibitor-1 (PAI-1) inhibit fibrinolysis, increasing the likelihood of (23, 24). Additionally, IR promotes platelet aggregation, further enhancing the risk of arterial occlusion (25). IR is often accompanied by increased levels of TG, low HDL-C, and small, dense low-density lipoprotein (LDL) particles (26), all of which contribute to the accelerated formation of atherosclerotic plaques and elevate the risk of cerebrovascular events.
The TyG index, calculated from fasting TG and blood glucose, serves as a reliable alternative for assessing insulin resistance. BMI reflects an individual’s body fat level, and when combined with the TyG index to form TyG-BMI, it provides a more comprehensive assessment of metabolic risk. Studies have shown that TyG-BMI more accurately reflects insulin resistance than either the TyG index or BMI alone and is closely associated with the risk of IS. A study targeting middle-aged and elderly populations found that higher TyG-BMI levels were significantly associated with an increased incidence of stroke, with this association remaining significant even after adjusting for traditional risk factors (27). Research has shown that patients with acute ISand higher TyG-BMI levels may have better short-term prognoses than those with lower TyG-BMI levels, potentially due to the “obesity paradox, “where moderate overweight may provide metabolic reserves that improve post-stroke recovery (28).
TyG-BMI is strongly associated with an increased risk of IS. The underlying biological mechanisms may involve IR, which contributes to endothelial dysfunction and dyslipidemia. These alterations promote the formation of plaques in the carotid and cerebral arteries and increase plaque instability, ultimately leading to ischemic events. In addition, IR may impair cerebral autoregulation, reducing the brain’s ability to maintain stable perfusion during fluctuations in blood flow, thereby elevating the risk of cerebral ischemia. IR is also closely linked to chronic low-grade inflammation. Elevated levels of inflammatory mediators, such as TNF-α and IL-6, further damage endothelial function and accelerate the progression of atherosclerosis (29).
From a clinical perspective, these findings suggest that TyG-BMI should be incorporated into the risk assessment system for ISto more effectively identify high-risk populations. For individuals with higher TyG-BMI, measures to improve insulin sensitivity, such as healthy eating, regular exercise, weight loss, and pharmacological interventions, may be key strategies to reduce stroke incidence.
This study found that elevated TyG-BMI levels are closely associated with an increased risk of IS over the next 10 years. This finding further supports the critical role of IR in the onset and progression of IS. By examining the relationship between IR, metabolic disturbances, and cerebrovascular events, the study underscores the importance of incorporating TyG-BMI into comprehensive stroke risk assessments and prevention strategies.
Limitations
This study has several limitations that should be acknowledged. First, the identification of IS events was based on data from the chronic disease management system of the Health Commission and the Center for Disease Control, which may have led to underreporting or misclassification in a small number of cases. Future investigations should consider incorporating in-person follow-up assessments, where feasible, to enhance the completeness and accuracy of outcome data. Second, the extended follow-up period of 10 years introduces potential confounding factors, including the development of comorbidities, initiation or modification of pharmacological treatments, and substantial lifestyle changes over time. While these factors are largely unavoidable in long-term observational studies, they may have influenced the observed associations. Nonetheless, such real-world variability reflects clinical practice and does not substantially detract from the generalizability or interpretability of the findings.
Conclusion
This study revealed a significant association between TyG-BMI and the 10-year incidence of new-onset IS among middle-aged and elderly individuals, indicating that TyG-BMI may serve as a valuable predictive marker for assessing IS risk in this population.
Data availability statement
The raw data supporting the conclusions of this article will be made available by the authors, without undue reservation.
Ethics statement
The studies involving humans were approved by the Research Ethics Committees of Rui-Jin Hospital affiliated with the Jiao-Tong University School of Medicine and the Affiliated Hospital of Southwest Medical University. The studies were conducted in accordance with the local legislation and institutional requirements. The participants provided their written informed consent to participate in this study.
Author contributions
YM: Conceptualization, Writing – review & editing, Investigation, Methodology, Writing – original draft, Visualization. YW: Methodology, Writing – original draft. YH: Writing – original draft, Investigation. PY: Methodology, Writing – original draft. QW: Investigation, Funding acquisition, Conceptualization, Writing – review & editing, Methodology.
Funding
The author(s) declare that financial support was received for the research and/or publication of this article. This study received funding from the 2019SQN013 project at Southwest Medical University. This study received funding from the 2024-YXXM-011 project at Luzhou Medical Association; the Science and Technology Department of Sichuan Province (2024NSFSC0579); the Luzhou Science and Technology Bureau (2024JYJ038); the Health Commission of Sichuan Province, Promotion and Application (2023–1501); Sichuan Provincial Science and Technology Plan Joint Innovation Special Project 2022 (2022YFS0612-B2); the Sichuan Provincial Health Commission Science and Technology Project (Clinical Research Project; 23LCYJ026); and the Health Commission of Chengdu (2021407).
Acknowledgments
Thanks to all the workers who participated in the study.
Conflict of interest
The authors declare that the research was conducted in the absence of any commercial or financial relationships that could be construed as a potential conflict of interest.
Generative AI statement
The author(s) declare that no Gen AI was used in the creation of this manuscript.
Publisher’s note
All claims expressed in this article are solely those of the authors and do not necessarily represent those of their affiliated organizations, or those of the publisher, the editors and the reviewers. Any product that may be evaluated in this article, or claim that may be made by its manufacturer, is not guaranteed or endorsed by the publisher.
References
1. Virani, SS, Alonso, A, Benjamin, EJ, Bittencourt, MS, Callaway, CW, Carson, AP, et al. Heart disease and stroke Statistics-2020 update: a report from the American Heart Association. Circulation. (2020) 141:e139–596. doi: 10.1161/CIR.0000000000000757
2. Zhao, H, Lu, S, Jie, Y, Chao, W, Zhu, W, and Huang, D. Comprehensive analysis of the ischemic stroke burden at global, regional, and national levels (1990-2021): trends, influencing factors, and future projections. Front Neurol. (2025) 16:1492691. doi: 10.3389/fneur.2025.1492691
3. Wang, Z, Liu, Y, Qie, R, and Hu, Y. Comparative analysis of stroke burden between ages 20-54 and over 55 years: based on the global burden of disease study 2019. BMC Public Health. (2025) 25:1293. doi: 10.1186/s12889-025-22460-6
4. Tu, WJ, and Wang, LD. China stroke surveillance report 2021. Mil Med Res. (2023) 10:33. doi: 10.1186/s40779-023-00463-x
5. Cui, Y, Ma, N, and Liu, X. Progress in the clinical application of constraint-induced therapy following stroke since 2014. Front Neurol. (2023) 14:1170420. doi: 10.3389/fneur.2023.1170420
6. Chen, L, Gao, H, Wang, Z, Gu, B, Zhou, W, Pang, M, et al. Vagus nerve electrical stimulation in the recovery of upper limb motor functional impairment after ischemic stroke. Cogn Neurodyn. (2024) 18:3107–24. doi: 10.1007/s11571-024-10143-8
7. Guo, Y, Yue, XJ, Li, HH, Song, ZX, Yan, HQ, Zhang, P, et al. Overweight and obesity in young adulthood and the risk of stroke: a Meta-analysis. J Stroke Cerebrovasc Dis. (2016) 25:2995–3004. doi: 10.1016/j.jstrokecerebrovasdis.2016.08.018
8. Wormser, D, Kaptoge, S, Di Angelantonio, E, Wood, AM, Pennells, L, Thompson, A, et al. Separate and combined associations of body-mass index and abdominal adiposity with cardiovascular disease: collaborative analysis of 58 prospective studies. Lancet. (2011) 377:1085–95. doi: 10.1016/S0140-6736(11)60105-0
9. Abell, JE, Egan, BM, Wilson, PW, Wilson, PWF, Lipsitz, S, Woolson, RF, et al. Differences in cardiovascular disease mortality associated with body mass between black and white persons. Am J Public Health. (2008) 98:63–6. doi: 10.2105/AJPH.2006.093781
10. Wang, K, Li, Y, Ye, W, Chen, B, Zeng, J, and Xu, S. Predictive ability of traditional and novel anthropometric measurement indices for cardio-metabolic diseases in Chinese adults: China health and nutrition survey (CHNS) cohort study. Nutr Metab Cardiovasc Dis. (2023) 33:737–48. doi: 10.1016/j.numecd.2022.12.025
11. Miao, Y, Wang, Y, Wang, Y, Yan, P, Chen, Z, and Wan, Q. The association between triglyceride-glucose index and its combination with obesity indicators and lower extremity peripheral artery disease in patients with type 2 diabetes mellitus: a cross-sectional study. Diabetes Metab Syndr Obes. (2024) 17:2607–17. doi: 10.2147/DMSO.S469692
12. Li, M, Chi, X, Wang, Y, Setrerrahmane, S, Xie, W, and Xu, H. Trends in insulin resistance: insights into mechanisms and therapeutic strategy. Signal Transduct Target Ther. (2022) 7:216. doi: 10.1038/s41392-022-01073-0
13. Simental-Mendía, LE, Rodríguez-Morán, M, and Guerrero-Romero, F. The product of fasting glucose and triglycerides as surrogate for identifying insulin resistance in apparently healthy subjects. Metab Syndr Relat Disord. (2008) 6:299–304. doi: 10.1089/met.2008.0034
14. Tao, LC, Xu, JN, Wang, TT, Hua, F, and Li, JJ. Triglyceride-glucose index as a marker in cardiovascular diseases: landscape and limitations. Cardiovasc Diabetol. (2022) 21:68. doi: 10.1186/s12933-022-01511-x
15. Miao, Y, Wang, Y, and Wan, Q. Association between TyG index with obesity indicators and coronary heart disease: a cohort study. Sci Rep. (2025) 15:8920. doi: 10.1038/s41598-025-93922-5
16. Bian, K, Hou, C, Jin, H, Feng, X, Peng, M, Zhao, X, et al. Association between triglyceride-glucose indices and ischemic stroke risk across different glucose metabolism statuses. Diabetes Res Clin Pract. (2025) 222:112064. doi: 10.1016/j.diabres.2025.112064
17. Jiang, L, Zhu, T, Song, W, Zhai, Y, Tang, Y, Ruan, F, et al. Assessment of six insulin resistance surrogate indexes for predicting stroke incidence in Chinese middle-aged and elderly populations with abnormal glucose metabolism: a nationwide prospective cohort study. Cardiovasc Diabetol. (2025) 24:56. doi: 10.1186/s12933-025-02618-7
18. Ouyang, Q, Xu, L, and Yu, M. Associations of triglyceride glucose-body mass index with short-term mortality in critically ill patients with ischemic stroke. Cardiovasc Diabetol. (2025) 24:91. doi: 10.1186/s12933-025-02583-1
19. Nam, KW, Kwon, HM, and Lee, YS. Effect of atherogenic index of plasma and triglyceride-glucose index on early neurological deterioration of patients with large artery atherosclerotic ischemic stroke. Diabetol Metab Syndr. (2025) 17:123. doi: 10.1186/s13098-025-01684-x
20. Zhang, YY, Li, YJ, Hu, XQ, Xue, CD, Li, S, Gao, ZN, et al. Unveiling the negative synergistic effect of wall shear stress and insulin on endothelial NO dynamics by mathematical modeling. Bull Math Biol. (2025) 87:46. doi: 10.1007/s11538-025-01424-2
21. Tan, J, Li, X, and Dou, N. Insulin resistance triggers atherosclerosis: Caveolin 1 cooperates with PKCzeta to block insulin signaling in vascular endothelial cells. Cardiovasc Drugs Ther. (2024) 38:885–93. doi: 10.1007/s10557-023-07477-6
22. Liu, Z, Lu, J, Sha, W, and Lei, T. Comprehensive treatment of diabetic endothelial dysfunction based on pathophysiological mechanism. Front Med (Lausanne). (2025) 12:1509884. doi: 10.3389/fmed.2025.1509884
23. Yu, Y, Li, W, Xu, L, and Wang, Y. Circadian rhythm of plasminogen activator inhibitor-1 and cardiovascular complications in type 2 diabetes. Front Endocrinol (Lausanne). (2023) 14:1124353. doi: 10.3389/fendo.2023.1124353
24. Lin, M, Wang, L, Guan, B, Tang, S, Lin, L, Wu, K, et al. Effect of PAI-1 inhibitor on pancreatic islet function and hepatic insulin resistance in db/db mice. Biochem Pharmacol. (2025) 237:116906. doi: 10.1016/j.bcp.2025.116906
25. Qu, J, Wu, D, Ko, CW, Zhu, Q, Liu, M, and Tso, P. Deficiency of apo A-IV in female 129X1/SvJ mice leads to diet-induced obesity, insulin resistance, and decreased energy expenditure. Nutrients. (2023) 15:4655. doi: 10.3390/nu15214655
26. Jiang, L, Xu, L, Lu, Y, and Xu, X. The correlation between insulin resistance and blood lipids in children. J Med Biochem. (2024) 43:860–9. doi: 10.5937/jomb0-48461
27. Du, Z, Xing, L, and Lin, M. Estimate of prevalent ischemic stroke from triglyceride glucose-body mass index in the general population. BMC Cardiovasc Disord. (2020) 20:483. doi: 10.1186/s12872-020-01768-8
28. Yu, XR, Du, JL, and Jiang, M. Correlation of TyG-BMI and TyG-WC with severity and short-term outcome in new-onset acute ischemic stroke. Front Endocrinol (Lausanne). (2024) 15:1327903. doi: 10.3389/fendo.2024.1327903
Keywords: triglyceride-glucose index, body mass index, TyG-BMI, ischemic stroke, insulin resistance
Citation: Miao Y, Wang Y, He Y, Yan P and Wan Q (2025) TyG-BMI as a predictor of ischemic stroke over 10 years in middle-aged and older adults: findings from the China cardiometabolic disease and cancer cohort (4C) study. Front. Neurol. 16:1609853. doi: 10.3389/fneur.2025.1609853
Edited by:
Yun Shen, Pennington Biomedical Research Center, United StatesReviewed by:
Amir Moghadam Ahmadi, Thomas Jefferson University, United StatesChunyi Zhang, University of Texas MD Anderson Cancer Center, United States
Copyright © 2025 Miao, Wang, He, Yan and Wan. This is an open-access article distributed under the terms of the Creative Commons Attribution License (CC BY). The use, distribution or reproduction in other forums is permitted, provided the original author(s) and the copyright owner(s) are credited and that the original publication in this journal is cited, in accordance with accepted academic practice. No use, distribution or reproduction is permitted which does not comply with these terms.
*Correspondence: Qin Wan, d2FucWluM0AxMjYuY29t