 Federica Graziola1*
 Federica Rachele Danti1
 Martina Penzo2
 Antonio Spagarino3
 Eleonora Minacapilli2
 Marco Moscatelli4
 Federica Zibordi1
 Caterina Mariotti5
 Giovanna Zorzi1,2
- 1Department of Pediatric Neuroscience, Fondazione IRCCS Istituto Neurologico Carlo Besta, Milan, Italy
- 2Department of Biomedical and Clinical Sciences, Postgraduate School of Child Neuropsychiatry, University of Milan, Milan, Italy
- 3Pediatric Section, Department of Medical Sciences, University of Ferrara, Ferrara, Italy
- 4Neuroradiology Unit, Fondazione IRCCS Istituto Neurologico Carlo Besta, Milan, Italy
- 5Medical Genetics and Neurogenetics Unit, Fondazione IRCCS Istituto Neurologico Carlo Besta, Milan, Italy
Background: Pediatric Huntington’s disease (PHD), a rare and severe form of juvenile-onset Huntington’s disease (JOHD), is associated with highly expanded CAG repeats in the HTT gene and a rapidly progressive neurodegenerative course. Recent studies have suggested that glucose metabolism may be impaired in PHD due to reduced expression of glucose transporters in the brain, resembling aspects of GLUT1 Deficiency Syndrome (GLUT1DS).
Methods: We investigated glucose metabolism in two pediatric patients with genetically confirmed PHD (CAG repeats: 76 and 79) referred to our tertiary care center. Clinical, neuroimaging, and neuropsychological data were collected alongside metabolic assessments, including cerebrospinal fluid (CSF) and plasma glucose and lactate levels, CSF-to-serum glucose ratio, and red blood cell GLUT1 expression using the METAglut1 test. 18F-FDG PET imaging and brain MRI were performed to assess cerebral metabolism and structural changes.
Results: Both patients exhibited progressive motor and cognitive decline with dystonia-parkinsonian features, learning disabilities, and behavioral disturbances. Brain MRI showed caudate and putaminal atrophy, while PET imaging demonstrated severely reduced glucose uptake in the basal ganglia. CSF/plasma glucose ratios were within or near the lower end of the normal range (0.51 and 0.6), and GLUT1 expression in red blood cells was within normal limits. No significant biochemical alterations consistent with GLUT1DS were detected.
Conclusion: Our findings confirm localized cerebral hypometabolism in the basal ganglia of PHD patients, consistent with previous neuropathological reports. However, systemic biochemical indicators of glucose transport deficiency, including erythrocyte GLUT1 function and CSF glucose, were not significantly altered. While glucose dysregulation appears to be a feature of PHD brain pathology, our results do not support the use of metabolic interventions such as the ketogenic diet in the absence of confirmed GLUT1 dysfunction. Further studies in larger cohorts are warranted to better characterize the metabolic profile of PHD and guide therapeutic strategies.
1 Introduction
Huntington’s disease (HD) is an autosomal dominant neurodegenerative disorder caused by an unstable expansion of CAG repeats in the HTT gene, leading to an elongated polyglutamine tract in the Huntingtin protein. Larger CAG expansions correlate with earlier onset of symptoms. Typically, adult-onset HD presents around the age of 40, and is characterized by neurological, behavioral, and cognitive decline, along with involuntary movements such as chorea (1).
When HD manifests before the age of 21 years, it is classified as juvenile-onset HD (JOHD), with the subset of cases occurring in younger children referred to as pediatric Huntington disease (PHD). JOHD represents 5–10% of all HD cases, but the exact prevalence of PHD remains uncertain (2). Severe forms of PHD, particularly in children with over 70–80 CAG repeats, are associated with rapid progression, reduced lifespan, motor and developmental delays, severe dystonia (without chorea), learning difficulties, seizures, and atypical brain abnormalities (2, 3). Behavioral issues such as hyperactivity and aggression further complicate the clinical spectrum of JOHD and PHD (4).
Recent research by Tramutola et al. (5) have identified a dysfunctional hypometabolic state in PHD brains with highly expanded CAG repeats. By analyzing the expression of Glucose Transporter 1 (GLUT1) and Glucose Transporter 3 (GLUT3) proteins in PHD, JOHD, and adult-onset HD patients compared to controls, they observed a significant reduction in GLUT1 and GLUT3 levels in the frontal cortex and fibroblasts of PHD patients with highly expanded mutations. GLUT1 and GLUT3 are uniporter proteins encoded by the SLC2A1 and SLC2A3 (solute carrier family 2, facilitated glucose transporter member 1 and 3) genes, respectively. These transporters facilitate glucose transport across the plasma membranes of mammalian cells. The findings align with evidence of mitochondrial dysfunction in HD (6), supporting the hypothesis of impaired energy metabolism in these patients.
In particular, deficits in electron transport chain activity, reduced oxidative phosphorylation capacity, and impaired tricarboxylic acid (TCA) cycle function have been observed (7, 8). These findings align with functional neuroimaging studies in HD patients showing early and progressive cerebral hypometabolism, even in pre-symptomatic stages, accompanied by increased lactate levels and ATP depletion in both brain and peripheral tissues (9). Mechanistically, mutant huntingtin impairs mitochondrial function through downregulation of PGC-1α, a transcriptional coactivator critical for controlling mitochondrial biogenesis, respiration, and other metabolic pathways (10).
Interestingly, the metabolic abnormalities observed in PHD mirror those seen in GLUT1 Deficiency Syndrome (GLUT1DS), a rare neurological disorder caused by mutations in the SLC2A1 gene. GLUT1DS is characterized by seizures, developmental delays, motor impairments, and movement disorders. Its treatment relies on the ketogenic diet (KD), a high-fat, low-carbohydrate diet that induces ketosis, providing an alternative energy source to glucose (5, 11).
2 Methods
We present two patients referring to the Department of Pediatric Neuroscience of the Istituto Neurologico Carlo Besta, Milan with highly expanded CAG repeats in the HTT gene and a diagnosis of PHD. Molecular analysis was performed on DNA sample extracted from peripheral blood by using the Amplidex PCR/CE HTT kit (Asuragen®). The number of triplets was determined by electrophoresis on an ABI-PRISM 3500 XL DX capillary sequencer.
Clinical data were gathered through detailed medical and family histories, comprehensive neurological examinations, and neuropsychological testing. The clinical assessments included the Unified Huntington’s Disease Rating Scale Total Motor Scale (UHDRS-TMS). The Instrumental assessment comprised brain MRI and a positron emission tomography (PET) using 18\u00B0F-fluorodeoxyglucose (18 FDG).
The metabolic investigations included cerebrospinal fluid (CSF) glucose and lactate and plasma glucose and lactate. We conducted a simultaneous lumbar puncture and venous blood sampling, performed according to standard clinical protocols. In addition, the serum to CSF glucose ratio was calculated. Erythrocyte glucose uptake was assessed by GLUT1 Quantification on Red Blood Cells assay (The METAglut1 test METAFORA Biosystems®) (12).
Informed consent was obtained from the patients’ guardians for the processing of personal data and publication.
3 Results
3.1 Clinical features
Patient 1: a 13-year-old girl diagnosed with pediatric Huntington’s disease (CAG 79 repeats) at age 12, with family history positive for the disease (father, grandfather, and great-aunt affected). Pregnancy and delivery were uneventful, psychomotor and language development were normal though she has had right foot internal rotation since age 6, treated with physiotherapy. Learning difficulties were noted from age 6, along with a progressive decline in motor and cognitive functions. Neurological findings include dystonia-parkinsonian syndrome and dysarthria. Although she follows a regular diet, she experiences swallowing difficulties, particularly with liquids. Cognitive assessment reveals borderline intellectual functioning with deficits in visual-motor integration, attention, verbal fluency, working memory, and processing speed. She also experiences social anxiety and struggles with peer relationships. At age 12, she began treatment with L-Dopa (300 mg/day) with minor improvement in motor fluidity and started trihexyphenidyl (6 mg/day) at age 13. She attends weekly speech therapy. Currently she is in her third year of middle school. A home educator and psychological support are planned.
Patient 2: A 16-year-old boy diagnosed with pediatric Huntington’s disease (CAG 76 repeats) at age 15. He is an only child, with an affected biological father and a healthy mother. His pregnancy was complicated by placental detachment, toxoplasmosis, and emergency C-section, although there was no perinatal distress. Psychomotor and language development were normal. From the age of 8, he began to experience academic difficulties, and at the age of 10 was diagnosed with mixed learning and motor disabilities (dysgraphia). His motor skills gradually deteriorated, with worsening coordination, frequent falls, executive dysfunction, and abnormal eye movements. Neurologically, he presented with ophthalmoplegia, dysarthric speech, bradykinesia, and dystonia. Moreover, he developed progressive swallowing difficulties, particularly with liquids and solids, leading to reduced caloric intake and respiratory issues. He is on a semi-solids and semi-liquids diet. Cognitive evaluation at age 15 showed a mild intellectual disability, with marked difficulties in working memory and processing speed but relatively preserved verbal comprehension and visuospatial reasoning. He Also exhibited attention and visuomotor integration difficulties, aggressivity (especially toward his mother), and poor frustration tolerance. He started L-Dopa (200 mg/day) at age 14, with initial improvement, and trihexyphenidyl (12 mg/day) was added at age 15. Currently he is in his second year of high school and practicing speech and physiotherapy.
For further clinical details and investigation, see Table 1 and Figures 1, 2.
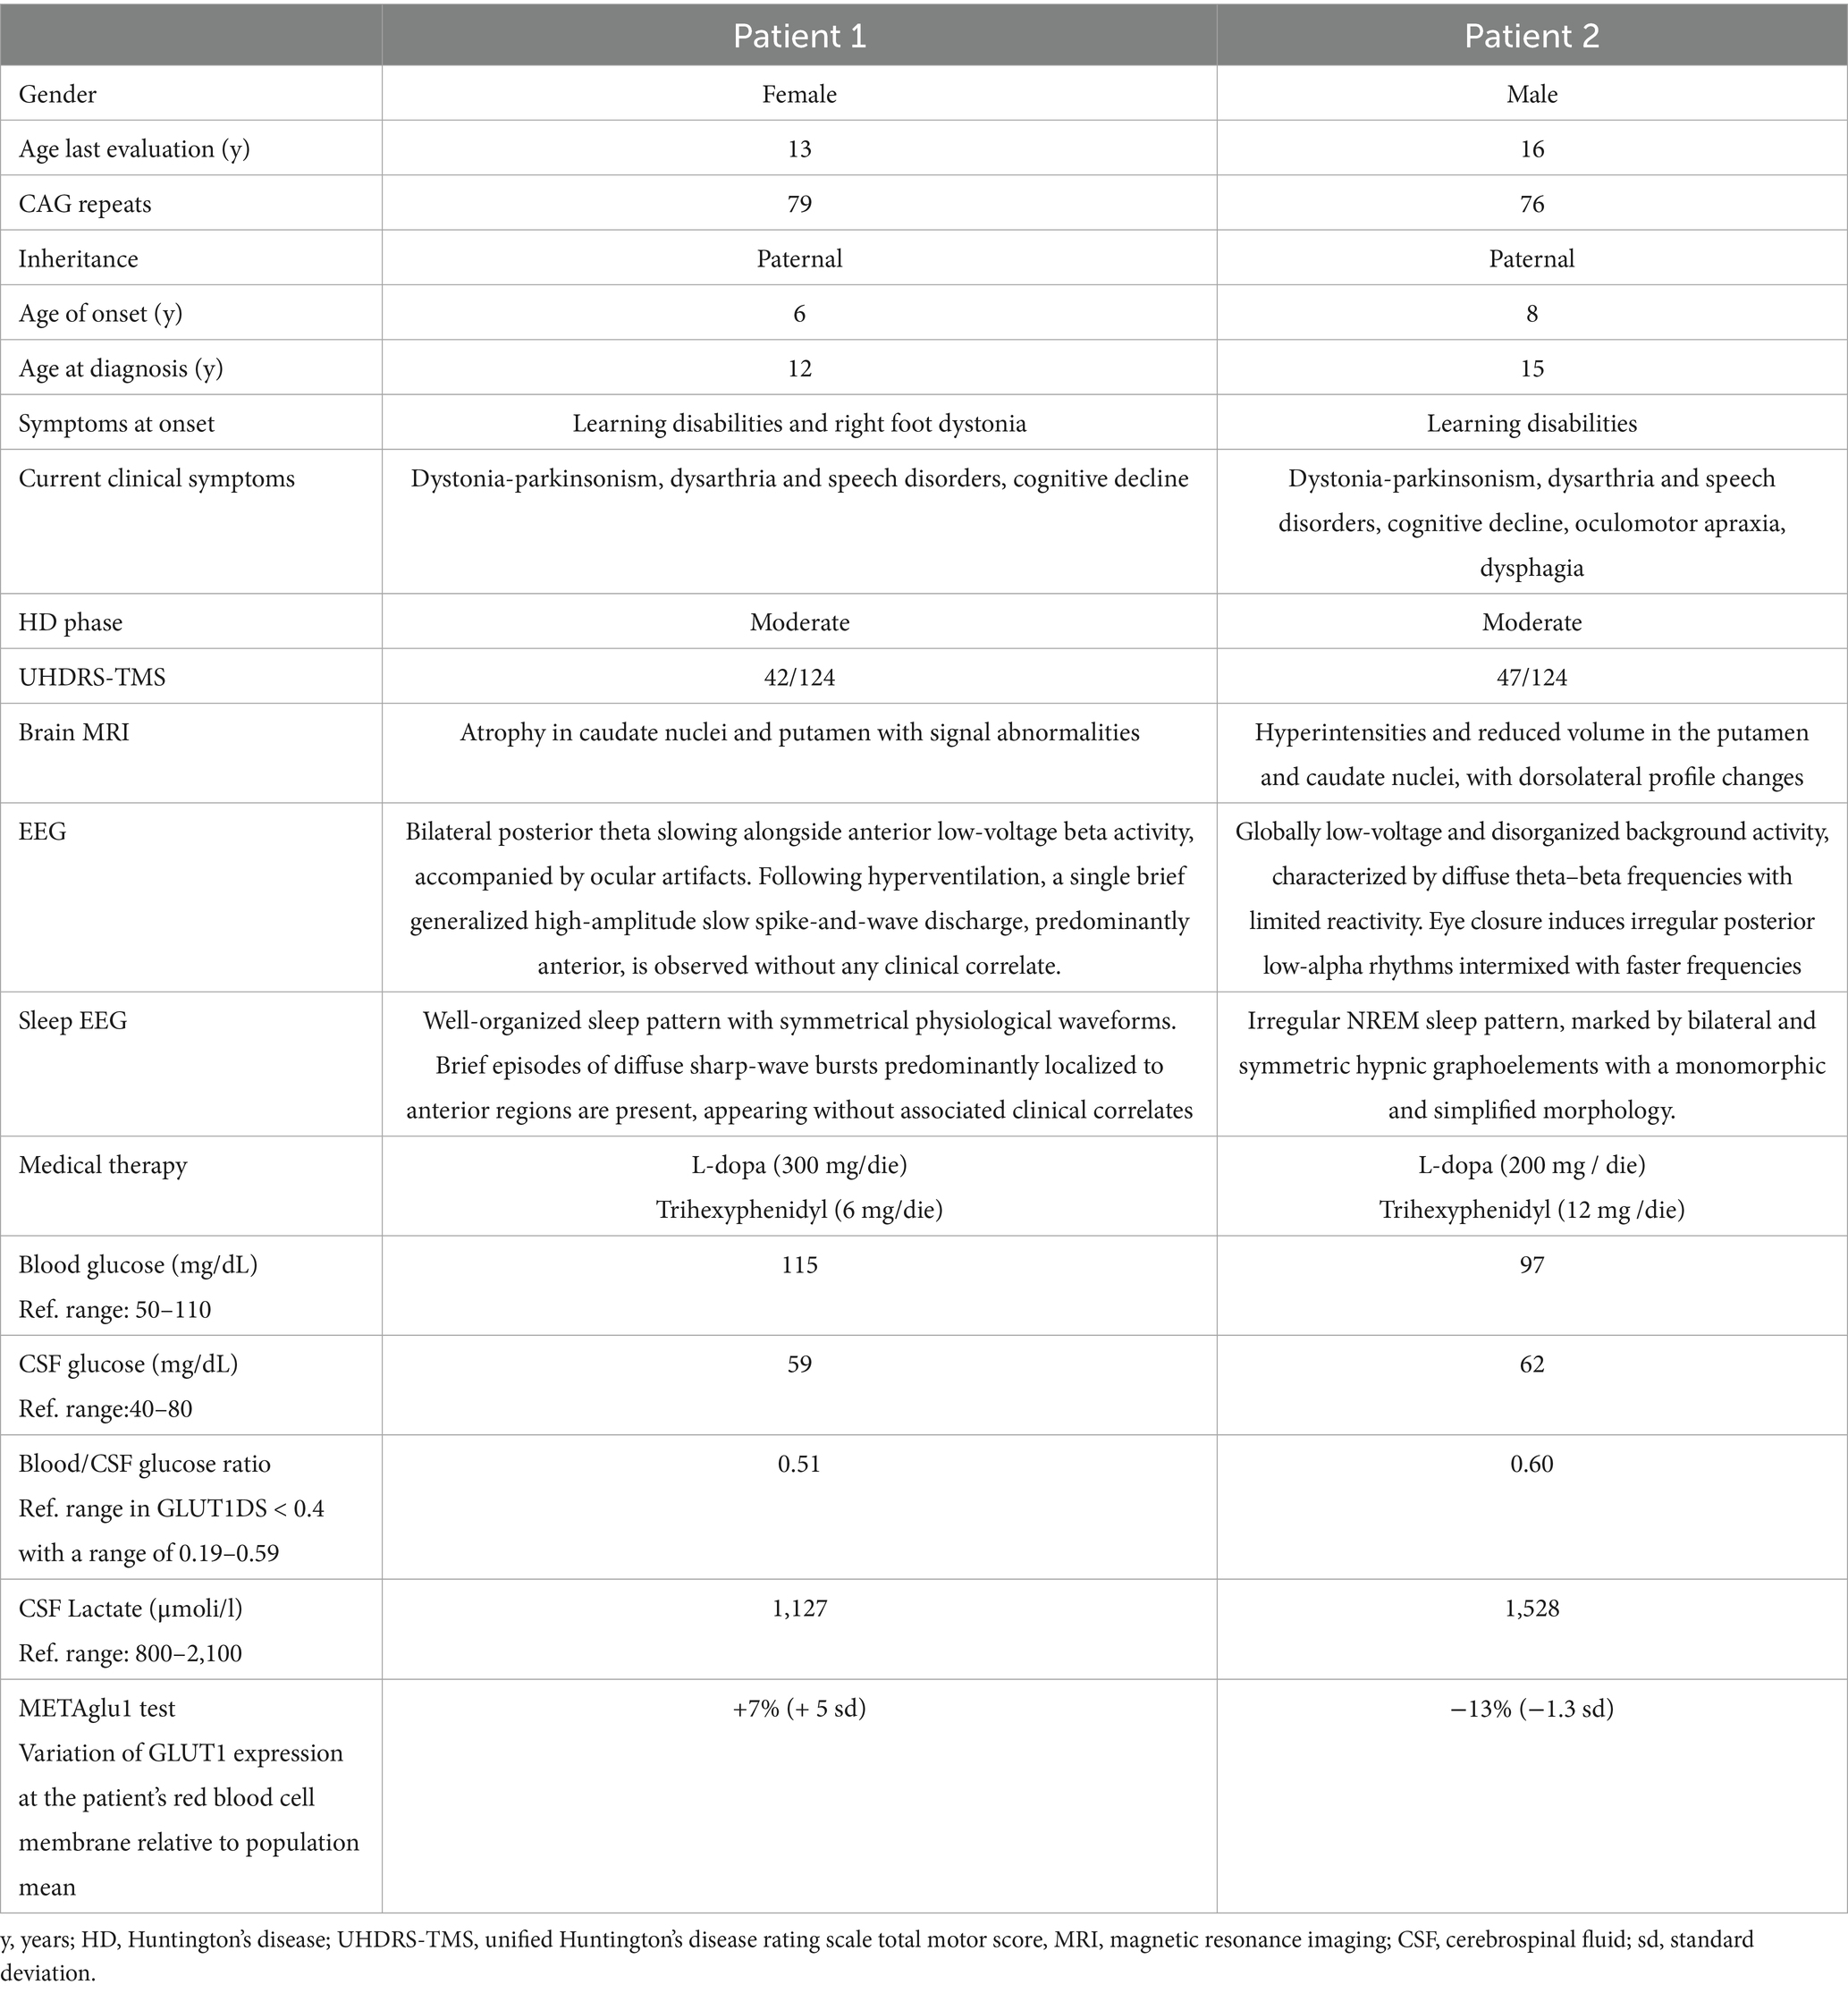
Table 1. Clinical and demographic data.
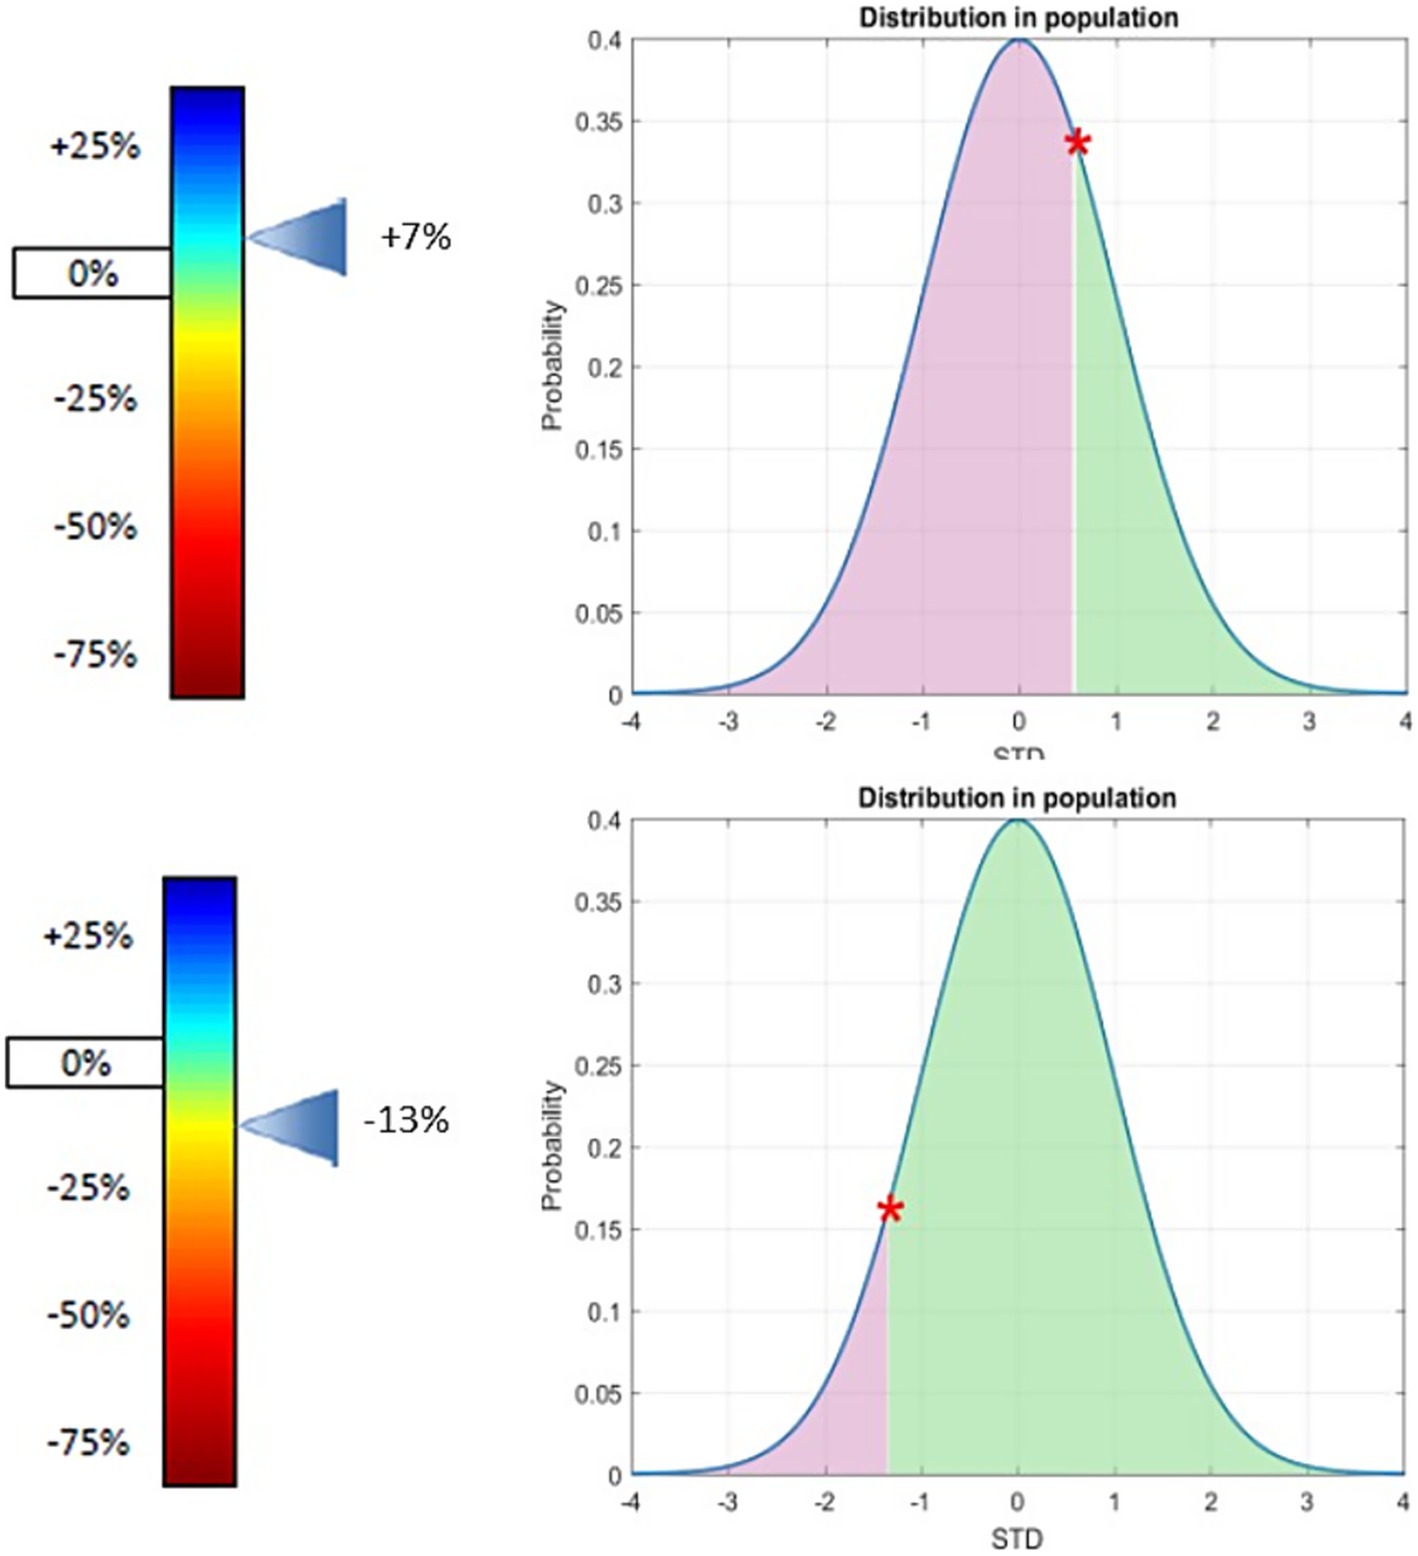
Figure 1. GLUT1 expression at the patient’s red blood cell membrane (relative to population mean) in patient one (top) and two (bottom). Variation of GLUT1 expression at the patients’ red blood cell membrane (relative to population mean) position of the patient in the general population. Both patients show that there is no significant difference of the expression of GLUT1 on red blood cells according to our test compared to the general population. Patients confirmed Glut1DS have a deficit of Glut1 expression on the surface of their red blood cells, most often between −60% and −21% the cut-off of positivity is −24%. For further detail of the METAglut1 test see reference (12).
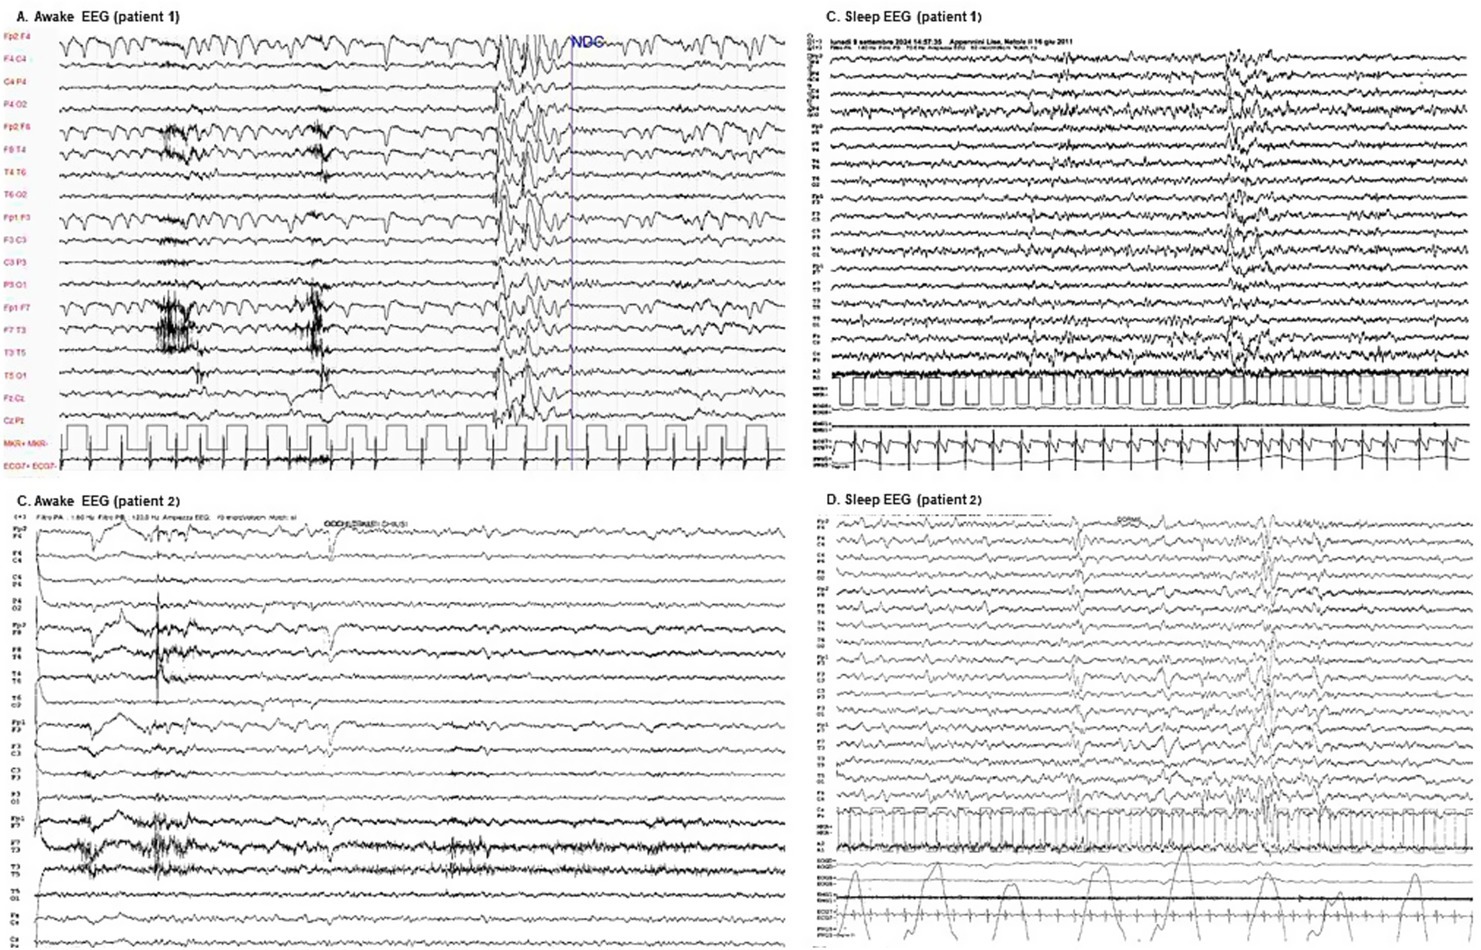
Figure 2. Awake and sleep EEGs. (A) Patient 1 awake EEG: demonstrates bilateral posterior theta slowing (5–6 Hz, low to moderate amplitude) alongside anterior low-voltage beta activity, accompanied by ocular artifacts. Following hyperventilation, a single brief generalized high-amplitude slow spike-and-wave discharge, predominantly anterior, is observed without any clinical correlate. (B) Patient 1 sleep EEG: exhibits a well-organized sleep pattern with symmetrical physiological waveforms. Brief episodes of diffuse sharp-wave bursts predominantly localized to anterior regions are present, appearing without associated clinical correlates. (C) Patient 2 awake EEG: reveals a globally low-voltage and disorganized background activity, characterized by diffuse theta–beta frequencies with limited reactivity. Eye closure induces irregular posterior low-alpha rhythms intermixed with faster frequencies. (D) Patient 2 sleep EEG: displays a recognizable but irregular NREM sleep pattern, marked by bilateral and symmetric hypnic graphoelements with a monomorphic and simplified morphology.
3.2 Metabolic assessment
To verify the hypothesis of a dysregulation of glucose metabolism, we assessed CSF and plasma glucose level with the CSF/plasma ratios resulting within or near the lower normal range, erythrocyte GLUT1 expression within population reference intervals, and normal lactate CSF levels.
A positron emission tomography (PET) scan with 18F-FDG on qualitative analysis documents normal distribution of the radiopharmaceutical in all cortical areas, the cerebellum, and the thalami, with almost absent uptake in caudates and putamina bilaterally. MRI shows a symmetric flattening of the lateral profile of the frontal horn due to atrophy of the caudate head and T2 hyperintense and atrophic putamina. See Table 1 and Figure 3 for further details.
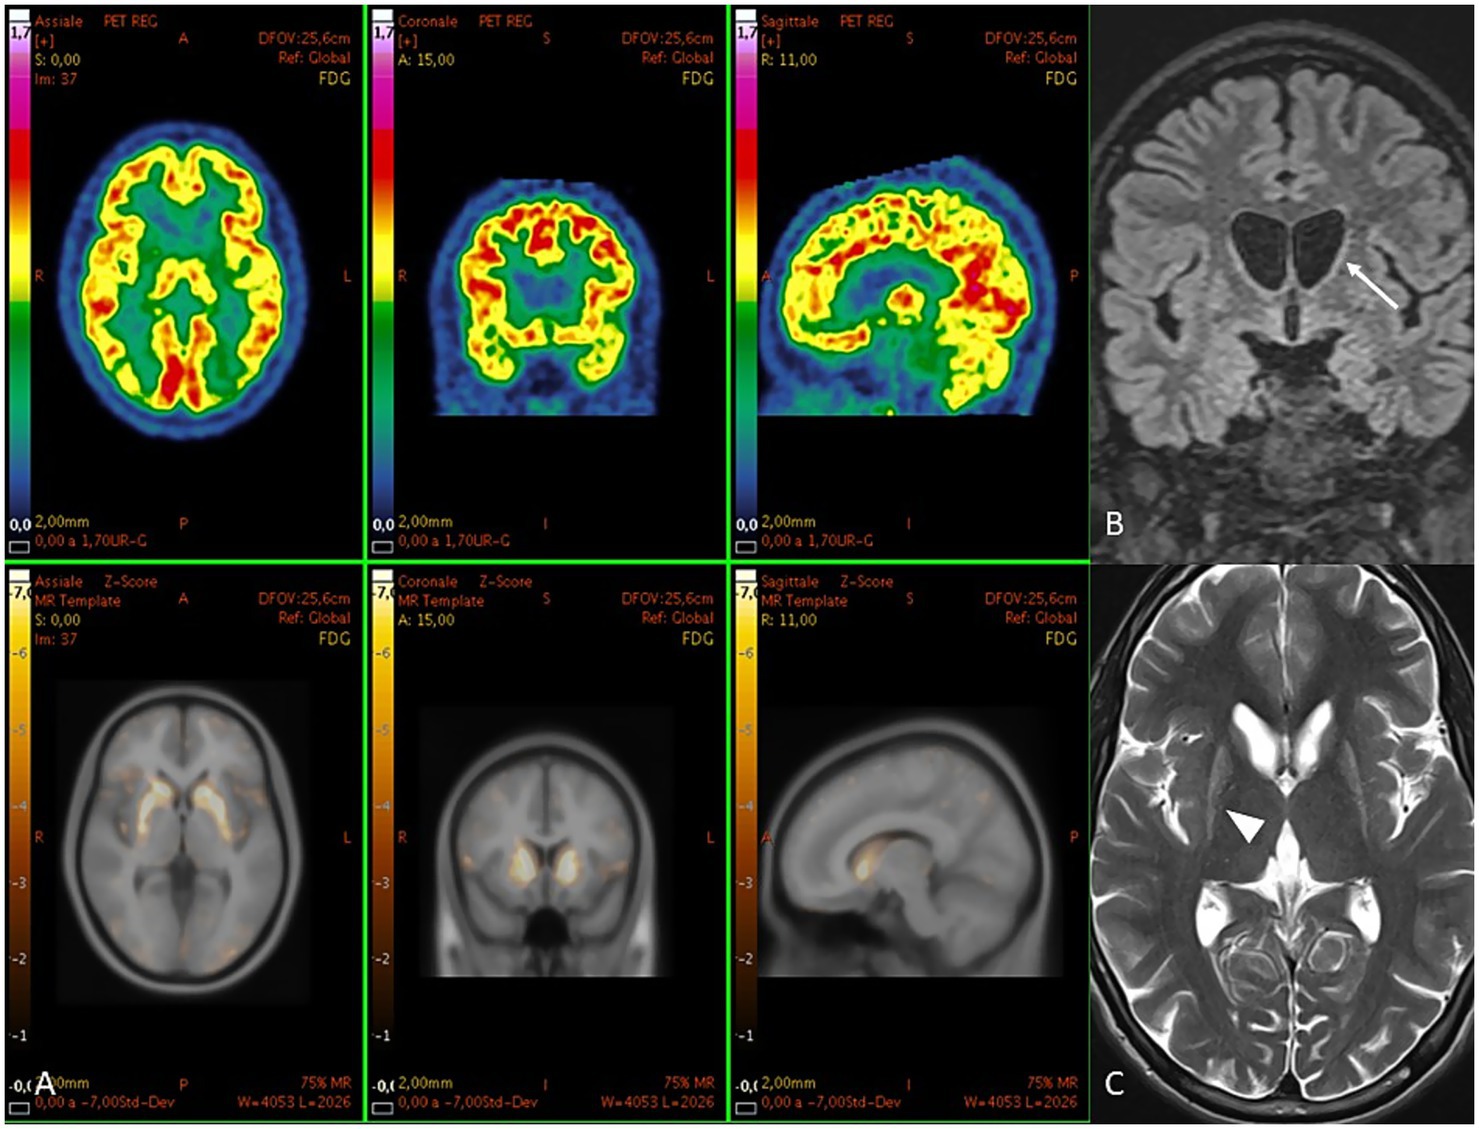
Figure 3. (A) PET images in patient two. Above [18F] FDG images and below their z-score maps show reduced uptake in caudates and putamina. At MRI, (B) coronal FLAIR shows a symmetric flattening of the lateral profile of the frontal horn due to atrophy of the caudate head (arrow). (C) axial T2 shows hyperintense and atrophic putamina (arrowhead).
4 Discussion
In this exploratory study, we investigated the hypothesis of a potential dysfunction of the glucose transporter GLUT1 in pediatric Huntington’s disease (PHD), following recent findings from Tramutola et al. (5), who reported markedly reduced GLUT1 expression in the striatum and frontal cortex of PHD patients. These alterations were proposed to underlie clinical parallels between PHD and GLUT1 Deficiency Syndrome (GLUT1DS), including seizures and movement disorders.
Although our metabolic evaluation in two genetically confirmed PHD patients did not reveal a biochemical profile consistent with GLUT1DS one patient displayed a borderline CSF/plasma glucose ratio. While still within or near the lower normal range, such borderline values—especially in the context of rare diseases—warrant cautious interpretation and ideally require confirmation through repeated measurements.
While we found no evidence of systemic glucose transport impairment, PET imaging revealed severe hypometabolism localized to the basal ganglia, supporting previous neuropathological and neuroimaging studies that point to region-specific energy dysregulation in PHD (13, 14).
Both patients’ EEGs demonstrated diffuse background slowing, accompanied by epileptiform activity that increase during sleep, with no correlation observed between these findings and fasting status. These results align with existing literature, reflecting the electroclinical progression of pediatric Huntington’s disease (15). In contrast, GLUT1DS typically presents with generalized EEG slowing that becomes more pronounced during fasting (16). Additionally, in some cases, fasting EEG reveals diffuse spike–wave discharges that markedly improve following food intake (17), indicating a direct impact of metabolic dysfunction on cerebral electrical activity.
Taken together these findings do not support a generalized systemic GLUT1 deficiency in PHD, but rather highlight a central, brain-region specific glucose metabolism impairment.
At present this does not justify the use of metabolic interventions such as the ketogenic diet in PHD subjects.
Dysregulated glucose metabolism within the basal ganglia—particularly the caudate and putamen—appears to play a central role in driving both neurodegeneration and clinical manifestations in pediatric-onset Huntington’s disease (PHD). Functional imaging reveals marked glucose hypometabolism in these nuclei, evident even before overt atrophy and clinical symptoms emerge; the degree of hypometabolism correlates with CAG repeat expansion and disease severity, indicating a pathogenic link between early metabolic failure and structural degeneration (9, 18, 19). Hybrid PET/MRI studies in pediatric-onset HD have shown that regions with more severe striatal volume loss also display disproportionately reduced glucose uptake, aligning metabolic impairment with structural vulnerability and hypokinetic motor phenotypes, in contrast to the choreic features typical of adult-onset cases (20). Mechanistically, deficient glucose uptake—driven by reduced GLUT3 expression in striatal neurons and altered glycolytic enzyme activity, such as phosphofructokinase and pyruvate dehydrogenase—leads to energy deficits that compromise neuronal integrity and synaptic maintenance (5, 21). This metabolic stress is further amplified by mitochondrial dysfunction, particularly complex II deficits and impaired oxidative phosphorylation, which increase oxidative damage and promote neuronal loss in the striatum (7, 8). Structural declines in basal ganglia volume and corticostriatal connectivity, as shown by diffusion-tensor imaging and volumetric MRI, closely align with both motor and cognitive impairments, reinforcing the view that metabolic deficits are upstream drivers of neurodegeneration and clinical phenotype expression in PHD (22). Thus, basal ganglia hypometabolism emerges as both a driver and a biomarker of striatal atrophy and the hypokinetic–dystonic clinical presentations observed in PHD.
Despite the very limited sample size, our study adds to the growing body of literature implicating altered energy metabolism in PHD.
We recommend including CSF glucose analysis as part of the diagnostic workup in severe or early-onset PHD phenotypes, particularly to identify potential metabolic subgroups who may benefit from tailored interventions. However, larger studies with age-matched controls and repeated metabolic assessments are essential to validate these preliminary findings and to allow for statistical comparisons.
Data availability statement
The raw data supporting the conclusions of this article will be made available by the authors, without undue reservation.
Ethics statement
The requirement of ethical approval was waived by the Istituto Neurologico “Carlo Besta” | Fondazione IRCCS for the studies involving humans because this study is a retrospective case report involving only two patients, with no experimental intervention. Written informed consent for data use and publication was obtained from the patients’ legal guardians, in accordance with institutional and national guidelines. The studies were conducted in accordance with the local legislation and institutional requirements. Written informed consent for participation in this study was provided by the participants’ legal guardians/next of kin. Written informed consent was obtained from the individual(s) for the publication of any potentially identifiable images or data included in this article.
Author contributions
FG: Writing – original draft, Data curation, Methodology, Conceptualization, Investigation, Writing – review & editing, Supervision. FD: Writing – review & editing, Supervision, Data curation. MP: Methodology, Writing – original draft, Data curation. AS: Writing – review & editing, Methodology, Data curation. EM: Data curation, Writing – review & editing. MM: Investigation, Writing – review & editing, Software. FZ: Writing – review & editing. CM: Writing – review & editing. GZ: Conceptualization, Writing – review & editing.
Funding
The author(s) declare that financial support was received for the research and/or publication of this article. Istituto Neurologico Carlo Besta supported the study by covering the costs related to the erythrocyte 3-Omethyl-D-glucose uptake assay.
Acknowledgments
We acknowledge the Pierfranco and Luisa Mariani Foundation and the Paolo Zorzi Association for Neuroscience ONLUS. We are grateful to all our patients and their families for participating in the study.
Conflict of interest
The authors declare that the research was conducted in the absence of any commercial or financial relationships that could be construed as a potential conflict of interest.
Generative AI statement
The authors declare that Gen AI was used in the creation of this manuscript. Some language editing and improvements to fluency were assisted by the use of a generative AI tool (ChatGPT, OpenAI). The final content was reviewed and approved by the authors.
Publisher’s note
All claims expressed in this article are solely those of the authors and do not necessarily represent those of their affiliated organizations, or those of the publisher, the editors and the reviewers. Any product that may be evaluated in this article, or claim that may be made by its manufacturer, is not guaranteed or endorsed by the publisher.
References
2. Fusilli, C, Migliore, S, Mazza, T, Consoli, F, de Luca, A, Barbagallo, G, et al. Biological and clinical manifestations of juvenile Huntington's disease: a retrospective analysis. Lancet Neurol. (2018) 17:986–93. doi: 10.1016/S1474-4422(18)30294-1
3. Graziola, F, Maffi, S, Grasso, M, Garone, G, Migliore, S, Scaricamazza, E, et al. "Spazio Huntington": tracing the early motor, cognitive and behavioral profiles of kids with proven pediatric Huntington disease and expanded mutations > 80 CAG repeats. J Pers Med. (2022) 12:120. doi: 10.3390/jpm12010120
4. Letort, D, and Gonzalez-Alegre, P. Huntington's disease in children. Handb Clin Neurol. (2013) 113:1913–7. doi: 10.1016/B978-0-444-59565-2.00061-7
5. Tramutola, A, Bakels, HS, Perrone, F, di Nottia, M, Mazza, T, Abruzzese, MP, et al. GLUT-1 changes in paediatric Huntington disease brain cortex and fibroblasts: an observational case-control study. EBioMedicine. (2023) 97:104849. doi: 10.1016/j.ebiom.2023.104849
6. Panov, AV, Gutekunst, CA, Leavitt, BR, Hayden, MR, Burke, JR, Strittmatter, WJ, et al. Early mitochondrial calcium defects in Huntington's disease are a direct effect of polyglutamines. Nat Neurosci. (2002) 5:731–6. doi: 10.1038/nn884
7. Carmo, C, Naia, L, Lopes, C, and Rego, AC. Mitochondrial dysfunction in Huntington's disease. Adv Exp Med Biol. (2018) 1049:59–83. doi: 10.1007/978-3-319-71779-1_3
8. Oliveira, JM, Jekabsons, MB, Chen, S, Lin, A, Rego, AC, Gonçalves, J, et al. Mitochondrial dysfunction in Huntington's disease: the bioenergetics of isolated and in situ mitochondria from transgenic mice. J Neurochem. (2007) 101:241–9. doi: 10.1111/j.1471-4159.2006.04361.x
9. Ciarmiello, A, Cannella, M, Lastoria, S, Simonelli, M, Frati, L, Rubinsztein, DC, et al. Brain white-matter volume loss and glucose hypometabolism precede the clinical symptoms of Huntington's disease. J Nucl Med. (2006) 47:215–22.
10. Cui, L, Jeong, H, Borovecki, F, Parkhurst, CN, Tanese, N, and Krainc, D. Transcriptional repression of PGC-1alpha by mutant huntingtin leads to mitochondrial dysfunction and neurodegeneration. Cell. (2006) 127:59–69. doi: 10.1016/j.cell.2006.09.015
11. Klepper, J, Akman, C, Armeno, M, Auvin, S, Cervenka, M, Cross, HJ, et al. Glut 1 deficiency syndrome (Glut 1DS): state of the art in 2020 and recommendations of the international Glut 1DS study group. Epilepsia Open. (2020) 5:354–65. doi: 10.1002/epi4.12414
12. Mochel, F, Gras, D, Luton, MP, Nizou, M, Giovannini, D, Delattre, C, et al. Prospective multicenter validation of a simple blood test for the diagnosis of Glut1 deficiency syndrome. Neurology. (2023) 100:e2360–73. doi: 10.1212/WNL.0000000000207296
13. Pagano, G, Niccolini, F, and Politis, M. Current status of PET imaging in Huntington's disease. Eur J Nucl Med Mol Imaging. (2016) 43:1171–82. doi: 10.1007/s00259-016-3324-6
14. Timmers, ER, Klamer, MR, Marapin, RS, Lammertsma, AA, de Jong, BM, Dierckx, RAJO, et al. [18F] FDG PET in conditions associated with hyperkinetic movement disorders and ataxia: a systematic review. Eur J Nucl Med Mol Imaging. (2023) 50:1954–73. doi: 10.1007/s00259-023-06110-w
15. López-Mora, DA, Camacho, V, Pérez-Pérez, J, Martínez-Horta, S, Fernández, A, Sampedro, F, et al. Striatal hypometabolism in premanifest and manifest Huntington's disease patients. Eur J Nucl Med Mol Imaging. (2016) 43:2183–9. doi: 10.1007/s00259-016-3445-y
16. McDonald, TS, Lerskiatiphanich, T, Woodruff, TM, McCombe, PA, and Lee, JD. Potential mechanisms to modify impaired glucose metabolism in neurodegenerative disorders. J Cereb Blood Flow Metab. (2023) 43:26–43. doi: 10.1177/0271678X221135061
17. Delva, A, Van Laere, K, and Vandenberghe, W. Longitudinal imaging of regional brain volumes, SV2A, and glucose metabolism in Huntington's disease. Mov Disord. (2023) 38:1515–26. doi: 10.1002/mds.29501
18. Chang, CP, Wu, CW, and Chern, Y. Metabolic dysregulation in Huntington's disease: neuronal and glial perspectives. Neurobiol Dis. (2024) 201:106672. doi: 10.1016/j.nbd.2024.106672
19. Jurgens, CK, van de Wiel, L, van Es, AC, Grimbergen, YM, Witjes-Ané, MN, van der Grond, J, et al. Basal ganglia volume and clinical correlates in 'preclinical' Huntington's disease. J Neurol. (2008) 255:1785–91. doi: 10.1007/s00415-008-0050-4
20. Landau, ME, and Cannard, KR. EEG characteristics in juvenile Huntington's disease: a case report and review of the literature. Epileptic Disord. (2003) 5:145–8. doi: 10.1684/j.1950-6945.2003.tb00004.x
21. Leen, WG, Klepper, J, Verbeek, MM, Leferink, M, Hofste, T, van Engelen, BG, et al. Glucose transporter-1 deficiency syndrome: the expanding clinical and genetic spectrum of a treatable disorder. Brain. (2010) 133:655–70. doi: 10.1093/brain/awp336
Keywords: Huntington’s disease, pediatric Huntington’s disease, juvenile-onset HD, GLUT-1 deficiency syndrome, GLUT1
Citation: Graziola F, Danti FR, Penzo M, Spagarino A, Minacapilli E, Moscatelli M, Zibordi F, Mariotti C and Zorzi G (2025) Preliminary observations of glucose metabolism dysregulation in pediatric Huntington’s disease. Front. Neurol. 16:1626275. doi: 10.3389/fneur.2025.1626275
Edited by:
Vincenzo Leuzzi, Sapienza University of Rome, ItalyReviewed by:
Matteo Bologna, Sapienza University of Rome, ItalyRita Barone, University of Catania, Italy
Tamara Vasilkovska, University of California, San Francisco, United States
Copyright © 2025 Graziola, Danti, Penzo, Spagarino, Minacapilli, Moscatelli, Zibordi, Mariotti and Zorzi. This is an open-access article distributed under the terms of the Creative Commons Attribution License (CC BY). The use, distribution or reproduction in other forums is permitted, provided the original author(s) and the copyright owner(s) are credited and that the original publication in this journal is cited, in accordance with accepted academic practice. No use, distribution or reproduction is permitted which does not comply with these terms.
*Correspondence: Federica Graziola, ZmVkZXJpY2EuZ3JhemlvbGFAaXN0aXR1dG8tYmVzdGEuaXQ=