Abstract
Background:
Patients with vestibular and ocular motor disorders often perceive oscillopsia, diplopia or visual hallucinations as their chief complaint. However, they often struggle with verbalizing these subjective ocular motor and visual-perceptual signs precisely, which complicates a correct diagnostic classification of the suspected pathogenic mechanism.
Methods:
In this multinational and cross-cultural feasibility study, a novel pictogram-based scale of 10 common ocular motor and visual-perceptual symptoms (called Pictogram Ocular Motor and Visual-Perceptual Symptom Scale, POVSS) was developed and validated. Healthcare professionals with or without expertise in neuro-ophthalmology and neuro-otology, representing a broad range of nationality and primary languages, were asked to match pictograms with medical symptoms (specialists) or a simple English symptom description (non-specialists).
Results:
A total of 174 participants (112 specialists, 62 non-specialists) from 30 nationalities evaluated the POVSS. On average, specialists reached a score of 9.7 out of 10 (SD = 0.5; 95% CI: 9.6–9.8) in matching symptoms and pictograms. Non-specialists achieved a mean score of 7.9 (SD = 2.3; 95% CI: 7.3–8.5) in accurately matching pictograms to simple English descriptions. In the specialist group, all pictograms met the common ISO quality standards, whereas in the non-specialist group, 8 out of 10 met the standards. While a significant difference in performance was found between the two groups, success rates did not differ between male and female participants.
Conclusion:
Visual-perceptual symptoms originating from common vestibular and ocular motor disorders could be reliably identified using the POVSS by healthcare professionals, independent of participant nationality, or gender. Further research is needed to test the clinical applicability of the POVSS in different patient care settings.
Introduction
Disorders of the peripheral or central vestibular or ocular motor system, as well as the higher visual system can cause striking visually perceived disturbances such as oscillopsia, double vision, or scotoma (1). These symptoms were already described in ancient times, underlining their impact on patients’ wellbeing (2). While a precise evaluation of the patient complaints and case history is crucial for an accurate differential diagnosis in vestibular and ocular motor disorders (3, 4), discrepancies often exist between how patients describe their symptoms and how healthcare providers interpret them (5, 6). In consequence, the quality of the chief complaint, such as direction-specific turning or undirected swaying, has been described to be not sufficiently satisfactory in current diagnostic algorithms for patients with vestibular and ocular motor disorders (7, 8).
Effective communication between patients and healthcare providers is a cornerstone of quality medical care. Miscommunication can occur due to a variety of factors, including language barriers (9), cognitive impairments, emotional distress, or a lack of health literacy (10). This can lead to delayed diagnosis, diagnostic errors, and inadequate treatments (11). Moreover, patients from marginalized or underserved populations may face additional hurdles, such as cultural stigmas around expressing neurological symptoms or medication intake, which can further complicate their ability to articulate their concerns (12–14).
To ensure inclusivity and equity in neuro-ophthalmology and neuro-otology, it is essential to develop systems and practices that accommodate patients who might struggle with the verbal expression of ocular motor and visual-perceptual symptoms, while also providing physicians with tools to objectify patient-described subjective symptoms. In neuro-ophthalmological and neuro-otological conditions, misdiagnosis rates can reach up to 70% (15), potentially causing delay in patients care and management or even substantial harm (16). Different approaches for reducing misdiagnosis in the care of patients with vestibular and ocular motor disorders have been proposed (3, 17). In this clinical setting, in contrast to other fields of medicine (18–20), no visual aid was developed or tested so far. Thus, pictorial representations of visual disturbances, such as visual aura and oscillopsia, may improve the diagnostic process and enhance efficiency.
In this study, we aimed to assess the cross-cultural comparability of a novel, pictogram-based chart of 10 common visual-perceptual sensations. For this, members from the DIZZYNET, a trans-European network of vestibular researchers (21), and other international societies for neuro-otology, neuro-ophthalmology or ENT were contacted. The goal of this current study was to cross-culturally validate a language-independent scale for the understanding of common visual-perceptual symptoms related to ocular motor signs.
Methods
Questionnaire development
A first draft of the Pictogram Ocular Motor and Visual-Perceptual Symptom Scale (POVSS) was created by two of the authors (AM, JG). Based on feedback during the 2024 annual DIZZYNET meeting, the draft was refined. The revised POVSS includes 10 pictograms for oscillopsia (vertical, horizontal, diagonal, torsional), double vision (vertical, horizontal, and diagonal), visual snow, blurred vision, and (migrainous) visual aura with fortifications (Figure 1). All pictograms are based on a picture of a black-and-white apple, which was then modified to symbolize the aforementioned visual disturbances. The pictograms utilize high-contrast in order to be easily readable. Movement is depicted by arrows, while double vision is symbolized by two objects (one in fainter color). This approach was chosen to be inclusive of all patient groups.
Figure 1

Pictograms of different visual disturbances: (A) reference, (B) diagonal double vision, (C) vertical double vision, (D) vertical oscillopsia, (E) torsional oscillopsia, (F) (migrainous) visual aura with fortifications, (G) blurred vision, (H) visual snow, (I) diagonal oscillopsia, (J) horizontal double vision, (K) horizontal oscillopsia.
A survey consisting of 10 items was created, with each item featuring one pictogram accompanied by 10 multiple-choice answer options. All participants in the survey were asked to match the text that best described each pictogram and provide an answer for every question; skipping a question was not possible. The pictogram representing the absence of visual disturbance was provided as a reference in the beginning of the survey. Two versions of the survey, featuring the same pictograms with different text descriptions, were provided. One version was intended for participants with professional expertise in neuro-ophthalmology and neuro-otology (Specialist), while the other was designed for participants without such expertise (Non-specialist). Table 1 indicates the different terminology or descriptions used for each population. Both the order of the items and the response options within each item were randomized for each participant to minimize order effects and response bias.
Table 1
| Specialist | Non-specialist |
|---|---|
| Diagonal double vision | Your surroundings appear to be doubled, with one copy being shifted diagonally |
| Vertical double vision | Your surroundings appear to be doubled, with one copy stacked above or below the other |
| Vertical oscillopsia | Your surroundings appear to be moving up and down |
| Torsional oscillopsia | Your surroundings appear to be moving in a circle |
| (Migrainous) visual aura | You see curvy or zigzag lines and triangles in one part of your vision |
| Blurred vision | Everything appears blurry and out of focus |
| Visual snow | You have the sensation of falling snow in your field of vision, no matter where you look |
| Diagonal oscillopsia | Your surroundings appear to be moving diagonally |
| Horizontal double vision | Your surroundings appear to be doubled, with one copy shifted horizontally, i.e., to the left or to the right of the other one |
| Horizontal oscillopsia | Your surroundings appear to be moving left and right |
Description provided to the participants.
Participant recruitment
Two of the authors (AM, JG) created the online questionnaire using the Qualtrics software. The link to the online survey was provided to DIZZYNET members as well as to various international neuro-ophthalmology, neuro-otology or ENT societies. Both neuro-ophthalmology/−otology specialists and non-specialists, including members of the general population, were included in the study. Exclusion criteria included age below 18 years, insufficient English language skills or active ocular motor, vestibular, visual, or central nervous disorder, which might affect visual perception. All participants were asked to provide their gender, primary language, current place of residence and profession. All data was collected anonymously. For privacy reasons, we chose not to ask participants’ age. This decision was made not to allow for immediate identification of participating DIZZYNET members.
Setting and institutional review board approval
Approval was obtained from the ethical committee of Maastricht University Medical Center on December 6th 2024, in The Netherlands (METC 2024–0462). Informed consent was obtained from all participants. This study was conducted in accordance with the legislation and ethical standards on human experimentation in the Netherlands and in accordance with the Declaration of Helsinki (amended version 2013).
Data analysis
Descriptive analyses were performed, summarizing quantitative variables as mean and standard deviation and qualitative variables as proportions. The correct classification of each pictogram was compared between specialists and non-specialists with a Chi-Square test when the expected frequency in each cell of the 2 × 2 contingency table was at least 5, and with a Fisher’s Exact test otherwise. To correct for multiple comparisons across the 10 individual pictograms, the significance threshold (α) was adjusted using a Bonferroni correction, resulting in a corrected alpha level of 0.005 (α = 0.05/10). The number of correct matches (treated as quantitative) was compared between specialists and non-specialists and between women and men, in both levels of specialization using independent samples t-tests. To account for multiple comparisons in the gender-based analyses, a correction was applied, adjusting the alpha level to 0.025 (α = 0.05/2).
The minimum comprehension threshold for pictograms (i.e., the rate of correctly identified pictograms) is 67% according to ISO (International Organization for Standardization) 9,186–1:2014, and 85% according to ANSI (American National Standards Institute) Z535.1–2006 (R2011) (22). These thresholds were used as reference criteria for evaluating pictogram comprehension in this study. All data was anonymously processed using the Qualtrics software (Qualtrics, Provo, UT, United States), SPSS v28.0.0.0 (IBM, Armonk, New York, United States), Microsoft Excel 2016 (Microsoft, Redmond, Washington, United States), and JASP.1
Results
Participant demographics
A total of 179 responses were collected; after excluding five participants (four declined consent, one gave uniform responses indicating a lack of engagement or trouble understanding the instructions), 174 valid responses remained. Participants represented 30 nationalities (Supplementary material), 17 primary languages, and 24 countries of residence. Of these, 112 were self-identified specialists (64 female/46 male/2 prefer not say) and 62 (40 female/22 male) were non-specialists. Detailed participant demographics, including nationality, language, and profession, are provided in Table 2.
Table 2
| Characteristics | Count (n = 174) |
|---|---|
| Gender | |
| Female | 104 (59.8%) |
| Male | 68 (39.1%) |
| Prefer not to say | 2 (1.1%) |
| Primary language | |
| Arabic | 22 (12.6%) |
| Armenian | 1 (0.6%) |
| Chinese | 3 (1.7%) |
| Czech | 1 (0.6%) |
| Dutch | 15 (8.6%) |
| English | 13 (7.5%) |
| French | 95 (54.6%) |
| German | 8 (4.6%) |
| Greek | 3 (1.7%) |
| Italian | 2 (1.1%) |
| Luxembourgish | 1 (0.6%) |
| Malayalam | 2 (1.1%) |
| Nepali | 1 (0.6%) |
| Romanian | 4 (2.3%) |
| Spanish | 1 (0.6%) |
| Turkish | 1 (0.6%) |
| Vietnamese | 1 (0.6%) |
| Expertise | |
| Specialist | 112 (64.4%) |
| Non-specialist | 62 (35.6%) |
| Profession | |
| Audiologist | 31 (17.8%) |
| Audiovestibular physician | 5 (2.9%) |
| ENT | 33 (19%) |
| Medical assistant | 1 (0.6%) |
| Neurologist | 13 (7.5%) |
| Neurophysiologist | 1 (0.6%) |
| Neurophysiology, neuro-otology PhD student | 1 (0.6%) |
| Non-medical professional | 10 (5.7%) |
| Nurse | 1 (0.6%) |
| Ophthalmologist | 1 (0.6%) |
| Orthoptist | 45 (25.9%) |
| Physical therapist | 30 (17.2%) |
| Psychomotor therapist | 1 (0.6%) |
| Researcher in neurosciences | 1 (0.6%) |
Demographic data, self-assessed ethnicities and nationalities (sorted alphabetically) by all participants.
Accuracy analysis
On average, the specialists demonstrated a mean score of accuracy of 9.7 out of 10 (SD = 0.5, 95% CI: 9.6–9.8) in correctly identifying the pictograms. The non-specialists showed a mean score of 7.9 (SD = 2.3, 95% CI: 7.3–8.5) in accurately matching pictograms to simple English descriptions. In all but three pictograms, the specialists significantly outperformed the non-specialists. All pictograms met the minimum comprehension thresholds (i.e., the rate of correctly identified pictograms) established by both ISO (67%) and ANSI (85%) standards for specialists. However, among non-specialists, two pictograms did not meet either criterion, five met only the ISO criterion, and three met both criteria. Detailed success rates per pictogram can be seen in Table 3 and Figure 2.
Table 3
| Visual disturbance | Specialists agreement (n = 112) | Non-specialist agreement (n = 62) | p-value | Total (n = 174) |
|---|---|---|---|---|
| Diagonal double vision | 108 (96.4%)† | 40 (64.5%) | <0.001* | 148 (85.1%)† |
| Vertical double vision | 111 (99.1%)† | 44 (71.0%)‡ | <0.001* | 155 (89.1%)† |
| Vertical oscillopsia | 109 (97.3%)† | 54 (87.1%)† | 0.018 | 163 (93.7%)† |
| Torsional oscillopsia | 108 (96.4%)† | 45 (72.6%)‡ | <0.001* | 153 (87.9%)† |
| (Migrainous) Visual aura | 106 (94.6%)† | 57 (91.9%)† | 0.524 | 163 (93.7%)† |
| Blurred vision | 110 (98.2%)† | 61 (98.4%)† | 1.000 | 171 (98.3%)† |
| Visual snow | 109 (97.3%)† | 50 (80.6%)‡ | <0.001* | 159 (91.4%)† |
| Diagonal oscillopsia | 110 (98.2%)† | 41 (66.1%) | <0.001* | 151 (86.8%)† |
| Horizontal double vision | 110 (98.2%)† | 49 (79.0%)‡ | <0.001* | 159 (91.4%)† |
| Horizontal oscillopsia | 110 (98.2%)† | 46 (74.2%)‡ | <0.001* | 156 (89.7%)† |
| Mean of overall score (out of 10) |
9.7 (SD = 0.5; 95% CI: 9.6–9.8) |
7.9 (SD = 2.3; 95% CI: 7.3–8.5) |
<0.001* | 9.1 (SD = 1.7; 95% CI: 8.9–9.4) |
Number of participants accurately matching pictograms to provided descriptions (accuracy rate).
†Meets both ISO (≥67%) and ANSI (≥85%) criteria. ‡Meets only ISO (≥67%) criteria. *Significant effect of the group.
Figure 2
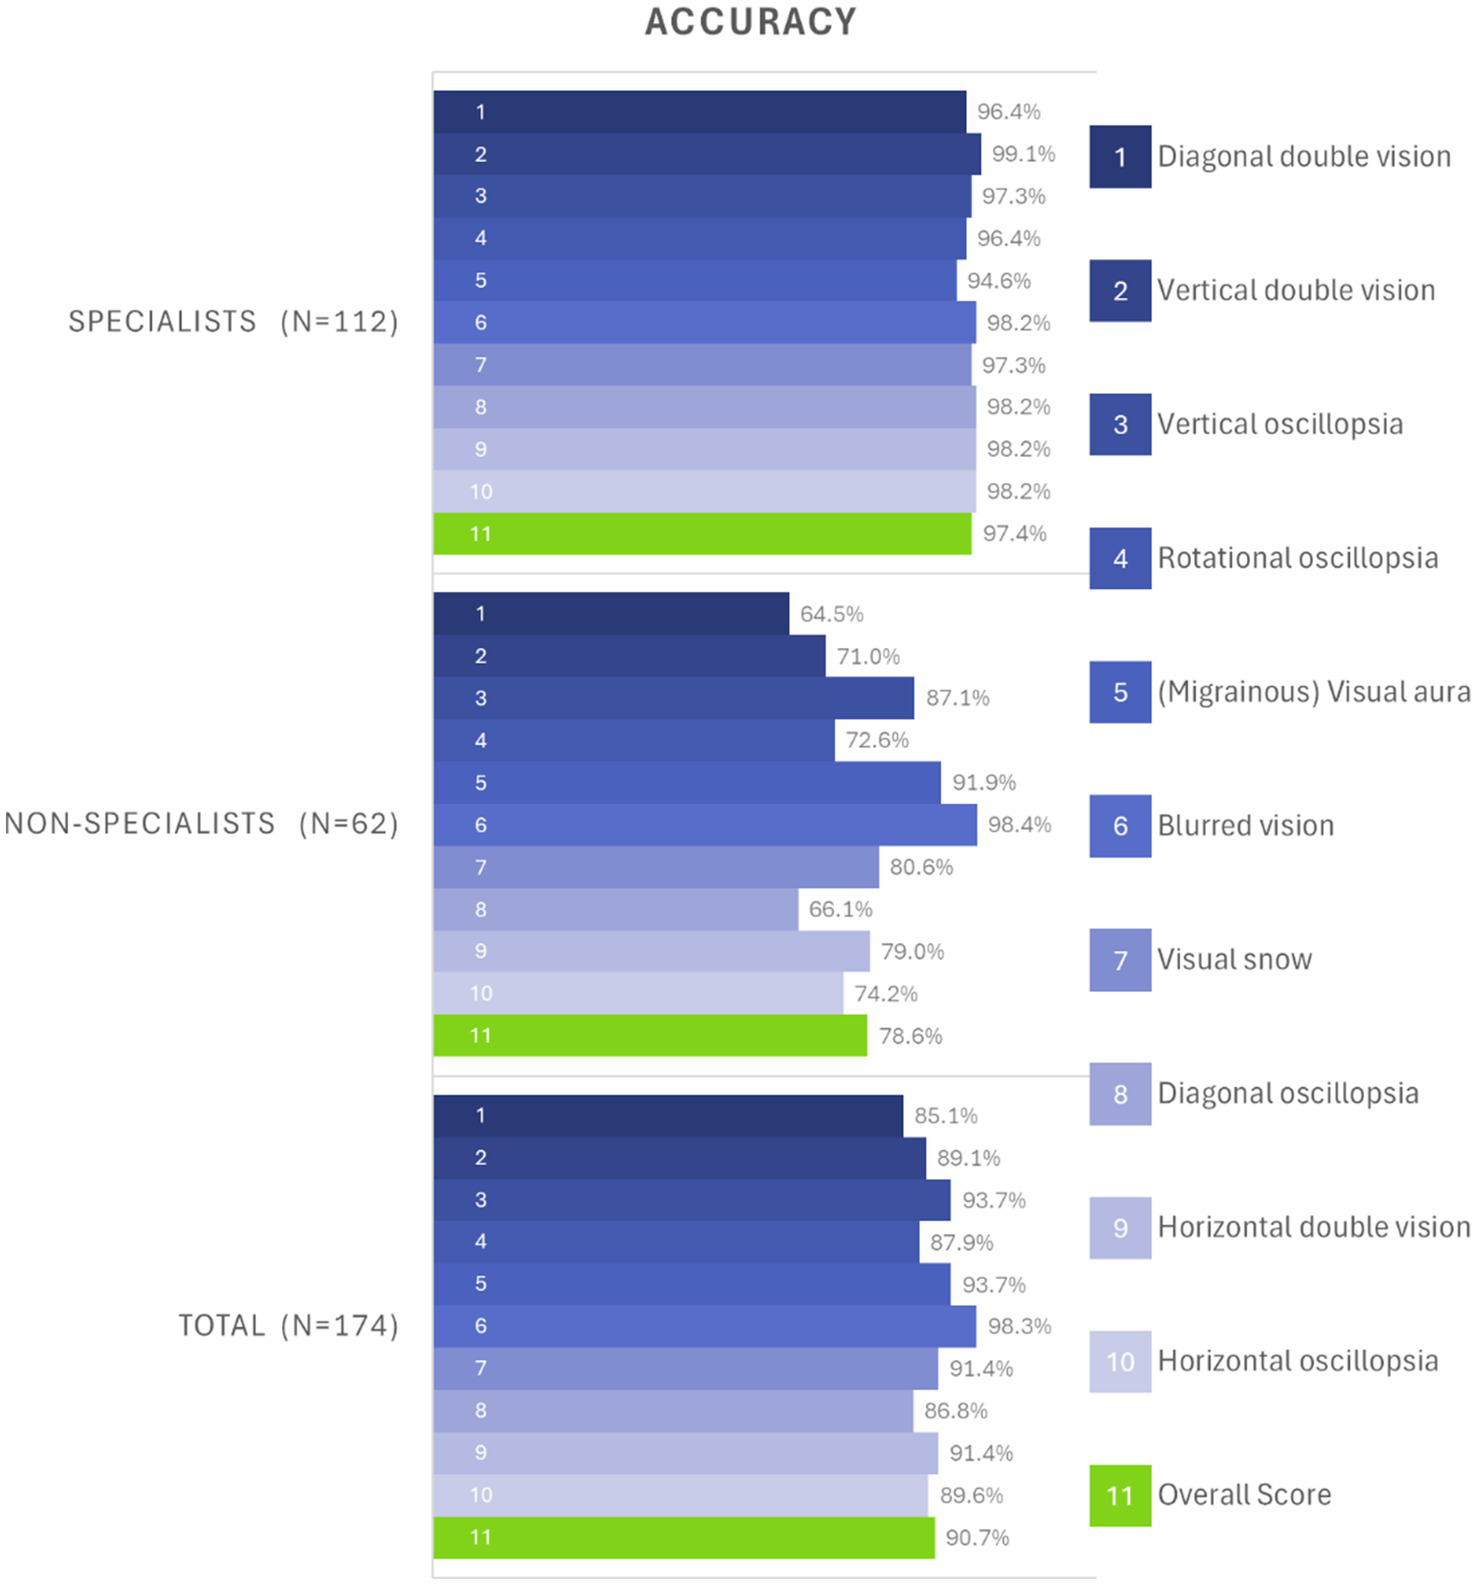
Bar chart of overall accuracy rates per pictogram, divided by specialists (top), non-specialists (center), and grouped from all participants (bottom). The 10 different test items are depicted in shades of blue, and the overall average score is depicted in green. For example, test item 3 (“vertical oscillopsia”) was correctly identified by 97.3% of specialists (third row of top chart), and by 87.1% of non-specialists (third row of center chart). Note that the non-specialists were given a simple English description of the symptom (“Your surroundings appear to be moving up and down” instead of “vertical oscillopsia”). While some pictograms were easily understandable by non-specialists (e.g., “(Migrainous) Visual aura” and “Blurred vision”), others were difficult to tell apart (e.g., “Diagonal oscillopsia” and “Diagonal double vision”) for the non-specialists.
The specialists significantly outperformed the non-specialists in the overall score. The participant gender did not constitute a significant factor for the overall success rate in either the specialist or non-specialist populations (independent samples t-test: n.s.).
Among specialists, the mean score for female participants was 9.8 out of 10 (SD = 0.5; 95% CI: 9.7–9.9), and for male participants, 9.6 (SD = 0.6; 95% CI: 9.4–9.8) (p = 0.086). Similarly, among non-specialists, female participants showed a mean score of 7.7 (SD = 2.0; 95% CI: 7.1–8.3), and male participants 8.1 out of 10 (SD = 2.7; 95% CI: 7.0–9.2) (p = 0.47). The two participants who chose “prefer not to say” were excluded from the gender-based analysis. Figure 2 shows the accuracy for each pictogram, globally and per specialty while Figure 3 shows the distribution of rate of correctly identified pictograms per participant (0–10), grouped by expertise level (specialists vs. non-specialists).
Figure 3
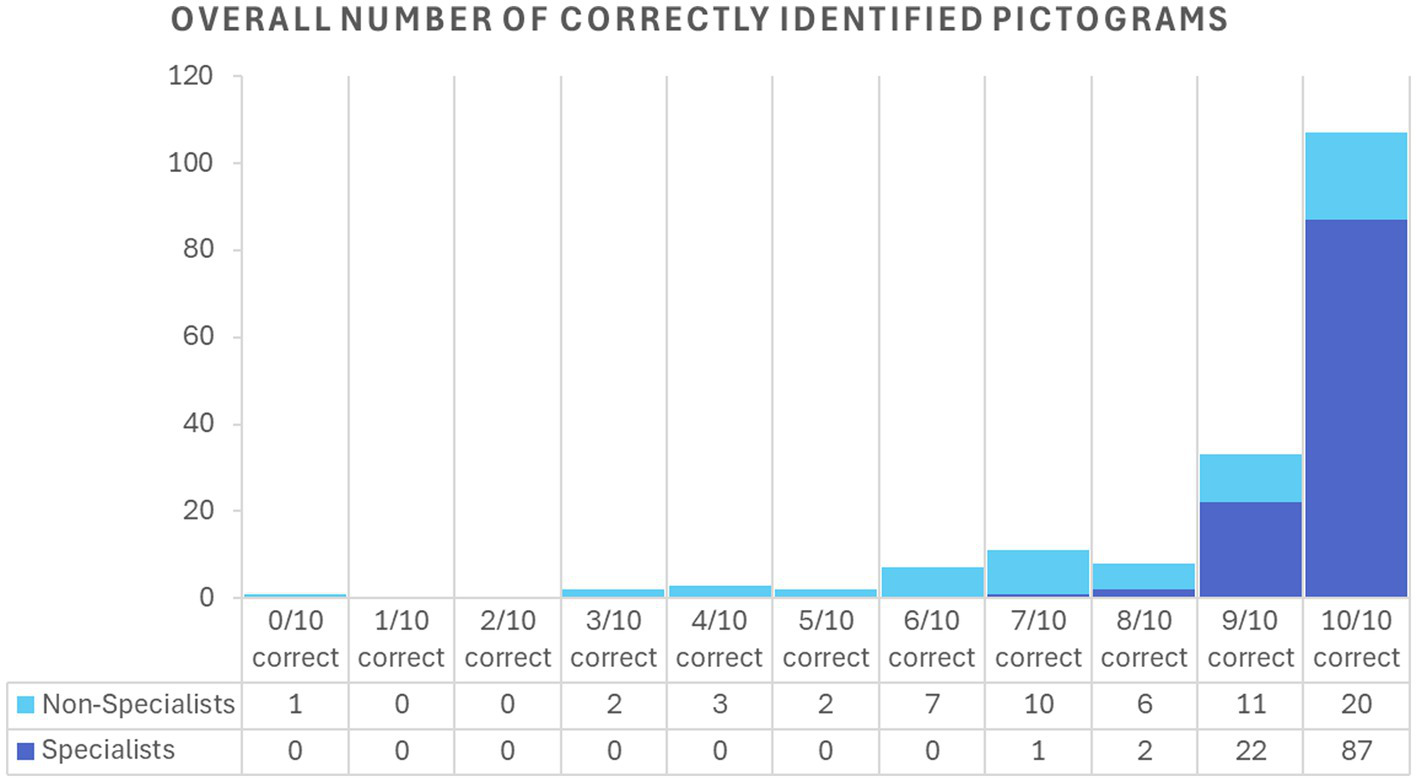
Distribution of the overall number of correctly identified pictograms per expertise level.
Discussion
In this first feasibility study, participants with and without prior expertise in diagnosing neuro-ophthalmological and neuro-otological disorders showed good to excellent accuracy in correctly matching pictograms of common visual-perceptual disturbances to their corresponding medical symptoms. The pictograms effectively conveyed their intended meaning, regardless of participant’s native language or gender.
Overall, specialists demonstrated a near-perfect accuracy rate of 97% in identifying medical symptoms using pictograms. In contrast, the non-specialist group exhibited a significantly lower accuracy rate of 79%, which is still within the range considered as “good” accuracy (23). However, two pictograms did not meet the ISO criterion; both involve diagonal visual disturbances. This lower rate partially stems from the study design: non-specialists especially struggled in differentiating visualizations of oscillopsia and diplopia, which are naturally difficult to visualize using static pictograms only. Here, video depictions might result in higher accuracy rates. In a similar approach, Holly et al. could show how using video language can aid patients with BPPV to communicate their experiences (24). Another potential factor could lie in the text descriptions of each symptom, which might have been difficult to understand for non-specialists. In future versions of the descriptions, the readability should therefore be improved, e.g., by rephrasing the descriptions for diagonal oscillopsia and diagonal double vision, which were the most problematic. Furthermore, for people unfamiliar with ocular motor disorders, the difference between oscillopsia and diplopia might be difficult to grasp without further explanation. This, however, might not be the case for actual patients experiencing these symptoms, who might solely struggle to exactly verbalize their individual complaints. Especially in cases of complex symptomatology and long patient journeys, patients tend to gradually become better at communicating their symptoms (25). POVSS might therefore be useful as a fast, visual aid for clinicians, helping patients to express their subjective complaints. It should be noted that POVSS is, however, not meant as a standalone, unsupervised diagnostic tool.
There are several limitations to this study. Firstly, participants were predominantly European, despite efforts to contact societies in various countries. While the sample still remains relatively diverse, encompassing 30 different nationalities and 17 distinct primary languages, roughly half of the participants were French. Follow-up investigations might be needed to ensure POVSS understandability in currently underrepresented countries or nationalities.
Secondly, only English-speaking participants were recruited. Although the inclusion criteria required a proficient level of English, participants’ language skills were not formally assessed. This lack of assessment may have influenced the accuracy of the responses, particularly in the non-specialist cohort. Additionally, the descriptions provided to specialists and non-specialists differed. The descriptions used for specialists included medical terminology, whereas those for non-specialists used non-medical language. These descriptions were developed by medical experts based on their experience with patients, and are currently only available in English language. Before conducting future studies in an international patient cohort, a cross-cultural translation and validation (26) of the item descriptions is therefore needed.
In addition, the purpose of this study was to determine whether the pictograms effectively convey their intended meaning before proceeding with clinical validation. Therefore, no patients were recruited. Research in clinical settings is mandatory to test the applicability and usefulness of the scale. This might be mostly relevant in an emergency care setting, where vestibular symptoms (and associated ocular motor and visual signs) are common, yet difficult, complaints to stratify (8, 27). Here, multiple potentials pitfalls need to be considered: for example, patients with cognitive impairment or patients with lower formal education levels might struggle to understand the test instructions, especially in an unsupervised implementation of POVSS. Furthermore, patients with severe visual impairment due to an ophthalmologic disorder (e.g., glaucoma), might find it hard to use the scale. Another potential limitation might be due to spatial orientation deficits, which are a common part of vestibular disorders (28, 29): due to spatial disorientation, patients might find it difficult to clearly indicate the direction of a visual disturbance. Future studies in patients are therefore needed. These could investigate both the diagnostic value of POVSS, i.e., from the clinicians’ perspective, as well as the perceived simplification of symptom communication from the patients’ perspective.
In conclusion, this feasibility study, based on evaluations from both specialists and non-specialists, demonstrated that the pictograms effectively conveyed common ocular motor and visual-perceptual symptoms. The next step will be to assess the validity of these pictograms in real-world clinical settings with patients who actually experience such symptoms.
Statements
Data availability statement
The raw data supporting the conclusions of this article will be made available by the authors, without undue reservation.
Ethics statement
The studies involving humans were approved by the ethical committee of Maastricht University Medical Center (METC 2024–0462). The studies were conducted in accordance with the local legislation and institutional requirements. The participants provided their written informed consent to participate in this study.
Author contributions
AM: Supervision, Writing – review & editing, Methodology, Software, Investigation, Writing – original draft, Conceptualization, Visualization, Formal analysis, Validation, Data curation, Project administration, Resources. RV: Project administration, Methodology, Validation, Funding acquisition, Writing – original draft, Writing – review & editing, Supervision. EA: Writing – review & editing, Writing – original draft. OC: Writing – original draft, Writing – review & editing. CC: Writing – original draft, Writing – review & editing. WH: Writing – review & editing, Writing – original draft. CH: Writing – review & editing, Writing – original draft. JJ: Writing – review & editing, Writing – original draft. EK: Writing – original draft, Writing – review & editing. HK: Writing – review & editing, Writing – original draft. NK: Conceptualization, Writing – review & editing, Writing – original draft. CL: Writing – review & editing, Writing – original draft. LL: Writing – review & editing, Writing – original draft. DM: Writing – review & editing, Writing – original draft. DP: Writing – review & editing, Writing – original draft. MSp: Writing – review & editing, Writing – original draft. LV: Writing – review & editing, Writing – original draft. EG: Writing – review & editing, Writing – original draft. KJ: Writing – review & editing, Writing – original draft. MSt: Writing – review & editing, Writing – original draft. SV: Writing – original draft, Formal analysis, Validation, Writing – review & editing, Software, Methodology. AZ: Conceptualization, Visualization, Resources, Project administration, Supervision, Writing – review & editing, Methodology, Writing – original draft, Funding acquisition, Validation. JG: Funding acquisition, Conceptualization, Methodology, Supervision, Writing – review & editing, Formal analysis, Writing – original draft, Investigation, Software, Project administration, Visualization, Data curation, Resources, Validation.
Funding
The author(s) declare that financial support was received for the research and/or publication of this article. This work was supported by BMBF (ID: 01 EO 1401).
Acknowledgments
We thank all involved members of the DIZZYNET (https://www.dizzynet.eu/dizzynet) for their support. We also sincerely thank the Vestibular Pathophysiology Research Group, a French federative research group (https://gdrvertige.com/en), for publicly sharing the link to the questionnaire with their network. Lastly, we thank all participants who filled out the survey.
Conflict of interest
The authors declare that the research was conducted in the absence of any commercial or financial relationships that could be construed as a potential conflict of interest.
The author(s) declared that they were an editorial board member of Frontiers, at the time of submission. This had no impact on the peer review process and the final decision.
Generative AI statement
The authors declare that Gen AI was used in the creation of this manuscript. LLM AI was utilized solely for grammar correction, spelling adjustments, and improving readability.
Publisher’s note
All claims expressed in this article are solely those of the authors and do not necessarily represent those of their affiliated organizations, or those of the publisher, the editors and the reviewers. Any product that may be evaluated in this article, or claim that may be made by its manufacturer, is not guaranteed or endorsed by the publisher.
Supplementary material
The Supplementary material for this article can be found online at: https://www.frontiersin.org/articles/10.3389/fneur.2025.1636002/full#supplementary-material
Footnotes
References
1.
Leigh RJ Zee DS . The neurology of eye movements, 5 edn, contemporary neurology series. New York: Oxford Academic (2015). doi: 10.1093/med/9780199969289.001.0001
2.
Gerb J Brandt T Huppert D . Historical descriptions of nystagmus and abnormal involuntary eye movements in various ancient cultures. Sci Prog. (2023) 106:00368504231191986. doi: 10.1177/00368504231191986
3.
Strobl R Grözinger M Zwergal A Huppert D Filippopulos F Grill E . A set of eight key questions helps to classify common vestibular disorders—results from the DizzyReg patient registry. Front Neurol. (2021) 12:670944. doi: 10.3389/fneur.2021.670944
4.
van de Berg R Kingma H . History taking in non-acute vestibular symptoms: a 4-step approach. J Clin Med. (2021) 10:5726. doi: 10.3390/jcm10245726
5.
Bisdorff A. (2016). Vestibular symptoms and history taking. Handb Clin Neurol. 137:83–90. doi: 10.1016/B978-0-444-63437-5.00006-6
6.
Newman-Toker DE . Symptoms and signs of neuro-otologic disorders. Continuum. (2012) 18:1016–40. doi: 10.1212/01.CON.0000421618.33654.8a
7.
Newman-Toker DE Edlow JA . TiTrATE: a novel, evidence-based approach to diagnosing acute dizziness and Vertigo. Neurol Clin. (2015) 33:577–99, viii. doi: 10.1016/j.ncl.2015.04.011
8.
Zwergal A Dieterich M . Vertigo and dizziness in the emergency room. Curr Opin Neurol. (2020) 33:117–25. doi: 10.1097/wco.0000000000000769
9.
O'Toole JK Alvarado-Little W Ledford CJW . Communication with diverse patients: addressing culture and language. Pediatr Clin N Am. (2019) 66:791–804. doi: 10.1016/j.pcl.2019.03.006
10.
Fleisher J Bhatia R Margus C Pruitt A Dahodwala N . Health literacy and medication awareness in outpatient neurology. Neurol Clin Pract. (2014) 4:71–81. doi: 10.1212/01.CPJ.0000436211.73013.ab
11.
Newman-Toker DE Nassery N Schaffer AC Yu-Moe CW Clemens GD Wang Z et al . Burden of serious harms from diagnostic error in the USA. BMJ Qual Saf. (2024) 33:109–20. doi: 10.1136/bmjqs-2021-014130
12.
Iwayama T Mizuno K Yildiz E Lim K-S Yi SM Lynn YJ et al . A multicultural comparative study of self-stigma in epilepsy: differences across four cultures. Epilepsia Open. (2024) 9:2283–93. doi: 10.1002/epi4.13051
13.
Jost J Millogo A Preux PM . Antiepileptic treatments in developing countries. Curr Pharm Des. (2017) 23:5740–8. doi: 10.2174/1381612823666170809103202
14.
Nyblade L Stockton MA Giger K Bond V Ekstrand ML Lean RM et al . Stigma in health facilities: why it matters and how we can change it. BMC Med. (2019) 17:25. doi: 10.1186/s12916-019-1256-2
15.
Stunkel L Newman-Toker DE Newman NJ Biousse V . Diagnostic error of neuro-ophthalmologic conditions: state of the science. J Neuroophthalmol. (2021) 41:98–113. doi: 10.1097/wno.0000000000001031
16.
Stunkel L Sharma RA Mackay DD Wilson B Van Stavern GP Newman NJ et al . Patient harm due to diagnostic error of neuro-ophthalmologic conditions. Ophthalmology. (2021) 128:1356–62. doi: 10.1016/j.ophtha.2021.03.008
17.
Muro-Fuentes EA Stunkel L . Diagnostic error in neuro-ophthalmology: avenues to improve. Curr Neurol Neurosci Rep. (2022) 22:243–56. doi: 10.1007/s11910-022-01189-4
18.
Houts PS Doak CC Doak LG Loscalzo MJ . The role of pictures in improving health communication: a review of research on attention, comprehension, recall, and adherence. Patient Educ Couns. (2006) 61:173–90. doi: 10.1016/j.pec.2005.05.004
19.
Mbanda N Dada S Bastable K Ingalill GB Ralf WS . A scoping review of the use of visual aids in health education materials for persons with low-literacy levels. Patient Educ Couns. (2021) 104:998–1017. doi: 10.1016/j.pec.2020.11.034
20.
Schubbe D Scalia P Yen RW Saunders CH Cohen S Elwyn G et al . Using pictures to convey health information: a systematic review and meta-analysis of the effects on patient and consumer health behaviors and outcomes. Patient Educ Couns. (2020) 103:1935–60. doi: 10.1016/j.pec.2020.04.010
21.
Zwergal A Brandt T Magnusson M Kennard C . DIZZYNET: the European network for vertigo and balance research. J Neurol. (2016) 263:1. doi: 10.1007/s00415-015-7920-3
22.
Berthenet M Vaillancourt R Pouliot A . Evaluation, modification, and validation of pictograms depicting medication instructions in the elderly. J Health Commun. (2016) 21:27–33. doi: 10.1080/10810730.2015.1133737
23.
Šimundić AM . Measures of diagnostic accuracy: basic definitions. Ejifcc. (2009) 19:203–11.
24.
Holly JE Cohen HS Masood MA . (2019). Assessing misperception of rotation in benign paroxysmal positional vertigo with static and dynamic visual images. J Vestib Res. (2019) 29:271–9. doi: 10.3233/VES-190676
25.
Jeske M James J Joyce K . Diagnosis and the practices of patienthood: how diagnostic journeys shape illness experiences. Sociol Health Illn. (2024) 46:225–41. doi: 10.1111/1467-9566.13614
26.
Sperber AD Devellis RF Boehlecke B . Cross-cultural translation: methodology and validation. J Cross-Cult Psychol. (1994) 25:501–24. doi: 10.1177/0022022194254006
27.
Ohle R Savage DW Roy D McIsaac S Singh R Lelli D et al . Development of a clinical risk score to risk stratify for a serious cause of Vertigo in patients presenting to the emergency department. Ann Emerg Med. (2025) 85:122–31. doi: 10.1016/j.annemergmed.2024.06.003
28.
Gerb J Brandt T Dieterich M . A clinical 3D pointing test differentiates spatial memory deficits in dementia and bilateral vestibular failure. BMC Neurol. (2024) 24:75. doi: 10.1186/s12883-024-03569-4
29.
Zwergal A Grabova D Schöberl F . Vestibular contribution to spatial orientation and navigation. Curr Opin Neurol. (2024) 37:52–8. doi: 10.1097/WCO.0000000000001230
Summary
Keywords
oscillopsia, vertigo, visual disorder, nystagmus, diplopia, health communication, neuro-otology
Citation
Melliti AA, Van de Berg R, Anagnostou E, Cakrt O, Chabbert C, Heide W, Helmchen C, Jerabek J, Kentala E, Kerkeni H, Koohi N, Lopez C, Luis L, Meldrum D, Pavlovic D, Spiegelberg M, Vereeck L, Grill E, Jahn K, Striteska M, Vanbelle S, Zwergal A and Gerb J (2025) Introducing the pictogram-based ocular motor and visual-perceptual symptom scale: a multinational, cross-cultural feasibility study. Front. Neurol. 16:1636002. doi: 10.3389/fneur.2025.1636002
Received
27 May 2025
Accepted
14 July 2025
Published
29 July 2025
Volume
16 - 2025
Edited by
Hubertus Axer, Jena University Hospital, Germany
Reviewed by
Cristian Aedo Sanchez, University of Chile, Chile
Helen S. Cohen, Baylor College of Medicine, United States
Updates
Copyright
© 2025 Melliti, Van de Berg, Anagnostou, Cakrt, Chabbert, Heide, Helmchen, Jerabek, Kentala, Kerkeni, Koohi, Lopez, Luis, Meldrum, Pavlovic, Spiegelberg, Vereeck, Grill, Jahn, Striteska, Vanbelle, Zwergal and Gerb.
This is an open-access article distributed under the terms of the Creative Commons Attribution License (CC BY). The use, distribution or reproduction in other forums is permitted, provided the original author(s) and the copyright owner(s) are credited and that the original publication in this journal is cited, in accordance with accepted academic practice. No use, distribution or reproduction is permitted which does not comply with these terms.
*Correspondence: Johannes Gerb, Johannes.gerb@med.uni-muenchen.de
Disclaimer
All claims expressed in this article are solely those of the authors and do not necessarily represent those of their affiliated organizations, or those of the publisher, the editors and the reviewers. Any product that may be evaluated in this article or claim that may be made by its manufacturer is not guaranteed or endorsed by the publisher.