Abstract
Objective:
This meta-analysis aimed to evaluate the association between perceived psychosocial stress and stroke.
Methods:
We systematically searched PubMed, Web of Science, Embase and Cochrane Library until March 2025. Published studies reporting adjusted odds ratios (ORs), hazard ratios (HRs), or relative risks (RRs) for stroke in perceived psychosocial stress versus non-perceived psychosocial stress individuals and perceived stress in stroke versus non-stroke individuals were included. A random-effects model was used to pool effect estimates, with heterogeneity assessed via the chi-square test based on Cochrane Q statistics. Subgroup evaluations were conducted for stroke type (ischemic/hemorrhagic), region, and sex.
Results:
Eleven case–control studies were included, with the case group comprising stroke patients (n = 21,024) and the control group consisting of healthy individuals matched for other characteristics (n = 22,408). Meta-analysis revealed a higher incidence of perceived psychosocial stress in the stroke population compared to the control group (RR = 1.58, 95% CI [1.17–1.80], p < 0.00001, I2 = 84%), with statistically significant differences. Subgroup analyses were conducted for regions: Europe and America (RR = 1.53, 95% CI [1.19–1.95], p = 0.0007); Asia (RR = 2.10, 95% CI [1.37–2.91], p = 0.0006); stroke types: ischemic stroke (RR = 1.58, 95% CI [1.30–1.91], p < 0.0001); hemorrhagic stroke (RR = 1.43, 95% CI [1.33–1.53], p < 0.00001); Sex: Male (RR = 1.58, 95% CI [1.44–1.73], p < 0.00001); Female (RR = 1.38, 95% CI [1.27–1.51], p < 0.00001); and Age < 50 years (RR = 1.50, 95% CI [1.24–1.83], p < 0.0001). Fourteen prospective cohort studies were included, with 107,741 participants in the perceived stress group and 69,784 in the control group. The results showed that the perceived stress group had a higher probability of stroke than the control group, but the difference was not statistically significant (RR = 1.29, 95% CI [0.83–2.02], p = 0.26, I2 = 99%). Subgroup analyses for Europe and America (RR = 1.65, 95% CI [0.88–3.07], p = 0.12) and Asia (RR = 1.06, 95% CI [0.82–1.38], p = 0.64) also showed no statistically significant differences. No significant associations were found for ischemic stroke (RR = 0.94, 95% CI [0.75–1.17], p = 0.57), hemorrhagic stroke (RR = 0.97, 95% CI [0.73–1.29], p = 0.83), or by Sex (Male: RR = 1.95, 95% CI [0.87–4.36], p = 0.11; Female: RR = 0.59, 95% CI [0.18–1.96], p = 0.39).
Conclusion:
Meta-analysis of case–control studies demonstrated that perceived psychosocial stress is a risk factor for stroke, ischemic stroke, and hemorrhagic stroke in both Europe/America and Asia, regardless of sex, particularly among stroke patients Age < 50. However, prospective cohort studies revealed no significant differences in the probability of stroke, ischemic stroke, or hemorrhagic stroke between the perceived stress and control groups across regions (Europe/America and Asia) and Sex (males and females).
Meta-analysis registration:
PROSPERO2025; https://www.crd.york.ac.uk/PROSPERO/view/CRD420251012354.
1 Introduction
Stroke affects up to one in five people during their lifetime in some high-income countries, and up to almost one in two in low-income countries. Globally, it is the second leading cause of death, stroke includes ischemic stroke and hemorrhagic stroke, ischemic strokes constitute between 60 and 70% of all strokes and result from an acute arterial occlusion (1). Psychological or psychosocial stress occurs when an individual perceives that environmental demands tax or exceed his or her adaptive capacity. Studies of psychological stress focus either on the occurrence of environmental events that are consensually judged as taxing one’s ability to cope or on individual responses to events that are indicative of this overload, such as perceived stress and event-elicited negative affect. Widespread public belief that psychological stress leads to disease, as clinical depression, cardiovascular disease, human immunodeficiency virus (HIV)/AIDS, and cancer (2). Although the increasing prevalence of stroke and psychological stress has led to numerous clinical studies reporting correlations between perceived stress and stroke, whether psychological stress constitutes a high-risk factor for stroke remains inconclusive. Therefore, a meta-analysis was conducted to evaluate the association between psychological stress and stroke.
2 Methods
2.1 Search strategy
The meta-analysis was conducted in strict accordance with the PRISMA (Preferred Reporting Items for Systematic Reviews and Meta-Analyses) guidelines (3). The study protocol has been registered in the International Prospective Register of Systematic Reviews (PROSPERO - registration number: CRD420251012354). Based on the PRISMA guidelines, we performed a systematic search of online databases (PubMed, Web of Science, Embase and the Cochrane Library) before March 2025. The following search terms were used in our search strategies: (‘stroke’ or ‘brain ischemic’ or ‘transient brain ischemia’ or ‘cerebra arterial disease’ or ‘ischemic stroke’ or ‘non-ischemic stroke’ or ‘Hemorrhage stroke’ or ‘cerebrovascular accident’ or ‘cerebrovascular disorders’ or ‘TIA’ or ‘intracerebral hemorrhage’ or ‘brain Infarction’) AND (‘psychological stress’ or ‘psychosocial stress ‘or ‘psychological distress’ or ‘stress’).
2.2 Inclusion criteria
The identified studies were included for the meta-analysis if they fulfilled the following criteria: (1) Only peer-reviewed published literature, including observational studies (cohort studies and case–control studies) and randomized controlled trials (RCTs); (2) Based on human subjects; (3) Exposure factors were perceived stress, perceived psychosocial stress, or stroke, with clearly defined diagnostic criteria for stroke and perceived psychological/social stress; (4) Each study must include either a stroke patient group with a non-stroke control group, or a perceived psychosocial stress group with a non-perceived psychosocial stress control group, and provide effect estimates (relative risk [RR], odds ratio [OR], or hazard ratio [HR]) with corresponding 95% confidence intervals (CI) for the association between perceived stress and stroke risk, or sufficient raw data to calculate these estimates.
2.3 Exclusion criteria
In the process of literature screening, the following items of research were excluded: (1) case reports, conference abstracts, review papers, editorials, commentaries; (2) non-English literature; (3) articles without sufficient data to assess the association between psychological stress and stroke risk.
2.4 Data abstraction and quality assessment
All data were independently extracted by two reviewers using a standardized data collection table. Discrepancies in data extraction were resolved by consensus. We extracted the following data from each study: first author’s name, publication year, region, Grade the degree of stress, length of follow-up, Sex, Stroke subtype measurement, the quality of each study was assessed by the Newcastle–Ottawa Scale (NOS), a standard commonly used to assess quality in cohort studies (4). The scoring system consisted of three parts: population selection, comparability between groups, and exposure factors. Results ranged from 0 to 9, with higher scores indicating better quality of the method (Table 1).
Table 1
| Case–control studies | |||||||
|---|---|---|---|---|---|---|---|
| First author (year) | Region | Previous stroke excluded | Grade the degree of stress | Stroke subtype measurement | Sex | NOS score | |
| 1 | Holm, 2025 (5) | Sweden | Yes | No | No | – | 9 |
| 2 | Kutal, 2025 (6) | 19 centers in European | Yes | Yes | No | M/F | 7 |
| 3 | Maalouf, 2023 (14) | Lebanon | Yes | No | Yes (ischemic) | – | 9 |
| 4 | Reddin, 2022 (7) | Asia, USA… (32 countries) | Yes | Yes | Yes (both) | – | 9 |
| 5 | Prasad, 2020 (15) | India | Unknown | No | No | M/F | 7 |
| 6 | Sarfo, 2018 (13) | 15 centers in Nigeria and Ghana | Yes | No | No | – | 9 |
| 7 | Wilde, 2018 (8) | Netherlands | Yes | Yes | YES (hemorrhagic) | – | 9 |
| 8 | Egido, 2012 (9) | Spain | Yes | Yes | No | – | 8 |
| 9 | O’Donne, 2010 (12) | 84 centers in Argentina, Australia… (22 countries) | Yes | No | Yes (both) | – | 9 |
| 10 | Jood, 2009 (10) | Sweden | Unknown | Yes | Yes (ischemic) | – | 9 |
| 11 | Abel, 1999 (11) | USA | Yes | Yes | Yes (ischemic) | – | 9 |
| Prospective cohort studies | |||||||
|---|---|---|---|---|---|---|---|
| First author (year) | Region | Follow-up years (y) | Grade the degree of stress | Stroke subtype measurement | Sex | NOS score | |
| 1 | Li, 2022 (16) | China | 4.5 | Yes | Yes (both) | – | 8 |
| 2 | Hagström, 2018 (17) | Sweden, USA… (39 countries) | 3.7 | No | No | – | 8 |
| 3 | Susan, 2014 (18) | USA | 8.5 | Yes | Yes (ischemic) | M/F | 9 |
| 4 | Molshatzki, 2013 (19) | Israel | 28.1 | Yes | No | – | 8 |
| 5 | Henderson, 2013 (20) | USA | 6 | Yes | No | – | 8 |
| 6 | Suadicani, 2011 (21) | Denmark | 30 | No | No | M | 7 |
| 7 | Kornerup, 2010 (22) | Denmark | 6–9 | Yes | Yes (ischemic) | – | 9 |
| 8 | Tsutsumi, 2009 (23) | Japan | 11 | Yes | Yes (both) | M/F | 9 |
| 9 | Harmsen, 2006 (24) | Sweden | 28 | No | No | M | 8 |
| 10 | Ohlin, 2004 (25) | Sweden | 21 | Yes | No | M/F | 8 |
| 11 | Truelsen, 2003 (26) | Denmark | 14–16 | Yes | No | – | 9 |
| 12 | Iso, 2002 (27) | Japan | 7.9 | Yes | Yes (both) | M/F | 9 |
| 13 | Macleod, 2001 (28) | UK | 21 | Yes | No | – | 8 |
| 14 | Susan, 2001 (50) | Finland | 11 | Yes | Yes (both) | M | 7 |
Characteristics of included case-control studies and prospective cohort studies.
NOS, Newcastle–Ottawa Scale; M, male; F, female.
2.5 Statistical analysis
Results from cohort studies and case–control studies are usually expressed in terms of relative risk (RR). Heterogeneity among studies was assessed using the chi-square test based on Cochrane Q statistics at p < 0.05 level of significance, and quantification of heterogeneity was made by the I2 metric, which describes the estimated percentage of variability for effects due to differences rather than chance. When I2 > 50%, there was significant statistical heterogeneity in this study. To explore possible explanations for homogeneity and test the robustness of the association between psychological stress and risk of stroke, we conducted sensitivity analyses and subgroup analyses by stroke type, region, sex, questionnaire. To identify possible sources of heterogeneity, a meta-regression analysis was conducted by including covariates such as stroke type, region, sex, questionnaire. Publication bias was evaluated visually by creating funnel plots via Review Manager 5.4 version (Cochrane Collaboration, Oxford, UK),as well as by conducting Egger’s regression test using Stata 18.0 Version (Stata Corp, College Station, TX, USA) for outcomes with 10 or more include studies p value < 0.05 was considered as statistically significant publication bias. Cochrane Review The goal of the study was to carry out two separate analyses for the two distinct study designs (i.e., case–control studies and prospective cohort study) identified during our review. A sensitivity analysis was performed, based on excluding one study at a time, to examine the impact of each exclusion on the pooled estimates and variances of the included studies. Manager (Version 5.4) software and Stata 18.0 were used to conduct the meta-analysis and obtain graphical output. p values were 2-sided and p < 0.05 was considered statistically significant.
3 Results
3.1 Study characteristics
The systematic search identified 4,320 articles from online databases that were subsequently examined on title and abstract. Figure 1 shows the stages in obtaining studies for inclusion in the review. Finally, a total of 25 articles with 14 prospective cohort studies and 11 case–control studies were included in the meta-analysis. The Newcastle–Ottawa Scale was uniformly applied to assess methodological quality across all 25 included studies (Table 1).
Figure 1

Literature screening flow chart. Prospective cohort studies case–control studies.
Eleven case–control studies were included, with distribution as follows: by region—7 studies in Europe/America (5–11), 3 in Asia (8, 9, 12), and 2 in Africa (7, 13); by stroke type—7 ischemic strokes (6, 7, 10–12, 14, 15) and 3 hemorrhagic strokes (7, 8, 12); by Sex—2 Male (6, 7) and 2 Female (6, 7); 9 studies with perceived stress questionnaire scores or severity grade (5–12, 14); and 3 studies focusing on participants aged < 50 years (6, 7, 13) (Table 2).
Table 2
| Author year | Region | Stroke group: control group | No. of perceived stress, stroke group: control group | Questionnaire |
|---|---|---|---|---|
| 1. Holm, 2025 (5) | Sweden | Stroke: control = 50: 100 | Stroke: control = 36: 52 | Yes |
| 2. Kutal, 2025 (6) | 19 European centers were included | Ischemic stroke: control (total) = 426: 426; ischemic stroke: control (Female) = 203: 203; ischemic stroke: control (Male) = 223: 223; age < 40, ischemic stroke: control = 188: 188; age ≥ 40 ischemic stroke: control = 238: 238 | At least moderate stress (total) (Q2 + Q3) = 197: 142; high perceived stress (Total) (Q3) = 18: 7; at least moderate stress (female) (Q2 + Q3) = 117: 84; High perceived stress (female) (Q3) = 14: 6. At least moderate stress (male) = 80: 58; high perceived stress (male) = 4: 1. Age < 40, At least moderate stress = 90: 63; high perceived stress = 9: 3. Age ≥ 40岁 At least moderate stress = 107: 79. High perceived stress = 9: 4 Q2 Q3 as stress | Yes |
| 3. Maalouf, 2023 (14) | Lebanon | Ischemic stroke: control = 113: 451 | Ischemic stroke: control = 31: 62 | Yes |
| 4. Reddin, 2022 (7) | 32 countries in Asia, America, Europe, Australia, the Middle East, and Africa | Cases: controls = 13,350: 13,462, Europe + America, cases (stress event): controls (stress event) = 1,240 (902): 1,169 (679); Africa, cases (stress event): controls (stress event) = 351 (265): 337 (248); Asia, cases (stress event): controls (stress event) = 5,551 (1,204): 5,377 (735) | None (Q0) or some periods (Q1) = 10,605: 11,529. Several periods (Q2) or permanent (Q3) = 2,745: 1,933; Q2 Q3 as stress, general stress never (Ischemic, ICH, Control) = 2,772: 760: 4,217; some of the time (Ischemic, ICH, control) = 5,425: 1,615: 7,345; several periods/permanent (Ischemic, ICH, control) = 2,101: 633: 1,944. Age < 45 home stress, never (Ischemic: ICH: control) = 302: 116: 514; some of the time (Ischemic: ICH: control) = 620: 256: 909; several periods/permanent = 198: 75: 155. Men: never (Ischemic: ICH: control) = 2,211: 575: 3,330; some of the time (Ischemic: ICH: control) = 3,175: 1,007: 4,091; several periods/permanent = 750: 222: 615. Woman: never (Ischemic: ICH: control) = 1,236: 388: 1,916; some of the time (Ischemic: ICH: control) = 2,217: 618: 2,842; several periods/permanent = 719: 201: 671. | Yes |
| 5. Prasad, 2020 (15) | India | Ischemic stroke + ICH = 151: 151 (self-control) | Case: control = 38: 9 | No |
| 6. Sarfo, 2018 (13) | West Africans;15 sites in Nigeria and Ghana | Age < 50: ischemic stroke + ICH = 515: 515; Age ≥ 50: ischemic stroke + ICH = 1,603:1,603; total = 2,118: 2,118, | Age < 50, case: control = 134: 103; age ≥ 50, case: control = 369: 224; total = 503: 327. | No |
| 7. Wilde, 2018 (8) | Netherlands | UIA: ASAH: controls = 215: 467: 733 | Never (Q0): sometimes (Q1): often (Q2): always (Q3) = UIA 78: 79: 42: 16 (215); ASAH:186: 188: 71: 22 (467) control: 323: 307: 87: 16 (733), Q2 Q3 as stress | Yes |
| 8. Egido, 2012 (9) | Spain | Ischemic stroke + ICH = 150: 300 | Score > 300 (Q3) Case: control = 16:9; score ≥ 150–300 (Q2) case: control = 46:41; Score < 150 (Q1) = 88: 250 (no never case), Q2 Q3 as stress | Yes |
| 9. O’Donne, 2010 (12) | 22 countries | Ischemic stroke: ICH: control = 2,324: 654: 2,987 | Ischemic stroke: ICH: control = 465: 124: 440. | Yes |
| 10. Jood, 2009 (10) | Sweden | Ischemic stroke: control = 566: 593 | Cases/controls = never experienced stress (Q0) = 56: 51; some period of stress (Q1) = 136: 187; some period of stress during the last 5 years (Q2) = 89: 126; several periods of stress during the last 5 years = 159: 183; permanent stress during the last year (Q3) = 46: 17 permanent stress during the last 5 year (Q4) = 80: 29 Q3 Q4 as stress | Yes |
| 11. Abel, 1999 (11) | USA | Ischemic stroke: control = 655:1087 | Case: control = GSRRS score 1–159 (Q1) = 286:464; GSRRS score 160–239 (Q2) = 252:388 GSRRS score 240–399 (Q3) = 86:151 GSRRS score 480–(Q4) = 41:75. Q3 Q4 as stress | Yes |
Subgroup analysis characteristics of case–control studies.
No., number; Q0, questionnaire of perceived Stress never; Q1, questionnaire of perceived stress low or sometimes; Q2, questionnaire of perceived stress moderate or often; Q3, questionnaire of perceived stress high, Q4, questionnaire of perceived stress more than high or very serious; ICH, intracerebral hemorrhage; GSRRS, geriatric social readjustment rating scale.
Fourteen prospective cohort studies were included, among which 13 utilized perceived psychosocial stress questionnaires (16–28). Stratified by region, 7 studies were conducted in Europe and America (20–22, 24–26, 28) and 4 in Asia (16, 19, 23, 27). By stroke type, 4 studies reported ischemic stroke (16, 18, 22, 27) and 2 hemorrhagic stroke (16, 27). By Sex, 5 Males (21, 23–25, 27) and 3 Females (23, 25, 27) (Table 3).
Table 3
| Author year | Region | Stress group: control | No. of stroke in stress group: control group | PSS or other questionnaire |
|---|---|---|---|---|
| 1. Li, 2022 (16) | China | Psychological stress, high: medium: low = 1,189: 6,921: 12,578. | Stroke 636: high (Q2): medium (Q1): low (Q1) = 46: 197: 393: ischemic stroke, high: medium: low = 7: 164: 313. Hemorrhagic stroke, high: medium: low = 9: 33: 78; (Q2 Q1 as stress) | Yes |
| 2. Hagström, 2018 (17) | 39 countries | Psychological stress: rarely/never stress; = 8,694: 6,407 | Psychological stress: rarely/never stress = 281: 347 | Yes |
| 3. Susan, 2014 (18) | USA | Chronic stress score ≥ 2: chronic stress score 1: chronic stress score0 = 2,324: 2,098: 2,292 | Chronic stress score ≥ 2 (Q1): chronic stress score 1 (Q1): chronic stress score 0 (Q0) = 72:64:57. Ischemic stroke, high: low: never = 41: 40: 39 (Q2 Q1 as stress) | Yes |
| 4. Molshatzki, 2013 (19) | Israel | Hardship score: bottom (0–1), middle (2–4) and top (5–14):top: middle: bottom = 2,667: 4,421: 2,941 | Stroke, top (Q2): middle (Q1): bottom (Q0) = 194: 307: 164 (Q2 Q1 as stress) | Yes |
| 5. Henderson, 2013 (20) | USA | Quartiles of distress, 总计4,120; Q4: Q3: Q2: Q1 = 1,029: 1,031: 1,028: 1,032. Q1 = never; Q2 34 = stress | Stroke, Q4: Q3: Q2: Q1 = 210: 128: 117: 83. | Yes |
| 6. Suadicani, 2011 (21) | Denmark | Stress: control (rarely) = 1,069: 3,862 (all man) | Stroke, stress: control (rarely) = 309: 470 | Yes |
| 7. Kornerup, 2010 (22) | Denmark | Major life events (MLE), MLE > 4: MLE3-4: MLE1-2: MLE0 = 1,830: 1,403: 1,643: 1,643 | Ischemic stroke, MLE > 4 (Q3): MLE3-4 (Q2): MLE1-2 (Q1): MLE0 (Q0) = 97: 94: 79: 80 (Q3 Q2 as stress) | Yes |
| 8. Tsutsumi, 2009 (23) | Japan | Total, high: low = 1,638: 1,175. males, high: low = 813: 499; females, high: low = 825: 676 | Stroke, total, high: low = 43:18, males, high: low = 28:7. females, high: low = 15: 11 | Yes |
| 9. Harmsen, 2006 (24) | Sweden | Stress: control = 1,094: 5,737 (all man) | Stroke, stress: control = 540: 479 | Yes |
| 10. Ohlin, 2004 (25) | Sweden | Males, high: low: never = 1,583: 549: 8,489. Females, high: low: never = 353: 188: 2,118, total, high: low: never = 1,936: 737: 10,607. | Stroke, males, high (Q2): low (Q1): never (Q0) = 115: 30: 438. Females, high: low: never = 16: 3: 41; total, high: low: never = 131: 33: 479 (Q21 as stress) | Yes |
| 11. Truelsen, 2003 (26) | Denmark | Stress intensity: high: moderate: light: none = 716: 2,381: 4,521: 4,931 | Stroke, high (Q3): moderate (Q2): light (Q1): none (Q0) = 59: 173: 288: 408 (Q3 Q2 as stress) | Yes |
| 12. Iso, 2002 (27) | Japan | Perceived mental stress, male, high: medium: low = 6,891: 18,231: 5,058, female, high: medium: low = 8,656: 27,100: 7,488 | Male, total stroke, high (Q3): medium (Q2): low (Q1) = 60:198:83, male, hemorrhagic stroke, high: medium: low = 22: 55: 18. Male, ischemic stroke, high: medium: low = 23: 74: 32; female, total, high: medium: low = 67: 196:5 3. Hemorrhagic stroke, high: medium: low = 16: 44: 6, ischemic stroke, high: medium: low = 21: 59: 19 (Q3 Q2 as stress) | Yes |
| 13. Macleod, 2001 (28) | UK | Perceived stress, high: medium: low = 711: 2,912: 1,765 | Stroke; high (Q3): medium (Q2): low (Q1) = 16: 58: 48 (Q3 Q2 as stress) | Yes |
| 14. Susan, 2001 (50) | Finland | SBP > 19 mm Hg (high stress): SBP ≤ 19 mm Hg (low stress) = 2,268: 35 | High: low = 112: 1 | No |
Characteristics of subgroup analysis in prospective cohort studies.
No., number; Q0, questionnaire of perceived stress never; Q1, questionnaire of perceived stress low or sometimes; Q2, questionnaire of perceived stress moderate or often; Q3, questionnaire of perceived stress high; Q4, questionnaire of perceived stress more than high or very serious.
Eleven case–control studies and fourteen prospective cohort studies were included. Based on Questionnaire (Q) assessments or graded classifications of perceived psychosocial stress from the incorporated literature, the following criteria were applied for defining perceived stress groups: 1. Perceived stress (Q1): no perceived stress (Q0), with Q1 included in the perceived stress group. 2. High perceived stress (Q3): moderate perceived stress (Q2): low perceived stress (Q1), the perceived stress group (Q3 + Q2) versus the control group (Q1), with Q3 and Q2 included in the perceived stress group. 3. High perceived stress (Q3): moderate perceived stress (Q2): low perceived stress (Q1): no (or almost no) perceived stress (Q0), the perceived stress group (Q3 + Q2) versus the control group (Q0), with Q3 and Q2 included in the perceived stress group. 4. Extreme perceived stress (Q4): high perceived stress (Q3): moderate perceived stress (Q2): low perceived stress (Q1), the perceived stress group (Q4 + Q3) versus the control group (Q1), with Q4 and Q3 included in the perceived stress group.
3.2 Eleven case–control studies were included, comparing the occurrence of perceived psychosocial stress between stroke patients and healthy controls, to determine the association between perceived stress and stroke
3.2.1 Comparison of perceived stress between stroke populations and healthy controls
Eleven case–control studies were included, with an intervention group of stroke patients (n = 21,024) and a control group (n = 22,408) of healthy individuals matched to the intervention group for other characteristics. Significant heterogeneity was observed among studies (I2 = 84%). A random-effects model was employed for meta-analysis, revealing a statistically significant higher incidence of perceived stress in the stroke group compared to controls (RR = 1.58, 95% CI [1.17–1.80], p < 0.00001). See Figure 2A.
Figure 2
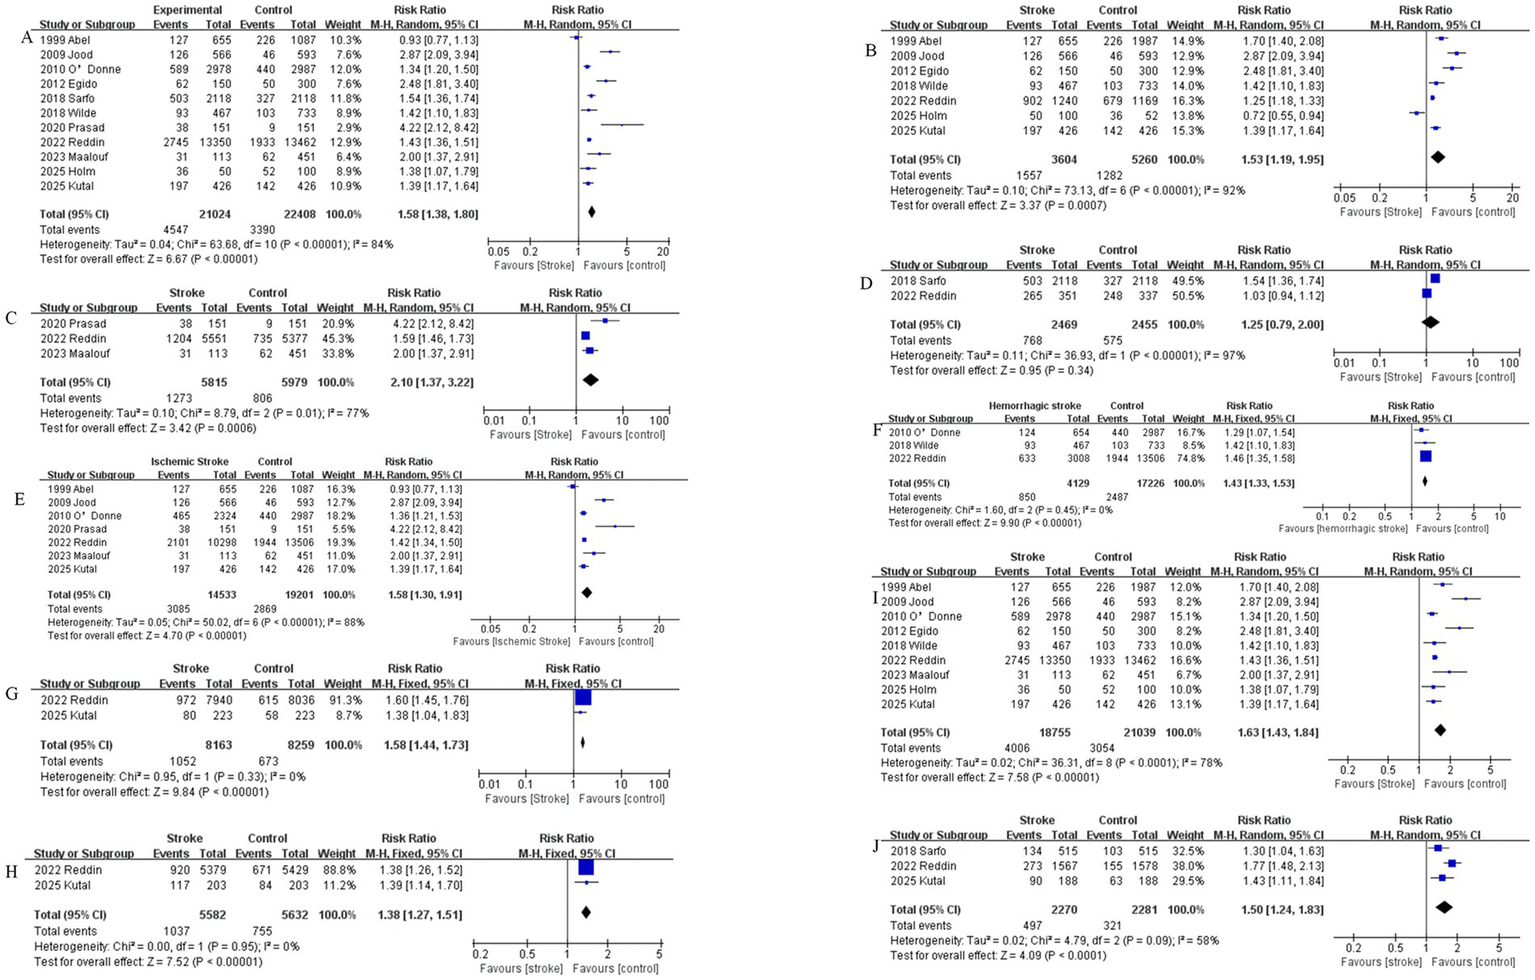
(A) Comparison of perceived stress incidence between stroke patients and healthy controls. (B) Comparison of perceived stress incidence between stroke patients and healthy controls in studies conducted in Europe and the America. (C) Comparison of perceived stress incidence between stroke patients and healthy controls in studies conducted in Asia. (D) Comparison of perceived stress between stroke populations and healthy controls in Africa regions. (E) Comparison of perceived stress between Ischemic stroke populations and healthy controls. (F) Comparison of perceived stress between hemorrhagic stroke populations and healthy controls. (G) Male comparison of perceived stress between stroke populations and healthy controls. (H) Female comparison of perceived stress between stroke populations and healthy controls. (I) Comparison of perceived stress between stroke populations using questionnaires and healthy controls. (J) Comparison of perceived stress between Age <50 stroke populations and healthy controls.
3.2.2 Comparison of differences in perceived stress incidence between stroke patients and healthy controls across different regions
Comparison of perceived stress between stroke populations and healthy controls in European and American regions. Seven case–control studies conducted in Europe and the Americas were included, comprising 3,604 stroke patients and 5,260 control subjects. Significant heterogeneity was observed among studies (I2 = 92%). A random-effects model was employed for meta-analysis, revealing a statistically significant higher incidence of perceived stress in the stroke group compared to controls (RR = 1.53, 95% CI [1.19–1.95], p = 0.0007). See Figure 2B.
Comparison of perceived stress between stroke populations and healthy controls in Asia regions. Three case–control studies conducted in Asia were included, comprising 5,815 stroke patients and 5,979 control subjects. Significant heterogeneity was observed among studies (I2 = 77%). A random-effects model was employed for meta-analysis, demonstrating a statistically significant higher incidence of perceived stress in the stroke group compared to controls (RR = 2.10, 95% CI [1.37–2.91], Z = 3.42, p = 0.0006). See Figure 3C.
Figure 3

(A) Comparison of stroke incidence between populations with perceived stress and control groups. (B) Comparison of stroke incidence between populations with perceived stress using questionnaires and control groups. (C) Comparison of stroke incidence between populations with perceived stress and control groups in European and American regions. (D) Comparison of stroke incidence between populations with perceived stress and control groups in Asia regions. (E) Comparison of ischemic stroke risk between populations with perceived stress and control groups. (F) Comparison of hemorrhagic stroke risk between populations with perceived stress and control groups.
Comparison of perceived stress between stroke populations and healthy controls in Africa regions. Two case–control studies conducted in Africa were included, comprising 2,469 stroke patients and 2,455 control subjects. There was heterogeneity among the studies (I2 = 97%). A random-effects model was employed for meta-analysis. The results showed that the incidence of perceived stress was higher in the stroke group than in the control group, but the difference was not statistically significant (RR = 1.25, 95% CI [0.79–2.00], Z = 0.95, p = 0.34). See Figure 2D.
3.2.3 Comparison of differences in perceived stress incidence among ischemic stroke patients, hemorrhagic stroke patients and healthy controls
Seven case–control studies on ischemic stroke were included, comprising 14,533 ischemic stroke patients and 19,201 control subjects. Significant heterogeneity was observed among studies (I2 = 88%). A random-effects model was employed for meta-analysis, revealing a statistically significant higher incidence of perceived stress in the ischemic stroke group compared to controls (RR = 1.58, 95% CI [1.30–1.91], p < 0.0001). See Figure 2E. Three case–control studies on hemorrhagic stroke were included, comprising 4,129 hemorrhagic stroke patients and 17,226 control subjects. No significant heterogeneity was observed among studies (I2 = 0%). A fixed-effects model was employed for meta-analysis, demonstrating a statistically significant higher incidence of perceived stress in the hemorrhagic stroke group compared to controls (RR = 1.43, 95% CI [1.33–1.53], p < 0.00001). See Figure 2F.
3.2.4 Comparison of perceived stress incidence between stroke patients and healthy controls by sex
Two case–control studies in males were included, comprising 8,163 stroke patients and 8,259 healthy controls. No significant heterogeneity was observed among studies (I2 = 0%). A fixed-effects model was employed for meta-analysis, demonstrating a statistically significant higher incidence of perceived stress in the stroke group compared to controls (RR = 1.58, 95% CI [1.44–1.73], p < 0.00001). See Figure 2G. Two case–control studies in females were included, comprising 5,582 stroke patients and 5,632 healthy controls. No significant heterogeneity was observed among studies (I2 = 0%). A fixed-effects model was employed for meta-analysis, demonstrating a statistically significant higher incidence of perceived stress in the stroke group compared to controls (RR = 1.38, 95% CI [1.27–1.51], p < 0.00001). See Figure 2H.
3.2.5 Comparison of perceived stress between stroke populations using questionnaires and healthy controls
Case–control studies utilized detailed perceived stress questionnaires, such as the PSS or other questionnaires. Nine case–control studies were included, comprising 18,755 stroke patients and 21,039 control subjects. Significant heterogeneity was observed among studies (I2 = 78%). A random-effects model was employed for meta-analysis, demonstrating a statistically significant higher incidence of perceived stress in the stroke group compared to controls (RR = 1.63, 95% CI [1.43–1.84], p < 0.0001). See Figure 2I.
3.2.6 Comparison of perceived stress incidence between stroke patients aged < 50 years and healthy controls
Three case–control studies of stroke in patients aged < 50 years were included, comprising 2,270 stroke patients and 2,281 control subjects. Significant heterogeneity was observed among studies (I2 = 58%). A random-effects model was employed for meta-analysis, demonstrating a statistically significant higher incidence of perceived stress in the stroke group compared to controls (RR = 1.50, 95% CI [1.24–1.83], p < 0.0001). See Figure 2J.
3.3 Fourteen cohort studies were included to compare the risk of stroke between the perceived stress group and the control group, clarifying the correlation between perceived stress and stroke
3.3.1 Comparison of stroke incidence between the perceived stress group and the control group
Fourteen prospective cohort studies were included, comprising 107,741 subjects in the perceived stress group and 69,784 in the control group. Significant heterogeneity was observed among studies (I2 = 99%). A random-effects model was employed for meta-analysis. The results showed a higher risk of stroke in the perceived stress group compared to the control group, but the difference was not statistically significant (RR = 1.29, 95% CI [0.83–2.02], p = 0.26). See Figure 3A.
3.3.2 Comparison of stroke incidence between the perceived stress group with questionnaires and the control group
Thirteen prospective cohort studies with questionnaires were included, comprising 107,706 subjects in the perceived stress group and 67,516 in the control group. Significant heterogeneity was observed among studies (I2 = 99%). A random-effects model was employed for meta-analysis. The results showed a higher risk of stroke in the perceived stress group compared to the control group, but the difference was not statistically significant (RR = 1.33, 95% CI [0.84–2.09], p = 0.22). See Figure 3B.
3.3.3 Comparison of stroke incidence between the perceived stress group and the control group in different regions
Seven prospective cohort studies in regions of Europe and America were included, comprising 16,876 subjects in the perceived stress group and 29,577 in the control group. Significant heterogeneity was observed among studies (I2 = 99%). A random-effects model was employed for meta-analysis. The results showed a higher risk of stroke in the perceived stress group compared to the control group, but the difference was not statistically significant (RR = 1.65, 95% CI [0.88–3.07], p = 0.12). See Figure 3C. Four prospective cohort studies in regions of Asia were included, comprising 77,714 subjects in the perceived stress group and 29,240 in the control group. Significant heterogeneity was observed among studies (I2 = 83%). A random-effects model was employed for meta-analysis. The results showed a higher risk of stroke in the perceived stress group compared to the control group, but the difference was not statistically significant (RR = 1.06, 95% CI [0.82–1.38], p = 0.64). See Figure 3D.
3.3.4 Comparison of stroke incidence between the perceived stress group and the control group for ischemic stroke or hemorrhagic stroke
Four prospective cohort studies on ischemic stroke were included, comprising 76,670 subjects in the perceived stress group and 29,059 in the control group. Significant heterogeneity was observed among studies (I2 = 64%). A random-effects model was employed for meta-analysis. The results showed a lower risk of ischemic stroke in the perceived stress group compared to the control group, but the difference was not statistically significant (RR = 0.94, 95% CI [0.75–1.17], p = 0.57). See Figure 3E. Two prospective cohort studies on hemorrhagic stroke were included, comprising 68,988 subjects in the perceived stress group and 25,124 in the control group. Significant heterogeneity was observed among studies (I2 = 27%). A fixed-effects model was employed for meta-analysis. The results showed a lower risk of hemorrhagic stroke in the perceived stress group compared to the control group, but the difference was not statistically significant (RR = 0.97, 95% CI [0.73–1.29], p = 0.83). See Figure 3F.
3.3.5 Comparison of stroke incidence between the perceived stress group and the control group by sex
Five prospective cohort studies comparing males in the perceived stress group and the control group were included, comprising 30,230 subjects in the perceived stress group and 23,645 in the control group. Significant heterogeneity was observed among studies (I2 = 99%). A random-effects model was employed for meta-analysis. The results showed a higher risk of stroke in the perceived stress group compared to the control group, but the difference was not statistically significant (RR = 1.95, 95% CI [0.87–4.36], p = 0.11). See Figure 3G. Three prospective cohort studies comparing females in the perceived stress group and the control group were included, comprising 37,122 subjects in the perceived stress group and 8,375 in the control group. Significant heterogeneity was observed among studies (I2 = 94%). A random-effects model was employed for meta-analysis. The results showed a lower risk of stroke in the perceived stress group compared to the control group, but the difference was not statistically significant (RR = 0.59, 95% CI [0.18–1.96], p = 0.39). See Figure 3H.
3.4 Publication Bias assessment
3.4.1 Comparison of perceived stress incidence between stroke patients and healthy controls
Funnel plot analysis showed a slightly asymmetric distribution of studies on both sides of the funnel, suggesting possible publication bias (see Figure 4A). Egger’s test (p = 0.204) indicated no statistically significant publication bias (see Figure 4B).
Figure 4

(A) Funnel plot for the comparison of perceived stress incidence between stroke patients and healthy controls; (B) Egger’s plot for the comparison of perceived stress incidence between stroke patients and healthy controls; (C) Funnel plot for the comparison of stroke incidence between the perceived stress group and control group; (D) Egger’s plot for the comparison of stroke incidence between the perceived stress group and control group; (E) Funnel plot for the comparison of stroke incidence between the perceived stress group with questionnaires and control group; (F) Egger’s plot for the comparison of stroke incidence between the perceived stress group with questionnaires and control group.
3.4.2 Comparison of stroke incidence between the perceived stress group and the control group
Funnel plot analysis showed a symmetric distribution of studies on both sides of the funnel, suggesting no potential publication bias (see Figure 4C). Egger’s test (p = 0.167) indicated no statistically significant publication bias (see Figure 4D).
3.4.3 Comparison of stroke incidence between the perceived stress group with questionnaires and the control group
Funnel plot analysis showed a symmetric distribution of studies on both sides of the funnel, suggesting no potential publication bias (see Figure 4E). Egger’s test (p = 0.117) indicated no statistically significant publication bias (see Figure 4F).
3.5 Sensitivity analysis
After performing sensitivity analysis by excluding each study one by one for 11 case–control studies and 14 cohort studies, we found that the results of this meta-analysis were not influenced by any single study. Even if a particular study was removed, the overall conclusions of the study did not change significantly. Therefore, the results of this meta-analysis are stable. See (Tables 4, 5, Figures 5A,B).
Table 4
| Study omitted | OR [95% CI] |
|---|---|
| Abel, 1999 (11) | 1.6195067 [1.4114066–1.8582894] |
| Jood, 2009 (10) | 1.5167219 [1.3731627–1.6752897] |
| O’Donne, 2010 (12) | 1.6990612 [1.4553246–1.9836186] |
| Egido, 2012 (9) | 1.5505491 [1.3820884–1.7395432] |
| Wilde, 2018 (8) | 1.657202 [1.4440841–1.901772] |
| Reddin, 2022 (7) | 1.6971816 [1.425347–2.0208592] |
| Maalouf, 2023 (14) | 1.6008395 [1.4072037–1.8211203] |
| Holm, 2025 (5) | 1.6612555 [1.447961–1.9059697] |
| Kutal, 2025 (6) | 1.6757952 [1.4505315–1.9360418] |
| Combined | 1.6257582 [1.4337913–1.843427] |
Sensitivity analysis of perceived stress incidence in 11 case–control studies comparing stroke patients and healthy controls.
Table 5
| Study omitted | OR [95% CI] |
|---|---|
| Macleod, 2001 (28) | 1.3474317 [0.84631722–2.1452621] |
| Susan, 2001 (50) | 1.325391 [0.84158668–2.0873206] |
| Iso, 2002 (27) | 1.3438475 [0.84120717–2.1468269] |
| Truelsen, 2003 (26) | 1.3282992 [0.82455037–2.1398073] |
| Ohlin, 2004 (25) | 1.284174 [0.78963905–2.088426] |
| Harmsen, 2006 (24) | 1.1506409 [0.8772488–1.5092348] |
| Tsutsumi, 2009 (23) | 1.2646249 [0.79392336–2.0143962] |
| Kornerup, 2010 (22) | 1.2979744 [0.80834561–2.0841799] |
| Suadicani, 2011 (21) | 1.2261654 [0.74734759–2.0117569] |
| Henderson, 2013 (20) | 1.2435148 [0.77147068–2.0043913] |
| Molshatzki, 2013 (19) | 1.2915322 [0.79494911–2.0983172] |
| Susan, 2014 (18) | 1.2953059 [0.80888487–2.0742351] |
| Hagstrom, 2018 (17) | 1.3779106 [0.88306787–2.1500472] |
| Li, 2022 (16) | 1.3218418 [0.81866891–2.1342764] |
| Combined | 1.2914572 [0.82602931–2.0191313] |
Sensitivity analysis of 14 prospective cohort studies.
Figure 5
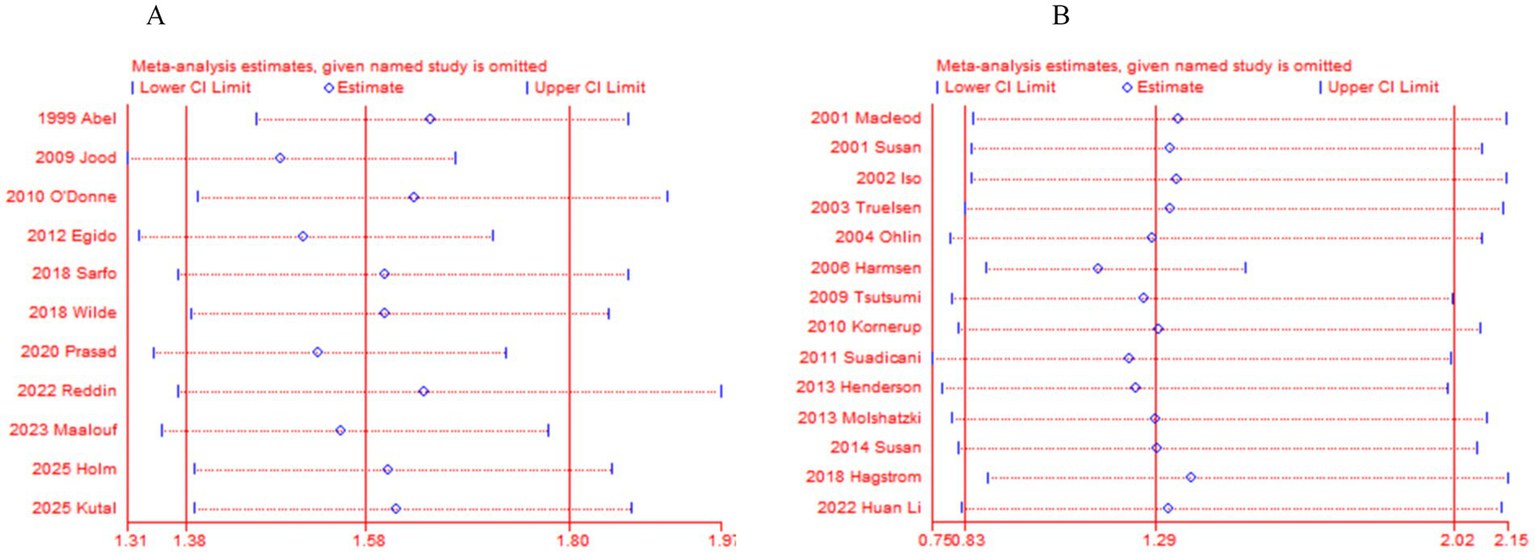
(A) Sensitivity analysis of 11 case–control studies. (B) Sensitivity analysis of 14 prospective cohort studies.
3.6 GRADE evidence quality assessment
The GRADE approach (29) was used to evaluate the evidence quality for each outcome. Assessments were conducted across five domains: Limitations, inconsistency, indirectness, imprecision, and publication bias. GRADE evidence grading indicated that the evidence levels for primary outcomes were moderate or high quality, as shown in Table 6.
Table 6
| Outcome indicators | No. of studies | Quality | Assessment | |||||
|---|---|---|---|---|---|---|---|---|
| Limitationsa | Inconsistency | Indirectness | Imprecision | Publication bias | Relative risk (95% CI) | Quality of evidenceb | ||
| 1. Perceived stress incidence | 11 | Serious limitations | No serious inconsistency | No serious indirectness | No serious imprecision | Undetected | 1.58 [1.17–1.80] | ㊉㊉㊉◯ |
| 2. European and American regions | 7 | Serious limitations | No serious inconsistency | No serious indirectness | No serious imprecision | Undetected | 1.53 [1.19–1.95] | ㊉㊉㊉◯ |
| 3. Asia regions | 3 | Serious limitations | No serious inconsistency | No serious indirectness | No serious imprecision | Undetected | 2.10 [1.37–2.91] | ㊉㊉㊉◯ |
| 4. Africa regions | 2 | Serious limitations | No serious inconsistency | No serious indirectness | No serious imprecision | Undetected | 1.25 [0.79–2.00] | ㊉㊉㊉㊀ |
| 5. Ischemic stroke | 7 | Serious limitations | No serious inconsistency | No serious indirectness | No serious imprecision | Undetected | 1.58 [1.30–1.91] | ㊉㊉㊉◯ |
| 6. Hemorrhagic stroke | 3 | Serious limitations | No serious inconsistency | No serious indirectness | No serious imprecision | Undetected | 1.43 [1.33–1.53] | ㊉㊉㊉◯ |
| 7. Male | 2 | Serious limitations | No serious inconsistency | No serious indirectness | No serious imprecision | Undetected | 1.58 [1.44–1.73] | ㊉㊉㊉◯ |
| 8. Female | 2 | Serious limitations | No serious inconsistency | No serious indirectness | No serious imprecision | Undetected | 1.38 [1.27–1.51] | ㊉㊉㊉◯ |
| 9. Questionnaires | 9 | Serious limitations | No serious inconsistency | No serious indirectness | No serious imprecision | Undetected | 1.63 [1.43–1.84] | ㊉㊉㊉◯ |
| 10. Age < 50 | 3 | Serious limitations | No serious inconsistency | No serious indirectness | No serious imprecision | Undetected | 1.50 [1.24–1.83] | ㊉㊉㊉◯ |
| 11.Stroke incidence | 14 | No serious limitations | No serious inconsistency | No serious indirectness | No serious imprecision | Undetected | 1.29 [0.83–2.02] | ㊉㊉㊉㊉ |
| 12. Questionnaires | 13 | No serious limitations | No serious inconsistency | No serious indirectness | No serious imprecision | Undetected | 1.33 [0.84–2.09] | ㊉㊉㊉㊉ |
| 13. European and American | 7 | No serious limitations | No serious inconsistency | No serious indirectness | No serious imprecision | Undetected | 1.65 [0.88–3.07] | ㊉㊉㊉㊉ |
| 14. Asia regions | 4 | No serious limitations | No serious inconsistency | No serious indirectness | No serious imprecision | Undetected | 1.06 [0.82–1.38] | ㊉㊉㊉㊉ |
| 15. Ischemic stroke risk | 4 | No serious limitations | No serious inconsistency | No serious indirectness | No serious imprecision | Undetected | 0.94 [0.75–1.17] | ㊉㊉㊉㊉ |
| 16. Hemorrhagic stroke risk | 2 | No serious limitations | No serious inconsistency | No serious indirectness | No serious imprecision | Undetected | 0.97 [0.73–1.29] | ㊉㊉㊉㊉ |
| 17. Male | 5 | No serious limitations | No serious inconsistency | No serious indirectness | No serious imprecision | Undetected | 1.95 [0.87–4.36] | ㊉㊉㊉㊉ |
| 18. Female | 3 | No serious limitations | No serious inconsistency | No serious indirectness | No serious imprecision | Undetected | 0.59 [0.18–1.96] | ㊉㊉㊉㊉ |
Evidence classification of GRADE.
Outcome indicators 1–10: case–control studies, Outcome indicators 11–18: prospective cohort studies. GRADE, Grading of Recommendations Assessment, Development, and Evaluation.
aCase–control study lack of blinding, b㊉㊉㊉㊉ (High quality): There is a strong belief that the true effect lies close to estimated effect; ㊉㊉㊉◯ (moderate quality): There is a reasonable degree of certainty that the actual effect is near the estimated effect, while there exists a chance of significant difference; ㊉㊉◯◯ (low quality): the confidence in the estimated effect is restricted and there is a possibility of substantial disparity between the actual and estimated effects; ㊉◯◯◯ (very low quality): there is a minimal confidence in the estimated effect and the actual effect is probable to vary from the estimated one considerably.
1. Comparison of perceived stress between stroke populations and healthy controls.
2. Comparison of perceived stress between stroke populations and healthy controls in European and American regions.
3. Comparison of perceived stress between stroke populations and healthy controls in Asia regions.
4. Comparison of perceived stress between stroke populations and healthy controls in Africa regions.
5. Comparison of perceived stress between Ischemic stroke populations and healthy controls.
6. Comparison of perceived stress between hemorrhagic stroke populations and healthy controls.
7. Comparison of perceived stress between male stroke populations and healthy controls.
8. Comparison of perceived stress between female stroke populations and healthy controls.
9. Comparison of perceived stress between stroke populations using questionnaires and healthy controls.
10. Comparison of perceived stress between Age < 50 stroke populations and healthy controls.
11. Comparison of stroke incidence between populations with perceived stress and control groups.
12. Comparison of stroke incidence between populations with perceived stress using questionnaires and control groups.
13. Comparison of stroke incidence between populations with perceived stress and control groups in European and American regions.
14. Comparison of stroke incidence between populations with perceived stress and control groups in Asia regions.
15. Comparison of ischemic stroke risk between populations with perceived stress and control groups.
16. Comparison of hemorrhagic stroke risk between populations with perceived stress and control groups.
17. Comparison of stroke risk between male populations with perceived stress and control groups.
18. Comparison of stroke risk between female populations with perceived stress and control groups.
4 Discussion
Stroke is a major global public health issue and one of the leading causes of disability and mortality (30). For stroke prevention, the identification of at-risk individuals and accurate prediction of stroke risk are crucial for interventional preventive measures. Traditional risk assessments incorporate established risk factors such as hypertension, diabetes mellitus, and smoking (31). The role of perceived psychological stress as a potential risk factor for stroke has garnered increasing attention in recent years (32).
This study included 11 case–control studies and 14 prospective cohort studies for a meta-analysis of the association between perceived psychological stress and stroke. The case–control studies primarily compared the difference in perceived psychological stress incidence between stroke patients and healthy controls, while the prospective cohort studies compared the probability of stroke occurrence between the perceived psychological stress group and the control group. Therefore, the data from case–control studies and prospective cohort studies were pooled and analyzed separately in the meta-analysis. The meta-analysis of 11 case–control studies found that the incidence of perceived psychological stress was higher in the stroke group than in the control group (RR = 1.58, 95% CI [1.17–1.80], p < 0.00001), with a statistically significant difference. Significant heterogeneity was observed among the studies (I2 = 84%). A pooled analysis of 9 case–control studies that used questionnaires for perceived psychological stress assessment also showed significant heterogeneity (I2 = 78%). The incidence of perceived stress was higher in the stroke group compared to the control group, with a statistically significant difference (RR = 1.63, 95% CI [1.43–1.84], p < 0.0001). It can be observed that heterogeneity decreased in studies with specific perceived stress questionnaires. However, since nearly every case–control study applied different questionnaires, further analysis based on a single questionnaire for assessing the degree of perceived psychological stress was not feasible. The main sources of heterogeneity were attributed to differences in questionnaires or lack of standardization in stress assessment. Subgroup analysis by region revealed that the incidence of perceived stress was higher in the stroke group than in the control group in Europe and the Americas, with a statistically significant difference (RR = 1.53, 95% CI [1.19–1.95], p = 0.0007). In Asia, the incidence of perceived stress was higher in the stroke group than in the control group, with a statistically significant difference (RR = 2.10, 95% CI [1.37–2.91], p = 0.0006), and the proportion of perceived psychological stress in Asian stroke patients was higher compared to those in Europe and the Americas (RR 2.1 vs. RR 1.53). However, in Africa, there was no statistically significant difference in perceived stress between the stroke group and the control group (RR = 1.25, 95% CI [0.79–2.00], p = 0.34). Subgroup analysis by stroke type showed that the incidence of perceived psychological stress was higher in both ischemic and hemorrhagic stroke patients compared to the control group, with statistically significant differences (RR = 1.58, 95% CI [1.30–1.91], p < 0.0001) for ischemic stroke and (RR = 1.43, 95% CI [1.33–1.53], p < 0.00001) for hemorrhagic stroke. Subgroup analysis by sex revealed a statistically significant difference in the incidence of perceived stress between stroke patients and healthy controls (Male RR = 1.58, 95% CI [1.44–1.73], p < 0.00001), and (Female RR = 1.38, 95% CI [1.27–1.51], p < 0.00001), suggesting that male stroke patients have a higher incidence of perceived psychological stress compared to females. Subgroup analysis by age (<50 years) showed that the incidence of perceived stress was higher in the stroke group than in the control group, with a statistically significant difference (RR = 1.50, 95% CI [1.24–1.83], p < 0.0001), indicating that perceived psychological stress may be a risk factor for young stroke. The 14 prospective cohort studies included 107,741 subjects in the perceived psychological stress group and 69,784 in the control group. Significant heterogeneity was observed among the studies (I2 = 99%). The results showed that the probability of stroke occurrence was higher in the perceived stress group than in the control group, but the difference was not statistically significant (RR = 1.29, 95% CI [0.83–2.02], p = 0.26). Among the 13 prospective cohort studies that used questionnaires, significant heterogeneity was also observed (I2 = 99%), and the results still showed a higher probability of stroke in the perceived stress group compared to the control group, but the difference was not statistically significant (RR = 1.33, 95% CI [0.84–2.09], p = 0.22). Heterogeneity did not change because there was only one study without a questionnaire. The primary source of heterogeneity was still attributed to differences in questionnaires. Subgroup analysis by region showed no statistically significant difference in the probability of stroke occurrence between the perceived stress group and the control group in Europe and the Americas (RR = 1.65, 95% CI [0.88–3.07], p = 0.12) and Asia (RR = 1.06, 95% CI [0.82–1.38], p = 0.64). Furthermore, there was no statistically significant difference in the probability of ischemic stroke (RR = 0.94, 95% CI [0.75–1.17], p = 0.57) and hemorrhagic stroke (RR = 0.97, 95% CI [0.73–1.29], p = 0.83). Similarly, subgroup analysis by sex showed no statistically significant difference in stroke incidence between the perceived stress group and the control group (Male RR = 1.95, 95% CI [0.87–4.36], p = 0.11) and (Female RR = 0.59, 95% CI [0.18–1.96], p = 0.39). For the 11 case–control studies (Egger’s test p = 0.204) and the 14 prospective cohort studies (Egger’s test p = 0.167), both showed no publication bias, and sensitivity analysis indicated that the results of the meta-analysis were stable.
The meta-analysis of case–control studies found that perceived psychological stress is a risk factor for stroke, ischemic stroke, and hemorrhagic stroke in both males and females in Europe, the Americas, and Asia, particularly in stroke patients under 50 years of age. However, the prospective cohort studies found no difference in the probability of stroke, ischemic stroke, or hemorrhagic stroke between the perceived psychological stress group and the control group in Europe, the Americas, Asia, males, or females. We consider that the assessment of psychological stress scales in case–control studies may be more accurate, and the results are relatively reliable. In prospective cohort studies, the degree of psychological stress may fluctuate over several years of follow-up, leading to unreliable outcomes in the probability of stroke among individuals with varying levels of perceived psychological stress.
Stress and negative emotions, including depression, anger and hostility, can have adverse effects on health, leading to an increase in the incidence and mortality of cardiovascular diseases (33). Two recent meta-analyses have concluded that people with depression, especially women, have an increased risk of stroke, although most of the evidence comes from homogeneous white people groups (34, 35). Another study shows that a combination of factors such as depressive symptoms, perceived stress, neuroticism and dissatisfaction with life is associated with the incidence of stroke and even the mortality rate of stroke among black people and white people living in the community (20). Anger is a negative emotion associated with hostile personality and aggressive behavior, which is related to the risk of excessive stroke (36) (37). Further research has found that higher levels of depressive symptoms, greater degrees of chronic stress and higher levels of hostility predict an increased risk of stroke and transient ischemic attack (TIA) (18).
The mechanisms underlying the association between psychological stress and stroke are complex and not fully understood, and may be related to the following mechanisms: 1. Long-term exposure to high levels of psychological stress is associated with chronic inflammation, endothelial dysfunction, platelet activation and aggregation, and autonomic nervous system dysfunction (38), and these factors are closely related to atherosclerosis and stroke. 2. Acute psychological stress may trigger qualitative changes in several procoagulant factors such as fibrinogen, factor XII, factor VII, factor VIII, von Willebrand factor, platelet activity, thrombin-antithrombin complexes, fibrin D-dimer, and tissue-type plasminogen activator (39). The resulting procoagulant activity exceeds the fibrinolytic response, thereby promoting a hypercoagulable state and increasing the probability of stroke occurrence; 3. Psychological stress leads to stress-related acute, recurrent short-term increases in blood pressure, vasospasm, and arrhythmia (6); 4. Psychological stress is often associated with behaviors such as smoking, physical inactivity, and poor diet. Unhealthy dietary and lifestyle habits may lead to reduced levels of high-density lipoprotein (HDL) (40). HDL plays a key role in lipid transport, and disruption of this biomarker is associated with an increased risk of stroke. Perceived psychological stress is related to lifestyle behaviors that may negatively affect HDL levels (41), thereby increasing the risk of stroke; 5. Perceived psychological stress may lead to cerebral hypoperfusion, followed by glial cell ischemia, neuronal damage, and an increased risk of stroke (42); 6. Acute psychological stress may activate the sympathetic nervous system, leading to vasoconstriction and plaque rupture in susceptible individuals, thereby triggering stroke events (43); 7. Tawakol et al. (44) further found that amygdala activity, which is involved with experiencing psychological stress, was significantly associated with increased bone marrow activity and arterial inflammation. At the same time, higher perceived psychosocial stress was related to increased intima-media thickness and carotid artery disease by increasing the release of catecholamines and activating sympathetic nerves (32, 45, 46). Stress and negative emotions activate the hypothalamic–pituitary–adrenal axis, leading to changes in glucocorticoids and an increase in circulating catecholamines. They can also affect endothelial dysfunction and platelet activation, and cause abnormalities in neuroendocrine, metabolic and immune functions (47, 48).
Chloe A (49)et al reported that perceived stress is also associated with worse post-stroke functional outcome and greater disability even after accounting for stroke severity, vascular risk factors, and access to acute stroke care. Experimental stroke studies which incorporate social isolation or social defeat stress have shown that both tissue and functional stroke outcome is affected by the increased expression of TNF-α and IL-6, increased glucocorticoid production, and suppression of the protooncogene bcl-2. A meta-analysis on perceived stress and stroke by Joanne Booth in 2015 included 14 studies (10 prospective cohort studies and 4 case–control studies) and demonstrated an independent association between psychosocial stress and increased stroke risk (32).
Early identification of high-risk individuals with perceived psychological stress will facilitate the implementation of targeted preventive strategies and interventions to reduce the burden of stroke incidence and mortality.
5 Conclusion
The meta-analysis of case–control studies found that perceived psychological stress is a risk factor for stroke, ischemic stroke, and hemorrhagic stroke in both males and females in Europe, America, and Asia, particularly in stroke patients under 50 years of age. However, the prospective cohort studies found no difference in the probability of stroke, ischemic stroke, or hemorrhagic stroke between the perceived psychological stress group and the control group in Europe, America, Asia, males, or females. Perhaps indicating that perceived psychological stress is a risk factor for stroke.
Statements
Data availability statement
The datasets presented in this study can be found in online repositories. The names of the repository/repositories and accession number(s) can be found in the article/supplementary material.
Author contributions
YW: Formal analysis, Data curation, Writing – original draft, Investigation, Methodology. XS: Data curation, Formal analysis, Writing – original draft, Methodology. LX: Formal analysis, Project administration, Writing – review & editing, Software, Methodology, Investigation.
Funding
The author(s) declared that financial support was received for this work and/or its publication. This study was funded by the Qingmiao Program of China-Japan Union Hospital of Jilin University (2024QM17).
Acknowledgments
The authors appreciate all staff of the department of Neurology in the China-Japan Union Hospital of Jilin University.
Conflict of interest
The author(s) declared that this work was conducted in the absence of any commercial or financial relationships that could be construed as a potential conflict of interest.
Generative AI statement
The author(s) declared that Generative AI was not used in the creation of this manuscript.
Any alternative text (alt text) provided alongside figures in this article has been generated by Frontiers with the support of artificial intelligence and reasonable efforts have been made to ensure accuracy, including review by the authors wherever possible. If you identify any issues, please contact us.
Publisher’s note
All claims expressed in this article are solely those of the authors and do not necessarily represent those of their affiliated organizations, or those of the publisher, the editors and the reviewers. Any product that may be evaluated in this article, or claim that may be made by its manufacturer, is not guaranteed or endorsed by the publisher.
References
1.
Hilkens NA Casolla B Leung TW Leeuw FE . Stroke. Lancet. (2024) 403:2820–36. doi: 10.1016/S0140-6736(24)00642-1
2.
Cohen S Janicki-Deverts D Miller GE . Psychological stress and disease. JAMA. (2007) 298:1685–7. doi: 10.1001/jama.298.14.1685,
3.
Moher D Liberati A Tetzlaff J Altman DG . Preferred reporting items for systematic reviews and meta-analyses: the PRISMA statement. PLoS Med. (2009) 6:e1000097. doi: 10.1371/journal.pmed.1000097,
4.
Wells GA Shea B O'Connell D Peterson J Welch V Losos M et al ., The Newcastle-Ottawa scale (NOS) for assessing the quality of nonrandomised studies in meta-analyses. (2021). Available online at: https://www.ohri.ca/programs/clinical_epidemiology/oxford.asp (Accessed May 3, 2021).
5.
Holm H Jujic A Nilsson PM Magnusson M Malan L . The prognostic significance of stress-phenotyping for stroke incidence: the Malmö diet and Cancer study. Stress. (2025) 28:2443980. doi: 10.1080/10253890.2024.2443980,
6.
Kutal S Tulkki LJ Sarkanen T Redfors P Jood K Nordanstig A et al . Association between self-perceived stress and cryptogenic ischemic stroke in young adults: a case-control study. Neurology. (2025) 104:e213369. doi: 10.1212/WNL.0000000000213369,
7.
Reddin C Murphy R Hankey GJ Judge C Xavier D Rosengren A et al . Association of psychosocial stress with risk of acute stroke. JAMA Netw Open. (2022) 5:e2244836. doi: 10.1001/jamanetworkopen.2022.44836,
8.
Wilde A Greebe P Rinkel GJE Algra A . Stress in patients with (un)ruptured intracranial aneurysms vs population-based controls. Neurosurgery. (2019) 84:1065–71. doi: 10.1093/neuros/nyy143,
9.
Egido JA Castillo O Roig B Sanz I Herrero MR Garay MT et al . Is psycho-physical stress a risk factor for stroke? A case-control study. J Neurol Neurosurg Psychiatry. (2012) 83:1104–11. doi: 10.1136/jnnp-2012-302420,
10.
Jood K Redfors P Rosengren A Blomstrand C Jern C . Self-perceived psychological stress and ischemic stroke: a case-control study. BMC Med. (2009) 7:53. doi: 10.1186/1741-7015-7-53,
11.
Abel GA Chen X Boden-Albala B Sacco RL . Social readjustment and ischemic stroke: lack of an association in a multiethnic population. Neuroepidemiology. (1999) 18:22–31. doi: 10.1159/000026192,
12.
O'Donnell MJ Xavier D Liu L Zhang H Chin SL Rao-Melacini P et al . Risk factors for ischaemic and intracerebral haemorrhagic stroke in 22 countries (the INTERSTROKE study): a case-control study. Lancet. (2010) 376:112–23. doi: 10.1016/S0140-6736(10)60834-3,
13.
Sarfo FS Ovbiagele B Gebregziabher M Wahab K Akinyemi R Akpalu A et al . Stroke among young West Africans: evidence from the SIREN large multi-site case-control study. Stroke. (2018) 49:1116–22. doi: 10.1161/STROKEAHA.118.020783
14.
Maalouf E Hallit S Salameh P Hosseini H . Depression, anxiety, insomnia, stress, and the way of coping emotions as risk factors for ischemic stroke and their influence on stroke severity: a case-control study in Lebanon. Front Psych. (2023) 14:1097873. doi: 10.3389/fpsyt.2023.1097873,
15.
Prasad M Khanna P Katyal VK Verma R . Acute psychological stress is a trigger for stroke: a case-crossover study. J Stroke Cerebrovasc Dis. (2020) 29:104799. doi: 10.1016/j.jstrokecerebrovasdis.2020.104799,
16.
Li H He P Zhang Y Lin T Liu C Xie D et al . Self-perceived psychological stress and risk of first stroke in treated hypertensive patients. Psychosom Med. (2022) 84:237–43. doi: 10.1097/PSY.0000000000001030,
17.
Hagström E Norlund F Stebbins A Armstrong PW Chiswell K Granger CB et al . Psychosocial stress and major cardiovascular events in patients with stable coronary heart disease. J Intern Med. (2018) 283:83–92. doi: 10.1111/joim.12692,
18.
Everson-Rose SA Roetker NS Lutsey PL Kershaw KN Longstreth WT Jr Sacco RL et al . Chronic stress, depressive symptoms, anger, hostility, and risk of stroke and transient ischemic attack in the multiethnic study of atherosclerosis. Stroke. (2014) 45:2318–23. doi: 10.1161/STROKEAHA.114.004815,
19.
Molshatzki N Goldbourt U Tanne D . Perceived hardships at midlife: prediction of long-term stroke mortality. Int J Cardiol. (2013) 168:2278–81. doi: 10.1016/j.ijcard.2013.01.200,
20.
Henderson KM Clark CJ Lewis TT Aggarwal NT Beck T Guo H et al . Psychosocial distress and stroke risk in older adults. Stroke. (2013) 44:367–72. doi: 10.1161/STROKEAHA.112.679159,
21.
Suadicani P Andersen LL Holtermann A Mortensen OS Gyntelberg F . Perceived psychological pressure at work, social class, and risk of stroke: a 30-year follow-up in Copenhagen male study. J Occup Environ Med. (2011) 53:1388–95. doi: 10.1097/JOM.0b013e31823c149d,
22.
Kornerup H Osler M Boysen G Barefoot J Schnohr P Prescott E . Major life events increase the risk of stroke but not of myocardial infarction: results from the Copenhagen City heart study. Eur J Cardiovasc Prev Rehabil. (2010) 17:113–8. doi: 10.1097/HJR.0b013e3283359c18,
23.
Tsutsumi A Kayaba K Kario K Ishikawa S . Prospective study on occupational stress and risk of stroke. Arch Intern Med. (2009) 169:56–61. doi: 10.1001/archinternmed.2008.503,
24.
Harmsen P Lappas G Rosengren A Wilhelmsen L . Long-term risk factors for stroke: twenty-eight years of follow-up of 7457 middle-aged men in Goteborg, Sweden. Stroke. (2006) 37:1663–7. doi: 10.1161/01.STR.0000226604.10877.fc,
25.
Ohlin B Nilsson PM Nilsson JA Berglund G . Chronic psychosocial stress predicts long-term cardiovascular morbidity and mortality in middle-aged men. Eur Heart J. (2004) 25:867–73. doi: 10.1016/j.ehj.2004.03.003,
26.
Truelsen T Nielsen N Boysen G Grønbaek M . Self-reported stress and risk of stroke the Copenhagen City heart study. Stroke. (2003) 34:856–62. doi: 10.1161/01.STR.0000062345.80774.40,
27.
Iso H Date C Yamamoto A Toyoshima H Tanabe N Kikuchi S et al . Perceived mental stress and mortality from cardiovascular disease among Japanese men and women. Circulation. (2002) 106:1229–36. doi: 10.1161/01.cir.0000028145.58654.41,
28.
Macleod J Smith GD Heslop P Metcalfe C Carroll D Hart C . Are the effects of psychosocial exposures attributable to confounding? Evidence from a prospective observational study on psychological stress and mortality. J Epidemiol Community Health. (2001) 55:878–84. doi: 10.1136/jech.55.12.878,
29.
Guyatt G Oxman AD Akl EA Kunz R Vist G Brozek J et al . GRADE guidelines: 1. Introduction-GRADE evidence profiles and summary of findings tables. J Clin Epidemiol. (2011) 64:383–94. doi: 10.1016/j.jclinepi.2010.04.026,
30.
Saini V Guada L Yavagal DR . Global epidemiology of stroke and access to acute ischemic stroke interventions. Neurology. (2021) 97:S6–S16. doi: 10.1212/WNL.0000000000012781,
31.
Sumi S Origasa H Houkin K Terayama Y Uchiyama S Daida H et al . A modified Essen stroke risk score for predicting recurrent cardiovascular events: development and validation. Int J Stroke. (2013) 8:251–7. doi: 10.1111/j.1747-4949.2012.00841.x,
32.
Booth J Connelly L Lawrence M Chalmers C Joice S Becker C et al . Evidence of perceived psychosocial stress as a risk factor for stroke in adults: a meta-analysis. BMC Neurol. (2015) 15:233. doi: 10.1186/s12883-015-0456-4
33.
Everson-Rose SA Lewis TT . Psychosocial factors and cardiovascular diseases. Annu Rev Public Health. (2005) 26:469–500. doi: 10.1146/annurev.publhealth.26.021304.144542,
34.
Pan A Sun Q Okereke OI Rexrode KM Hu FB . Depression and risk of stroke morbidity and mortality: a meta-analysis and systematic review. JAMA. (2011) 306:1241–9. doi: 10.1001/jama.2011.1282,
35.
Dong JY Zhang YH Tong J Qin LQ . Depression and risk of stroke: a meta-analysis of prospective studies. Stroke. (2012) 43:32–7. doi: 10.1161/STROKEAHA.111.630871,
36.
Everson SA Kaplan GA Goldberg DE Lakka TA Sivenius J Salonen JT . Anger expression and incident stroke: prospective evidence from the Kuopio ischemic heart disease study. Stroke. (1999) 30:523–8. doi: 10.1161/01.str.30.3.523,
37.
Williams JE Nieto FJ Sanford CP Couper DJ Tyroler HA . The association between trait anger and incident stroke risk: the atherosclerosis risk in communities (ARIC) study. Stroke. (2002) 33:13–20. doi: 10.1161/hs0102.101625,
38.
Rosman L Sico JJ Lampert R Gaffey AE Ramsey CM Dziura J et al . Posttraumatic stress disorder and risk for stroke in young and middle-aged adults: a 13-year cohort study. Stroke. (2019) 50:2996–3003. doi: 10.1161/STROKEAHA.119.026854,
39.
Kotlęga D Gołąb-Janowska M Masztalewicz M Ciećwież S Nowacki P . The emotional stress and risk of ischemic stroke. Neurol Neurochir Pol. (2016) 50:265–70. doi: 10.1016/j.pjnns.2016.03.006,
40.
Singh-Manoux A Gimeno D Kivimaki M Brunner E Marmot MG . Low HDL cholesterol is a risk factor for deficit and decline in memory in midlife: the Whitehall II study. Arterioscler Thromb Vasc Biol. (2008) 28:1556–62. doi: 10.1161/ATVBAHA.108.163998,
41.
Assadi SN . What are the effects of psychological stress and physical work on blood lipid profiles?Medicine (Baltimore). (2017) 96:e6816. doi: 10.1097/MD.0000000000006816,
42.
Malan L van Wyk R von Känel R Ziemssen T Vilser W Nilsson PM et al . The chronic stress risk phenotype mirrored in the human retina as a neurodegenerative condition. Stress (Amsterdam). (2023) 26:2210687. doi: 10.1080/10253890.2023.2210687,
43.
Mittleman MA Mostofsky E . Physical, psychological and chemical triggers of acute cardiovascular events: preventive strategies. Circulation. (2011) 124:346–54. doi: 10.1161/CIRCULATIONAHA.110.968776,
44.
Tawakol A Ishai A Takx RA Figueroa AL Ali A Kaiser Y et al . Relation between resting amygdalar activity and cardiovascular events: a longitudinal and cohort study. Lancet. (2017) 389:834–45. doi: 10.1016/S0140-6736(16)31714-7,
45.
Munakata M . Clinical significance of stress-related increase in blood pressure: current evidence in office and out-of-office settings. Hypertens Res. (2018) 41:553–69. doi: 10.1038/s41440-018-0053-1,
46.
Jennings JR Kamarck TW Everson-Rose SA Kaplan GA Manuck SB Salonen JT . Exaggerated blood pressure responses during mental stress are prospectively related to enhanced carotid atherosclerosis in middle-aged Finnish men. Circulation. (2004) 110:2198–203. doi: 10.1161/01.CIR.0000143840.77061.E9,
47.
BS ME . Brain on stress: how the social environment gets under the skin. Proc Natl Acad Sci USA. (2012) 109:17180–5. doi: 10.1073/pnas.1121254109
48.
Poitras VJ Pyke KE . The impact of acute mental stress on vascular endothelial function: evidence, mechanisms and importance. Int J Psychophysiol. (2013) 88:124–35. doi: 10.1016/j.ijpsycho.2013.03.019,
49.
Lowry CA Jin AY . Improving the social relevance of experimental stroke models: social isolation, social defeat stress and stroke outcome in animals and humans. Front Neurol. (2020) 11:427. doi: 10.3389/fneur.2020.00427,
50.
Everson SA Lynch JW Kaplan GA Lakka TA Sivenius J Salonen JT . Stress-induced blood pressure reactivity and incident stroke in middle-aged men. Stroke. (2001) 32:1263–70. doi: 10.1161/01.str.32.6.1263,
Summary
Keywords
stress, stroke, ischemic, hemorrhagic, case–control study, prospective cohort study
Citation
Wang Y, Shi X and Xu L (2026) The correlation between perceived psychosocial stress and stroke: a meta-analysis. Front. Neurol. 16:1639076. doi: 10.3389/fneur.2025.1639076
Received
01 June 2025
Revised
28 November 2025
Accepted
27 November 2025
Published
02 January 2026
Volume
16 - 2025
Edited by
Patricia Pia Wadowski, Medical University of Vienna, Austria
Reviewed by
Ivan Antonio Garcia-Montalvo, National Institute of Technology of Mexico, Mexico
Laurence Kristoffer Batino, National Cerebral and Cardiovascular Center, Japan
Updates
Copyright
© 2026 Wang, Shi and Xu.
This is an open-access article distributed under the terms of the Creative Commons Attribution License (CC BY). The use, distribution or reproduction in other forums is permitted, provided the original author(s) and the copyright owner(s) are credited and that the original publication in this journal is cited, in accordance with accepted academic practice. No use, distribution or reproduction is permitted which does not comply with these terms.
*Correspondence: Lei Xu, xuleijlu@jlu.edu.cn
†These authors have contributed equally to this work
Disclaimer
All claims expressed in this article are solely those of the authors and do not necessarily represent those of their affiliated organizations, or those of the publisher, the editors and the reviewers. Any product that may be evaluated in this article or claim that may be made by its manufacturer is not guaranteed or endorsed by the publisher.