Abstract
Background:
Sepsis-associated encephalopathy (SAE) is a frequent complication of sepsis, manifesting as acute brain dysfunction and often resulting in persistent cognitive deficits, neurological impairment, and increased mortality. Timely and accurate diagnosis of SAE is essential to guide therapeutic decisions and improve clinical outcomes. In recent years, neurogenic biomarkers have emerged as potential serum-based indicators for the diagnosis and progression monitoring of SAE.
Methods:
A comprehensive search of PubMed/MEDLINE, Embase, the Cochrane Library, Web of Science, and Scopus was conducted from inception to 30 April 2025. Weighted mean differences (WMDs) and 95% confidence intervals (CIs) were calculated using a random-effects model.
Results:
Forty-seven studies (50 arms) were included. Random-effects analysis revealed significant differences in serum NSE levels between SAE and NE adult patients (WMD = 6.82; 95% CI: 5.43, 8.21; P < 0.001), S100β levels (WMD = 0.48; 95% CI: 0.37, 0.60; P < 0.001), GFAP levels in the SAE group (WMD = 62.28; 95% CI: 45.42, 79.14; P < 0.001), TAU levels in the SAE individuals (WMD = 1.73; 95% CI: 0.95, 2.51; P < 0.001), UCH-L1 levels in SAE patients (WMD = 1.73; 95% CI: 0.95, 2.51; P < 0.001), APACHE II scores in the SAE group (WMD = 6.30; 95% CI: 4.61, 7.99; P < 0.001), and SOFA scores in SAE (WMD = 3.65; 95% CI: 2.96, 4.34; P < 0.001).
Conclusion:
Elevated serum levels of neurogenic biomarkers may serve as potential predictors of SAE and are associated with increased mortality in septic patients. These biomarkers show promise as reliable, minimally invasive tools for diagnosis and longitudinal monitoring of SAE. However, these findings should be interpreted with caution due to substantial heterogeneity across the included studies.
Introduction
Sepsis-associated encephalopathy (SAE) is a common and severe complication of sepsis, manifesting as diffuse cerebral dysfunction without overt central nervous system infection. The reported incidence of SAE varies widely from 9% to over 70% of septic patients, depending on diagnostic criteria and patient populations, with some studies suggesting rates as high as 83.6% in intensive care settings (1, 2). Clinically, SAE ranges from subtle delirium to deep coma and is independently associated with prolonged hospitalization, long-term cognitive impairment, and increased mortality (3).
The pathogenesis of SAE is multifactorial. Systemic inflammation disrupts the blood–brain barrier, allowing cytokines and immune cells to infiltrate the brain; concomitant microcirculatory dysfunction and metabolic derangements lead to hypoxia, oxidative stress, and neurogenic injury. Activated microglia and astrocytes further propagate neuroinflammation, while neurotransmitter imbalances contribute to encephalopathy. Although these mechanisms are well characterized, their relative contributions vary among individuals, complicating early and accurate diagnosis (4, 5).
Given the limitations of clinical evaluation and neuroimaging in diagnosing SAE, there has been growing interest in circulating neurogenic biomarkers as objective indicators of CNS injury. Key candidates include neuron-specific enolase (NSE), S100 calcium-binding protein B (S100β), glial fibrillary acidic protein (GFAP), tau protein (TAU), and ubiquitin C-terminal hydrolase L1 (UCH-L1) (6, 7). NSE and S100β originate predominantly from neurons and astrocytes, respectively; elevated serum levels have been linked to neurogenic damage and correlate with delirium severity (8). GFAP reflects astroglial injury, while TAU and UCH-L1 indicate microtubule disruption and ubiquitin-proteasome pathway alterations (9, 10). Early studies demonstrated significant increases in these biomarkers among SAE patients compared to septic patients without encephalopathy (NE), suggesting their potential utility in both diagnosis and prognostication (11–13).
Previous meta-analyses have demonstrated that elevated NSE levels are significantly associated with SAE and poorer outcomes (14), while higher S100β concentrations correlate moderately with SAE incidence and mortality risk (15). However, these reviews focused on single biomarkers and often exhibited high between-study heterogeneity. Evidence for GFAP, TAU, and UCH-L1 remains limited to small cohorts, and few studies have evaluated all five markers in parallel or examined their comparative diagnostic performance (2, 16). Moreover, the influence of covariates such as age, sepsis severity, sampling time, and assay variability on biomarker levels has not been systematically assessed.
To address these gaps, our study aims to (1) quantify the differences in serum levels of NSE, S100β, GFAP, TAU, and UCH-L1 between SAE and NE patients through pooled effect estimates; (2) evaluate diagnostic accuracy using subgroup and meta-regression analyses based on age, timing of sampling, and sample size; and (3) explore associations between biomarker concentrations and clinical outcomes, including organ dysfunction scores and mortality. By integrating data across multiple neurogenic biomarkers, this meta-analysis will clarify their relative and combined utility for the early identification and risk stratification of SAE, ultimately informing clinical decision-making and guiding future research.
Methods
Search strategy and selection criteria
This systematic review and meta-analysis was conducted in accordance with the Preferred Reporting Items for Systematic Reviews and Meta-Analyses (PRISMA) guidelines (17). Two investigators independently searched PubMed/MEDLINE, Embase, the Cochrane Library, Web of Science, and Scopus from database inception through April 30, 2025. The search combined terms related to “sepsis,” “encephalopathy,” and each neurogenic biomarker of interest (neuron-specific enolase, S100β, glial fibrillary acidic protein, tau protein, ubiquitin C-terminal hydrolase L1), using controlled vocabulary (e.g., MeSH and Emtree) and free-text keywords. No language restrictions were applied. Reference lists of included studies and relevant reviews were manually screened to identify additional eligible reports.
Study selection
Titles and abstracts retrieved through electronic searches were independently screened by two reviewers for relevance to adult septic patients with and without encephalopathy. Full texts were obtained for all studies deemed potentially eligible. We included observational cohort and case–control studies that reported quantitative serum or plasma levels of at least one of the specified neurogenic biomarkers in both SAE and non-encephalopathic sepsis (NE) groups. Studies were excluded if they lacked a comparator group without encephalopathy, did not report sufficient data to calculate mean differences and standard deviations, involved pediatric populations exclusively, or were case reports, reviews, conference abstracts, or animal studies. Disagreements were resolved through discussion or consultation with a third reviewer.
Data extraction
A standardized data collection form was used to extract characteristics from each eligible study, including first author, publication year, country, study design, patient demographics (mean age, gender distribution), sepsis definitions, criteria for encephalopathy, timing of biomarker sampling relative to sepsis onset, assay methods, and sample size per group. Outcome data comprised mean (and standard deviation) or median (and interquartile range) biomarker concentrations for SAE and NE groups, along with clinical outcomes such as APACHE II and SOFA scores and mortality rates. When necessary, medians and interquartile ranges were converted to means and standard deviations using established formulas.
Quality assessment
Study quality and risk of bias were independently appraised by two reviewers using the Cochrane-endorsed Quality Assessment of Diagnostic Accuracy Studies version 2 (QUADAS-2) tool (18). This framework evaluates four key domains—patient selection, conduct and interpretation of the index test, reference standard, and flow and timing—to assign judgments on bias risk and applicability. Any discrepancies between reviewers were discussed and reconciled to reach a consensus.
Data synthesis and statistical analysis
Meta-analyses were conducted using a random-effects model (DerSimonian and Laird) to account for between-study variability (19). Weighted mean differences (WMDs) with corresponding 95% confidence intervals (CIs) were calculated for each biomarker comparing the SAE to the NE groups. Heterogeneity was quantified using the I2 statistic, with values above 50% indicating substantial heterogeneity, and tested for significance using Cochran's Q. To explore the sources of heterogeneity, subgroup analyses were planned a priori by patient age, timing of sample collection, and study sample size. Meta-regression was performed to evaluate the impact of continuous covariates, including mean APACHE II score, assay type (e.g., ELISA vs. automated analyzer), and publication year, on effect estimates when at least 10 studies were available.
Potential publication bias was assessed through visual inspection of funnel plots and quantitatively tested with Egger's regression (20) and Begg's rank correlation tests (21). Duval and Tweedie's trim-and-fill method was applied to adjust the pooled estimates if asymmetry suggested missing studies (22). Sensitivity analyses were conducted by sequentially omitting each study (leave-one-out) to evaluate the influence of individual studies on overall results. All statistical analyses were performed using Stata version 17, with two-sided P-values of <0.05 considered statistically significant.
Results
Study characteristics
Figure 1 presents the PRISMA flowchart detailing the study selection process. The electronic databases search yielded 59,867 articles, of which 16,263 articles were detected as duplicates. Accordingly, 43,604 studies underwent a screening process based on titles and abstracts, leading to 210 articles retained for full-text evaluation. Eventually, 47 studies (50 arms) matched our inclusion criteria and were included in the meta-analysis. Study characteristics of all included studies are provided in Table 1. The included studies were conducted from 2000 to 2024, with mean ages of adult participants ranging from 27 to 80 years. Both genders (men and women) were included. Samples were collected over periods ranging from 1 to 3 days.
Figure 1

Study selection flow diagram.
Table 1
| Author | Year | N total | Sex | Age SAE (year) | Age NE (year) | Sample collection time (day) |
|---|---|---|---|---|---|---|
| Lin et al. | 2024 | 224 | Both | 44.45 | - | 1, 2 |
| Tan et al. | 2024 | 177 | Both | 71.55 | - | - |
| Cao et al. | 2023 | 100 | Both | 58.51 | 57.69 | Day of the medical visit |
| Chen et al. | 2023 | 90 | Both | 64.3 | - | - |
| Cui et al. | 2022 | 200 | Both | 72.78 | 72.86 | Within 48 h |
| Li et al. | 2022 | 41 | Both | 37 | 38 | 12, 24, 48 h |
| Wang et al. | 2022 | 80 | Both | 55.42 | 56.37 | 1, 3 day |
| Xiao et al. | 2022 | 149 | Both | 42.78 | 40.26 | ICU admission |
| Yu et al. | 2022 | 162 | Both | 70.3 | 69.7 | NR |
| Zhao1 et al. | 2022 | 60 | Both | 55.89 | 55.23 | NR |
| Zhao-2 et al. | 2022 | 163 | Both | NR | NR | ICU admission |
| Zhu et al. | 2022 | 186 | Both | 55.45 | 55.48 | Within 48 h |
| de Araujo et al. | 2022 | 27 | Both | 3–6 months | - | - |
| Cui et al. | 2022 | 200 | Both | 72.78 | 72.86 | Within 48 h |
| Li et al. | 2022 | 41 | Both | 37 | 38 | 12, 24, 48 h |
| Wang et al. | 2022 | 80 | Both | 55.42 | 56.37 | 1, 3 day |
| Yu et al. | 2022 | 162 | Both | 70.3 | 69.7 | NR |
| Zhao et al. | 2022 | 60 | Both | 55.89 | 55.23 | NR |
| Kang et al. | 2022 | 47 | Both | 27.5 | 21 | Within 24 h |
| Li et al. | 2022 | 41 | Both | 37 | - | 1, 2 |
| Li-2 et al. | 2022 | 72 | Both | 58.29 | - | 1 |
| Yang et al. | 2022 | 88 | NR | 80 | - | NR |
| Zhang et al. | 2022 | 75 | Both | 75.72 | 71.46 | 1, 4 day |
| Guo et al. | 2021 | 120 | Both | 57.61 | 56.91 | NR |
| Nong et al. | 2021 | 96 | Both | 8.68 | - | - |
| Jiang et al. | 2021 | 64 | Both | 42.45 | 41.2 | 4 h |
| Chen et al. | 2020 | 42 | Both | 68 | 58 | ICU admission |
| Meng et al. | 2020 | 178 | Both | 59.54 | 60.32 | NR |
| Yuan-1 et al. | 2020 | 184 | Both | 58.6 | 56.7 | NR |
| Hui et al. | 2020 | 60 | Both | 50.5 | 50.8 | 24 h after admission |
| Yuan (NE) et al. | 2020 | 56 | Both | - | 56.07 | NR |
| Yuan (SAE) et al. | 2020 | 128 | Both | 58.6 | - | NR |
| Zhou et al. | 2019 | 38 | Both | 53 | 46 | 1 day |
| Yan et al. | 2019 | 58 | Both | 55.8 | 55.0 | Within 24 h |
| Wu et al. | 2019 | 58 | Both | NR | NR | Within 24 h |
| Orthun et al. | 2019 | 86 | Both | 53.2 | - | The first few hours |
| El Shimy et al. | 2018 | 96 | Both | Neonates | Neonates | After birth follow up |
| Erikson et al. | 2019 | 22 | Both | 62.4 | 61.8 | When CAM-ICU assessed |
| Kristo et al. | 2018 | 22 | Both | 64.2 | - | - |
| Liao et al. | 2017 | 38 | Both | 55 | 51 | 1, 3 day |
| Feng et al. | 2017 | 59 | Both | 52 | 57 | 1, 3 day |
| Lu et al. | 2016 | 86 | Both | 59 | 58 | NR |
| Nguyen et al. | 2014 | 128 | NR | 65 | - | ICU admission, 4 day |
| Yao et al. | 2014 | 112 | Both | 56 | 52 | 1 day |
| Zhan et al. | 2013 | 34 | Both | 57 | - | 1 h |
| Zhang et al. | 2012 | 232 | Both | 51.5 | - | - |
| Lin et al. | 2012 | 50 | Both | 51 | 51 | - |
| Li et al. | 2011 | 50 | Both | 52 | 48 | - |
| Hamed et al. | 2009 | 40 | NR | 51.75 | - | NR |
| Weigand et al. | 2000 | 29 | NR | - | - | 1 day |
Summary of included studies.
Methodological quality
Quality assessment was conducted using the QUADAS-2 tool and is presented in Figure 2. The quality of the included studies varied. Overall, concerns regarding the applicability of the included studies to the review question were less significant than our concerns about the risk of bias. High risk of bias was mainly focused on flow and timing, and high applicability concerns mostly came from patient selection and index text, which may be attributed to various diagnostic criteria of SAE.
Figure 2

Quality assessment.
Meta-analysis results
NSE in adults
A total of 31 studies (23–42) encompassing 3,216 participants were included in the analysis comparing serum NSE levels between patients with SAE and those without encephalopathy (NE). Random-effects analysis revealed a significant difference in serum NSE levels between SAE and NE adult patients (WMD = 6.82; 95% CI: 5.43, 8.21; P < 0.001; I2 = 98.9%, P < 0.001; Figure 3A). Subgroup analysis based on age demonstrated that serum NSE level in both SAE and NE adults was significantly elevated in both younger (<55 years) and older (>55 years) individuals (P < 0.05; Table 2). Moreover, subgroup analysis based on timing of sample collection showed that NSE levels were significantly higher in patients with SAE compared to those without NE, both when samples were collected within 1 day (P < 0.001) and after 1 day (P < 0.001) of sepsis onset. This finding indicates a significant elevation of NSE in SAE patients regardless of sampling time. In addition, serum NSE levels were significantly elevated in studies with sample sizes both below 100 and those with 100 or more participants. A small-study effect was observed in Egger's and Begg's tests (P = 0.020 and 0.012, respectively). However, visual inspection of the funnel plot (Figure 3B) revealed asymmetric distribution.
Figure 3

Forest plot (A) and funnel plot (B) evaluate the association between serum neurogenic biomarker levels and NSE.
Table 2
| Subgroups | NO | SMD (95% CI) | P-within | I 2 (%) | P-heterogeneity |
|---|---|---|---|---|---|
| NSE | |||||
| Age SAE patients (year) | |||||
| ≤ 50 | 11 | 8.12 (3.47, 12.76) | 0.001 | 99.3 | <0.001 |
| >50 | 18 | 6.51 (5.07, 7.95) | <0.001 | 98.2 | <0.001 |
| NR | 2 | 0.91 (0.13, 1.70) | 0.023 | 69.9 | 0.068 |
| Age NE patients (year) | |||||
| ≤ 50 | 12 | 9.03 (4.86, 13.20) | <0.001 | 99.2 | <0.001 |
| >50 | 17 | 5.71 (4.29, 7.13) | <0.001 | 98.0 | <0.001 |
| NR | 2 | 0.91 (0.13, 1.70) | 0.023 | 69.9 | 0.068 |
| Sample collection time (day) | |||||
| ≤ 1 | 12 | 9.41 (6.18, 12.64) | <0.001 | 98.3 | <0.001 |
| >1 | 8 | 8.82 (4.14, 13.51) | <0.001 | 99.5 | <0.001 |
| NR | 11 | 2.96 (1.96, 3.95) | <0.001 | 95.7 | <0.001 |
| Sample size | |||||
| ≤ 100 | 17 | 8.66 (5.28, 12.03) | <0.001 | 99.0 | <0.001 |
| >100 | 14 | 4.67 (3.39, 5.95) | <0.001 | 98.4 | <0.001 |
| S100β | |||||
| Age SAE patients (year) | |||||
| ≤ 50 | 12 | 0.74 (0.42, 1.05) | <0.001 | 99.9 | <0.001 |
| >50 | 17 | 0.36 (0.27, 0.45) | <0.001 | 97.4 | <0.001 |
| NR | 4 | 0.20 (0.03, 0.36) | 0.023 | 97.2 | <0.001 |
| Age NE patients (year) | |||||
| ≤ 50 | 0.90 (0.53, 1.27) | <0.001 | 99.9 | <0.001 | |
| >50 | 0.30 (0.21, 0.38) | <0.001 | 96.9 | <0.001 | |
| NR | 0.18 (0.08, 0.27) | <0.001 | 96.6 | <0.001 | |
| Sample collection time (day) | |||||
| ≤ 1 | 15 | 0.51 (0.37, 0.66) | <0.001 | 99.3 | <0.001 |
| >1 | 10 | 0.64 (0.30, 0.98) | <0.001 | 99.9 | <0.001 |
| NR | 8 | 0.23 (0.15, 0.31) | <0.001 | 93.1 | <0.001 |
| Sample size | |||||
| ≤ 100 | 20 | 0.65 (0.48, 0.83) | <0.001 | 99.8 | <0.001 |
| >100 | 13 | 0.22 (0.16, 0.27) | <0.001 | 94.2 | <0.001 |
| TAU | |||||
| Sample collection time (day) | 0.020 | ||||
| ≤ 1 | 4 | 1.66 (0.26, 3.06) | <0.001 | 97.3 | <0.001 |
| >1 | 6 | 1.78 (0.96, 2.60) | 90.2 | <0.001 | |
| Mortality | |||||
| Age SAE patients (year) | |||||
| ≤ 50 | 3 | −0.09 (−3.97, 3.79) | 0.963 | 98.4 | <0.001 |
| >50 | 12 | −3.61 (−5.96, −1.25) | 0.003 | 95.1 | <0.001 |
| NR | 2 | −5.72 (−9.55, −1.90) | 0.003 | 71.6 | 0.060 |
| ≤ 50 | 3 | 4.11 (−2.64, 10.86) | 0.233 | 96.2 | <0.001 |
| >50 | 5 | −0.25 (−3.07, 2.58) | 0.865 | 96.5 | <0.001 |
| NR | 9 | −7.96 (−10.50, −5.42) | <0.001 | 89.0 | <0.001 |
| Sample collection time (day) | |||||
| ≤ 1 | 8 | −2.02 (−4.21, 0.17) | 0.070 | 94.8 | <0.001 |
| >1 | 2 | −18.63 (−22.19, −15.06) | <0.001 | 0.0 | 0.512 |
| NR | 7 | −1.87 (−4.62, 0.88) | 0.182 | 96.2 | <0.001 |
| Sample size | |||||
| ≤ 100 | 11 | −5.88 (−7.36, −4.40) | <0.001 | 94.3 | <0.001 |
| >100 | 6 | 4.27 (−2.91, 11.45) | 0.243 | 96.6 | <0.001 |
Subgroup analyses for the comparison between outcomes.
NSE in children
A total of four studies encompassing 315 children showed a significant difference in serum NSE level between SAE and NE children (WMD = 19.70; 95% CI: 9.53, 29.88; P < 0.001; I2 = 96.9%, P < 0.001; Figure 4).
Figure 4
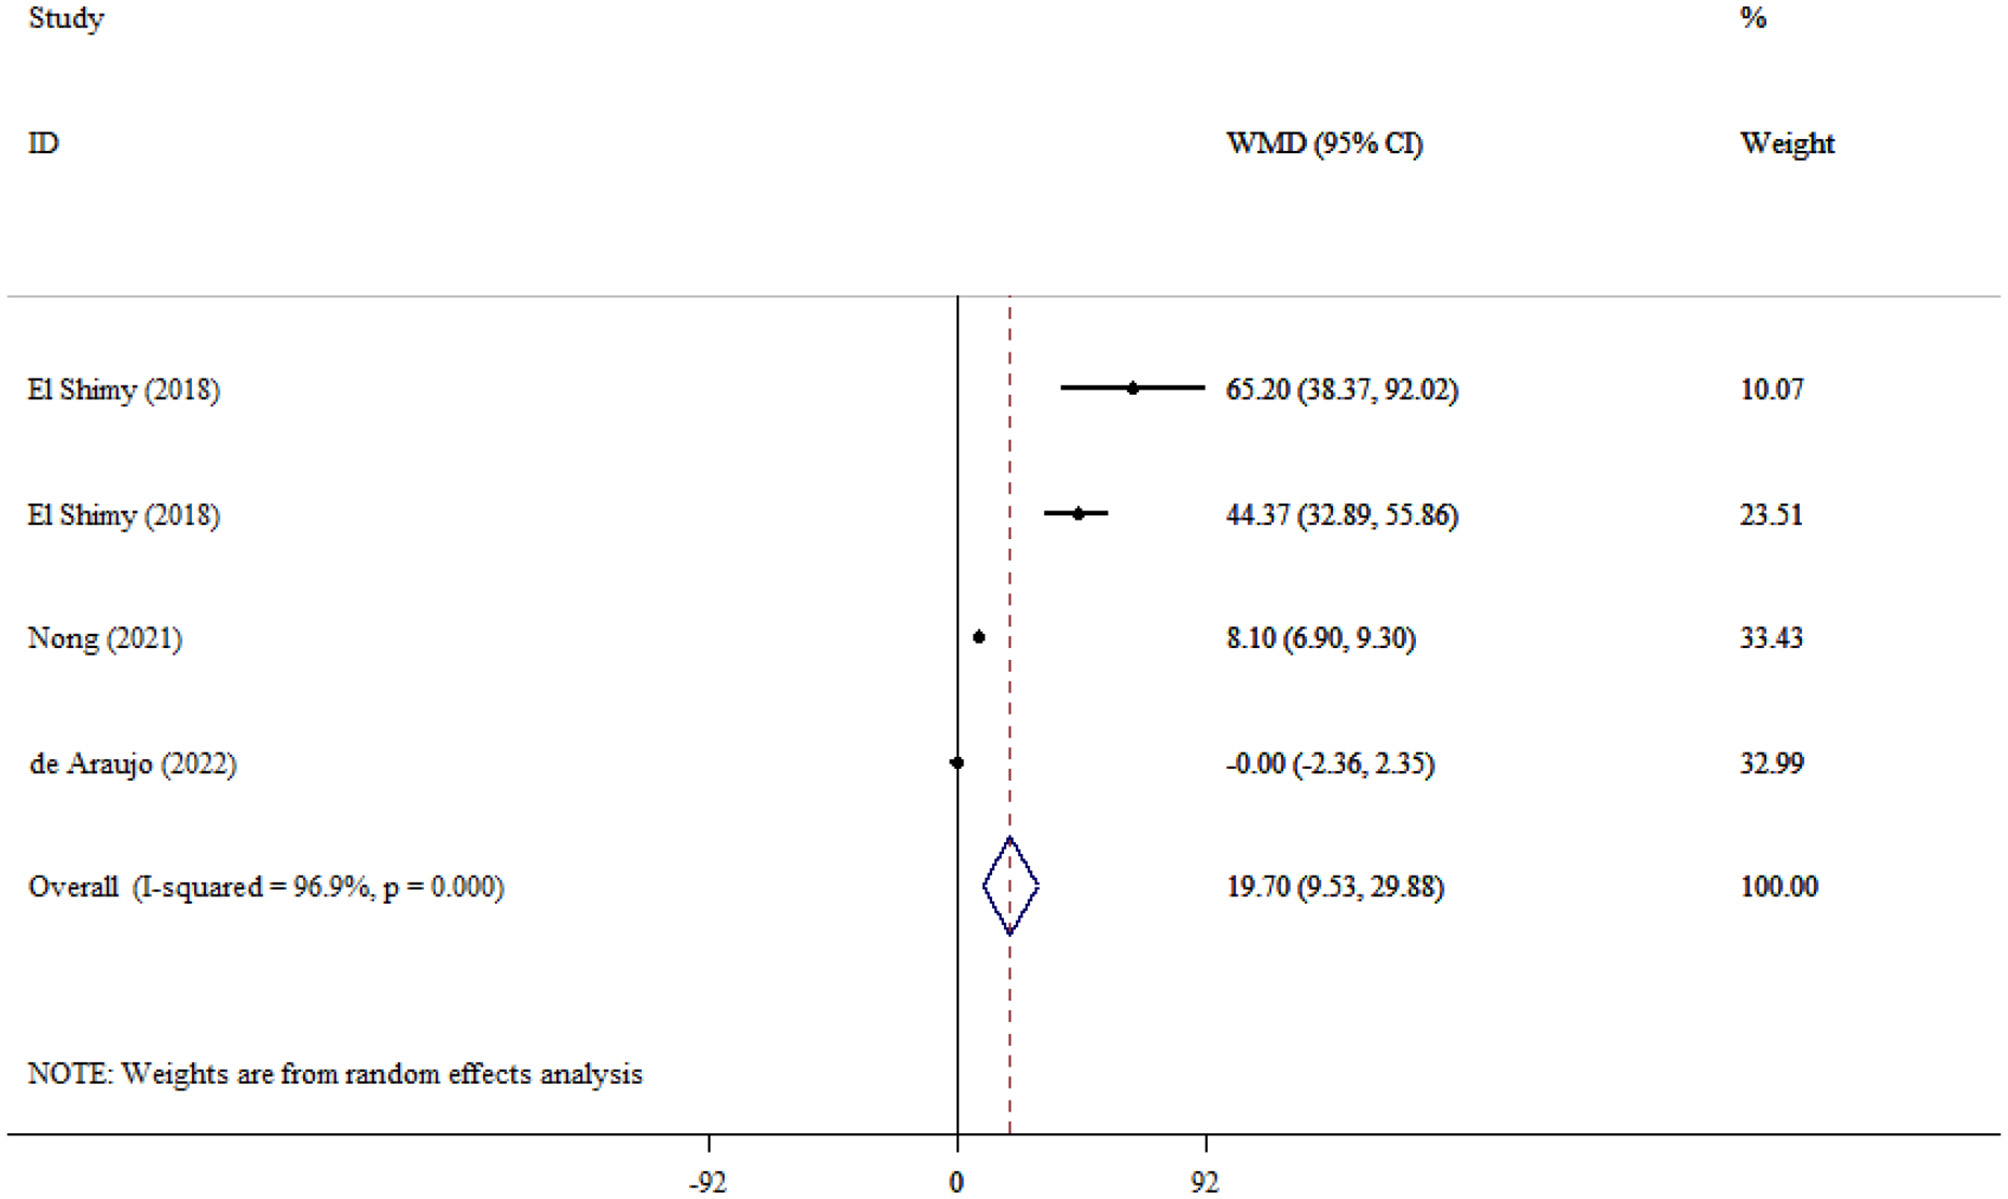
Forest plot evaluates the association between serum neurogenic biomarker levels and NSE in children.
S100β
A total of 33 studies encompassing 2,819 participants were included in the analysis comparing S100β levels between patients with SAE and NE patients. The pooled analysis demonstrated that S100β levels were significantly higher in SAE patients compared to NE patients (WMD = 0.48; 95% CI: 0.37, 0.60; P < 0.001; I2 = 99.7%, P < 0.001; Figure 5A). In addition, subgroup analysis indicated that S100β levels were significantly elevated in both younger (<55 years) and older (>55 years) adults, regardless of whether they had SAE or NE (P < 0.001; Table 2). Moreover, S100β levels were significantly higher in SAE patients compared to those without NE, both when samples were collected within 1 day (P < 0.001) and after 1 day (P < 0.001) of sepsis onset. In addition, serum S100β levels were significantly elevated in studies with sample sizes both below 100 and those with 100 or more participants. A significant small-study effect was observed in Egger's and Begg's tests (P = 0.034 and 0.001, respectively). However, visual inspection of the funnel plot (Figure 5B) revealed an asymmetric distribution.
Figure 5

Forest plot (A) and funnel plot (B) evaluate the association between serum neurogenic biomarker levels and S100β.
GFAP
Seven studies (16, 27, 28, 37, 41, 42), including 871 patients, compared GFAP levels between SAE and NE patients and found that GFAP levels were significantly higher in the SAE group (WMD = 62.28; 95% CI: 45.42, 79.14; P < 0.001), indicating pronounced astroglial injury. Considerable heterogeneity was observed across studies (I2 = 99.9%, P < 0.001; Figure 6).
Figure 6

Forest plot evaluating the association between serum neurogenic biomarker levels and GFAP.
TAU
A total of 10 studies (990 participants) (38, 43), comparing Tau protein levels between patients with SAE and NE patients, were included in the analysis. The combined effect analysis elucidated that TAU levels were significantly higher in SAE individuals (WMD = 1.73; 95% CI: 0.95, 2.51; P < 0.001; I2 = 96.1%, P < 0.001; Figure 7). Furthermore, subgroup analysis based on time of sampling indicated that TAU levels were significantly elevated in SAE patients compared to those with NE, both when samples were collected within 1 day (P < 0.001) and after 1 day (P < 0.001) of sepsis onset (Table 2).
Figure 7

Forest plot evaluates the association between serum neurogenic biomarker levels and TAU.
UCH-L1
Two studies evaluated UCH-L1 levels between SAE and NE patients, and the pooled analysis showed elevated levels of UCH-L1 in SAE compared to NE patients (WMD = 1.73; 95% CI: 0.95, 2.51; P < 0.001). In addition, there was significant heterogeneity between studies (I2 = 96.1%, P < 0.001; Figure 8).
Figure 8

Forest plot evaluates the association between serum neurogenic biomarker levels and UCH-L1.
APACHE II
Six studies attempted to compare the APACHE II score between SAE and NE patients and demonstrated that APACHE II scores were significantly higher in the SAE group (WMD = 6.30; 95% CI: 4.61, 7.99; P < 0.001). Substantial heterogeneity was observed among studies (I2 = 99.7%, P < 0.001; Figure 9).
Figure 9

Forest plot evaluates the association between serum neurogenic biomarker levels and APACHI.
SOFA
The pooled effect size of four studies evaluating the SOFA scores between SAE and NE patients showed that the SOFA scores were significantly increased in SAE compared to NE patients (WMD = 3.65; 95% CI: 2.96, 4.34; P < 0.001), pointing to greater organ dysfunction. In addition, moderate to high heterogeneity was observed among the studies (I2 = 65.3%, P = 0.034; Figure 10).
Figure 10
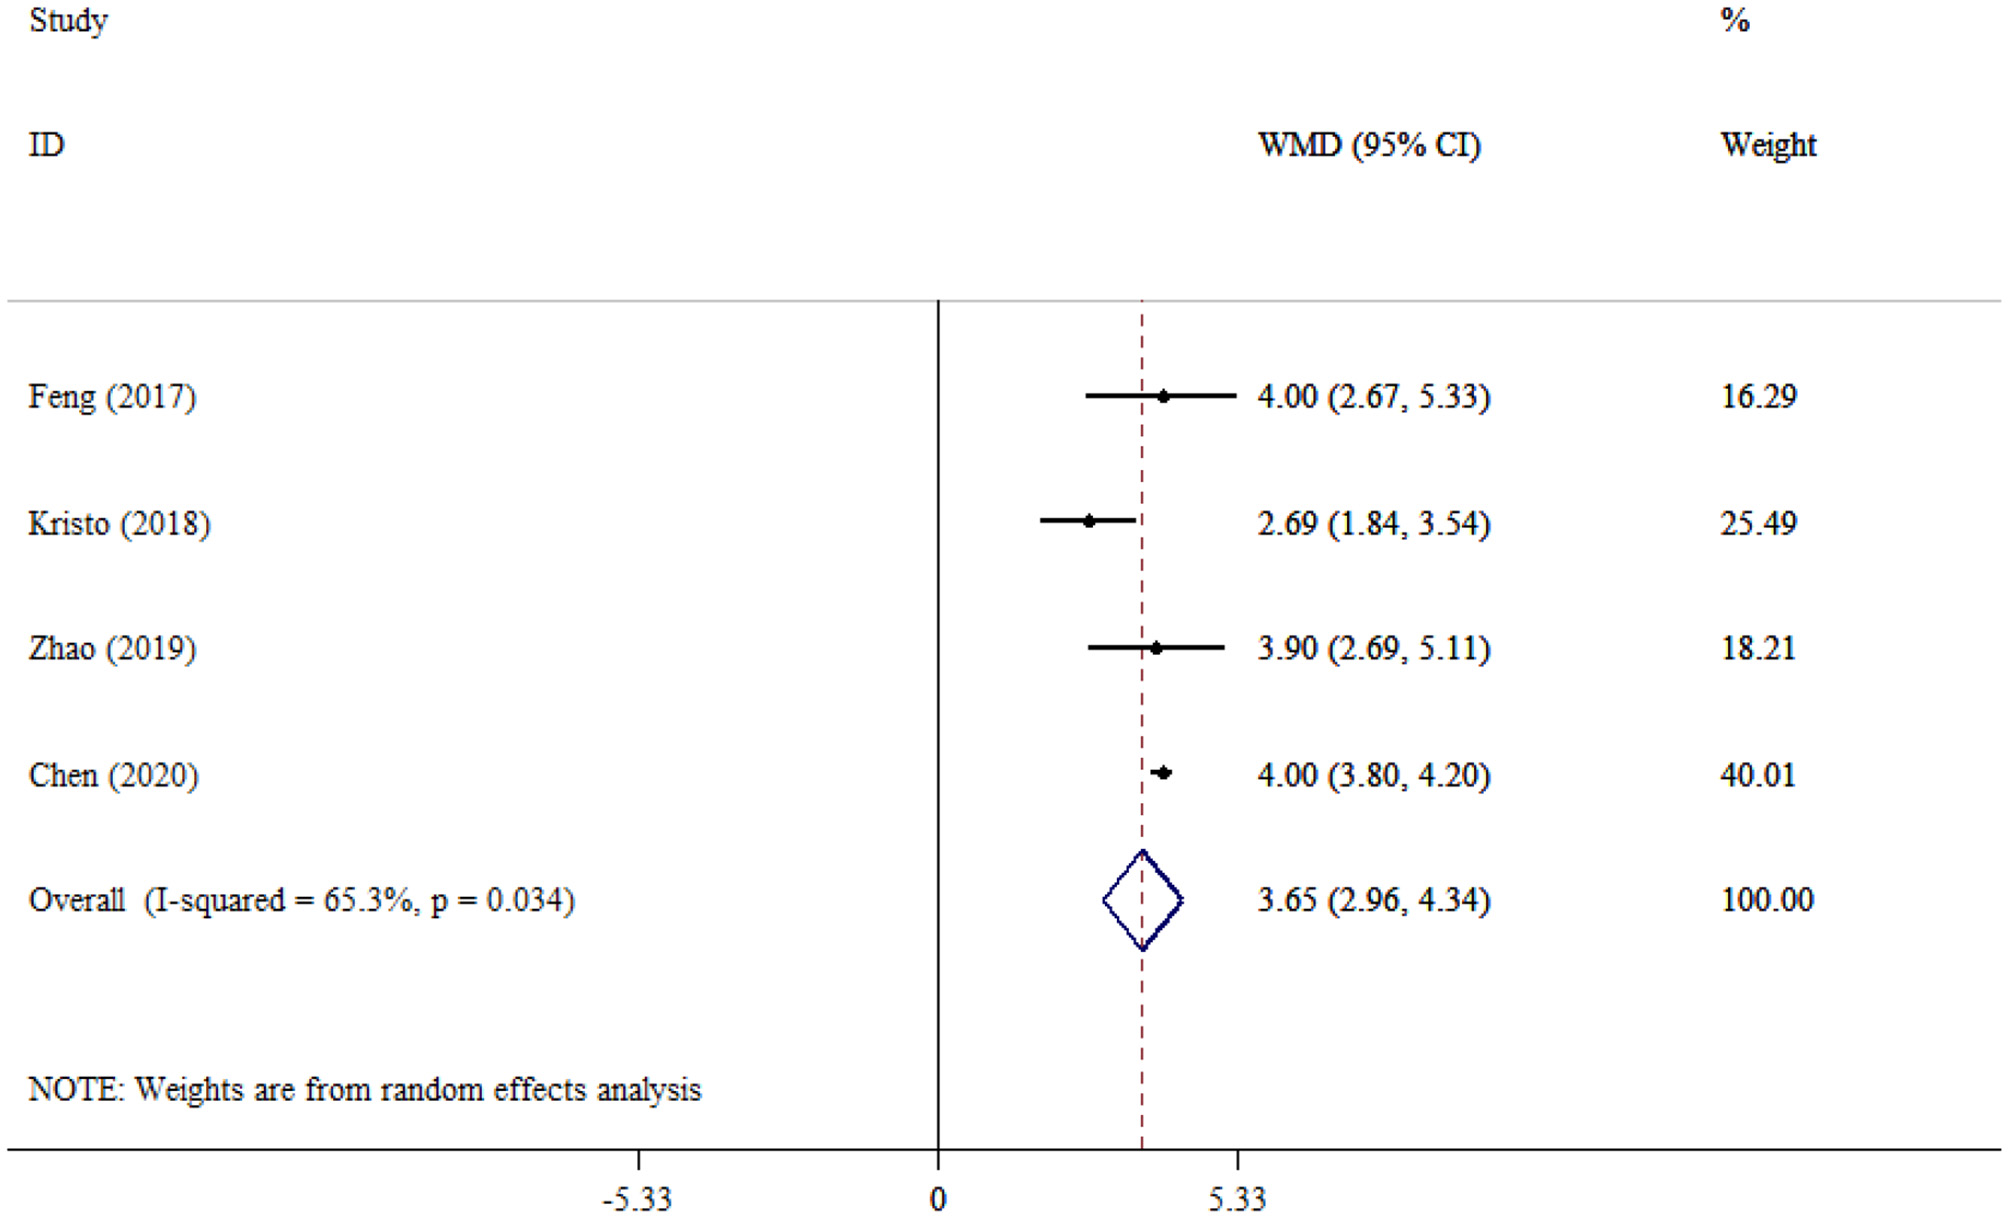
Forest plot evaluates the association between serum neurogenic biomarker levels and SOFA.
Death
Pooled data from 17 studies (948 survival vs. 446 deaths) comparing mortality between patients with SAE and NE demonstrated significantly lower mortality in the NE group (WMD = −3.15; 95% CI: −4.74 to −1.55; P < 0.001). Substantial heterogeneity was observed across studies (I2 = 95.6%, P < 0.001; Figure 11A). Subgroup analysis indicated that, among NE patients, mortality was significantly lower in older adults (>55 years; P = 0.003), whereas no significant difference was observed in younger adults (P = 0.0963). In the NE group, mortality differences between older (P = 0.865) and younger (P = 0.233) adults were also non-significant. In addition, mortality was significantly lower when samples were collected after 1 day of sepsis onset in SAE patients (P < 0.001). While there was no significant difference in mortality when samples were collected within 1 day (P = 0.070; Table 2). No small-study effect was detected based on Egger's test (P = 0.290) and Begg's test (P = 0.650). Additionally, visual inspection of the funnel plot (Figure 11B) revealed an asymmetric distribution, suggesting potential publication bias.
Figure 11

Forest plot (A) and funnel plot (B) evaluate the association between serum neurogenic biomarker levels and death in patients.
Sensitivity analysis
In the sensitivity analysis, the removal of any single study did not affect the overall ES estimate for NSE, S100β, APACHE II, GFAP, TAU, UCH-L1, SOFA, and mortality.
Discussion
SAE is an important complication of sepsis and requires critical management. In this regard, several neurogenic biomarkers and clinical severity scoring systems have been developed. To this end, this updated meta-analysis evaluated a panel of neurogenic biomarkers, including NSE, S100β, APACHE II, GFAP, TAU, UCH-L1, SOFA, and mortality, to differentiate between sepsis patients with and without encephalopathy. These biomarkers provide valuable insights into the underlying SAE pathophysiology and disease severity using the APACHE II and SOFA scoring systems. Moreover, mortality rates were also evaluated and compared between SAE and NE patients.
Accordingly, serum NSE levels were significantly elevated in SAE patients compared to NE patients. NSE, an enolase isoenzyme expressed in neurons, enters the bloodstream following neurogenic injury (11). An excessive increase in released NSE indicates neuroinflammation, which has important clinical implications. Despite the high heterogeneity (I2 = 98.9%), the increase in NSE was consistent across both age subgroups (<50 and >50 years) in SAE patients, suggesting that the neurogenic injury is an age-independent phenomenon. Similarly, despite high heterogeneity, elevated NSE levels were also observed in NE patients across both age subgroups (<50 and >50 years). This finding suggests that neurological dysfunction may occur even in the absence of sepsis. Furthermore, subgroup analysis demonstrated that elevated NSE levels can be observed regardless of the timing of sample collection (within 1 day or beyond 1 day after sepsis onset). These findings suggest that elevated NSE levels may reflect neuroinflammation during the acute phase and subsequent neurodegeneration during the prolonged phase. We also explored the pediatric population, though limited studies were available, and found that serum NSE levels were significantly higher in the SAE group than in the NE group, both in adults and children. Thus, there appears to be no age limitation for the diagnostic value of serum NSE in SAE. This finding is consistent with a previous study (15).
Pooled data showed that serum S100β levels were significantly higher in SAE patients compared to NE patients. S100β is predominantly expressed by astrocytes and is released into the peripheral circulation in response to neurogenic injury (44). Similarly, elevated serum levels of S100β have been widely recognized as a surrogate marker of blood–brain barrier (BBB) dysfunction, which plays an important role in the development of neuroinflammation (45). Thus, increased S100β levels may serve as a hallmark of BBB permeability. As indicated in the subgroup analysis based on age groups, S100β levels were significantly elevated in both younger (<55 years) and older (>55 years) adults, in both SAE and NE groups, despite the presence of substantial heterogeneity (I2 = 99.7%). This finding underscores that glial response to sepsis may occur in all age groups. However, Weigand et al. reported no significant difference in serum S100β between sepsis survivors and non-survivors (46). Although Glasgow Coma Scale (GCS) scores have been shown to be correlated with S100β levels in the diagnosis of SAE (23), additional diagnostic approaches and complementary methodologies are warranted to enhance diagnostic accuracy and support the development of treatment guidelines. In this regard, Cohen et al. introduced S100β as a marker for cognitive dysfunction in SAE too (47). Similarly, Calsavara et al. pointed to the possible association between serum S100β and anxiety and depression in SAE individuals (48). Previous studies have suggested a bidirectional association between S100β and SAE, indicating that elevated S100β levels may contribute to the development of SAE, while SAE itself may further elevate S100β levels through an as-yet unknown mechanism. Zhang et al. found that S100B may regulate mitochondrial dynamics through the RAGE/ceramide pathway, which results in cognitive dysfunction (49). Although each biomarker represents distinct mechanisms, the combined evaluation of NSE and S100β may provide insights into neuronal damage and blood–brain barrier disruption, which contribute to increased sensitivity and efficacy of SAE diagnosis.
However, the combined analysis of these studies illustrated increased levels of glial and neurogenic components, including GFAP, TAU, and UCH-L1, in SAE compared to NE individuals. The pronounced elevation of GFAP (WMD = 62.28; 95% CI: 45.42–79.14) points to a key role for astroglial activation and injury in SAE pathophysiology. This finding supports the possible use of GFAP as a threshold indicator for severe SAE, pending further studies to establish cut-off values. In addition, the consistent elevation of TAU and UCH-1 reveals axonal and neuronal degeneration involved in SAE pathophysiology.
Beyond neurogenic markers, clinical severity scores, including APACHE II and SOFA, were significantly higher in patients with SAE compared to NE individuals. These scoring systems are recognized for assessing the extent of physiological dysfunction in critically ill patients. The elevated scores observed in the SAE group suggest that encephalopathy may be linked to greater systemic severity, which may be driven by an increased inflammatory condition or multi-organ failure. Encephalopathy indicates a poor prognosis for patients suffering from sepsis (50). The elevated levels of neurogenic biomarkers alongside clinical severity indices such as APACHE II and SOFA highlight their role in the disease burden.
Overall, significant differences were observed between SAE and NE patients in studied outcomes, including NSE, S100β, and a particularly larger effect size for GFAP, underscoring the evaluation of the multi-biomarker panel approach. Future studies should investigate whether the combined assessment of NSE + S100β + GFAP can improve the sensitivity and specificity of SAE diagnosis compared with single markers specifically. Similarly, well-designed prospective studies are warranted to address this study gap and to validate the clinical utility of combined biomarker assessment in SAE. Accordingly, such studies will help translate biomarker-based panels into clinically applicable diagnostic tools.
In addition, the mortality rate was significantly lower in NE vs. SAE. The high heterogeneity across studies may trigger controversy over the results. As subgroup analysis provided further insights into age-related differences, mortality was significantly lower in older adults (>55 years) than among SAE patients. Age-specific physiological conditions and earlier recognition and treatment in older individuals may be responsible for these differences in the results. Whereas, mortality did not differ significantly across age groups in NE patients. Moreover, the mortality rate was lower in SAE individuals when sample collection was carried out more than 24 h after sepsis onset.
One of the strengths of this study is its evaluation of a broader range of neurogenic and severity-scoring biomarkers, offering a more comprehensive approach. However, this study has some limitations too. First, the diagnostic criteria for sepsis 1.0 have high sensitivity with low specificity. Second, there was considerable variability in the diagnostic criteria for SAE, which may undermine the robustness of comparisons and contribute to observed heterogeneity. It is recommended to use a standardized diagnostic marker. Third, this study has potential publication bias. Fourth, various assay methods, sample processing techniques, and timing of sampling may introduce variability in the results and deserve further elaboration in future research. Fifth, the limited number of included studies and their small sample sizes restrict the generalizability of findings, particularly for UCH-L1, SOFA, and APACHE II scores, as well as NSE outcomes in pediatric populations.
Conclusion
This study highlights promising pharmacological targets for preventing SAE. In total, increased levels of common serum neurogenic biomarkers and mortality were associated with SAE, which may be useful in the diagnosis of SAE patients. The findings for UCH-L1, SOFA, and APACHE II scores should be interpreted cautiously, as they preliminarily suggest potential value but require further validation in larger, well-designed studies.
Statements
Data availability statement
The datasets presented in this study can be found in online repositories. The names of the repository/repositories and accession number(s) can be found in the article/supplementary material.
Author contributions
XL: Conceptualization, Data curation, Formal analysis, Funding acquisition, Investigation, Methodology, Project administration, Resources, Software, Supervision, Validation, Visualization, Writing – original draft, Writing – review & editing. JZ: Conceptualization, Data curation, Formal analysis, Funding acquisition, Investigation, Methodology, Project administration, Resources, Software, Supervision, Validation, Visualization, Writing – original draft, Writing – review & editing. TR: Conceptualization, Data curation, Formal analysis, Funding acquisition, Investigation, Methodology, Project administration, Resources, Software, Supervision, Validation, Visualization, Writing – original draft, Writing – review & editing. HC: Conceptualization, Data curation, Formal analysis, Funding acquisition, Investigation, Methodology, Project administration, Resources, Software, Supervision, Validation, Visualization, Writing – original draft, Writing – review & editing. CC: Conceptualization, Data curation, Formal analysis, Funding acquisition, Investigation, Methodology, Project administration, Resources, Software, Supervision, Validation, Visualization, Writing – original draft, Writing – review & editing. YW: Conceptualization, Data curation, Formal analysis, Funding acquisition, Investigation, Methodology, Project administration, Resources, Software, Supervision, Validation, Visualization, Writing – original draft, Writing – review & editing.
Funding
The author(s) declare that financial support was received for the research and/or publication of this article. This study was funded by the Huai'an Science and Technology Plan Project (HABL202251), the Key Research and Development and Transformation Project of Qinghai Province (2024-QY-213), and the Huai'an Health Research Project (HAWJ2024025).
Conflict of interest
The authors declare that the research was conducted in the absence of any commercial or financial relationships that could be construed as a potential conflict of interest.
Generative AI statement
The author(s) declare that no Gen AI was used in the creation of this manuscript.
Any alternative text (alt text) provided alongside figures in this article has been generated by Frontiers with the support of artificial intelligence and reasonable efforts have been made to ensure accuracy, including review by the authors wherever possible. If you identify any issues, please contact us.
Publisher’s note
All claims expressed in this article are solely those of the authors and do not necessarily represent those of their affiliated organizations, or those of the publisher, the editors and the reviewers. Any product that may be evaluated in this article, or claim that may be made by its manufacturer, is not guaranteed or endorsed by the publisher.
References
1.
Chaudhry N Duggal AK . Sepsis associated encephalopathy. Adv Med. (2014) 2014:762320. 10.1155/2014/762320
2.
Zhang Z Guo L Jia L Duo H Shen L Zhao H . Factors contributing to sepsis-associated encephalopathy: a comprehensive systematic review and meta-analysis. Front Med. (2024) 11:1379019. 10.3389/fmed.2024.1379019
3.
Jiang S Gunther M Maldonado JR Efron PA DeKosky ST Jiang H . Investigating sepsis-associated delirium through optical neuroimaging: a new frontier in critical care research. Chemosensors. (2024) 12:264. 10.3390/chemosensors12120264
4.
Sonneville R Benghanem S Jeantin L de Montmollin E Doman M Gaudemer A et al . The spectrum of sepsis-associated encephalopathy: a clinical perspective. Crit Care. (2023) 27:386. 10.1186/s13054-023-04655-8
5.
Wang R Bi W Huang S Han Q Deng J Wang Z et al . Recent advances in the pathogenesis, diagnosis, and treatment of sepsis-associated encephalopathy. Brain-X. (2024) 2:e67. 10.1002/brx2.67
6.
Mahan MY Thorpe M Ahmadi A Abdallah T Casey H Sturtevant D et al . Glial fibrillary acidic protein (GFAP) outperforms S100 calcium-binding protein B (S100B) and ubiquitin C-terminal hydrolase L1 (UCH-L1) as predictor for positive computed tomography of the head in trauma subjects. World Neurosurg. (2019) 128:e434–44. 10.1016/j.wneu.2019.04.170
7.
Hu J Li W Xie S Liao Y Chen T Wang X et al . Unveiling neurogenic biomarkers for the differentiation between sepsis patients with or without encephalopathy: an updated meta-analysis. Syst Rev. (2025) 14:38. 10.1186/s13643-025-02784-5
8.
Mietani K Hasegawa-Moriyama M Inoue R Ogata T Shimojo N Kurano M et al . Elevated neuron-specific enolase level is associated with postoperative delirium and detection of phosphorylated neurofilament heavy subunit: a prospective observational study. PLoS ONE. (2021) 16:e0259217. 10.1371/journal.pone.0259217
9.
Korley F Jain S Sun X Puccio A Yue J Gardner R et al . Prognostic value of day-of-injury plasma GFAP and UCH-L1 concentrations for predicting functional recovery after traumatic brain injury in patients from the US TRACK-TBI cohort: an observational cohort study. Lancet Neurol. (2022) 21:803–13. 10.1016/S1474-4422(22)00256-3
10.
Mietelska-Porowska A Wasik U Goras M Filipek A Niewiadomska G . Tau protein modifications and interactions: their role in function and dysfunction. Int J Mol Sci. (2014) 15:4671–713. 10.3390/ijms15034671
11.
Hu J Xie S Liao Y Chen W Qian Z Zhang L . Can serum NSE predict and evaluate sepsis-associated encephalopathy: a protocol for a systematic review and meta-analysis. J Clin Neurosci. (2024) 124:150–3. 10.1016/j.jocn.2024.04.029
12.
Pierrakos C Velissaris D Bisdorff M Marshall JC Vincent JL . Biomarkers of sepsis: time for a reappraisal. Crit Care. (2020) 24:287. 10.1186/s13054-020-02993-5
13.
Barichello T Generoso JS Singer M Dal-Pizzol F . Biomarkers for sepsis: more than just fever and leukocytosis-a narrative review. Crit Care. (2022) 26:14. 10.1186/s13054-021-03862-5
14.
Hu J Xie S Xia W Huang F Xu B Zuo Z et al . Meta-analysis of evaluating neuron specific enolase as a serum biomarker for sepsis-associated encephalopathy. Int Immunopharmacol. (2024) 131:111857. 10.1016/j.intimp.2024.111857
15.
Hu J Xie S Li W Zhang L . Diagnostic and prognostic value of serum S100B in sepsis-associated encephalopathy: a systematic review and meta-analysis. Front Immunol. (2023) 14:1102126. 10.3389/fimmu.2023.1102126
16.
Wu L Ai M-L Feng Q Deng S Liu Z-Y Zhang L-N et al . Serum glial fibrillary acidic protein and ubiquitin C-terminal hydrolase-L1 for diagnosis of sepsis-associated encephalopathy and outcome prognostication. J Crit Care. (2019) 52:172–9. 10.1016/j.jcrc.2019.04.018
17.
Page MJ McKenzie JE Bossuyt PM Boutron I Hoffmann TC Mulrow CD et al . The PRISMA 2020 statement: an updated guideline for reporting systematic reviews. BMJ. (2021) 372:n71. 10.1136/bmj.n71
18.
Whiting PF Rutjes AW Westwood ME Mallett S Deeks JJ Reitsma JB et al . QUADAS-2: a revised tool for the quality assessment of diagnostic accuracy studies. Ann Intern Med. (2011) 155:529–36. 10.7326/0003-4819-155-8-201110180-00009
19.
DerSimonian R Kacker R . Random-effects model for meta-analysis of clinical trials: an update. Contemp Clin Trials. (2007) 28:105–14. 10.1016/j.cct.2006.04.004
20.
Egger M Smith GD Schneider M Minder C . Bias in meta-analysis detected by a simple, graphical test. BMJ. (1997) 315:629–34. 10.1136/bmj.315.7109.629
21.
Begg CB Mazumdar M . Operating characteristics of a rank correlation test for publication bias. Biometrics. (1994) 50:1088–101. 10.2307/2533446
22.
Duval S Tweedie R . A nonparametric “trim and fill” method of accounting for publication bias in meta-analysis. J Am Stat Assoc. (2000) 95:89–98. 10.1080/01621459.2000.10473905
23.
Yao B Zhang L-N Ai Y-H Liu Z-Y Huang L . Serum S100β is a better biomarker than neuron-specific enolase for sepsis-associated encephalopathy and determining its prognosis: a prospective and observational study. Neurochem Res. (2014) 39:1263–9. 10.1007/s11064-014-1308-0
24.
Lu CX Qiu T Tong HS Liu ZF Su L Cheng B . Peripheral T-lymphocyte and natural killer cell population imbalance is associated with septic encephalopathy in patients with severe sepsis. Exp Ther Med. (2016) 11:1077–84. 10.3892/etm.2016.3000
25.
Zhang L-N Wang X-H Wu L Huang L Zhao C-G Peng Q-Y et al . Diagnostic and predictive levels of calcium-binding protein A8 and tumor necrosis factor receptor-associated factor 6 in sepsis-associated encephalopathy: a prospective observational study. Chin Med J. (2016) 129:1674–81. 10.4103/0366-6999.185860
26.
Feng Q Wu L AI Y Deng S AI M Huang L et al . The diagnostic value of neuron-specific enolase, central nervous system specific protein and interleukin-6 in sepsis-associated encephalopathy. Chin J Int Med. (2017) 56:747–51. 10.3760/cma.j.issn.0578-1426.2017.10.008
27.
Yan S Gao M Chen H Jin X Yang M . Expression level of glial fibrillary acidic protein and its clinical significance in patients with sepsis-associated encephalopathy. Zhong Nan Da Xue Xue Bao Yi Xue Ban. (2019) 44:1137–42. 10.11817/j.issn.1672-7347.2019.190180
28.
Zhou L Liang R Yin L . Diagnostic value of CT perfusion imaging combined with markers of blood-brain barrier injury of sepsis associated encephalopathy. Int J Radiat Med Nucl Med. (2019) 43:242–9.
29.
Erikson K Ala-Kokko TI Koskenkari J Liisanantti JH Kamakura R Herzig KH et al . Elevated serum S-100β in patients with septic shock is associated with delirium. Acta Anaesthesiol Scand. (2019) 63:69–73. 10.1111/aas.13228
30.
Zhenfa M Yiping L Demin T Mianjun C Jun C . 血清 TNF-α NSE MCP-1 联合检测对脓毒症相关性脑病早期诊断价值. 河北医学. Hebei Med J. (2020) 26:1596–600. Chinese.
31.
Wang H . Observation of serum S100B, NSE and TCD in patients with sepsis-related encephalopathy. Chin Foreign Med Res. (2020) 18:61–3.
32.
Yu G-L Cui K Lou M-J Chen Z-T Chu X-Q Qi L . Serum Ghrelin level and severity of brain injury in patients with sepsis-related encephalopathy (2020) 1655–8.
33.
Hx YY Jing X . Study on serum NSE levels and electroencephalogram in evaluating the prognosis of patients with sepsis encephalopathy. J Mod Med Health. (2020) 36:3541–3.
34.
Yuan M . Study on the diagnosis ol sepsis-associated encephalopathy by neuron specltic enolase combined with interleukin-6 and administI-ation of branched chain amino acids. J Shantou Univ Med College. (2020) 33:97–100.
35.
Zhao X Li X Xiao H Zhang J Li Y Ye X et al . Correlation analysis between serum NSE, S100β, IL-6 and sepsis associated encephalopathy in burn patients. Chin J Burns Wounds Surf ulcers. (2020) 32:406–8.
36.
Guo W Li Y Li Q . Relationship between miR-29a levels in the peripheral blood and sepsis-related encephalopathy. Am J Transl Res. (2021) 13:7715.
37.
Cui J Wang J Zhao J Yao L . Clinical significance of prognostic serum marker expression in older adult patients with sepsis-associated encephalopathy. Chin J Prim Med Pharm. (2022) 340–5.
38.
Li XL Xie JF Ye XY Li Y Li YG Feng K et al . Value of cerebral hypoxic-ischemic injury markers in the early diagnosis of sepsis associated encephalopathy in burn patients with sepsis. Zhonghua Shao Shang Za Zhi. (2022) 38:21–8. 10.3760/cma.j.cn501120-20211006-00346
39.
Xiao H-T Li X-L Li Y-G Lou J-H Xia C-D Tian S-M et al . Levels and clinical value of serum IL-6, ghrelin and NSE in patients with severe burns and sepsis associated encephalopathy (2022) 1055–60.
40.
Yu D-Y Lu X Ren P-X Liu H-F Li Z-X . Study on the value of serum circulating Netrin-1 expression level in predicting the risk of brain injury in elderly patients with sepsis (2022) 76–9.
41.
Zhao C . Analysis of the risk factors of sepsis-associated encephalopathy in the patients with sepsis. J Guizhou Med Univ. (2022) 47:358–62.
42.
Zhu J Zhao J Wang S Dai X Wu X Nie J . Expression and diagnostic value of GFAP, NSE combined with S100β in patients with sepsis-related encephalopathy. Eur J Mol Clin Med. (2023) 10:3733–46.
43.
Congxin L ZHANG D Lingjie M Jilin Y Lihong D Yijie W . The Value of HCT-ALB in the Early Diagnosis of Sepsis-associated Encephalopathy. J Kunm Med Univ. (2022)43:24–8. Chinese.
44.
Brozzi F Arcuri C Giambanco I Donato R . S100B protein regulates astrocyte shape and migration via interaction with SRC kinase: implications for astrocyte development, activation, and tumor growth. J Biol Chem. (2009) 284:8797–811. 10.1074/jbc.M805897200
45.
Kanner AA Marchi N Fazio V Mayberg MR Koltz MT Siomin V et al . Serum S100beta: a noninvasive marker of blood-brain barrier function and brain lesions. Cancer. (2003) 97:2806–13. 10.1002/cncr.11409
46.
Weigand MA Volkmann M Schmidt H Martin E Böhrer H Bardenheuer HJ . Neuron-specific enolase as a marker of fatal outcome in patients with severe sepsis or septic shock. Anesthesiology. (2000) 92:905–7. 10.1097/00000542-200003000-00057
47.
Cohen S Shaw M Yang Z Tompkins S Gul S Maldonado N et al . 202 neural biomarker panel for sepsis-associated encephalopathy and sepsis outcomes. Ann Emerg Med. (2019) 74:S80. 10.1016/j.annemergmed.2019.08.370
48.
Calsavara AJ Costa PA Nobre V Teixeira AL . Prevalence and risk factors for post-traumatic stress, anxiety, and depression in sepsis survivors after ICU discharge. Braz J Psychiatry. (2020) 43:269–76. 10.1590/1516-4446-2020-0986
49.
Zhang L Jiang Y Deng S Mo Y Huang Y Li W et al . S100B/RAGE/ceramide signaling pathway is involved in sepsis-associated encephalopathy. Life Sci. (2021) 277:119490. 10.1016/j.lfs.2021.119490
50.
Taylor SL Morgan DL Denson KD Lane MM Pennington LR . A comparison of the Ranson, Glasgow, and APACHE II scoring systems to a multiple organ system score in predicting patient outcome in pancreatitis. Am J Surg. (2005) 189:219–22. 10.1016/j.amjsurg.2004.11.010
Summary
Keywords
sepsis-associated encephalopathy, NSE, biomarker, S100β, meta-analysis, systematic review
Citation
Lin X, Zhang J, Ren T, Cao H, Chang C and Wang Y (2025) Diagnostic utility of neurogenic biomarkers in differentiating sepsis with and without associated encephalopathy: a systematic review and meta-analytic approach. Front. Neurol. 16:1640618. doi: 10.3389/fneur.2025.1640618
Received
06 June 2025
Accepted
22 August 2025
Published
28 October 2025
Volume
16 - 2025
Edited by
Zilong Zhao, Tianjin Medical University General Hospital, China
Reviewed by
Stanislaw Szlufik, Medical University of Warsaw, Poland
Bin Zhang, Capital Medical University, China
Updates
Copyright
© 2025 Lin, Zhang, Ren, Cao, Chang and Wang.
This is an open-access article distributed under the terms of the Creative Commons Attribution License (CC BY). The use, distribution or reproduction in other forums is permitted, provided the original author(s) and the copyright owner(s) are credited and that the original publication in this journal is cited, in accordance with accepted academic practice. No use, distribution or reproduction is permitted which does not comply with these terms.
*Correspondence: Yumei Wang 13770357882@yzu.edu.cnCheng Chang chchl967@163.com
†These authors have contributed equally to this work
Disclaimer
All claims expressed in this article are solely those of the authors and do not necessarily represent those of their affiliated organizations, or those of the publisher, the editors and the reviewers. Any product that may be evaluated in this article or claim that may be made by its manufacturer is not guaranteed or endorsed by the publisher.