Abstract
Background:
The Voxel-based Specific Regional Analysis System for Alzheimer’s Disease (VSRAD), a voxel-based morphometry tool quantifying medial temporal lobe atrophy as region-specific Z-scores, is widely used in clinical practice for detection of Alzheimer’s disease (AD). However, it typically require high-resolution 3D T1-weighted MRI, which is often difficult to acquire in elderly or cognitively impaired patients. This study aimed to evaluate whether 3D volumes generated by SynthSR from 2D T1-weighted MRI can yield volumetric and VSRAD-derived indices that are comparable to those from standard 3D images, by assessing agreement, rank consistency, and diagnostic performance.
Methods:
In this retrospective single-center study, MRI data from 75 patients were analyzed using both standard 3D T1-weighted images and SynthSR-generated 3D volumes reconstructed from 2D T1-weighted sequences. Regional brain volumes and four key Z-score indices from VSRAD were compared using Wilcoxon signed-rank tests with Bonferroni correction, robust Bland–Altman analysis, Spearman’s rank correlation, and receiver operating characteristic (ROC) curve analysis focusing on Score 1 “Severity.”
Results:
All Z-score indices and segmented volumes showed significant absolute differences between the two methods (p < 0.0071), with SynthSR-based data generally yielding larger volume estimates. Despite these differences, Spearman’s ρ remained consistently high (ρ > 0.7) for brain volume and Score 3 “Ratio,” and other clinically relevant indices also demonstrated moderate correlations. ROC analysis demonstrated high value of the area under the curve (AUC) values for both standard 3D volumes (0.90) and SynthSR-generated 3D volumes (0.96), with no statistically significant difference between the two methods (Z = 0.009, p = 0.99, DeLong’s test).
Conclusion:
Although SynthSR-based images produced systematically different absolute values, they preserved rank-order correlations and maintained diagnostic performance comparable to that of standard 3D volumes in VSRAD analysis. Considering that conventional 3D acquisitions are often difficult to obtain in elderly patients undergoing dementia screening, SynthSR-based reconstruction may represent a practical alternative in routine clinical practice, particularly for Score 1 “Severity,” the most clinically relevant marker of hippocampal atrophy.
Introduction
According to the World Health Organization, the global population aged over 60 is projected to reach 2.1 billion by 2050, while the number of individuals over 80 is expected to triple to 426 million between 2020 and 2050 (1). Dementia is a prevalent condition, with its global incidence steadily increasing in recent years (2, 3). Timely diagnosis of conditions such as Alzheimer’s disease (AD) and mild cognitive impairment (MCI) is crucial for maintaining patients’ quality of life, as early intervention can potentially slow disease progression (4–6). Hippocampal atrophy is a characteristic feature of AD, making the recognition of this atrophy at an early stage particularly useful (7).
One commonly used image analysis tool is VSRAD (Voxel-based Specific Regional Analysis System for Alzheimer’s Disease), developed by Eisai, a computer-aided diagnostic system designed to support theclinical diagnosis of AD at an early stage (8, 9). VSRAD uses modified voxel-based morphometry (VBM) software. This software combines Statistical Parametric Mapping 8 (SPM8) and Diffeomorphic Anatomical Registration Through Exponentiated Lie Algebra (DARTEL) algorithm for the detection and quantitative assessment of AD to compare a patient’s brain MRI to a normative database of healthy individuals (10). Thus, VSRAD primarily evaluates atrophy in the medial temporal lobe (including the hippocampus and parahippocampal gyrus), visualizing results as Z-score maps and quantifying the degree of atrophy in various brain regions with high versatility (11, 12). VSRAD is used in over 3,000 facilities in Japan and has been validated across multiple centers. This corresponds to roughly 30–40% of all MRI-equipped facilities nationwide. VSRAD ordinarily requires three-dimensional T1-weighted volume images, which take about five minutes to acquire. However, acquiring such data is often challenging in patients with suspected dementia due to poor compliance and motion artifacts, which frequently degrade image quality. Consequently, routine clinical imaging still relies mainly on two-dimensional sequences. However, the relatively large slice thickness of typical 2D scans (approximately 4–5 mm) poses a particular challenge for quantitative analyses like VBM, especially when analyzing historical 2D image data.
SynthSR is an image super-resolution technique recently implemented in FreeSurfer, a comprehensive open-source software package used for processing and analyzing brain MRI images. It has been shown to be capable of generating high-quality, high-resolution images from low-resolution MRI scans, which ultimately improves the accuracy of brain structure analysis (13, 14). Compared to conventional interpolation methods, SynthSR has been reported to reproduce more detailed brain structures and can complement older, low-resolution MRI datasets (15). Furthermore, SynthSR has served as a benchmark for newer models such as LoHiResGAN, which convert low-field into high-field equivalents (16), and has been integrated into workflows for Alzheimer’s disease assessment using hippocampal and white matter hyperintensity quantification (17). Recent studies have also applied SynthSR to ensure anatomical consistency in youth cohorts (18) and to generate cerebrospinal fluid (CSF) volumetrics predictive of stroke outcomes (19). These applications highlight SynthSR’s potential in both standardizing heterogeneous datasets and expanding the utility of legacy MRI data or data from resource-limited settings.
In this study, we evaluated the agreement and comparability of VSRAD analysis results between 3D volumes generated from 2D T1-weighted images and standard 3D T1-weighted volumes, with particular focus on between-method agreement, rank-based consistency, and diagnostic performance. We assessed whether SynthSR-generated 3D images from 2D inputs could yield results comparable to standard 3D images, potentially offering a more practical approach for dementia assessment.
Materials and methods
Study design
This single-center, retrospective, observational study was conducted using data collected from November 2021 to January 2022. The study cohort consisted entirely of patients who underwent head MRI because of suspected cognitive decline in routine clinical practice. VSRAD analysis was performed on both conventional 2D T1-weighted images and standard 3D T1-weighted images. Given that the objective of this study was methodological rather than diagnostic, the analysis focused exclusively on this clinically relevant elderly cohort, without introducing a separate healthy control group or stratification by dementia subtype. This design allowed us to directly assess the comparability between standard 3D and SynthSR-generated 3D volumes under real-world clinical conditions.
Image acquisition
The head MRI was performed during a routine clinical examination. A 1.5 Tesla MRI system (SIGNA Explorer 1.5 T, GE Healthcare Japan, Tokyo, Japan) with 8-channel coil was used. 2D T1-weighted images (T1w_2D) were acquired using periodically rotated overlapping parallel lines with enhanced reconstruction (PROPELLER). The imaging parameters were as follows: the matrix size was 224 × 224, slice thickness was 6.00 mm, repetition time (TR) was 567 ms, echo time (TE) was 12 ms, flip angle was 90°, field of view (FOV) was 24.0 cm. Acquisition time was 105 s. 3D T1-weighted images (T1w_3D) were acquired using spoiled gradient recalled acquisition in steady state (SPGR) in the sagittal plane. Its parameters: the matrix size was 256 × 256, slice thickness was 1.50 mm, TR was 11.4 ms, TE was 4.48 ms, flip angle was 15°, FOV was 25.6 cm. Acquisition time was 232 s. T1w_3D was used for control data. For each patient, both 3D and 2D T1-weighted images were acquired on the same day during a single MRI session.
Generating 3D volume data
T1w_2D images were converted from DICOM to NIfTI format using MRIcroGL (20). The 3D volume data (T1w_2DSR) were generated using FreeSurfer’s SynthSR from T1w_2D modified to NIfTI file format (13–15). SynthSR was used with default settings, except that 4 CPU threads were specified. The 3D volume was output as a 1.0 mm MPRAGE-like image with standard contrast, bias magnetic field correction, and inpainting of white matter lesions. The average time for T1w_2DSR generation was 77 s. The generated T1w_2DSR was in NIfTI format. Since VSRAD required DICOM in the sagittal orientation, the image was reoriented from axial to sagittal and converted to DICOM format using 3D Slicer (Figure 1) (21). All processing was performed under Windows Subsystem for Linux 2 (WSL2) using a laptop computer ThinkPad X1 Extreme (Lenovo Japan LLC, Tokyo, Japan) with the following specifications: Intel Core i7-8750H CPU (up to 4.10 GHz), 32 GB RAM (Intel Corp., California, USA), and NVIDIA GeForce GTX 1050 Ti with Max-Q Design (Nvidia Corp., California, USA).
Figure 1

T1-weighted images used in the standard and proposed methods. The top row shows 3D T1-weighted images acquired using spoiled gradient recalled acquisition in steady state (SPGR) sequence with the standard method. The middle row shows 2D T1-weighted images acquired using periodically rotated overlapping parallel lines (PROPELLER), which are commonly used in clinical settings. The bottom row shows 3D volume data generated from 2D T1-weighted images using FreeSurfer’s SynthSR tool. The red rectangles in the middle and bottom rows indicate that the parietal region was not included in the original scan and therefore could not be generated.
VSRAD advance analysis
Several versions of VSRAD have been developed. In this study, we used “VSRAD advance,” which was based on SPM 8 and incorporated DARTEL (11, 22, 23). VBM was performed on both T1w_2DSR and T1w_3D, yielding data on segmented white matter (WM), gray matter (GM), CSF (Figure 2). Four Z-scores reflecting the degree of atrophy in the specific volume of interest (VOI) were automatically calculated and provided by VSRAD advance, based on comparing each patient’s data with an internal database of 80 healthy volunteers. The Z-score was defined as [(control mean) – (individual value)]/(control standard deviation) (11). The Z-scores generated by VSRAD advance visualize and quantitatively evaluate the degree of gray matter atrophy in the regions of interest, primarily the parahippocampal gyrus including the medial temporal lobe, which is closely associated with Alzheimer’s disease, by measuring the degree of deviation from the normative brain database. The four scores were as follows: Score 1 “Severity”: Z-score reflecting the severity of GM atrophy in the VOI. Score 2 “Extent”: the extent of GM atrophy in the VOI. Score 3 “Ratio”: the ratio of the extent of GM atrophy in the VOI to the whole brain. Score 4 “Maximum”: the maximum z-score of the severity of GM atrophy in the VOI of AD (24–28). To mitigate volumetric inaccuracies introduced by non-linear spatial normalization and Gaussian smoothing in the DARTEL pipeline, intermediate WM and GM segmentation files were used for estimating native-space volumes. Total brain volume was calculated as the sum of the WM and GM volumes (WM + GM). Measurements were performed using the Segment Statistics module of 3D Slicer (13).
Figure 2
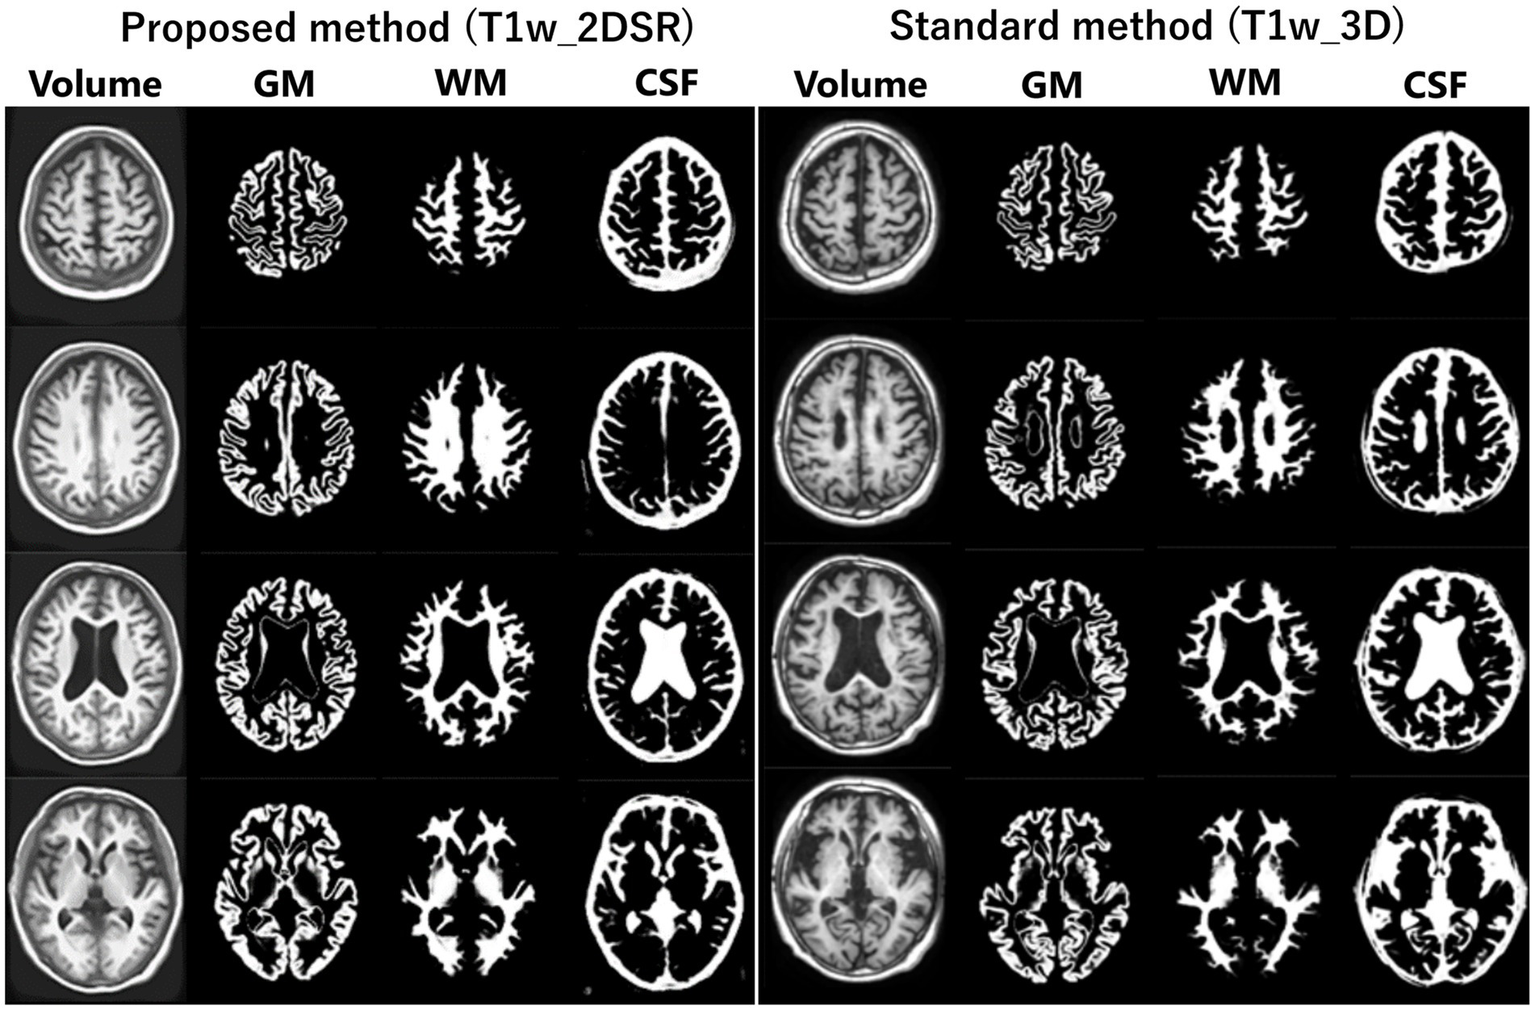
Segmented images obtained by VSRAD. The left panel shows the VSRAD analysis results using the SynthSR-based method (T1w_2DSR). Segmented gray matter (GM), white matter (WM), cerebrospinal fluid (CSF) images were successfully generated. The right panel shows the comparison of segmented GM, WM and CSF images using the standard method (T1w_3D). These results indicate that the volume data generated by SynthSR demonstrated comparable segmentation performance to 3D data from standard methods.
Statistical analysis
In this study, to compare the standard method and the proposed method, statistical analyses were performed using R (version 4.3.3; R Foundation for Statistical Computing, Vienna, Austria) and RStudio (2023.06.1; Posit, Boston, USA) (29, 30). The normality of the data distribution for each variable was assessed using the Shapiro–Wilk test. Variables that did not follow a normal distribution (p < 0.05) were analyzed using non-parametric methods (31). We conducted a Wilcoxon signed-rank test (paired, two-sided) to determine if there were statistically significant differences between the T1w_3D and T1w_2DSR groups (32). Bonferroni correction (significance threshold at α = 0.05/7 ≈ 0.0071) was performed to compare several indices simultaneously (33). Given the non-normal distribution of differences and the presence of outliers, we next implemented a robust Bland–Altman plot using the median bias and interquartile range (IQR), which provides a more reliable interpretation of agreement by reducing the influence of skewness and extreme values on the summary estimates (34–36). We plotted the differences and means of the two methods and calculated the 95% confidence interval of the differences. Spearman’s rank correlation analysis was employed to evaluate monotonic relationships between the volume estimates derived from the standard method and the proposed method. This non-parametric approach was appropriate given the lack of normality and the interest in rank-based consistency. The correlation strength was interpreted as follows: ρ < 0.3 = weak, 0.3–0.7 = moderate, and > 0.7 = strong correlation (37). Receiver operating characteristic (ROC) curve analyses were conducted to assess the diagnostic performance between patients diagnosed AD and cognitively normal controls. The final diagnoses were determined by dementia specialists based on clinical, neuroimaging, and neuropsychological information. The area under the curve (AUC) was calculated for both methods (38, 39), and optimal cutoff points were identified via the Youden Index (40). ROC curves were compared using DeLong’s test implemented in the pROC package in R (41).
Ethical considerations
The study was reviewed by the ethics committee of our institution (FY2023-02). An opt-out notice was published on the institution’s website.
Results
Seventy-five patients underwent MRI during the study period. Of these, 21 (28.0%) were male. The mean age was 83.5 years (range, 61–107 years). This cohort reflects the typical population undergoing dementia screening in Japan. For all cases, 3D volume data (T1w_2DSR) were successfully generated from T1w_2D using SynthSR. The generated T1w_2DSR did not reconstruct the parietal CSF region because it was not imaged in the original T1w_2D. Each output image was independently reviewed by two neurosurgeons. Cases with obvious motion artifacts and disrupted WM and GM segmentation in the control T1w_3D images were excluded from the analysis. Among the excluded cases, four (Cases 22, 26, 43 and 63) had showed segmentation errors involving the ventricles and GM due to brain atrophy (Figure 3), five (Cases 7, 11, 12, 69 and 72) showed segmentation failure caused by motion artifacts; and two (Cases 15 and 39) had structural brain lesions due to stroke (Figure 4). A total of 64 cases were analyzed after excluding 11 cases. After VSRAD analysis, four scores and three volumes were calculated. For these evaluated indices, normality was not met in most cases (Shapiro–Wilk test, p < 0.05), and thus non-parametric comparisons were adopted.
Figure 3

Representative excluded cases of atrophy. In Case no. 43, severe brain atrophy led to segmentation failure in both the standard and proposed methods, with portions of the ventricles erroneously classified as white matter (red arrowheads).
Figure 4
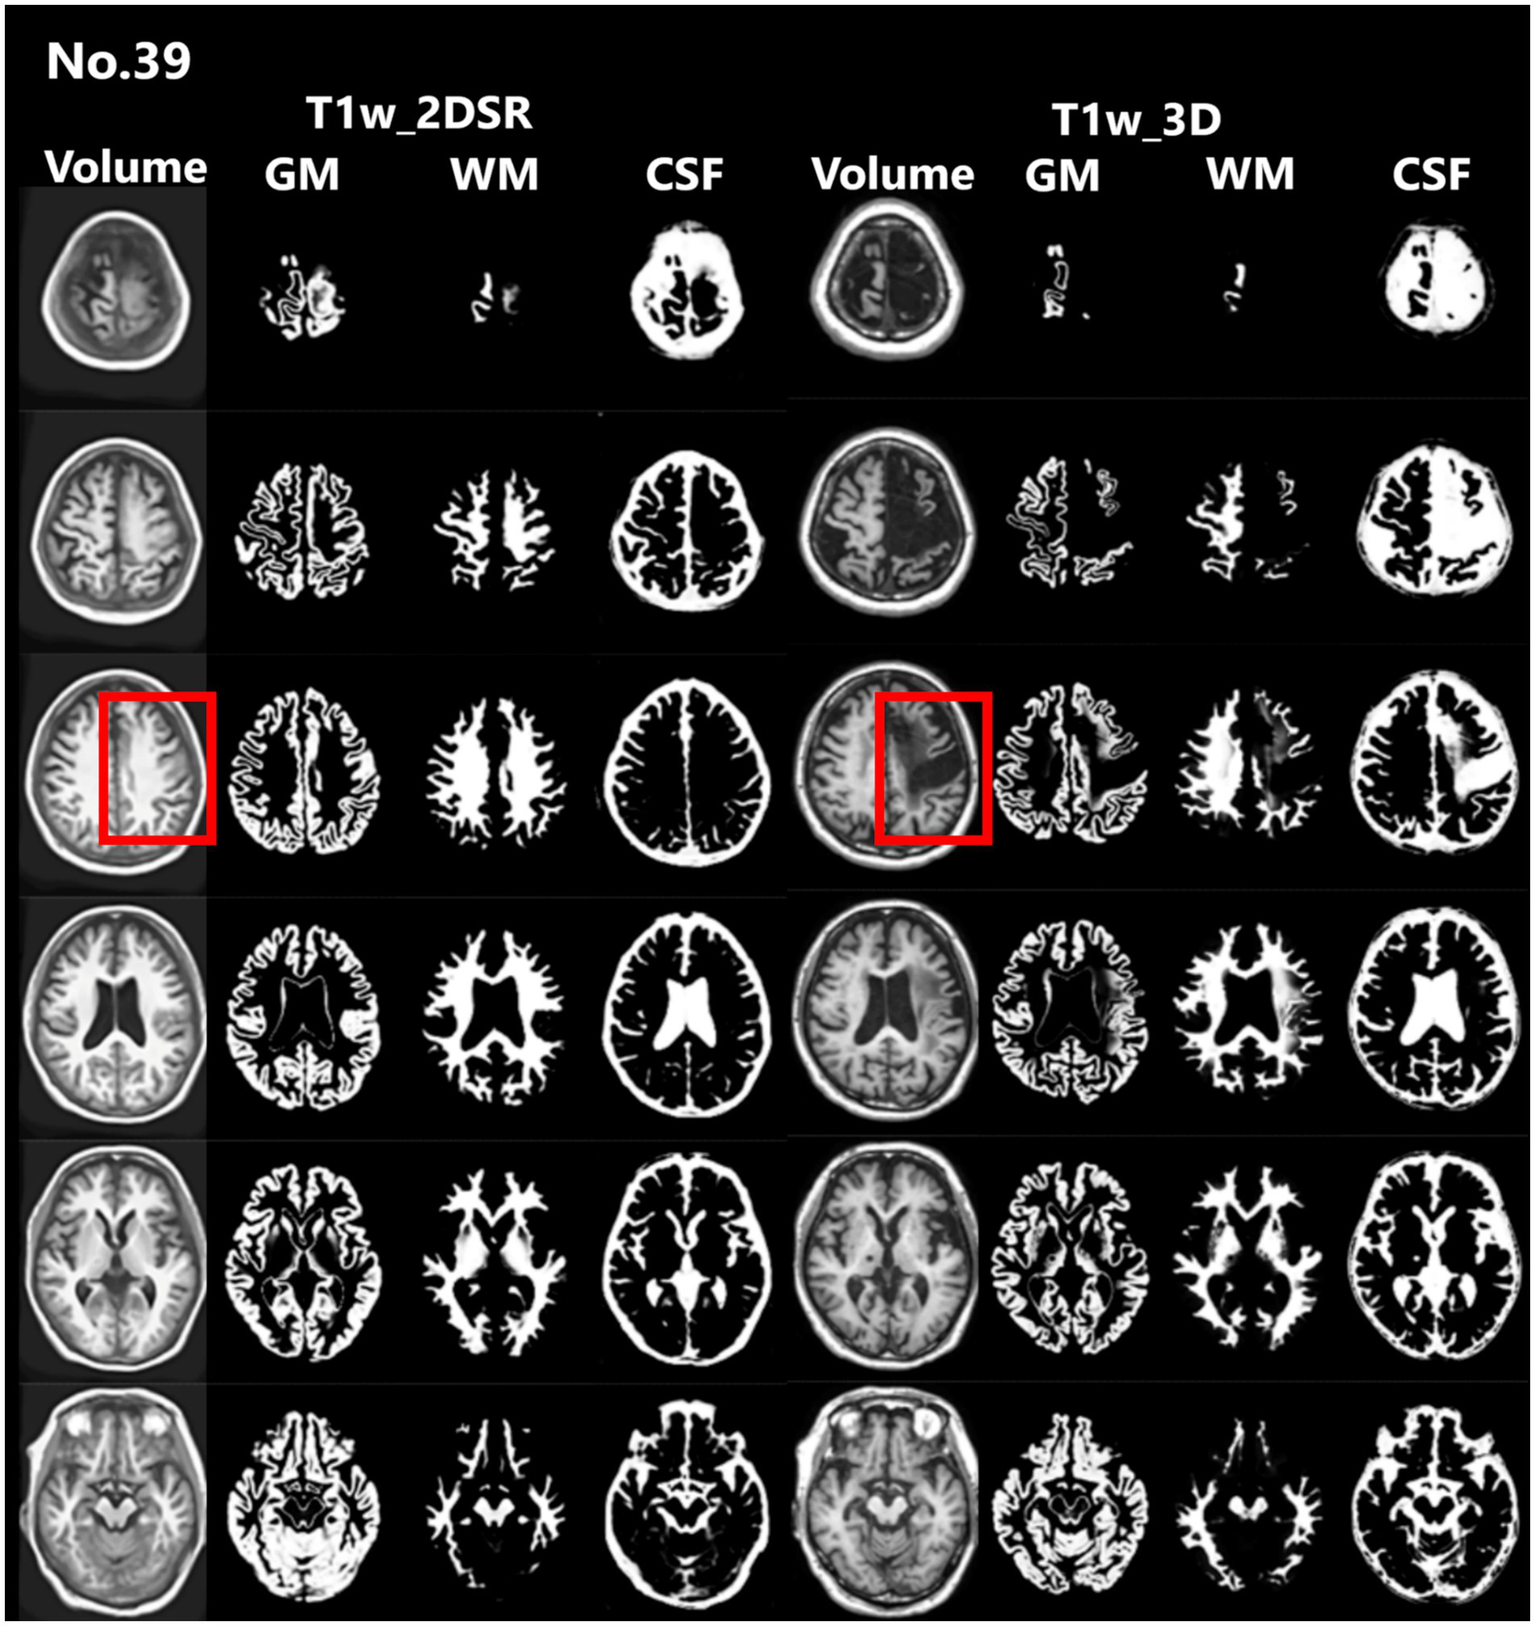
Representative excluded cases of stroke. Case no. 39 shows a patient with structural brain lesions due to stroke. In the 3D volume data acquired using the standard method, a low-signal area was observed in the left frontal lobe, consistent with cerebral infarction. In contrast, in the 3D volume generated by SynthSR, the lesion area appeared artificially filled in (red rectangles).
Wilcoxon signed-rank tests were conducted across seven indices. As shown in Table 1, all comparisons showed statistically significant differences between the two methods. The proposed method tended to yield larger volume measurements in most VSRAD scores and segmented volumes. After applying Bonferroni correction for multiple comparisons (n = 7), all p-values remained below the significance threshold of 0.05, confirming the robustness of the findings.
Table 1
| Variable | Standard median (Q1–Q3) | Proposed median (Q1–Q3) | Raw p value | Bonferroni-adjusted p value |
|---|---|---|---|---|
| Score 1 “Severity” | 1.23 (0.80–1.75) | 2.06 (1.22–3.03) | 1.59 × 10⁻⁸ | 1.43 × 10⁻⁷ |
| Score 2 “Extent” | 5.44 (4.74–6.31) | 6.91 (4.62–9.64) | 7.27 × 10⁻⁵ | 6.54 × 10⁻⁴ |
| Score 3 “Ratio” | 11.72 (1.81–35.67) | 38.87 (9.65–75.85) | 2.77 × 10⁻⁹ | 2.49 × 10⁻⁸ |
| Score 4 “Maximum” | 2.11 (0.37–5.55) | 5.18 (1.71–7.82) | 4.76 × 10⁻⁶ | 4.28 × 10⁻⁵ |
| Volume of GM | 482.24 (435.84–537.23) | 516.33 (449.53–566.62) | 2.08 × 10⁻⁶ | 1.87 × 10⁻⁵ |
| Volume of WM | 555.18 (518.74–582.94) | 578.31 (540.41–602.12) | 1.49 × 10⁻⁵ | 1.34 × 10⁻⁴ |
| Volume of Brain | 1061.69 (973.23–1112.59) | 1111.66 (1026.41–1173.98) | 5.09 × 10⁻⁷ | 4.58 × 10⁻⁶ |
Comparison of seven indices between the standard and proposed methods using the Wilcoxon signed-rank test.
*All p-values are obtained using the Wilcoxon signed-rank tests.
Bonferroni correction was applied to control for family-wise error rate (α = 0.05, n = 7).
GM, gray matter; WM, white matter.
Robust Bland–Altman analysis was conducted across seven indices. For each measurement pair, the median of the difference (Proposed method – Standard method) and the IQR were used to estimate robust limits of agreement defined as median ± 1.5 × IQR (Table 2). Among all indices, IQRs and derived limits of agreement varied across metrics, reflecting higher variability in volume-based measures than in Z-scores. Outlier analysis revealed that fewer than 10% of cases fell outside the robust limits of agreement for all variables, with the highest outlier proportions observed in gray matter volume and Score 1, both at 9.4%. Notably, score 3 “Ratio” and WM showed the largest absolute median differences, suggesting consistent deviations between the two methods (Figure 5).
Table 2
| Variable | Median difference | IQR | Lower limit | Upper limit | Outlier count | Outlier percent |
|---|---|---|---|---|---|---|
| Score 1 “Severity” | 0.62 | 1.14 | −1.09 | 2.32 | 6 | 9.4 |
| Score 2 “Extent” | 1.50 | 4.86 | −5.79 | 8.78 | 5 | 7.8 |
| Score 3 “Ratio” | 19.07 | 32.84 | −30.20 | 68.33 | 3 | 4.7 |
| Score 4 “Maximum” | 1.43 | 4.27 | −4.97 | 7.83 | 5 | 7.8 |
| Volume of GM | −28.27 | 72.27 | −136.68 | 80.14 | 6 | 9.4 |
| Volume of WM | 128.26 | 129.53 | −66.03 | 322.54 | 4 | 6.2 |
| Volume of Brain | −184.60 | 96.62 | −329.53 | −39.67 | 5 | 7.8 |
Results of Robust Bland–Altman analysis comparing VSRAD scores and volumetric measurements between the standard and proposed methods.
Each row presents the median difference (Pro − Std), the interquartile range (IQR), and the corresponding robust limits of agreement (LoA), calculated as median ± 1.5 × IQR. The number and percentage of outliers beyond the robust LoA are also reported.
GM, gray matter; WM, white matter.
Figure 5
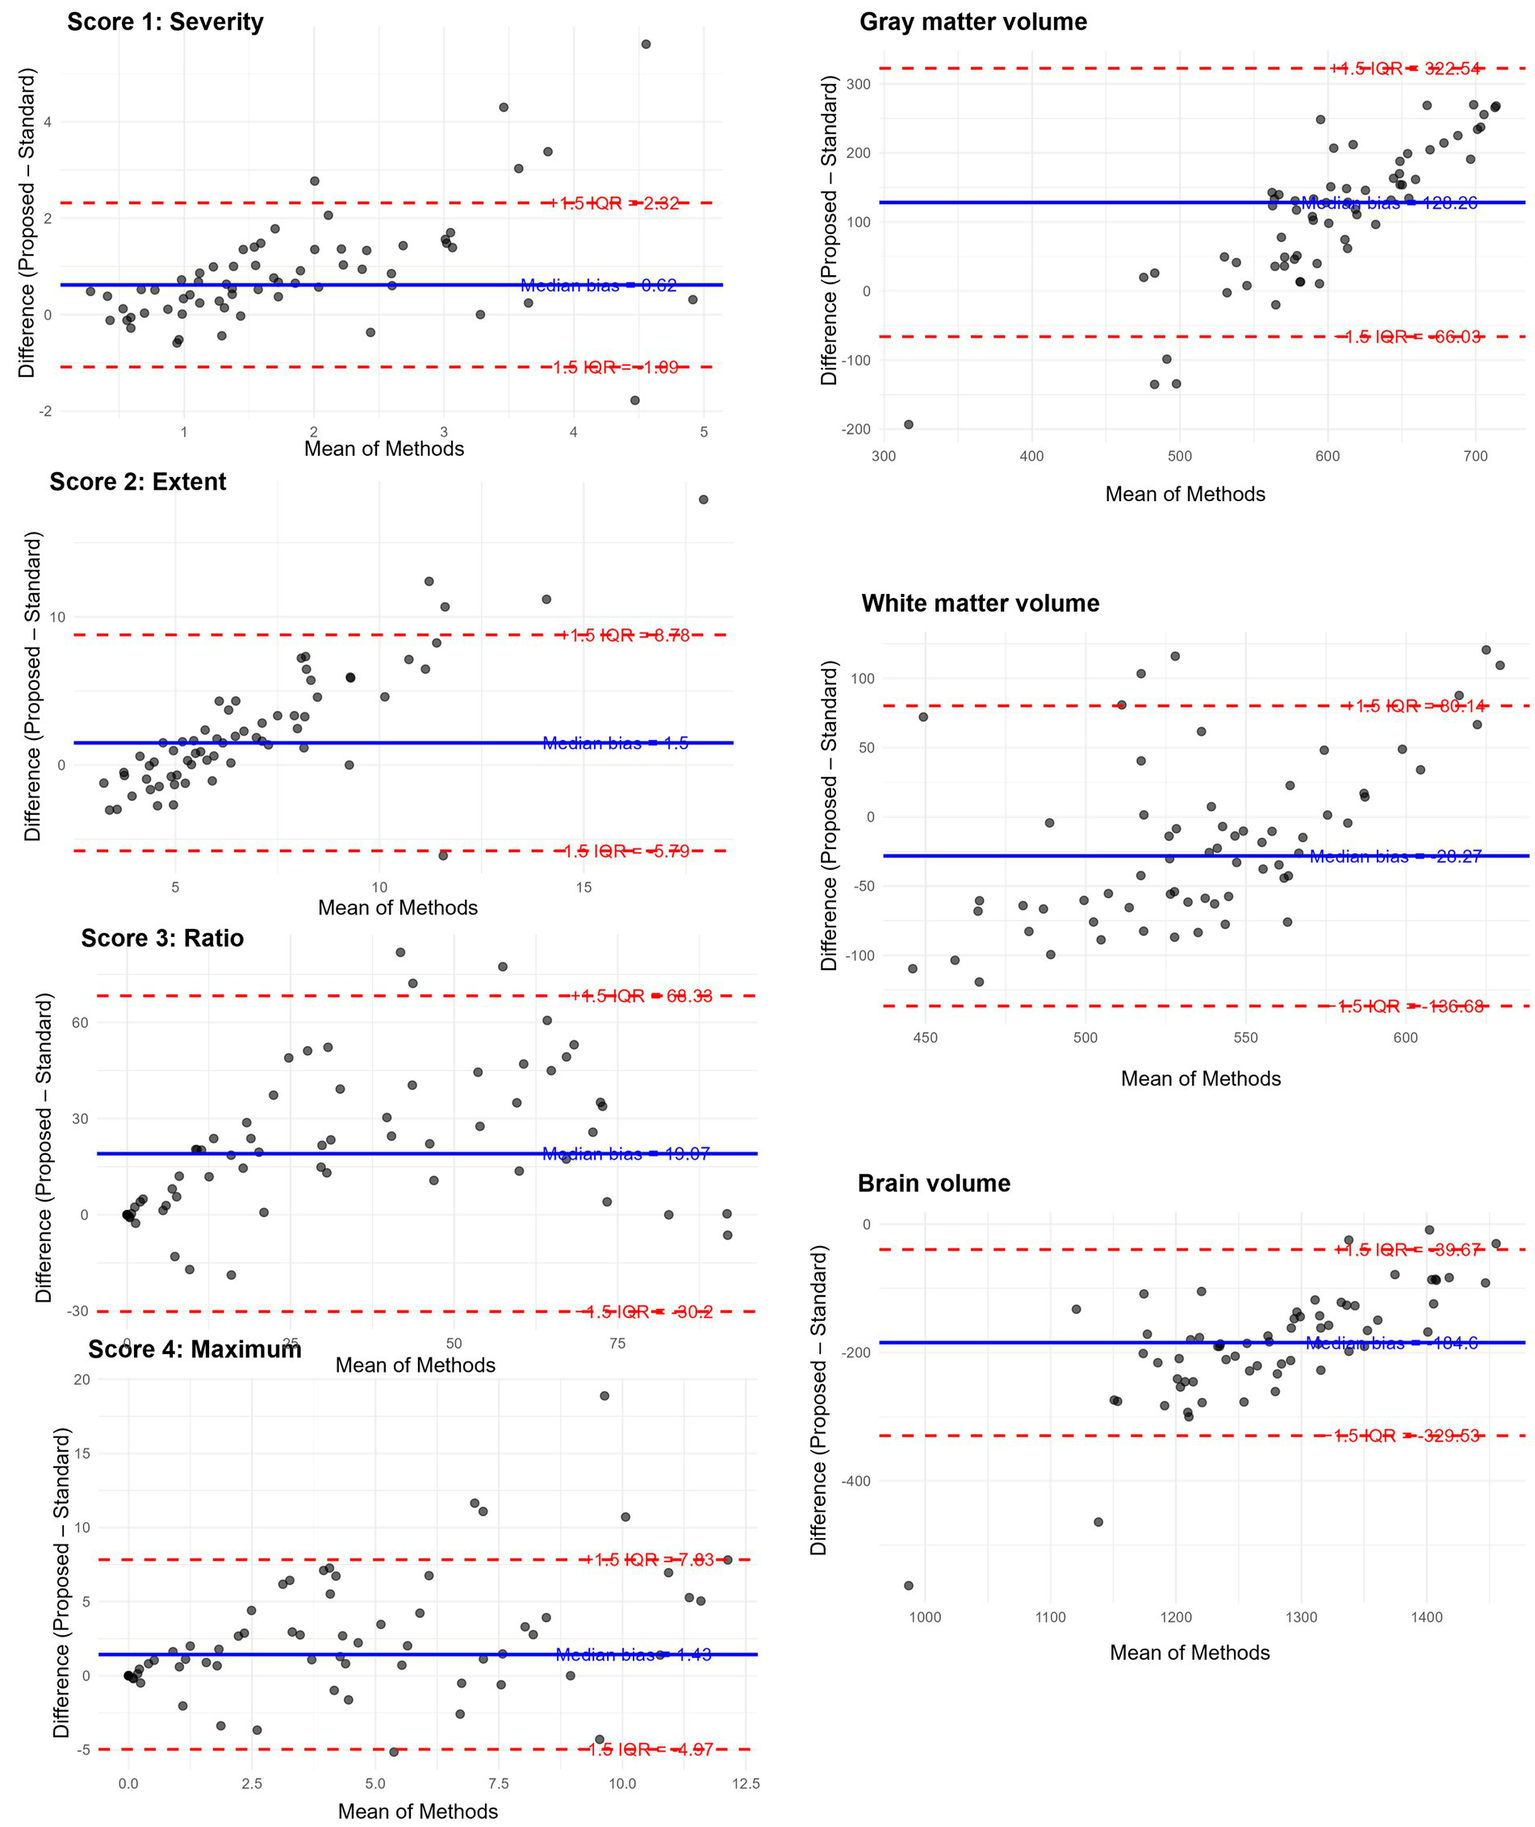
Robust Bland–Altman plots for the results of VSRAD analysis. Each plot illustrates the difference between the proposed method (T1w_2DSR) and the standard method (T1w_3D), based on VSRAD-derived volume measurements. The differences are plotted against the median of the two methods. The solid blue line indicates the median difference (bias), and dashed red lines represent the robust 95% limits of agreement, defined as the median ± 1.5 × IQR. Outliers beyond the boundaries are marked and quantified. IQR: interquartile range.
Spearman’s correlation coefficients between the standard and proposed methods across all seven indices ranged from 0.40 to 0.74, with all values indicating statistically significant positive correlations (p < 0.001). Strong correlations (ρ > 0.7) were observed in score 3 “Ratio” and brain volume, while the remaining indices showed moderate correlation (0.3 < ρ < 0.7), indicating consistent ranking between the two methods (Figure 6).
Figure 6
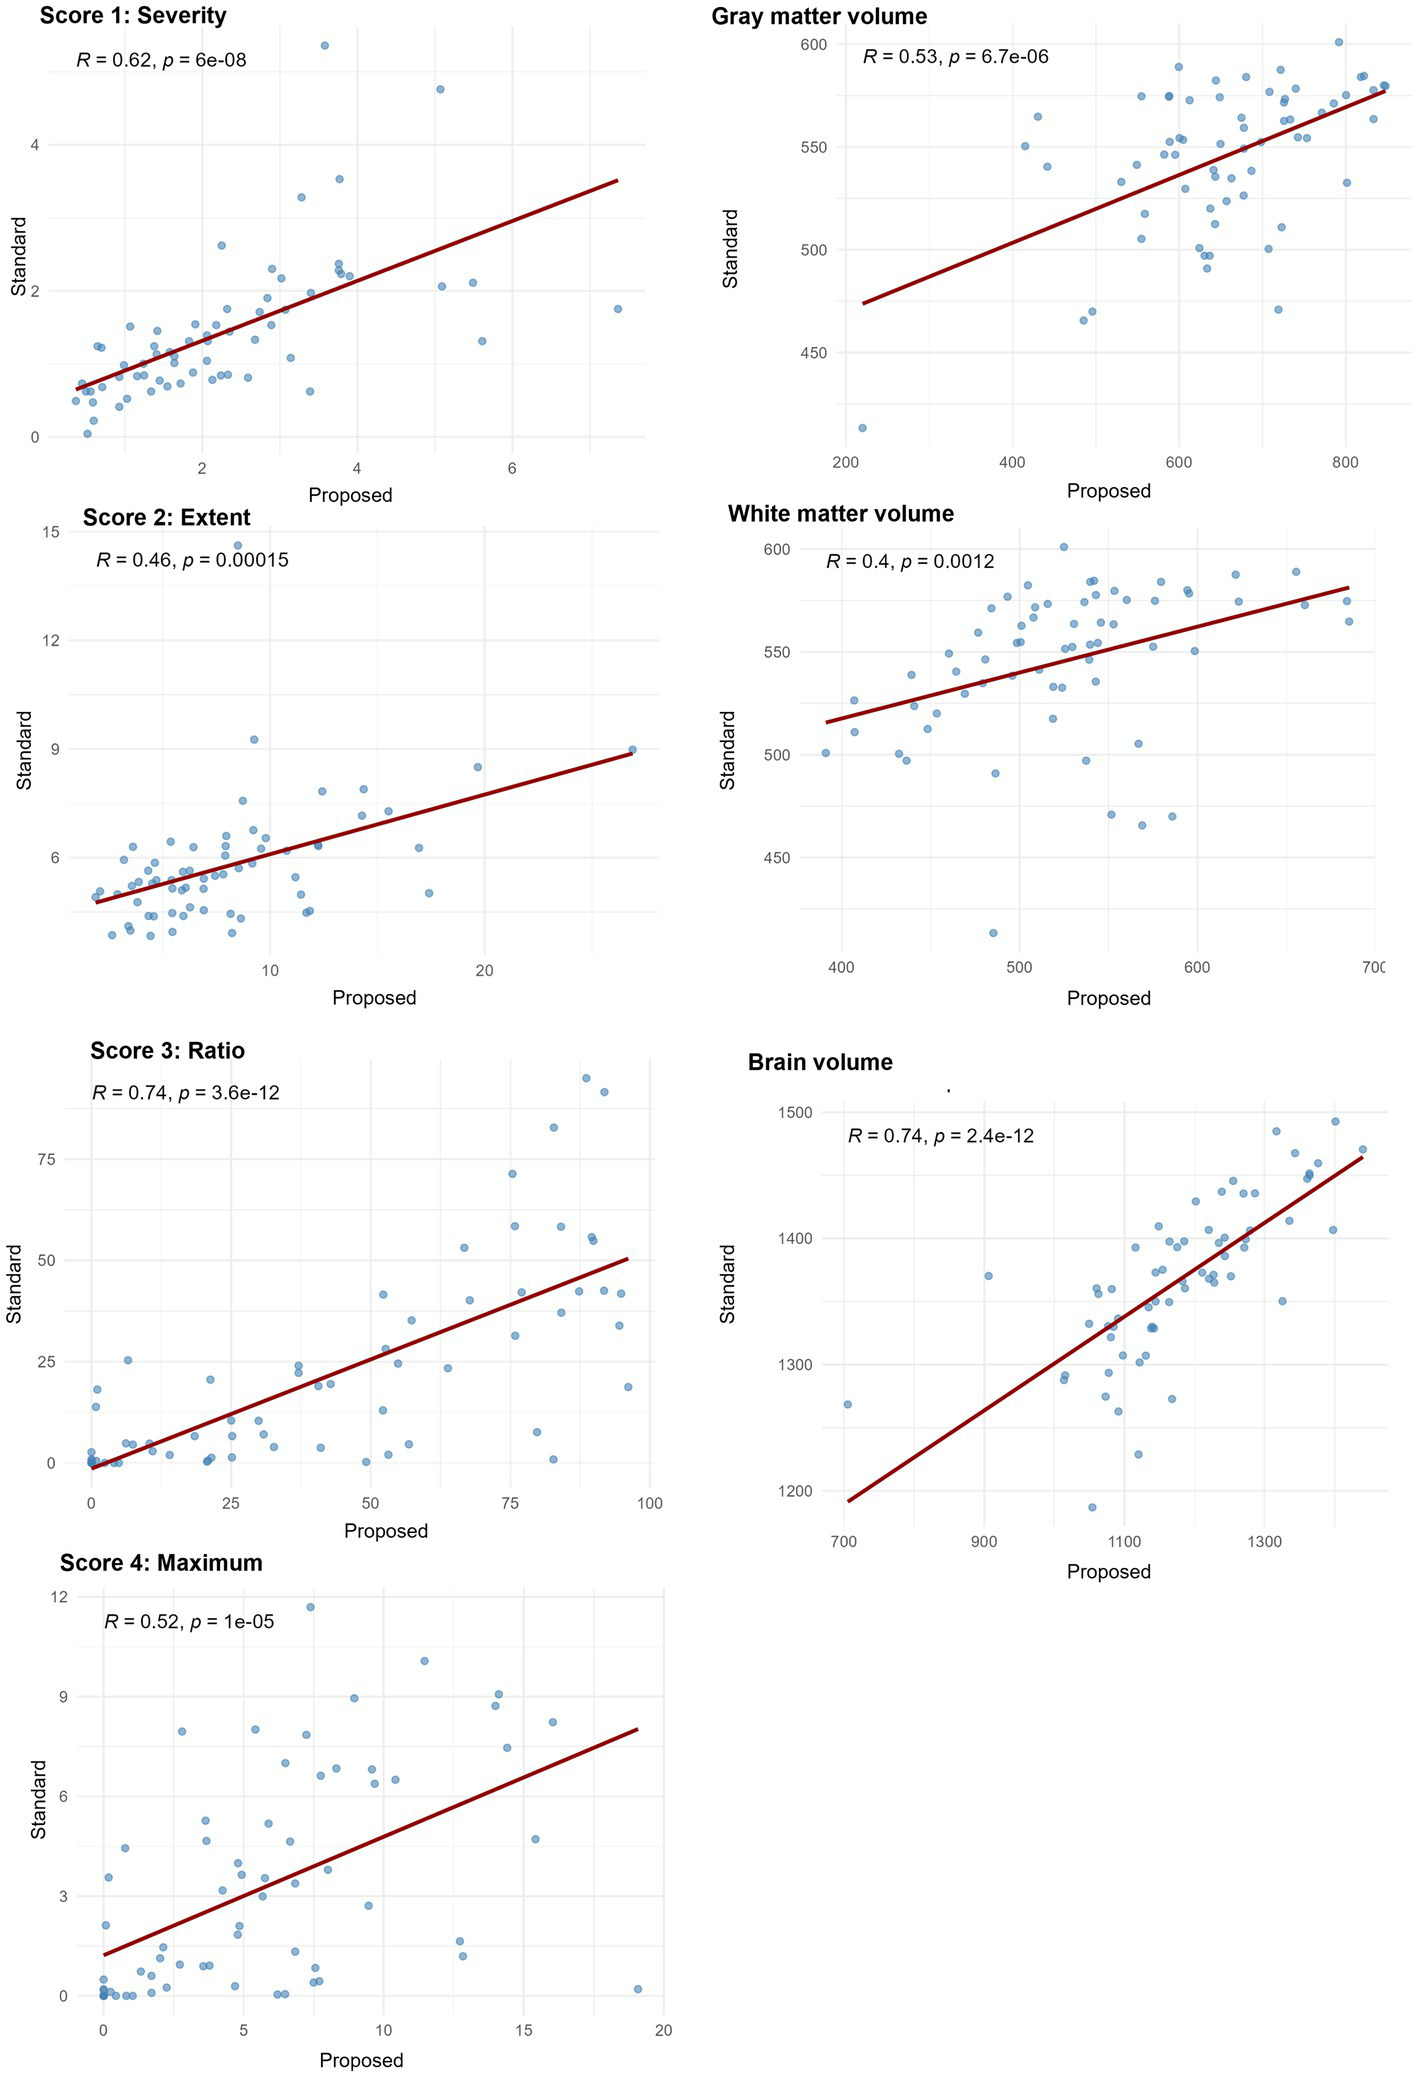
Spearman’s correlation coefficients between VSRAD analysis and volumetric measurements from the standard method and the proposed method. Scatter plots illustrate the rank-order association between measurements obtained from the standard method with 3D T1-weighted images (T1w_3D) and SynthSR-generated 3D volumes from 2D T1-weighted images (T1w_2DSR). Spearman’s correlation coefficients (ρ) and corresponding p-values are displayed in each plot. Correlation strength was interpreted as follows: ρ < 0.3 = weak, 0.3–0.7 = moderate, and > 0.7 = strong correlation. Score 3 “Ratio” and brain volume showed strong correlations and the other indices showed moderate correlations.
Twenty-nine patients were diagnosed with AD, 8 were considered cognitively normal, and the rest were diagnosed with other dementias. ROC curves were drawn for AD and cognitively normal controls based on Score 1 “Severity” in VSRAD analysis. For the standard method (T1w_3D), AUC = 0.90, Youden Index = 0.72, and for the proposed method (T1w_2DSR), AUC = 0.96, Youden Index = 0.84 (Figure 7). DeLong’s test revealed no statistically significant difference between the AUCs of the standard and proposed methods (Z = 0.009, p = 0.993), with a 95% confidence interval of −13.85 to 13.97. These results indicate that the diagnostic performance was comparable between the two methods.
Figure 7
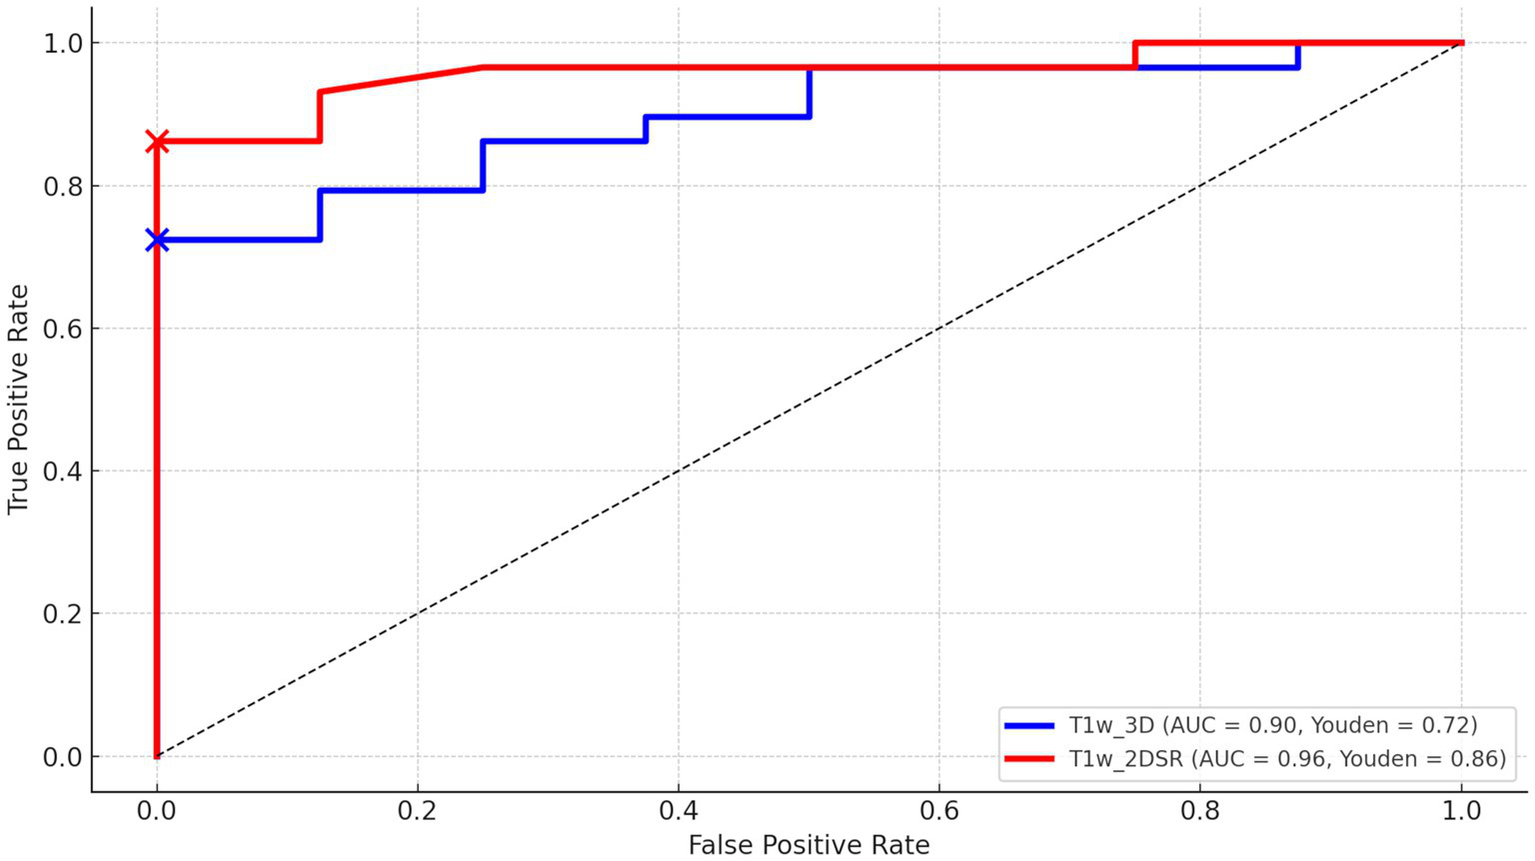
The receiver operating characteristic (ROC) curves of VSRAD Score 1 “Severity.” The ROC curve, area under the curve (AUC), and Youden index were compared between the standard method (T1w_3D) and the proposed method (T1w_2DSR). The standard method showed an AUC of 0.90 and a Youden index of 0.72, while the proposed method showed an AUC of 0.96 and a Youden index of 0.86.
Discussion
This study compared four VSRAD scores and three volumetric measurements derived from the standard 3D T1-weighted MRI (T1w_3D) and the proposed SynthSR-based method (T1w_2DSR) using a multipronged statistical approach. The Wilcoxon signed-rank test revealed statistically significant differences across all four VSRAD scores and the three segmented brain volumes. The proposed method generally yielded larger volumetric estimates, even after Bonferroni correction. These differences indicate systematic biases, likely attributable to the SynthSR algorithm. Robust Bland–Altman analysis provided further insight by showing small median differences in most scores and volumes (30–32). These discrepancies may reflect the generative behavior of SynthSR. SynthSR likely compensated for thinned gray matter in cases of severe parenchymal atrophy, thereby increasing the apparent volume in the T1w_2DSR images. This effect was particularly evident in cases with ischemic lesions or cortical atrophy, where segmentation of GM, WM, and CSF failed. These cases were characterized by severe brain atrophy due to aging and enlarged ventricles (Figure 3) (42, 43). Furthermore, GM and WM volumes were larger in T1w_2DSR than in T1w_3D. The overall stronger degree of atrophy may be attributed to the advanced age of our cohort (mean age 83.5 years), compared to the VSRAD reference data cohort, which consisted of healthy subjects aged 54–86 years (44, 45).
Because Spearman’s ρ captures monotonic associations, several metrics such as Score 3 “Ratio” and the total brain volume demonstrated strong correlations, underscoring the reliability of SynthSR. Other indices showed moderate correlations. Our findings are generally consistent with the previous validation studies of SynthSR, particularly regarding correlation strength (46–48). Iglesias et al. demonstrated compatibility with morphometric properties derived from FreeSurfer and reported minimal bias across various brain structures (14). From a technical perspective, the use of Spearman’s rank correlation and robust agreement analysis follows recent recommendations for comprehensive evaluation of segmentation pipelines (49, 50).
The ROC curve analysis demonstrated high diagnostic accuracy for both T1w_3D (AUC = 0.90, Youden Index = 0.72) and T1w_2DSR (AUC = 0.96, Youden Index = 0.86). These findings suggest that both methods effectively differentiate between AD and normal cases. Although the proposed method (T1w_2DSR) showed numerically higher diagnostic metrics, this difference was not statistically significant (DeLong test: Z = 0.009, p = 0.99). Importantly, in clinical practice, Score 1 “Severity”—which reflects the degree of gray matter atrophy in the medial temporal lobe—is a critical index for early AD detection and monitoring. The consistently high AUC and favorable diagnostic characteristics of the proposed method support its use as a reliable alternative when standard 3D imaging is not feasible. Notably, SynthSR has been employed in low-field MRI settings (15, 17) and has also been used for segmentation correction in lesioned or incomplete scans (50, 51). These prior studies, along with applications in predicting thrombectomy outcomes (19) and tracking cortical lesions in traumatic brain injury (52), support the utility of SynthSR-enhanced reconstructions not only for advanced neuroimaging workflows but also for routine clinical scenarios, especially when standard 3D acquisitions are unavailable or degraded.
In DARTEL-based analyses such as VSRAD, the MRI data quality is critical, as factors such as head motion can significantly influence the results (53–56). In the present study, the quality of image data acquisition likely affected the results. Various strategies have been proposed to overcome challenges in acquiring 3D T1-weighted images. For example, Katayama et al. suggested using scout images for positioning to shorten scan time, although they reported significant differences in gray matter volume (55, 57, 58).
We suggest that SynthSR-enhanced volumetry is a viable alternative to standard 3D acquisitions in both clinical and research settings, particularly when scan time constraints or motion artifacts are of concern. In our cohort, T1w_2DSR reduced scan time to less than half (105 vs. 232 s). This reduction likely helped mitigate motion artifacts. Nevertheless, five T1w_3D cases had to be excluded due to motion artifacts. It is worth noting that our cohort was older than the typical target population for VSRAD, and the absence of parietal regions in the 2D images precluded intracranial volume comparisons. While this limitation restricts direct volume ratio analyses, Z-score-based assessments, such as those used in VSRAD, may still benefit from SynthSR-derived inputs. Moreover, this approach may also be applicable for longitudinal monitoring of individual patients. Previous studies have reported that SynthSR can improve the quality of low-field or heterogeneous MRI datasets, and it has been applied for segmentation correction in lesioned brains, harmonization across scanner types, and enhancement of legacy datasets (15, 17, 19). However, to our knowledge, its direct application to generate 3D-equivalent volumes from 2D T1-weighted inputs for VSRAD analysis in Alzheimer’s disease has not been systematically evaluated. The innovative aspect of this study lies in leveraging paired 2D and 3D acquisitions obtained on the same day to validate the feasibility of SynthSR-based reconstructions specifically for VSRAD indices, which are widely used in clinical practice in Japan. This approach demonstrates that retrospective 2D scans can be repurposed for quantitative dementia assessment, potentially expanding access to VSRAD analysis in settings where 3D scans are unavailable or degraded.
The greatest strength of this study lies in its comprehensive and robust statistical evaluation framework. However, several limitations must also be acknowledged. These include the lack of manual segmentation as ground truth, the generally older age of subjects, and the use of single-center data. Another important limitation of this study is that our cohort consisted predominantly of elderly individuals. This reflects the real-world demographics of patients undergoing dementia screening in Japan, where most individuals referred for MRI are already in advanced age. While this population is clinically relevant, the advanced age makes it challenging to fully disentangle age-related brain atrophy from Alzheimer’s disease–related neurodegeneration. Validation in younger subjects within the typical age range of AD onset would therefore be desirable. However, such a dataset was not available for the present retrospective single-center study. Future multicenter investigations that include younger cohorts and a broader age distribution will be essential to confirm the generalizability of our findings. Detailed clinical or biomarker characterization was not systematically available and was not the primary aim of this methodological validation study. Our primary aim was to assess comparability between standard and SynthSR-derived 3D volumes, independent of clinical diagnosis. Future studies should include multicenter validation across diverse populations, along with manual labeling to establish a reliable reference standard. Furthermore, although SynthSR revealed significant differences in many indices, the correlation coefficients remained relatively strong. This suggests that further optimization is warranted for specific brain structures and pathological conditions. Notably, the retrospective use of archival 2D images enabled by SynthSR may facilitate large-scale longitudinal studies. This approach holds promise for uncovering novel insights into neurodegeneration and its potentially modifiable risk factors.
Conclusion
This study focused on methodological validation rather than on diagnostic accuracy. Specifically, we evaluated whether 3D volumes generated using SynthSR from conventional 2D inputs yielded results comparable to standard 3D acquisition in a clinically relevant cohort of elderly individuals undergoing MRI for suspected cognitive decline. Considering that conventional 3D images are often difficult to obtain in this population, our findings suggest that SynthSR-based reconstruction may represent a practical alternative for VSRAD analysis in daily clinical practice.
Statements
Data availability statement
The MRI data have been fully anonymized to protect patient confidentiality, and data will be shared upon reasonable request for research purposes.
Ethics statement
The studies involving humans were approved by the Ethics Committee of Teraoka Memorial Hospital. The studies were conducted in accordance with the local legislation and institutional requirements. The participants provided their written informed consent to participate in this study.
Author contributions
TK: Conceptualization, Data curation, Formal analysis, Investigation, Methodology, Project administration, Resources, Software, Validation, Visualization, Writing – original draft, Writing – review & editing. AM: Conceptualization, Project administration, Resources, Supervision, Writing – review & editing, Methodology, Validation. TSe: Conceptualization, Data curation, Formal analysis, Methodology, Project administration, Supervision, Writing – review & editing, Funding acquisition, Validation. TSa: Conceptualization, Data curation, Formal analysis, Investigation, Methodology, Project administration, Supervision, Writing – review & editing. TT: Data curation, Formal analysis, Investigation, Resources, Writing – review & editing. ATa: Data curation, Formal analysis, Investigation, Resources, Writing – review & editing. ATe: Conceptualization, Methodology, Supervision, Validation, Writing – review & editing.
Funding
The author(s) declare that financial support was received for the research and/or publication of this article. This work was supported by the Japan Society for the Promotion of Science (JSPS) KAKENHI Grant Number JP24K02408 [Grant-in-Aid for Scientific Research (B)].
Conflict of interest
The authors declare that the research was conducted in the absence of any commercial or financial relationships that could be construed as a potential conflict of interest.
Generative AI statement
The authors declare that no Gen AI was used in the creation of this manuscript.
Any alternative text (alt text) provided alongside figures in this article has been generated by Frontiers with the support of artificial intelligence and reasonable efforts have been made to ensure accuracy, including review by the authors wherever possible. If you identify any issues, please contact us.
Publisher’s note
All claims expressed in this article are solely those of the authors and do not necessarily represent those of their affiliated organizations, or those of the publisher, the editors and the reviewers. Any product that may be evaluated in this article, or claim that may be made by its manufacturer, is not guaranteed or endorsed by the publisher.
References
1.
Alzheimer's Disease International . World Alzheimer report 2023: The global impact of dementia. (2023). Available online at: https://www.alzint.org/u/World-Alzheimer-Report-2023.pdf (Accessed May 12, 2025).
2.
Mayeux R Stern Y . Epidemiology of Alzheimer disease. Cold Spring Harb Perspect Med. (2012) 2:a006239. doi: 10.1101/cshperspect.a006239
3.
World Health Organization . Ageing and health. (2024). Available online at: https://www.who.int/news-room/fact-sheets/detail/ageing-and-health (Accessed May 12, 2025).
4.
Valcour VG Masaki KH Curb JD Blanchette PL . The detection of dementia in the primary care setting. Arch Intern Med. (2000) 160:2964–8. doi: 10.1001/archinte.160.19.2964
5.
Gauthier S Reisberg B Zaudig M Petersen RC Ritchie K Broich K et al . Mild cognitive impairment. Lancet. (2006) 367:1262–70. doi: 10.1016/S0140-6736(06)68542-5
6.
Reitz C Brayne C Mayeux R . Epidemiology of Alzheimer disease. Nat Rev Neurol. (2011) 7:137–52. doi: 10.1038/nrneurol.2011.2
7.
Petersen RC Doody R Kurz A Mohs RC Morris JC Rabins PV et al . Current concepts in mild cognitive impairment. Arch Neurol. (2001) 58:1985–92. doi: 10.1001/archneur.58.12.1985
8.
Petersen RC Roberts RO Knopman DS Boeve BF Geda YE Ivnik RJ et al . Mild cognitive impairment: ten years later. Arch Neurol. (2009) 66:1447–55. doi: 10.1001/archneurol.2009.266
9.
Matsuda H . MRI morphometry in Alzheimer's disease. Ageing Res Rev. (2016) 30:17–24. doi: 10.1016/j.arr.2016.01.003
10.
Matsuda H Mizumura S Nemoto K Yamashita F Imabayashi E Sato N et al . Automatic voxel-based morphometry of structural MRI by SPM8 plus diffeomorphic anatomic registration through exponentiated lie algebra improves the diagnosis of probable Alzheimer disease. AJNR Am J Neuroradiol. (2012) 33:1109–14. doi: 10.3174/ajnr.A2935
11.
Matsuda H Mizumura S Nagao T Ota T Iizuka T Nemoto K et al . Automated discrimination between very early Alzheimer disease and controls using an easy Z-score imaging system for multicenter brain perfusion single-photon emission tomography. AJNR Am J Neuroradiol. (2007) 28:731–6. doi: 10.3174/ajnr.A0398
12.
Li X Shimizu S Jibiki I Watanabe K Kubota T . Correlations between Z-scores of VSRAD and regional cerebral blood flow of SPECT in patients with Alzheimer's disease and mild cognitive impairment. Psychiatry Clin Neurosci. (2010) 64:284–92. doi: 10.1111/j.1440-1819.2010.02085.x
13.
Fischl B . FreeSurfer. NeuroImage. (2012) 62:774–81. doi: 10.1016/j.neuroimage.2012.01.021
14.
Iglesias JE Billot B Balbastre Y Magdamo C Arnold SE Das S et al . Joint super-resolution and synthesis of 1 mm isotropic MP-RAGE volumes from clinical MRI exams with scans of different orientation, resolution and contrast. NeuroImage. (2021) 237:118206. doi: 10.1016/j.neuroimage.2021.118206
15.
Iglesias JE Billot B Balbastre Y Magdamo C Arnold SE Das S et al . SynthSR: a public AI tool to turn heterogeneous clinical brain scans into high-resolution T1WI for 3D morphometry. Sci Adv. (2023) 9:3607. doi: 10.1126/sciadv.add3607
16.
Islam KT Reiss AB Chapiro J Akbari H . Improving portable low-field MRI image quality through image-to-image translation using paired low- and high-field images. Sci Rep. (2023) 13:18358. doi: 10.1038/s41598-023-45193-1
17.
Sorby-Adams AJ Stout M Widjaja E Ho RC Moffat BA Finnigan S et al . Portable, low-field MRI for evaluation of Alzheimer’s disease. Nat Commun. (2024) 15:2747. doi: 10.1038/s41467-024-45514-3
18.
Cooper R Sun C Lee C Toseef U Livesey D Toosy A et al . Bridging the gap: improving correspondence between low-field and high-field MR images in young people. Front Neurol. (2024) 15:1273906. doi: 10.3389/fneur.2024.1273906
19.
Kawas MI Shamulzai A Atcheson KM Horn AC Ma R Kittel C et al . Utilizing quantitative analysis of CSF volume from clinical T1-weighted MRI to predict thrombectomy outcomes. J Neuroimaging. (2025) 35:e70013. doi: 10.1111/jon.70013
20.
Rorden C Brett M . Stereotaxic display of brain lesions. Behav Neurol. (2000) 12:191–200. doi: 10.1155/2000/421719
21.
Fedorov A Beichel R Kalpathy-Cramer J Finet J Fillion-Robin JC Pujol S et al . 3D slicer as an image computing platform for the quantitative imaging network. Magn Reson Imaging. (2012) 30:1323–41. doi: 10.1016/j.mri.2012.05.001
22.
Ashburner J . A fast diffeomorphic image registration algorithm. NeuroImage. (2007) 38:95–113. doi: 10.1016/j.neuroimage.2007.07.007
23.
Huppertz HJ Kröll-Seger J Klöppel S Ganz RE Kassubek J . Intra- and interscanner variability of automated voxel-based volumetry based on a 3D probabilistic atlas of human cerebral structures. NeuroImage. (2010) 49:2216–24. doi: 10.1016/j.neuroimage.2009.10.066
24.
Sone D Imabayashi E Maikusa N Ogawa M Sato N Matsuda H et al . Voxel-based specific regional analysis system for Alzheimer's disease (VSRAD) on 3-tesla normal database: diagnostic accuracy in two independent cohorts with early Alzheimer's disease. Aging Dis. (2018) 9:755–60. doi: 10.14336/AD.2017.0818
25.
Kanetaka H Matsuda H Asada T Ohnishi T Yamashita F Imabayashi E et al . Effects of partial volume correction on discrimination between very early Alzheimer's dementia and controls using brain perfusion SPECT. Eur J Nucl Med Mol Imaging. (2004) 31:975–80. doi: 10.1007/s00259-004-1490-8
26.
Niida M Niida A Motomura M Uechi A . Diagnosis of depression by MRI scans with the use of VSRAD - a promising auxiliary means of diagnosis: a report of 10 years research. Int J Gen Med. (2011) 4:377–87. doi: 10.2147/IJGM.S18866
27.
Matsuda H Yokoyama K Sato N Burioka N Nemoto K Baba T et al . Differentiation between dementia with Lewy bodies and Alzheimer's disease using voxel-based morphometry of structural MRI: a multicenter study. Neuropsychiatr Dis Treat. (2019) 15:2715–22. doi: 10.2147/NDT.S222966
28.
Oshikubo G Akahane A Unno A Abe S Kumakura A Takahashi Y et al . Utility of VSRAD for diagnosing Alzheimer's disease in patients screened for dementia. J Int Med Res. (2020) 48:300060520917270. doi: 10.1177/0300060520917270
29.
R Core Team . R: A language and environment for statistical computing. Vienna, Austria: R Foundation for Statistical Computing (2024).
30.
RStudio Team . RStudio: integrated development for R. Boston, MA: RStudio, PBC (2024).
31.
Shapiro SS Wilk MB . An analysis of variance test for normality (complete samples). Biometrika. (1965) 52:591–611. doi: 10.1093/biomet/52.3-4.591
32.
Wilcoxon F . Individual comparisons by ranking methods. Biom Bull. (1945) 1:80–3. doi: 10.2307/3001968
33.
Dunn OJ . Multiple comparisons among means. J Am Stat Assoc. (1961) 56:52–64. doi: 10.1080/01621459.1961.10482090
34.
Bland JM Altman DG . Statistical methods for assessing agreement between two methods of clinical measurement. Lancet. (1986) 327:307–10. doi: 10.1016/S0140-6736(86)90837-8
35.
Krouwer JS . Why Bland–Altman plots should use X, not (Y+X)/2 when X is a reference method. Stat Med. (2008) 27:778–80. doi: 10.1002/sim.2993
36.
Ludbrook J . Statistical techniques for comparing measurers and methods of measurement: a critical review. Clin Exp Pharmacol Physiol. (2002) 29:527–36. doi: 10.1046/j.1440-1681.2002.03686.x
37.
Spearman C . The proof and measurement of association between two things. Am J Psychol. (1904) 15:72–101. doi: 10.2307/1412159
38.
Swets JA . Measuring the accuracy of diagnostic systems. Science. (1988) 240:1285–93. doi: 10.1126/science.3287615
39.
Hanley JA McNeil BJ . The meaning and use of the area under a receiver operating characteristic (ROC) curve. Radiology. (1982) 143:29–36. doi: 10.1148/radiology.143.1.7063747
40.
Youden WJ . Index for rating diagnostic tests. Cancer. (1950) 3:32–5. doi: 10.1002/1097-0142(1950)3:1<32::AID-CNCR2820030106>3.0.CO;2-3
41.
DeLong ER DeLong DM Clarke-Pearson DL . Comparing the areas under two or more correlated receiver operating characteristic curves: a nonparametric approach. Biometrics. (1988) 44:837–45. doi: 10.2307/2531595
42.
Hirata Y Matsuda H Nemoto K Ohnishi T Hirao K Yamashita F et al . Voxel-based morphometry to discriminate early Alzheimer's disease from controls. Neurosci Lett. (2005) 382:269–74. doi: 10.1016/j.neulet.2005.03.038
43.
Matsuda H . Voxel-based morphometry of brain MRI in normal aging and Alzheimer's disease. Aging Dis. (2013) 4:29–37. doi: 10.1007/s11682-012-9203-2
44.
Raji CA Lopez OL Kuller LH Carmichael OT Becker JT . Age, Alzheimer disease, and brain structure. Neurology. (2009) 73:1899–905. doi: 10.1212/WNL.0b013e3181c3f293
45.
Raz N Lindenberger U Rodrigue KM Kennedy KM Head D Williamson A et al . Regional brain changes in aging healthy adults: general trends, individual differences and modifiers. Cereb Cortex. (2005) 15:1676–89. doi: 10.1093/cercor/bhi044
46.
Sadil P Lindquist MA . Comparing automated subcortical volume estimation methods; amygdala volumes estimated by FSL and FreeSurfer have poor consistency. Hum Brain Mapp. (2024) 45:e70027. doi: 10.1002/hbm.70027
47.
Tokumitsu K Yasui-Furukori N Takeuchi J Sugawara N Umeda T Tsuchimine S et al . The combination of MMSE with VSRAD and eZIS has greater accuracy for discriminating mild cognitive impairment from early Alzheimer's disease than MMSE alone. PLoS One. (2021) 16:e0247427. doi: 10.1371/journal.pone.0247427
48.
Blumenthal JD Zijdenbos A Molloy E Giedd JN . Motion artifact in magnetic resonance imaging: implications for automated analysis. NeuroImage. (2002) 16:89–92. doi: 10.1006/nimg.2002.1076
49.
Wang D Strugnell W Cowin G Doddrell DM Slaughter R . Geometric distortion in clinical MRI systems part I: evaluation using a 3D phantom. Magn Reson Imaging. (2004) 22:1211–21. doi: 10.1016/j.mri.2004.08.012
50.
Yazici I Krieger B Bellenberg B Ladopoulos T Gold R Schneider R et al . Automatic estimation of brain parenchymal fraction in patients with multiple sclerosis: a comparison between synthetic MRI and an established automated brain segmentation software based on FSL. Neuroradiology. (2024) 66:193–205. doi: 10.1007/s00234-023-03264-0
51.
Guo C Ferreira D Fink K Westman E Granberg T . Repeatability and reproducibility of FreeSurfer, FSL-SIENAX and SPM brain volumetric measurements and the effect of lesion filling in multiple sclerosis. Eur Radiol. (2019) 29:1355–64. doi: 10.1007/s00330-018-5710-x
52.
Leal GC Whitfield T Praharaju J Walker Z Oxtoby NP . Crop filling: a pipeline for repairing memory clinic MRI corrupted by partial brain coverage. MethodsX. (2024) 11:102434. doi: 10.1016/j.mex.2024.102434
53.
Pollak C Isensee F Maier-Hein KH . FastSurfer-LIT: lesion inpainting tool for whole-brain MRI segmentation with tumors, cavities and abnormalities. Imaging Neurosci. (2025) 3:446. doi: 10.1162/imag_a_00446
54.
Freeman HJ Atalay AS Li J Sobczak E Gilmore N Snider SB et al . Cortical lesion expansion in chronic traumatic brain injury. medRxiv. (2025). doi: 10.1101/2025.03.15.24320738
55.
Waragai M Hata S Suzuki T Ishii M Takahashi E Kashihara K et al . Utility of SPM8 plus DARTEL (VSRAD) combined with magnetic resonance spectroscopy as adjunct techniques for screening and predicting dementia due to Alzheimer's disease in clinical practice. J Alzheimer's Dis. (2014) 41:1207–22. doi: 10.3233/JAD-132786
56.
Katayama T Watanabe K Narimatsu H Kaneda S Korogi Y . Accuracy of VSRAD analysis using scout images: comparison with conventional 3D-T1. Nihon Hoshasen Gijutsu Gakkai Zasshi. (2021) 77:1411–5. doi: 10.6009/jjrt.2021_JSRT_77.12.1411
57.
Inui S Kaneda D Sakurai K Uchida Y Abe O Hashizume Y . Voxel-based morphometry of Alzheimer's disease using a localizer image: a comparative study with magnetization prepared rapid acquisition with gradient echo. Magn Reson Med Sci. (2024):mp.2023-0093. doi: 10.2463/mrms.mp.2023-0093
58.
Shang C Inui S Kaneda D Uchida Y Abe O Hashizume Y . Voxel-based morphometry of progressive supranuclear palsy using a 3D fast low-angle shot localizer image: a comparison with magnetization-prepared rapid gradient echo. Magn Reson Med Sci. (2024):mp.2024-0003. doi: 10.2463/mrms.mp.2024-0003
Summary
Keywords
3D Slicer, Alzheimer disease, FreeSurfer, Mild cognitive impairment, MRI, SynthSR, Voxel-Based Morphometry, VSRAD
Citation
Koike T, Morita A, Sekine T, Sakai T, Tsuchiya T, Takenobu A and Teraoka A (2025) SynthSR-generated 3D T1-weighted MRI from routine 2D clinical images: Validation for VSRAD analysis. Front. Neurol. 16:1645891. doi: 10.3389/fneur.2025.1645891
Received
12 June 2025
Accepted
18 September 2025
Published
16 October 2025
Volume
16 - 2025
Edited by
Domenico Aquino, IRCCS Carlo Besta Neurological Institute Foundation, Italy
Reviewed by
Benedetta Tafuri, University of Salento, Italy
Helena Rico Pereira, New University of Lisboa, Portugal
Updates
Copyright
© 2025 Koike, Morita, Sekine, Sakai, Tsuchiya, Takenobu and Teraoka.
This is an open-access article distributed under the terms of the Creative Commons Attribution License (CC BY). The use, distribution or reproduction in other forums is permitted, provided the original author(s) and the copyright owner(s) are credited and that the original publication in this journal is cited, in accordance with accepted academic practice. No use, distribution or reproduction is permitted which does not comply with these terms.
*Correspondence: Tsukasa Koike, koike_ns@youseikai-grp.jp
Disclaimer
All claims expressed in this article are solely those of the authors and do not necessarily represent those of their affiliated organizations, or those of the publisher, the editors and the reviewers. Any product that may be evaluated in this article or claim that may be made by its manufacturer is not guaranteed or endorsed by the publisher.