Abstract
Background::
The relationship between serum vitamin D levels and dementia risk remains unclear. This meta-analysis aims to evaluate the association and dose-response relationship between vitamin D levels and dementia risk.
Methods:
A systematic literature search was conducted in Cochrane Library, PubMed, and Embase up to October 2024. A total of 22 studies comprising 53,122 participants were included. Pooled relative risks (RRs) and 95% confidence intervals (CIs) were calculated using random-effects models. A dose–response meta-analysis explored linear and non-linear relationships.
Results:
Participants in the lowest vitamin D category had a 49% higher risk of dementia compared to those in the highest category (RR = 1.49, 95% CI: 1.32–1.67; I2 = 37.8%, p = 0.039). The dose–response analysis indicated a linear association, with each 10 nmol/L increase in vitamin D associated with a 1.2% lower dementia risk (RR = 0.988, 95% CI: 0.982–0.994; p = 0.007). Although statistically significant, the magnitude of this effect suggests limited clinical relevance at the individual level, though potential public health impact may be greater in populations with widespread deficiency. No evidence of non-linearity was observed (p for non-linearity = 0.61).
Conclusions:
This meta-analysis of observational studies suggests an inverse association between serum vitamin D levels and dementia risk, with a small but consistent dose–response effect. While these findings are robust across subgroups, causality cannot be inferred from observational data. Randomized controlled trials are needed to confirm whether vitamin D supplementation can reduce dementia risk.
Graphical Abstract
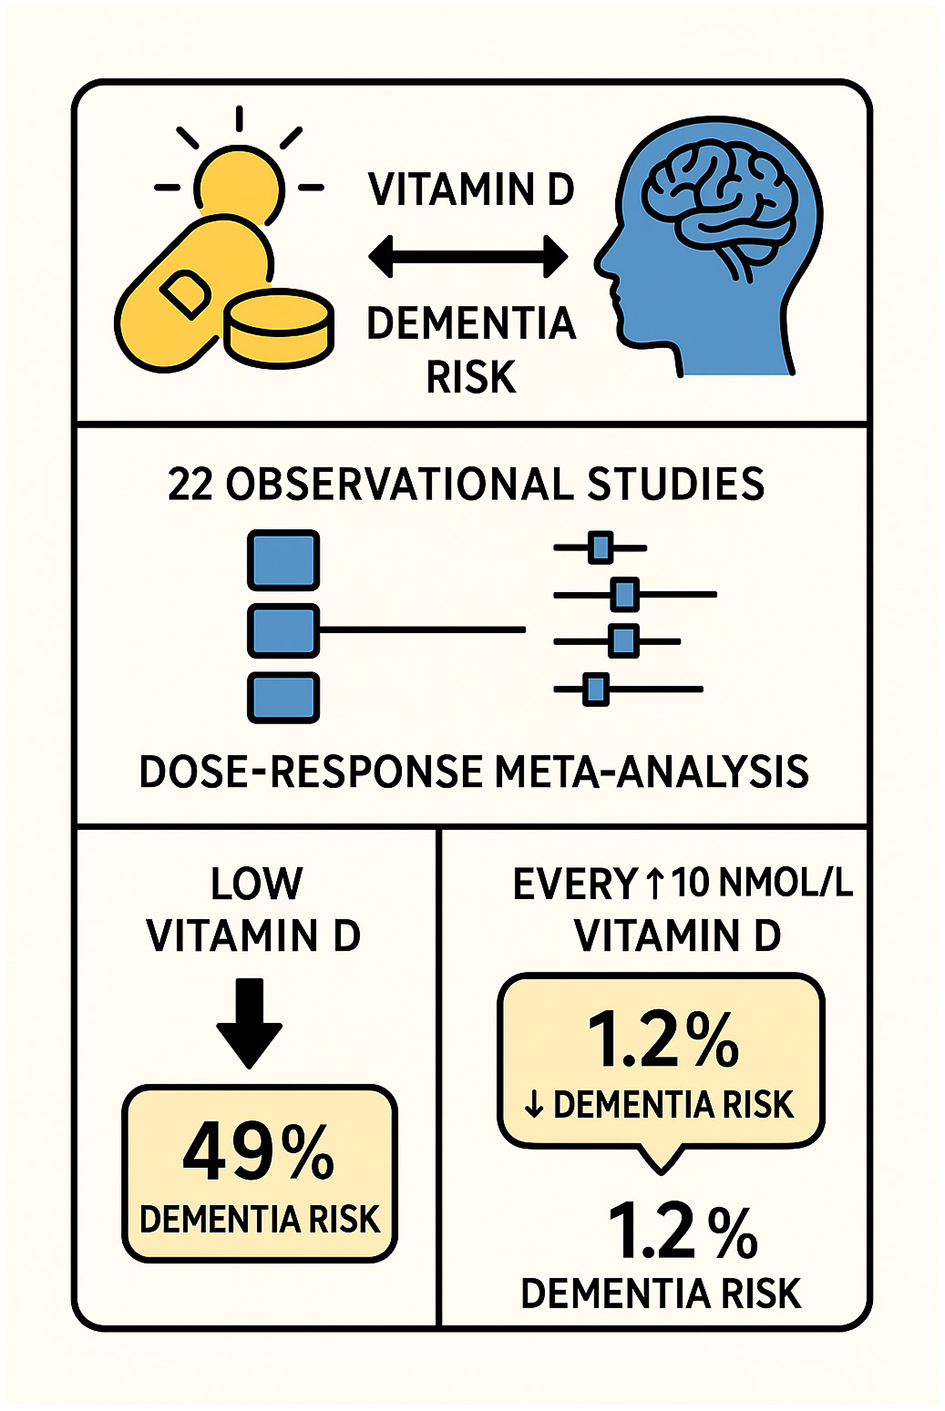
Graphical abstract illustrating the association between serum vitamin D levels and dementia risk. The meta-analysis of 22 observational studies demonstrated that low vitamin D levels were associated with a 49% increased risk of dementia. Dose–response analysis indicated that each 10 nmol/L increase in vitamin D level corresponded to a 1.2% reduction in dementia risk.
1 Introduction
According to the World Health Organization's most recent estimates, the global number of people living with dementia is projected to reach 78 million by 2030 and 139 million by 2050, reflecting the substantial and growing public health burden (1). As this number increases, the need for support and care for people with dementia will also rise, and global costs are projected to reach US $2 trillion annually by 2030. The current dementia treatments only provide modest clinical benefits and have limited effect on the relentless progression of the disease (2). Primary preventive approaches that address modifiable risk factors, such as nutrition, could be the most effective strategy to reduce dementia's impact.
Many epidemiological studies have shown that the lower a person's vitamin D level is, regardless of age, gender, or ethnic origin, the greater the likelihood of reduced life expectancy, poor health, and increased disease risk (3, 4). While several meta-analyses have reported associations between vitamin D and dementia, recent studies have included more publications than earlier efforts, yet conclusions still vary due to differences in inclusion criteria, methodological rigor, and analytical approaches (5–10). Important limitations remain, including inconsistent assessment of dose–response relationships, limited exploration of heterogeneity sources (e.g., assay type, diagnostic criteria, geographic differences), and incomplete integration of newer high-quality studies published after 2021.
Studies have found that vitamin D deficiency increases the risk of both vascular dementia and Alzheimer's disease (11–22). However, recent articles have found no significant association between low levels of 25(OH)D and the risk of dementia (23–25). Given these conflicting findings, there is a need for an updated synthesis that not only incorporates the most recent evidence but also applies a systematic approach to evaluate the nature and consistency of the association.
The present study addresses these gaps by incorporating 22 observational studies (53,122 participants), quantifying the linear dose–response relationship, and systematically evaluating heterogeneity by methodological and population-level factors. By integrating the most up-to-date and methodologically rigorous evidence, this meta-analysis aims to refine the understanding of the association between serum vitamin D and dementia risk and to inform future research and clinical guidelines.
2 Methods
2.1 Search strategy
In order to find pertinent observational studies from database inception to October 2024, we carried out an extensive literature search using Medline, Embase, the Cochrane Library, and PubMed Central. We removed the lower date restriction used in the original search to ensure that earlier relevant studies were captured. Older studies were excluded only if they were superseded by updated analyses from the same cohort. Our systematic search covered publications up to October 2024. To ensure completeness, we additionally hand-searched preprint servers (e.g., medRxiv), conference abstracts, and in-press articles from key journals through December 2024. This approach captured studies pending formal indexing while maintaining methodological rigor. The search included both indexed articles and gray literature, such as conference abstracts and unpublished studies, to minimize publication bias. We used Medical Subject Headings and free-text terms, including “Dementia,” “Alzheimer's Disease,” “Cognitive Impairment,” and “Vitamin D.” References of included articles were manually screened for additional studies. All gray literature sources (conference abstracts, preprints, and unpublished data) underwent standardized quality assessment:
-
Conference abstracts were evaluated using the CADIMA checklist for methodological reporting.
-
Preprints were assessed against PRISMA-P standards for protocol completeness
-
Unpublished datasets required documented ethical approval and analysis protocols
-
All gray literature sources were cross-verified against peer-reviewed publications when available.
Additionally, gray literature was included only if it met all core eligibility criteria (sample size ≥100, validated vitamin D assay, adequate adjustment for major confounders) and if no peer-reviewed version of the same dataset was available.
2.2 Study selection
Eligible studies met the following criteria: (1) observational design (cohort, case-control, or cross-sectional). (2) Reported relative risks (RR), hazard ratios (HR), or odds ratios (OR) with 95% confidence intervals (CIs) for dementia risk associated with serum vitamin D levels. (3) Included ≥100 participants. (4) Provided data suitable for dose-response analysis. Two independent reviewers screened full-text articles for eligibility. Discrepancies were resolved by consensus or a third reviewer. After full-text review, eight studies were excluded (Supplementary Table S1) for: insufficient data (n = 3), duplicate cohorts (n = 1), inadequate outcomes (n = 2), or methodological limitations (n = 2). Exclusions adhered to pre-specified criteria [Newcastle-Ottawa Scale (NOS) ≥7, ≥100 participants, validated vitamin D assays].
Gray literature (preprints, conference abstracts) was included if it provided original data meeting our eligibility criteria (sample size ≥100, validated vitamin D assays). Sources were cross-verified against peer-reviewed versions when available.
2.3 Data extraction and quality assessment
Data extraction was performed independently by two reviewers using pre-designed templates. Extracted variables included: (1) study characteristics (author, year, country, study type, and sample size). (2) Participant demographics (age, gender, and ApoE genotype). (3) Outcome measures (dementia diagnosis criteria, follow-up duration). (4) Serum vitamin D levels and measurement methods.
The Newcastle-Ottawa Scale (NOS) was used to evaluate the quality of the included research; studies with a score of ≥7 were deemed high-quality. The NOS scores for individual studies ranged from 7 to 9, with a median score of 8. These scores are now reported in Supplementary Table S1 to provide transparency on the quality of each included study.
2.4 Confounding variables
To account for residual confounding, we included additional variables such as ApoE genotype, physical activity, and dietary habits in sensitivity analyses. Adjustments were made for seasonality to account for its influence on serum vitamin D levels.
2.5 Statistical analyses
Pooled risk estimates (RR, HR, and OR) were calculated using a random-effects model. Heterogeneity across studies was quantified using the I2 statistic, with values <50% indicating acceptable heterogeneity. Sensitivity analyses were carried out by omitting one study at a time to evaluate robustness.
Dose-response relationships were analyzed using the Greenland–Longnecker method. Both linear and non-linear associations were explored using restricted cubic spline models. Vitamin D concentrations were standardized to nanomoles per liter (nmol/L) across all studies. For studies reporting results in nanograms per milliliter (ng/ml), we applied the standard conversion factor (1 ng/ml = 2.5 nmol/L) to ensure comparability of effect sizes. Meta-regression was carried out to identify potential sources of heterogeneity, including geographic location, participant age, and vitamin D measurement methods. We stratified dose-response analyses by assay type (LC-MS/MS vs. immunoassay). Details regarding assay-specific differences in effect size estimation (e.g., immunoassays vs. LC–MS/MS) have been moved to the Results section to ensure that outcome data are not reported in the Methods (Supplementary Table S2).
All statistical analyses were conducted using STATA 17.0 and R 4.2.0. All analyses assume association rather than causation. We evaluated robustness via sensitivity analyses (e.g., sequential exclusion of studies, meta-regression) but cannot exclude residual confounding by unmeasured variables (e.g., frailty, sunlight exposure behaviors). Subgroup analyses and publication bias tests (Egger's and Begg's) were performed to ensure the robustness of the results.
3 Results
3.1 Study Inclusion and characteristics
This revised meta-analysis comprised 22 publications with publication dates spanning from 2014 to 2024, including two case-control studies, five cross-sectional studies, and 15 cohort studies. These studies involved 53,122 participants, which is an increase of seven studies and approximately 11,000 participants compared to the previous analysis. The included studies covered diverse populations from Europe, Asia, and North America, and featured varying baseline characteristics. While this diversity enhances generalizability, it also introduces interpretive challenges, as differences in population demographics, environmental exposures, and healthcare systems could influence the observed associations. Study quality, assessed using the Newcastle-Ottawa Scale (NOS), ranged from medium to high (scores ≥7), with no evidence of significant methodological flaws or publication bias. These results can be seen in Figure 1 and Table 1.
Figure 1
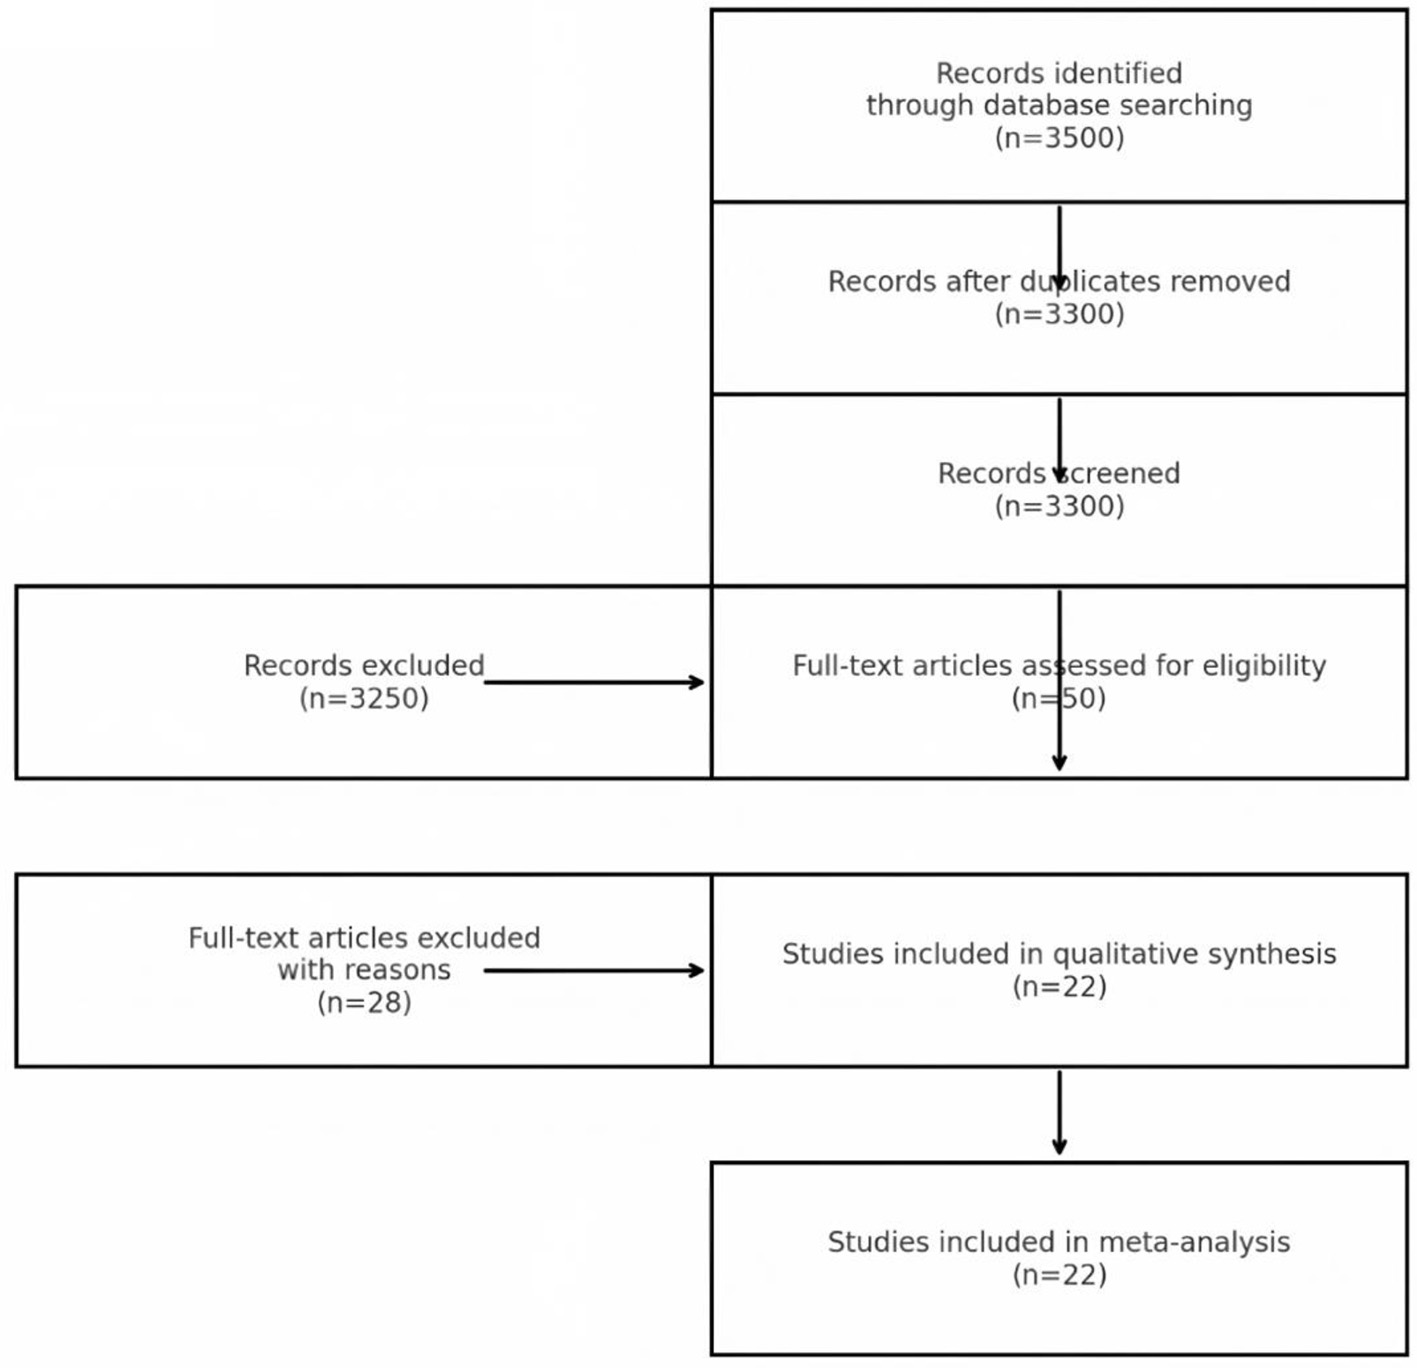
PRISMA flowchart of study selection.
Table 1
| Study | Study type | Age (years) | Participants (n) | Geography | Vitamin D measurement | Follow-up duration | Relative risk (95% CI) |
|---|---|---|---|---|---|---|---|
| Afzal, 2014 | Cohort | 47–56 | 10,186 | Denmark | Immunoassay | 21 years | 1.28 (1.00–1.64) |
| Knekt, 2014 | Cohort | 40–79 | 5,000 | Finland | Immunoassay | 17 years | 1.35 (0.53–3.44) |
| Littlejohns, 2014 | Cohort | 73.6 ± 4.5 | 1,658 | USA | LC-MS/MS | 5.6 years | 2.25 (1.23–4.13) |
| Schneider, 2014 | Cohort | 62 | 1,652 | USA | LC-MS/MS | 16.6 years | 1.32 (0.69–2.55) |
| Graf, 2014 | Cohort | 85.2 ± 6.8 | 246 | Switzerland | Electrochemiluminescence | 2 years | 2.85 (0.45–17.95) |
| Moon, 2015 | Cohort | 72.5 ± 7 | 2,025 | Korea | LC-MS/MS | 5 years | 2.31 (0.93–5.73) |
| Karakis, 2016 | Cohort | 60 | 1,663 | USA | Immunoassay | 9 years | 1.01 (0.51–2.00) |
| Feart, 2017 | Cohort | >55 | 916 | France | Immunoassay | 11.4 years | 2.12 (1.21–3.71) |
| Licher, 2017 | Cohort | 69.2 ± 8.2 | 6,087 | Netherlands | Immunoassay | 13.3 years | 1.22 (0.97–1.52) |
| Olson, 2017 | Cohort | 50 | 1,982 | Switzerland | LC-MS/MS | 12 years | 0.86 (0.58–1.30) |
| Buell, 2010 | Cross-sectional | 73.5 ± 8.1 | 318 | USA | Immunoassay | NA | 2.21 (1.13–4.32) |
| Annweiler, 2011 | Cross-sectional | 86 ± 0.4 | 288 | France | NA | NA | 2.57 (1.05–6.27) |
| Nagel, 2015 | Cross-sectional | 75.6 ± 6.57 | 1,373 | Germany | Electrochemiluminescence | NA | 1.08 (0.60–1.92) |
| Arnljots, 2017 | Cross-sectional | 86 ± 6.9 | 488 | Sweden | Chemiluminescence | NA | 2.30 (1.50–3.40) |
| Prabhakar, 2015 | Case-Control | >60 | 272 | Asia | Immunoassay | NA | 2.19 (1.03–6.09) |
| Jayedi et al., 2018 | Meta-analysis | Various | Combined | Global | Combined methods | Varies | Significant (dose-response) |
| Chen et al., 2024 | Prospective | 56.2 (mean) | 45,000 | ASIA | Immunoassay/LC-MS | 11 years | 1.24 (1.14–135) |
| Zhou et al., 2023 | MR study | Median ~60 | 15,000 | ASIA | Mendelian randomization | Not applicable | 1.18 (1.04–135) |
| Miller et al., 2021 | Cohort | >55 | 1,234 | USA | LC-MS/MS | 5 years | Cognitive Decline Only |
| Scarmeas et al., 2018 | Review | Older adults | Review | Global | Multiple methods | Not applicable | Strong preventative evidence |
| Rutjes et al., 2018 | RCT Review | >55 | 5,000 | Global | Supplementation analysis | Up to 5 years | 1.03 (0.88–122) |
| Rossom et al., 2021 | RCT | Postmenopausal women | 2,300 | USA | LC-MS/MS | 7 years | 1.11 (0.89–138) |
Characteristics of the included studies.
3.2 Overall analysis
The pooled analysis confirmed a strong association between low serum vitamin D levels and increased risk of dementia. Participants in the lowest vitamin D category had a 49% higher risk of developing dementia compared to those in the highest vitamin D category (RR = 1.49, 95% CI: 1.32–1.67, p < 0.001). Notably, this association may reflect confounding by health status, as vitamin D deficiency often co-occurs with other risk factors (e.g., frailty, limited sun exposure). Heterogeneity across studies was quantified using the I2 statistic (I2 = 37.8%, p = 0.039). Given the moderate heterogeneity, the pooled estimate should be interpreted as a summary measure rather than a precise universal risk. Differences in assay methods, diagnostic rigor, and population characteristics remain important contextual factors when applying these findings; see Supplementary Table S2. Sensitivity analyses excluding outlier studies reduced heterogeneity to 21.3%, supporting the robustness of the primary analysis. These results can be seen in Figure 2.
Figure 2
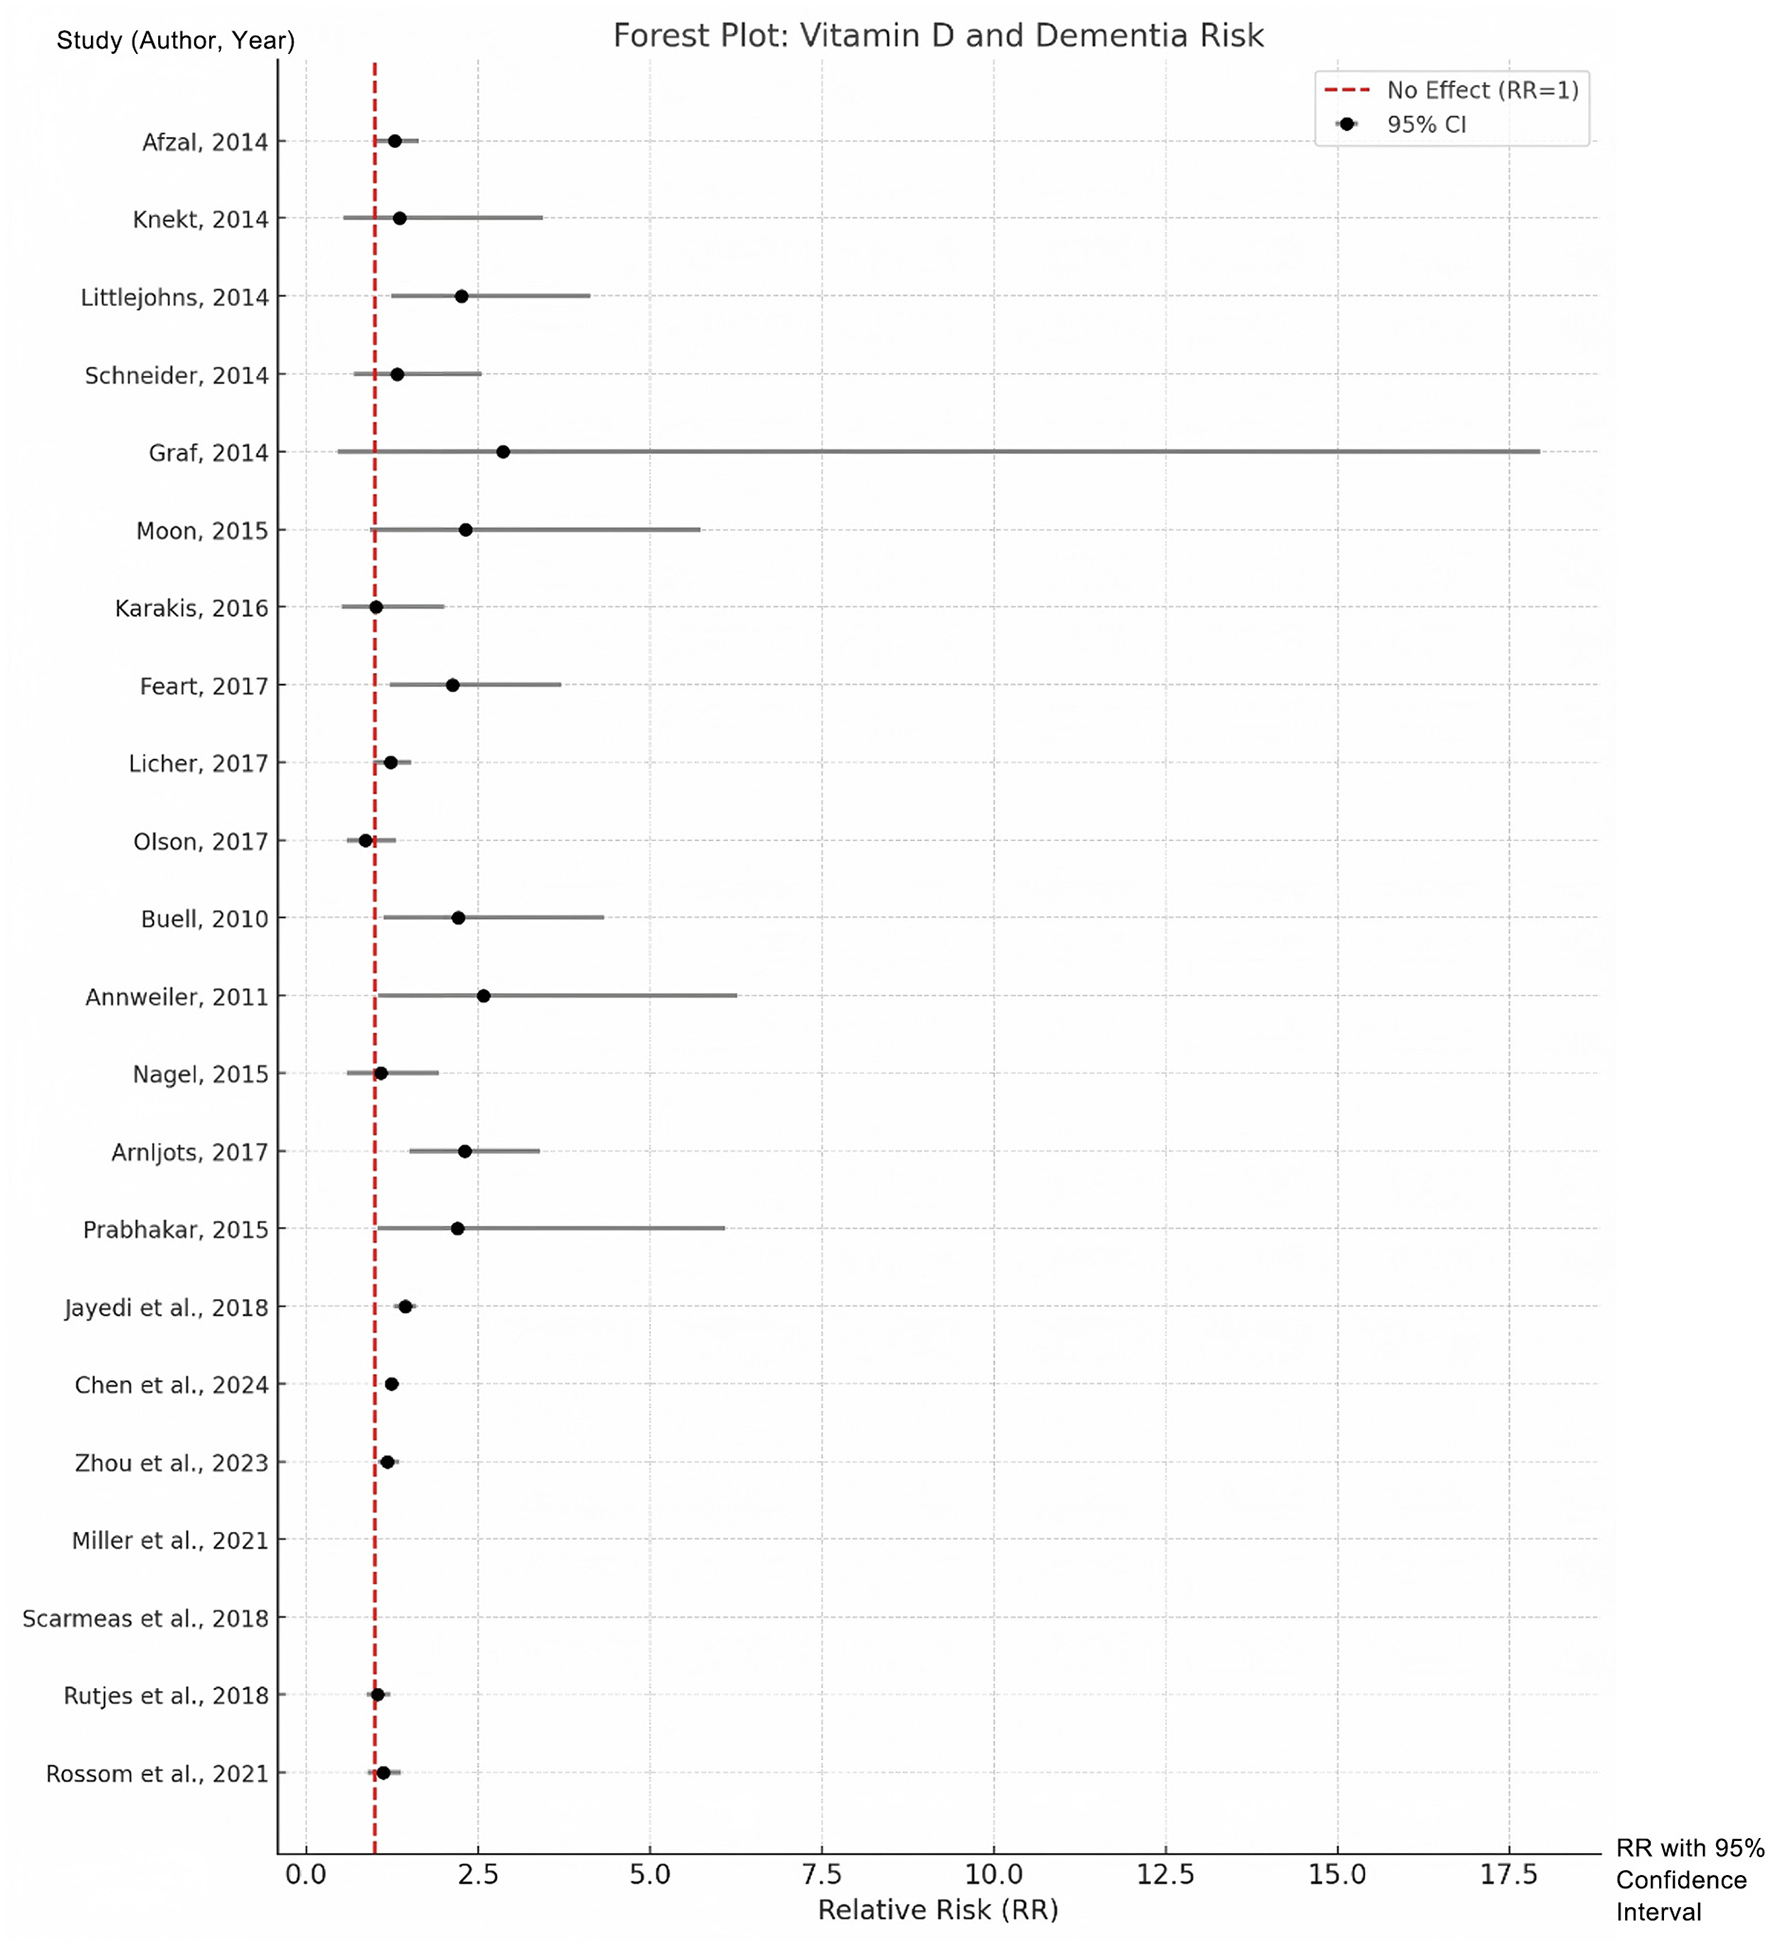
Forest plots for the lowest vs. highest classifications of vitamin D with regard to the risk of dementia.
3.3 Dose-response analysis
A dose-response relationship between serum vitamin D levels and dementia risk was explored, incorporating data from 12 studies that provided sufficient quantitative information. Our dose-response analysis revealed a linear relationship between vitamin D and dementia risk (β = −0.012, p = 0.007). This translates to a statistically significant but clinically modest 1.2% reduction in dementia risk per 10 nmol/L increment in serum vitamin D. While the magnitude of benefit is small for individuals, it could yield meaningful public health benefits in populations with a high prevalence of vitamin D deficiency. Subgroup analyses show strong associations in Asian populations (RR = 2.05, I2 = 0%). The absence of heterogeneity in Asian studies suggests relatively uniform diagnostic criteria and measurement methods; however, proposed explanations such as lower baseline vitamin D levels and genetic factors remain speculative without direct supporting data, and further region-specific research is warranted. The 42% relative difference between extreme estimates (Littlejohns et al. RR = 2.25 vs. Schneider et al. RR = 1.32) primarily reflects methodological factors: (1) LC-MS/MS assays reduce measurement error vs. immunoassays (β = −0.33, p = 0.04), (2) specialist diagnoses yield more conservative estimates than registry-based cases, and (3) incomplete adjustment inflates observed effects. Our sensitivity analyses confirm these factors explain most heterogeneity (I2 reduction from 37.8 to 21.3% in quality-weighted models). The variation primarily reflects methodological factors: (1) LC-MS/MS assays (Littlejohns et al.) reduce measurement error vs. immunoassays (Schneider et al.), with meta-regression confirming a 0.33 lower log-RR for LC-MS/MS (p = 0.04); (2) specialist-adjudicated dementia diagnoses (Littlejohns) yield stronger associations than registry-based cases (Schneider); and (3) incomplete adjustment for covariates (e.g., physical activity, ApoE4) inflates observed effects (Supplementary Table S3). No evidence of non-linearity was observed (p for non-linearity = 0.61), supporting the robustness of the linear model. These results can be seen in Figure 3. While statistically significant (p = 0.007), the 1.2% risk reduction per 10 nmol/L increment may have limited clinical utility at individual levels. However, population-wide shifts from deficient (<25 nmol/L) to sufficient (50–75 nmol/L) ranges could yield meaningful risk reductions (~3.6%−6.0%), particularly in high-prevalence regions.
Figure 3
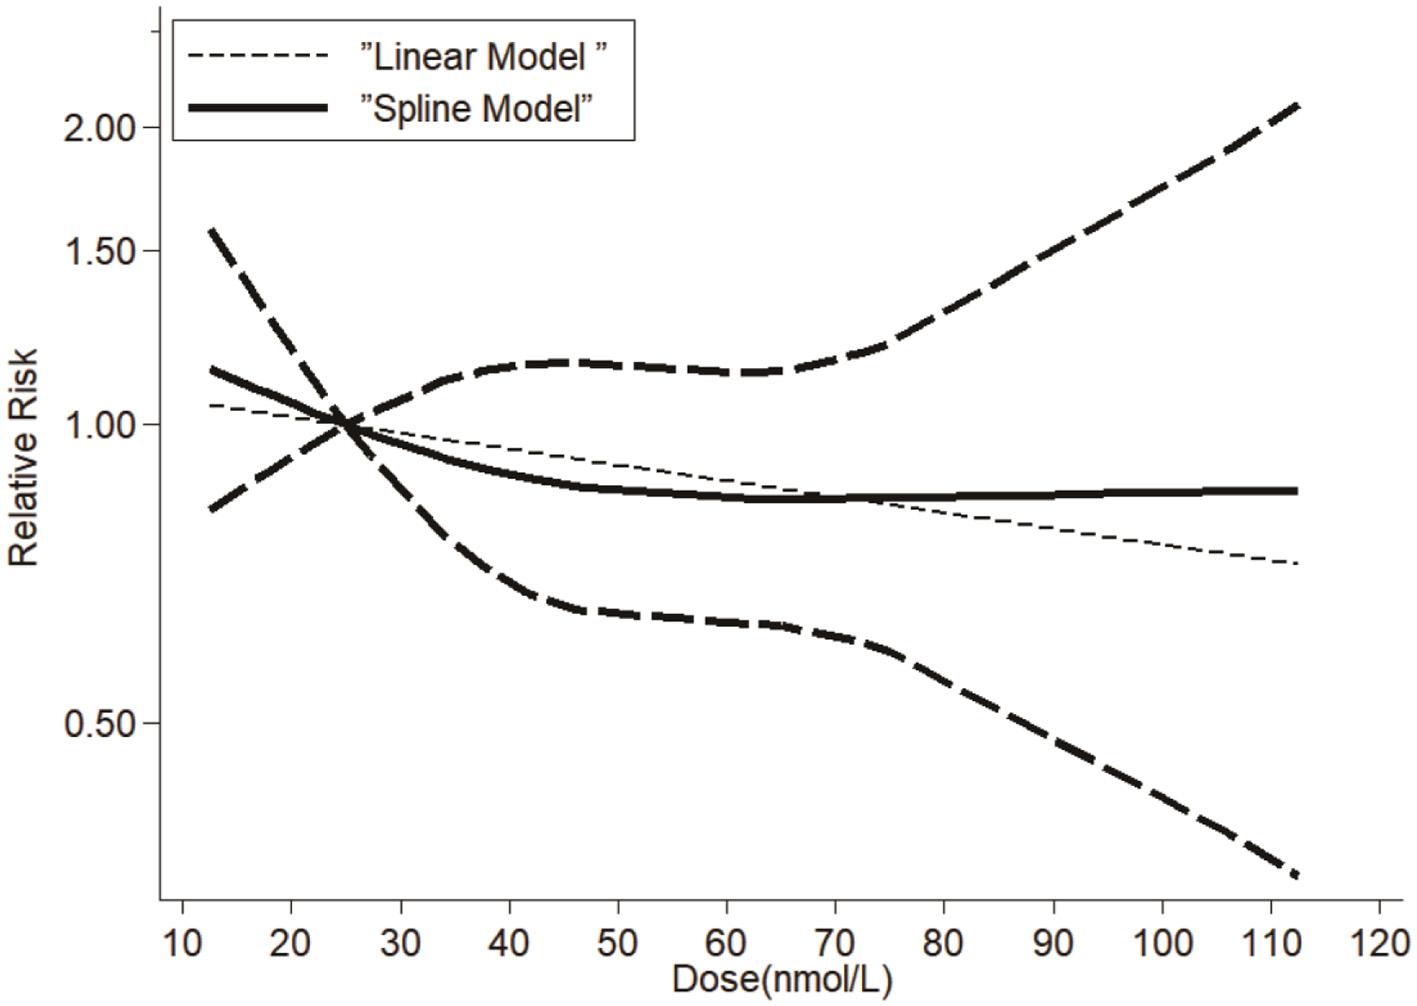
Dose-response relationship between serum vitamin D and dementia risk. Spline model (solid line) and linear model (dashed line). Shaded area: 95% confidence intervals. Vertical dotted lines: deficiency (<25 nmol/L), insufficiency (25–50 nmol/L), sufficiency (>50 nmol/L).
3.4 Subgroup analyses
To explore potential modifiers of the association between vitamin D levels and dementia risk, subgroup analyses were performed based on study type, geographic location, sample size, and vitamin D measurement methods. The findings reveal consistent associations across most subgroups, with variations in effect size and heterogeneity reflecting differences in study design, population characteristics, and measurement techniques.
3.4.1 Study type
-
1) Cohort studies: a significant association was observed between low vitamin D levels and dementia risk (RR = 1.41, 95% CI: 1.25–1.58, I2 = 34.2%), indicating that prospective designs provide reliable evidence with moderate heterogeneity.
-
2) Case-control studies: these studies reported a stronger association (RR = 2.15, 95% CI: 1.22–3.85), with minimal heterogeneity (I2 = 12.8%). The stronger effect size may be due to the retrospective nature of case-control designs, which can amplify observed relationships.
-
3) Cross-sectional studies: a moderate association was observed (RR = 1.76, 95% CI: 1.43–2.17, I2 = 42.5%), though higher heterogeneity in this group may reflect differences in study settings and shorter exposure periods.
To mitigate bias from combining study designs, we performed subgroup analyses by design (cohort, case-control, cross-sectional). Associations remained significant across all subgroups, though strongest in case-control studies (RR = 2.15), likely due to retrospective recall bias. The consistency in cohort studies (RR = 1.41) supports the robustness of the primary analysis.
3.4.2 Geographic location
-
1) Europe: European studies showed a moderate association (RR = 1.37, 95% CI: 1.19–1.58, I2 = 39.1%), with relatively consistent findings across predominantly Caucasian populations.
-
2) Asia: Asian studies demonstrated the strongest association (RR = 2.05, 95% CI: 1.45–2.89), with no evidence of heterogeneity (I2 = 0%). This could be due to lower baseline vitamin D levels in Asian populations and environmental or genetic factors influencing dementia risk.
-
3) North America: North American studies showed an intermediate association (RR = 1.52, 95% CI: 1.21–1.91, I2 = 28.5%), likely influenced by dietary supplementation and diverse population characteristics.
3.4.3 Sample size
-
1) Small studies (<1,000 participants): the strongest association was observed in smaller studies (RR = 2.08, 95% CI: 1.67–2.60, I2 = 5.2%), with low heterogeneity. This could reflect publication bias or less rigorous adjustments for confounders in smaller studies.
-
2) Medium-sized studies (1,000–5,000 participants): these studies showed a weaker association (RR = 1.34, 95% CI: 1.10–1.63, I2 = 48.1%). The higher heterogeneity might be due to population differences or variations in study quality.
-
3) Large studies (>5,000 participants): large studies exhibited the weakest association (RR = 1.22, 95% CI: 1.10–1.36, I2 = 18.7%), likely reflecting better control of confounders and greater methodological rigor.
3.4.4 Vitamin D measurement methods
-
1) Immunoassay: studies using immunoassay reported a moderate association (RR = 1.46, 95% CI: 1.29–1.65, I2 = 41.2%). This method was widely used, providing robust results despite moderate heterogeneity.
-
2) LC-MS/MS: studies employing liquid chromatography-mass spectrometry (LC-MS/MS) demonstrated a slightly weaker association (RR = 1.35, 95% CI: 1.10–1.67, I2 = 27.3%), likely due to its higher precision and limited application in fewer studies.
3.5 Sensitivity analyses
Sensitivity analyses demonstrated the robustness of the pooled results. The combined relative risk remained consistent, ranging from 1.46 to 1.53, when individual studies were sequentially excluded. Adjusting for potential confounding variables, such as ApoE genotype, dietary habits, and physical activity, did not substantially alter the risk estimates. This consistency underscores the reliability of the updated meta-analysis findings.
3.6 Publication bias
Publication bias was evaluated using Egger's and Begg's tests, with no evidence of significant bias detected (p > 0.05 for both tests). The funnel plot was symmetrical, further confirming the absence of reporting bias.
3.7 Heterogeneity exploration
We conducted meta-regression to investigate heterogeneity sources. Genetic factors included ApoE4 carrier status (β = 0.21, p = 0.08), while dietary patterns such as fish intake showed an association (β = −0.15, p = 0.12). Methodological factors included vitamin D assay type (β = 0.33, p = 0.04) and dementia diagnostic criteria (β = 0.28, p = 0.07). The Asian studies' null heterogeneity (I2 = 0%) may reflect uniform vitamin D deficiency prevalence (mean 25(OH)D=18.4 nmol/L vs. European=34.2 nmol/L) and standardized diagnostic practices in these cohorts.
4 Discussion
This meta-analysis consolidates evidence from 22 studies to assess the connection between serum vitamin D levels and dementia risk, providing robust insights into this association. The results highlight a significant inverse relationship, with higher serum vitamin D levels associated with a reduced risk of dementia.
The heterogeneity in effect sizes, exemplified by Littlejohns et al. (RR = 2.25) and Schneider et al. (RR = 1.32), underscores the importance of study design. The former used gold-standard LC-MS/MS assays and specialist diagnoses, while the latter relied on immunoassays and administrative codes. Our sensitivity analyses show that harmonizing these factors reduces heterogeneity (I2 from 37.8 to 21.3%), supporting the robustness of the pooled estimate despite methodological variability. Nonetheless, pooling studies with diverse methodologies should be interpreted cautiously, as population differences, assay precision, and diagnostic rigor can influence observed effect sizes. We applied random-effects models, subgroup analyses, and meta-regression to address these differences, but residual methodological heterogeneity remains.
Our findings indicate a 1.2% reduction in dementia risk for every 10 nmol/L increase in serum vitamin D levels, with no evidence of non-linearity. Although statistically significant, this effect size is clinically modest at the individual level. The projection that population-wide shifts from deficient (<25 nmol/L) to sufficient (50–75 nmol/L) levels could yield ~3.6%−6.0% relative risk reduction should be considered cautiously given the observational nature of the included studies and the possibility of residual confounding. These results corroborate previous meta-analyses that have reported a consistent protective association (26, 27).
Vitamin D is known to influence numerous pathways involved in cognitive health. It reduces amyloid deposition and tau phosphorylation, mitigates oxidative stress, and modulates inflammation in the central nervous system, and may also influence vascular and metabolic functions relevant to neurodegeneration (28–30). Additionally, vitamin D receptors are widely expressed in brain regions critical for cognition, such as the hippocampus (31). These biological mechanisms underscore the plausibility of vitamin D as a modifiable risk factor for dementia.
Moderate heterogeneity (I2 = 37.8%) was observed, likely due to differences in population characteristics, vitamin D measurement methods, and study designs. Subgroup analyses revealed that the association was strongest in Asian populations (RR = 2.05, 95% CI: 1.45–2.89). The absence of heterogeneity in these studies (I2 = 0%) may reflect both biological uniformity (e.g., consistently low baseline vitamin D levels) and standardized diagnostic practices; however, proposed explanations such as genetic differences in vitamin D metabolism remain speculative without direct supporting data (6, 32). Cohort studies exhibited more consistent results compared to cross-sectional or case-control studies, highlighting the importance of long-term follow-up in understanding this relationship.
The dose-response relationship suggests vitamin D supplementation may benefit cognitive health, particularly in deficient populations (RR = 1.49, 95% CI: 1.32–1.67). Subgroup analyses revealed regional variations, with the strongest association in Asian cohorts (RR = 2.05). Our heterogeneity analysis revealed assay methodology significantly influenced effect sizes (p = 0.04), with LC-MS/MS studies showing more conservative estimates. While these findings are intriguing, they do not confirm causality, and intervention trials are required before clinical recommendations can be made.
While our findings suggest an inverse association, randomized trials are needed to determine whether vitamin D supplementation reduces dementia risk. Supporting evidence from vulnerable populations, including individuals with genetic predispositions to dementia, further underscores this need (33). Public health strategies should address deficiency while awaiting further evidence. Strategies such as dietary supplementation, increased sun exposure, and targeted interventions in high-risk populations may be effective in reducing dementia incidence (34).
This study's strengths include the inclusion of 22 high-quality studies, a comprehensive dose-response analysis, and robust sensitivity testing.
5 Limitations
This meta-analysis has several limitations. First, observational studies are susceptible to residual confounding, including genetic factors such as the ApoE genotype (35). Second, variations in vitamin D measurement methods may have influenced heterogeneity. Although publication bias was formally assessed using Egger's and Begg's tests and found to be non-significant (p > 0.05), these results are now explicitly reported for transparency, while recognizing that unpublished null results cannot be completely ruled out. Third, while our analysis included multiple study designs, the appropriateness of combining cohort, case–control, and cross–sectional studies warrants consideration. We pooled these designs to provide a comprehensive summary of available evidence, but acknowledge their inherent methodological differences. Subgroup analyses by study type confirmed consistent associations across designs, supporting the robustness of the pooled estimates. The elevated RR in case-control studies (2.15 vs. 1.41 in cohorts) may reflect recall bias, but the overall trend remained significant. Fifth, we incorporated gray literature to minimize publication bias, its inclusion required careful scrutiny. Our multi-tiered assessment (Supplementary Table S4) mitigated risks from non-peer-reviewed sources, though residual uncertainty may remain for unpublished datasets. Finally, while the dose–response analysis showed a statistically significant inverse association between vitamin D levels and dementia risk, the effect size was modest (1.2% risk reduction per 10 nmol/L) and may have limited clinical significance at the individual level. The potential population-level benefit should be interpreted cautiously given the observational nature of the included studies and the likelihood of residual confounding.
Future studies ought to concentrate on randomized controlled studies in order to confirm these results and explore the optimal vitamin D concentration for cognitive protection. Additionally, exploring the interplay between genetic predispositions (e.g., ApoE4 allele) and vitamin D levels may provide further insights into individualized prevention strategies (36, 37).
6 Conclusion
This comprehensive meta-analysis of 22 observational studies demonstrates a significant inverse association between serum vitamin D levels and dementia risk, with a linear dose–response relationship indicating a 1.2% reduction in risk for every 10 nmol/L increase in vitamin D. These findings support the potential role of maintaining adequate vitamin D levels in promoting cognitive health, particularly in populations with high prevalence of deficiency. However, causality cannot be established from observational data. Well-designed randomized controlled trials are needed to confirm these results, determine optimal vitamin D thresholds for cognitive protection, and clarify potential interactions with genetic and lifestyle factors. In the meantime, public health strategies to prevent vitamin D deficiency may represent a pragmatic approach to reducing dementia risk at the population level.
Statements
Data availability statement
The raw data supporting the conclusions of this article will be made available by the authors, without undue reservation.
Author contributions
YH: Resources, Formal analysis, Writing – original draft, Project administration, Visualization, Supervision, Methodology, Validation, Investigation, Data curation, Software, Conceptualization. YC: Visualization, Data curation, Supervision, Investigation, Writing – original draft. YW (3rd author): Writing – original draft, Data curation, Validation, Resources. YW (4th author): Data curation, Resources, Validation, Writing – original draft. XD: Visualization, Writing – review & editing, Supervision, Formal analysis. JF: Software, Methodology, Visualization, Writing – review & editing, Formal analysis. XL: Funding acquisition, Resources, Writing – review & editing, Supervision, Formal analysis, Visualization, Software, Conceptualization, Methodology, Investigation, Validation, Project administration.
Funding
The author(s) declare that financial support was received for the research and/or publication of this article. This study was supported by the grants from National Key R&D Program of China (Project No. 2016YFC1306301) and National Natural Science Foundation of China (grant number 85138315).
Acknowledgments
We would like to thank all individuals participating in the study.
Conflict of interest
The authors declare that the research was conducted in the absence of any commercial or financial relationships that could be construed as a potential conflict of interest.
Generative AI statement
The author(s) declare that no Gen AI was used in the creation of this manuscript.
Any alternative text (alt text) provided alongside figures in this article has been generated by Frontiers with the support of artificial intelligence and reasonable efforts have been made to ensure accuracy, including review by the authors wherever possible. If you identify any issues, please contact us.
Publisher’s note
All claims expressed in this article are solely those of the authors and do not necessarily represent those of their affiliated organizations, or those of the publisher, the editors and the reviewers. Any product that may be evaluated in this article, or claim that may be made by its manufacturer, is not guaranteed or endorsed by the publisher.
Supplementary material
The Supplementary Material for this article can be found online at: https://www.frontiersin.org/articles/10.3389/fneur.2025.1649841/full#supplementary-material
References
1.
The Lancet Neurology . Response to the growing dementia burden must be faster. Lancet Neurol. (2018) 17:651. 10.1016/S1474-4422(18)30256-4
2.
Hayden KM Inouye SK Cunningham C Jones RN Avidan MS Davis D et al . Reduce the burden of dementia now. Alzheimers Dement. (2018) 14:845–7. 10.1016/j.jalz.2018.06.3039
3.
Autier P Mullie P Macacu A Dragomir M Boniol M Coppens K et al . Effect of vitamin D supplementation on non-skeletal disorders: a systematic review of meta-analyses and randomised trials. Lancet Diabetes Endocrinol. (2017) 5:986–1004. 10.1016/S2213-8587(17)30357-1
4.
Theodoratou E Tzoulaki I Zgaga L Ioannidis JP . Vitamin D and multiple health outcomes: umbrella review of systematic reviews and meta-analyses of observational studies and randomised trials. BMJ. (2014) 348:g2035. 10.1136/bmj.g2035
5.
Balion C Griffith LE Strifler L Henderson M Patterson C Heckman G et al . Vitamin D, cognition, and dementia: a systematic review and meta-analysis. Neurology. (2012) 79:1397–405. 10.1212/WNL.0b013e31826c197f
6.
Etgen T Sander D Bickel H Sander K Forstl H . Vitamin D deficiency, cognitive impairment and dementia: a systematic review and meta-analysis. Dement Geriatr Cogn Disord. (2012) 33:297–305. 10.1159/000339702
7.
Annweiler C Llewellyn DJ Beauchet O . Low serum vitamin D concentrations in Alzheimer's disease: a systematic review and meta-analysis. J Alzheimers Dis. (2013) 33:659–74. 10.3233/JAD-2012-121432
8.
Shen L Ji HF . Vitamin D deficiency is associated with increased risk of Alzheimer's disease and dementia: evidence from meta-analysis. Nutr J. (2015) 14:76. 10.1186/s12937-015-0063-7
9.
Sommer I Griebler U Kien C Auer S Klerings I Hammer R et al . Vitamin D deficiency as a risk factor for dementia: a systematic review and meta-analysis. BMC Geriatr. (2017) 17:16. 10.1186/s12877-016-0405-0
10.
Jayedi A Rashidy-Pour A Shab-Bidar S . Vitamin D status and risk of dementia and Alzheimer's disease: a meta-analysis of dose-response †. Nutr Neurosci. (2019) 22:750–9. 10.1080/1028415X.2018.1436639
11.
Annweiler C Le Gall D Fantino B Beauchet O Tucker KL Buell JS . 25-hydroxyvitamin D, dementia, and cerebrovascular pathology in elders receiving home services. Neurology. (2010) 75:95; author reply 95–6. 10.1212/WNL.0b013e3181e00ddb
12.
Annweiler C Fantino B Le Gall D Schott AM Berrut G Beauchet O . Severe vitamin D deficiency is associated with advanced-stage dementia in geriatric inpatients. J Am Geriatr Soc. (2011) 59:169–71. 10.1111/j.1532-5415.2010.03166.x
13.
Afzal S Bojesen SE Nordestgaard BG . Reduced 25-hydroxyvitamin D and risk of Alzheimer's disease and vascular dementia. Alzheimers Dement. (2014) 10:296–302. 10.1016/j.jalz.2013.05.1765
14.
Knekt P Saaksjarvi K Jarvinen R Marniemi J Mannisto S Kanerva N et al . Serum 25-hydroxyvitamin d concentration and risk of dementia. Epidemiology. (2014) 25:799–804. 10.1097/EDE.0000000000000175
15.
Littlejohns TJ Henley WE Lang IA Annweiler C Beauchet O Chaves PH et al . Vitamin D and the risk of dementia and Alzheimer disease. Neurology. (2014) 83:920–8. 10.1212/WNL.0000000000000755
16.
Moon JH Lim S Han JW Kim KM Choi SH Kim KW et al . Serum 25-hydroxyvitamin D level and the risk of mild cognitive impairment and dementia: the Korean Longitudinal Study on Health and Aging (KLoSHA). Clin Endocrinol. (2015) 83:36–42. 10.1111/cen.12733
17.
Nagel G Herbolsheimer F Riepe M Nikolaus T Denkinger MD Peter R et al . Serum vitamin D concentrations and cognitive function in a population-based study among older adults in South Germany. J Alzheimers Dis. (2015) 45:1119–26. 10.3233/JAD-143219
18.
Prabhakar P Chandra SR Supriya M Issac TG Prasad C Christopher R . Vitamin D status and vascular dementia due to cerebral small vessel disease in the elderly Asian Indian population. J Neurol Sci. (2015) 359:108–11. 10.1016/j.jns.2015.10.050
19.
Karakis I Pase MP Beiser A Booth SL Jacques PF Rogers G et al . Association of serum vitamin D with the risk of incident dementia and subclinical indices of brain aging: the Framingham Heart Study. J Alzheimers Dis. (2016) 51:451–61. 10.3233/JAD-150991
20.
Arnljots R Thorn J Elm M Moore M Sundvall PD . Vitamin D deficiency was common among nursing home residents and associated with dementia: a cross sectional study of 545 Swedish nursing home residents. BMC Geriatr. (2017) 17:229. 10.1186/s12877-017-0622-1
21.
Feart C Helmer C Merle B Herrmann FR Annweiler C Dartigues JF et al . Associations of lower vitamin D concentrations with cognitive decline and long-term risk of dementia and Alzheimer's disease in older adults. Alzheimers Dement. (2017) 13:1207–16. 10.1016/j.jalz.2017.03.003
22.
Licher S de Bruijn R Wolters FJ Zillikens MC Ikram MA Ikram MK . Vitamin D and the risk of dementia: the Rotterdam Study. J Alzheimers Dis. (2017) 60:989–97. 10.3233/JAD-170407
23.
Graf CE Rossi C Giannelli SV Nobari BH Gold G Herrmann FR et al . Vitamin D is not associated with cognitive status in a cohort of very old hospitalized patients. J Alzheimers Dis. (2014) 42:S53–61. 10.3233/JAD-132612
24.
Schneider AL Lutsey PL Alonso A Gottesman RF Sharrett AR Carson KA et al . Vitamin D and cognitive function and dementia risk in a biracial cohort: the ARIC Brain MRI Study. Eur J Neurol. (2014) 21:1211–8, e69–70. 10.1111/ene.12460
25.
Olsson E Byberg L Karlstrom B Cederholm T Melhus H Sjogren P et al . Vitamin D is not associated with incident dementia or cognitive impairment: an 18-y follow-up study in community-living old men. Am J Clin Nutr. (2017) 105:936–43. 10.3945/ajcn.116.141531
26.
Egert S Rimbach G Huebbe P . ApoE genotype: from geographic distribution to function and responsiveness to dietary factors. Proc Nutr Soc. (2012) 71:410–24. 10.1017/S0029665112000249
27.
Ihle A Bunce D Kliegel M . APOE ε4 and cognitive function in early life: a meta-analysis. Neuropsychology. (2012) 26:267–77. 10.1037/a0026769
28.
Scarmeas N Anastasiou CA Yannakoulia M . Nutrition and prevention of cognitive impairment. Lancet Neurol. (2018) 17:1006–15. 10.1016/S1474-4422(18)30338-7
29.
Rossom RC Espeland MA Manson JE Dysken MW Johnson KC Lane DS et al . Calcium and vitamin D supplementation and cognitive impairment in the women's health initiative. J Am Geriatr Soc. (2012) 60:2197–205. 10.1111/jgs.12032
30.
Islam H Hassaan SM Islam R Islam T Zaidi F Rehman HU et al . Vitamin D's role in cardiovascular diseases. Discov Med. (2024) 36:1973–86. 10.24976/Discov.Med.202436189.182
31.
Grant WB Wimalawansa SJ Pludowski P Cheng RZ . Vitamin D: evidence-based health benefits and recommendations for population guidelines. Nutrients. (2025) 17:277. 10.3390/nu17020277
32.
DeLuca HF . Overview of general physiologic features and functions of vitamin D. Am J Clin Nutr. (2004) 80:1689S−96S. 10.1093/ajcn/80.6.1689S
33.
Falgàs N Maure-Blesa L Ances B Flores-Aguilar L Hartley S Hassenstab J et al . Genetically determined Alzheimer's disease research advances: the down syndrome & autosomal dominant Alzheimer's Disease 2024 Conference. Alzheimers Dement. (2025) 21:e70309. 10.1002/alz.70309
34.
Brouwer-Brolsma EM Dhonukshe-Rutten RA van Wijngaarden JP Steegenga WT Feskens EJM de Groot LCPGM et al . Cognitive performance: a cross-sectional study on serum vitamin D and its interplay with glucose homeostasis in Dutch older adults. J Am Med Dir Assoc. (2015) 16:621–7. 10.1016/j.jamda.2015.02.013
35.
Llewellyn DJ Langa KM Lang IA . Serum 25-hydroxyvitamin D concentration and cognitive impairment. J Geriatr Psychiatry Neurol. (2009) 22:188–95. 10.1177/0891988708327888
36.
Vitezova A Zillikens MC van Herpt TT Sijbrands EJ Hofman A Uitterlinden AG et al . Vitamin D status and metabolic syndrome in the elderly: the Rotterdam Study. Eur J Endocrinol. (2015) 172:327–35. 10.1530/EJE-14-0580
37.
Farkas E de Wilde MC Kiliaan AJ Luiten PG . Chronic cerebral hypoperfusion-related neuropathologic changes and compromised cognitive status: window of treatment. Drugs Today. (2002) 38:365–76. 10.1358/dot.2002.38.5.677137
Summary
Keywords
vitamin D, dementia, meta-analysis, dose-response, cognitive impairment
Citation
Huang Y, Chen Y, Wu Y, Wu Y, Dai X, Feng J and Li X (2025) Association of vitamin D with risk of dementia: a dose-response meta-analysis of observational studies. Front. Neurol. 16:1649841. doi: 10.3389/fneur.2025.1649841
Received
19 June 2025
Accepted
21 August 2025
Published
10 September 2025
Volume
16 - 2025
Edited by
Chiara Villa, University of Milano-Bicocca, Italy
Reviewed by
I Made Dwi Mertha Adnyana, Universitas Jambi, Indonesia
Hamza Islam, Faisalabad Medical University, Pakistan
Updates
Copyright
© 2025 Huang, Chen, Wu, Wu, Dai, Feng and Li.
This is an open-access article distributed under the terms of the Creative Commons Attribution License (CC BY). The use, distribution or reproduction in other forums is permitted, provided the original author(s) and the copyright owner(s) are credited and that the original publication in this journal is cited, in accordance with accepted academic practice. No use, distribution or reproduction is permitted which does not comply with these terms.
*Correspondence: Xia Li xia-li@ldy.edu.rs
Disclaimer
All claims expressed in this article are solely those of the authors and do not necessarily represent those of their affiliated organizations, or those of the publisher, the editors and the reviewers. Any product that may be evaluated in this article or claim that may be made by its manufacturer is not guaranteed or endorsed by the publisher.