Abstract
Background:
The Cholesterol, high-density lipoprotein, and glucose (CHG) index has emerged as a potential indicator of metabolic disturbance, but its prognostic value in patients with ischemic stroke (IS) remains unclear. This study aimed to assess whether the CHG index could predict 28-day in-hospital mortality in critically ill IS patients and to compare its performance with the established triglyceride–glucose (TyG) index.
Methods:
We conducted a cohort analysis using data from the eICU database, involving 1,670 critically ill patients diagnosed with IS between 2014 and 2015. CHG and TyG indices were computed for each patient. Their associations with 28-day in-hospital mortality were examined using multivariable Cox regression. To further investigate the associations, restricted cubic spline (RCS) analysis was conducted. Kaplan–Meier curves were used to compare outcomes across different TyG and CHG groups. Predictive accuracy was compared using receiver operating characteristic (ROC) analysis. Subgroup analyses were performed to assess consistency across different clinical characteristics.
Results:
Among the study population, 158 (9.46%) patients died within 28 days of hospitalization. The CHG index showed a greater association with mortality (HR 1.554; 95% CI 1.198–2.018; p < 0.001) compared to the TyG index (HR 1.436; 95% CI 1.175–1.755; p < 0.001) in unadjusted models, and both remained significant after adjustment. RCS analysis demonstrated a linear relationship between both indices and 28-day in-hospital mortality. ROC curves showed similar discriminatory ability for the CHG and TyG indices. No significant interactions were observed in subgroup analyses (p > 0.05; p for interaction >0.05).
Conclusions:
Higher CHG index values are independently associated with increased 28-day mortality in critically ill IS patients, showing a linear relationship and predictive performance comparable to that of the TyG index.
1 Introduction
Stroke remains one of the leading causes of mortality worldwide, with ischemic stroke (IS) being a primary contributor (1–5). Critically ill IS patients often experience increased short-term mortality (6), making the early identification of prognostic factors crucial for effective clinical management. While individual biomarkers such as blood pressure (7), blood glucose (8), total cholesterol (TC) (9, 10), triglyceride (TG) (11), and C-reactive protein (12, 13) are associated with poor stroke outcomes, a single biomarker may not fully capture the complexity of the disease. Therefore, integrating multiple biomarkers provides a more comprehensive assessment, offering better predictive accuracy for patient prognosis. Therefore, identifying reliable biomarkers to predict mortality risk is essential for improving outcomes in these patients.
The unfavorable prognosis of IS is significantly influenced by insulin resistance (IR) (14–16). The triglyceride–glucose (TyG) index, a surrogate marker of IR, has been widely used in clinical practice (17, 18). Numerous studies have shown that the TyG index is closely associated with poor stroke outcomes, including patient mortality (19, 20). However, recent studies have highlighted a novel biomarker, the cholesterol, high-density lipoprotein, and glucose (CHG) index, which can be used to assess the risk of cardiovascular disease (21). Additionally, the CHG index has shown superior diagnostic efficiency for type 2 diabetes mellitus (DM) compared with the TyG index (22). However, to date, no studies have evaluated the predictive role of the CHG index for IS mortality. Both the TyG and CHG indices are composite biomarkers that integrate lipid and glucose levels and are associated with IR. This study aims to compare the CHG index with the TyG index to assess whether the CHG index can serve as a biomarker for predicting IS mortality and to evaluate its ability to predict IS mortality.
This study is based on the eICU database and aims to contribute to the development of predictive factors for short-term mortality in IS patients. This study will also deepen our understanding of the role of metabolic factors in IS outcomes, address existing gaps in the literature and provide more accurate biomarker references for clinical application.
2 Methods
2.1 Source of data
This study utilized data from the eICU Collaborative Research Database (eICU-CRD, version 2.0), a publicly available, multicenter ICU database developed by the Massachusetts Institute of Technology in collaboration with the eICU Research Institute. The database contains deidentified clinical data from over 200,000 ICU admissions across 208 U.S. hospitals between 2014 and 2015, including demographics, diagnoses, laboratory tests, medications, vital signs, and outcomes. Access was granted following completion of the CITI program and approval of the Data Use Agreement. The author Huang Luwen obtained the necessary authorization to access the dataset. All analyses adhered to HIPAA regulations and the Declaration of Helsinki. The database is available via PhysioNet (https://eicu-crd.mit.edu).
2.2 Study population
A total of 4,079 patients diagnosed with IS were initially identified from the eICU database via the search terms “neurologic,” “disorders of vasculature,” “stroke,” and “ischemic stroke,” where the latter term is a subset of the broader categories mentioned (23). To ensure data quality and analytical validity, the following exclusion criteria were applied: (1) repeated ICU admissions (N = 703); (2) hospital length of stay less than 24 h (N = 143); (3) missing TG data (N = 1,256); (4) missing TC data (N = 23); (5) missing glucose data (N = 280); and (6) missing high-density lipoprotein cholesterol (HDL-C) data (N = 4). After these exclusions were applied, a total of 1,670 patients were included in the study. A detailed flowchart is illustrated in Figure 1.
Figure 1

Flow chart of the study population.
2.3 Exposure and outcome definitions
The exposure variables, TyG and CHG indices, were calculated via the following standard formulas:
The primary outcome was 28-day all-cause in-hospital mortality.
2.4 Assessments of covariates
The variables extracted from the database included the following: sex, age, ethnicity, and body mass index (BMI); mechanical ventilation use and sequential organ failure assessment (SOFA) score; comorbidities including sepsis, chronic obstructive pulmonary disease (COPD), congestive heart failure (CHF), acute myocardial infarction (AMI), DM, pneumonia, and arrhythmia; and laboratory parameters such as glucose, blood urea nitrogen (BUN), serum creatinine, TC, TG, LDL-C, HDL-C, serum potassium, and serum sodium.
2.5 Missing variables
The distribution of variables with missing data is summarized in Supplementary Table S1, with most variables exhibiting a low proportion of missing values. To address this, multiple imputation using chained equations was employed under the assumption of missing data at random. Five imputed datasets were generated, and the results were pooled according to Rubin's rules to account for variability between imputations. This approach allowed for the preservation of the full cohort size and improved the accuracy and robustness of the statistical estimates.
2.6 Statistical analysis
Baseline characteristics are presented as the means ± standard deviations (SDs) or medians with interquartile ranges (IQRs) for continuous variables and as frequencies with percentages for categorical variables. Student's t test and one-way ANOVA were used for normally distributed continuous variables. Categorical variables were analyzed via either Fisher's exact test or the chi-square test and are reported as numbers and percentages.
To assess potential collinearity between the CHG and TyG indices and other covariates, we evaluated the generalized variance inflation factor (GVIF) and adjusted GVIF (Supplementary Tables S2, S3). The proportional hazards assumption was tested for all variables using the Schoenfeld residuals test. The associations between CHG, TyG, and 28-day in-hospital mortality were examined via both univariate and multivariate Cox proportional hazards models. Model 1 was unadjusted; Model 2 was adjusted for age, sex, and ethnicity; and Model 3 was further adjusted for mechanical ventilation use, SOFA score, DM, sepsis, COPD, CHF, AMI, arrhythmia, pneumonia, serum creatinine, BUN, serum potassium, and serum sodium.
Kaplan–Meier survival curves were generated to visualize the cumulative incidence of 28-day in-hospital mortality across different CHG and TyG categories. In addition, restricted cubic spline (RCS) models were used to explore the potential dose–response relationships between CHG, TyG, and 28-day mortality. To compare the predictive performance of CHG and TyG for short-term mortality, receiver operating characteristic (ROC) curve analysis was performed.
To further validate the robustness of our findings, several sensitivity analyses were conducted. First, Cox regression was repeated using a complete-case dataset after all missing values were excluded. Second, the analysis was repeated using multiple imputation to account for missing data. Third, a propensity score-weighted analysis was conducted to evaluate the association between CHG, TyG, and 28-day in-hospital mortality, with both CHG and TyG categorized into three groups: Q1, Q2, and Q3. Various weighting methods, including IPTW, overlap weighting, matching weighting, entropy weighting, and treated weighting, were applied to adjust for potential confounders. Forth, stratified analyses were performed to examine potential effect modifications across subgroups defined by age, sex, ethnicity, DM, arrhythmia, pneumonia, serum creatinine, BUN, serum potassium, and serum sodium.
All analyses were conducted via R software (version 3.3.2, The R Foundation, https://www.R-project.org) and Free Statistics software (version 1.7). A two-tailed p value < 0.05 was considered statistically significant.
3 Results
3.1 Baseline characteristics
The baseline characteristics of the study population (n = 1,670) were analyzed according to tertiles of the triglyceride–glucose index (TyG; Supplementary Table S4) and cholesterol–glucose index (CHG; Supplementary Table S5), defined as Q1, Q2, and Q3. Compared with those in Q1, patients in Q2 and Q3 were younger, had a lower proportion of males, and presented significantly higher BMIs, SOFA scores, and rates of mechanical ventilation (all p < 0.05). Laboratory parameters, including blood glucose, BUN, Scr, TC, TG, and LDL-C, were significantly increased in Q3, whereas HDL-C levels were significantly decreased (all p < 0.001). In addition, the prevalence of DM, pneumonia, and AMI was significantly greater in Q3 than in Q1 (all p < 0.05). The 28-day in-hospital mortality also increased significantly across TyG tertiles (Q1: 5.92%, Q2: 9.53%, and Q3: 12.93%; p < 0.001) and CHG tertiles (Q1: 5.75%, Q2: 9.35%, and Q3: 13.29%; p < 0.001). Compared with survivors, non-survivors had significantly higher SOFA scores, more frequent mechanical ventilation use, and elevated levels of glucose, BUN, and serum creatinine (all p < 0.001; Table 1).
Table 1
| Variables | Total (N = 1,670) | 28-day survivors (N = 1,512) | 28-day non-survivors (N =158) | P value |
|---|---|---|---|---|
| Age, mean (SD), year | 70.69 ± 15.24 | 69.17 ± 13.87 | 65.55 ± 12.72 | < 0.001 |
| Gender (male), n (%) | 276 (49.55) | 267 (48.02) | 258 (46.32) | < 0.001 |
| Ethnicity, n(%) | ||||
| Caucasian | 415 (74.77) | 427 (76.94) | 420 (75.68) | 0.07 |
| African American | 75 (13.51) | 70 (12.61) | 53 (9.55) | |
| Other or unknown | 65 (11.71) | 58 (10.45) | 82 (14.77) | |
| Body mass index, mean (SD), kg/m2 | 26.67 ± 6.49 | 29.00 ± 7.21 | 30.38 ± 6.83 | < 0.001 |
| Mechanical ventilation use, n (%) | 67 (12.16) | 90 (16.36) | 133 (24.05) | < 0.001 |
| SOFA score | 2.00 (1.00, 3.00) | 2.00 (1.00, 3.00) | 2.00 (1.00, 4.00) | 0.034 |
| SEPSIS, n (%) | 2 (0.36) | 4 (0.72) | 9 (1.62) | 0.087 |
| COPD, n (%) | 23 (4.13) | 21 (3.78) | 16 (2.87) | 0.509 |
| CHF, n (%) | 18 (3.23) | 20 (3.6) | 25 (4.49) | 0.527 |
| AMI, n (%) | 4 (0.72) | 12 (2.16) | 22 (3.95) | 0.001 |
| Diabetes mellitus, n (%) | 46 (8.35) | 81 (14.73) | 190 (34.36) | < 0.001 |
| Pneumonia, n (%) | 15 (2.69) | 30 (5.4) | 33 (5.92) | 0.023 |
| Arrhythmia, n (%) | 102 (18.31) | 102 (18.35) | 75 (13.46) | 0.043 |
| Glucose, mean (SD), mg/dl | 106.23 ± 23.43 | 122.43 ± 31.84 | 172.34 ± 74.73 | < 0.001 |
| BUN, median (IQR), mg/dl | 18.17 ± 12.42 | 18.27 ± 10.82 | 21.11 ± 14.51 | < 0.001 |
| Serum creatinine, median (IQR), mg/dl | 0.83 (0.69, 1.05) | 0.90 (0.73, 1.12) | 0.92 (0.76, 1.29) | < 0.001 |
| TC, median (IQR), mg/dl | 145.50 ± 37.49 | 157.59 ± 40.53 | 174.83 ± 53.62 | < 0.001 |
| TG, median (IQR), mg/dl | 68.00 (55.00, 84.00) | 110.00 (91.00, 128.25) | 176.00 (138.00, 238.00) | < 0.001 |
| LDL-C, mean (SD), mg/dl | 81.72 ± 31.88 | 92.08 ± 36.37 | 96.16 ± 44.71 | < 0.001 |
| HDL-C, mean (SD), mg/dl | 50.29 ± 16.27 | 43.18 ± 13.82 | 38.23 ± 13.33 | < 0.001 |
| Serum potassium, mean (SD), mmol/L | 3.96 ± 0.50 | 3.93 ± 0.53 | 3.98 ± 0.57 | 0.261 |
| Serum sodium, mean (SD), mmol/L | 139.00 ± 3.99 | 139.31 ± 3.35 | 138.99 ± 3.84 | 0.278 |
| CHG, mean (SD) | 8.15 ± 0.27 | 8.76 ± 0.16 | 9.59 ± 0.49 | < 0.001 |
| TyG, mean (SD) | 33 (5.92) | 53 (9.53) | 72 (12.93) | < 0.001 |
Baseline characteristics of participants classified by survival.
SOFA, sequential organ failure assessment; DM, diabetes mellitus; COPD, chronic obstructive pulmonary disease; CHF, congestive heart failure; AMI, acute myocardial infarction; BUN, blood urea nitrogen; TC, total cholesterol; TG, triglycerides; LDL-C, low-density lipoprotein cholesterol; HDL-C, high-density lipoprotein cholesterol; CHG, cholesterol, high-density lipoprotein, and glucose index; TyG, triglyceride–glucose; SD, standard deviation; IQR, interquartile range.
3.2 Associations of CHG and TyG with 28-day in-hospital mortality
According to the univariate Cox regression analysis, both the CHG and TyG indices were significantly associated with 28-day in-hospital mortality (Supplementary Table S6). The proportional hazards assumption was tested using the Schoenfeld residuals test, and all variables had p-values greater than 0.05. Compared with those in the lowest CHG group (Q1), patients in Q3 presented a significantly increased risk of death (HR = 1.707, 95% CI: 1.125–2.592, p = 0.012). Similarly, individuals in the highest TyG group (Q3) had a greater mortality risk relative than those in Q1 did (HR = 1.832, 95% CI: 1.212–2.770, p = 0.004). These associations remained robust after adjusting for potential confounding factors (Table 2). In the fully adjusted model (Model 3), CHG as a continuous variable remained independently associated with 28-day mortality (HR = 1.601, 95% CI: 1.184–2.164, p = 0.002), and Q3 maintained statistical significance (HR = 1.758, 95% CI: 1.120–2.759, p = 0.014). Similarly, the TyG index as a continuous variable was independently associated with 28-day mortality in the fully adjusted model (HR = 1.433, 95% CI: 1.118–1.836, p = 0.005), although the association for the highest TyG quartile (Q3) did not reach statistical significance (p = 0.054). These findings suggest a more robust and consistent association for the CHG index in predicting short-term mortality than the TyG index does.
Table 2
| Categories | Event, (n %) | Model 1 | Model 2 | Model 3 | |||
|---|---|---|---|---|---|---|---|
| HR (95% CI) | P value | HR (95% CI) | P value | HR (95% CI) | P value | ||
| CHG index | |||||||
| Continuous | 158 (9.5) | 1.554 (1.198–2.018) | < 0.001 | 1.778 (1.351–2.34) | < 0.001 | 1.601 (1.184–2.164) | 0.002 |
| Quartile | |||||||
| Q1 | 32 (5.7) | 1(Ref) | 1(Ref) | 1(Ref) | |||
| Q2 | 52 (9.4) | 1.446 (0.93–2.247) | 0.101 | 1.513 (0.971–2.357) | 0.067 | 1.425 (0.901–2.253) | 0.130 |
| Q3 | 74 (13.3) | 1.707 (1.125–2.592) | 0.012 | 1.938 (1.266–2.967) | 0.002 | 1.758 (1.12–2.759) | 0.014 |
| P for trend | 0.013 | 0.002 | 0.014 | ||||
| TyG index | |||||||
| Continuous | 158 (9.5) | 1.436 (1.175–1.755) | < 0.001 | 1.648 (1.328–2.047) | < 0.001 | 1.433 (1.118–1.836) | 0.005 |
| Quartile | |||||||
| Q1 | 33 (5.9) | 1(Ref) | 1(Ref) | 1(Ref) | |||
| Q2 | 53 (9.5) | 1.49 (0.964–2.302) | 0.072 | 1.536 (0.993–2.375) | 0.054 | 1.469 (0.942–2.291) | 0.090 |
| Q3 | 72 (12.9) | 1.832 (1.212–2.77) | 0.004 | 2.111 (1.382–3.225) | < 0.001 | 1.564 (0.993–2.465) | 0.054 |
| P for trend | 0.004 | < 0.001 | 0.063 | ||||
Cox regression models for the association between the CHG index, TyG index, and 28-day in-hospital mortality.
Model 1: unadjusted.
Model 2: adjusted for age, gender, and ethnicity.
Model 3: adjusted for Model 2 plus, ventilation status, SOFA score, diabetes, sepsis, COPD, CHF, AMI, arrhythmia, pneumonia, serum creatinine, BUN, serum potassium, and sodium levels.
CHG, cholesterol, high-density lipoprotein, and glucose index; TyG, triglyceride–glucose.
Kaplan–Meier survival analysis revealed that the both CHG and TyG indices were significantly associated with 28-day survival outcomes (Figures 2A, B). Patients in Q3 of CHG and TyG presented significantly lower survival probabilities than those in the Q1 did, as shown by the log-rank test (p = 0.04 and p = 0.015, respectively).
Figure 2

Kaplan–Meier survival curves for 28-day in-hospital mortality by CHG (A) and TyG (B). CHG, cholesterol, high-density lipoprotein, and glucose index; TyG, triglyceride–glucose.
3.3 Dose–response associations between CHG/TyG and 28-day in-hospital mortality
RCS regression was performed to explore the dose–response relationships between the CHG and TyG indices and 28-day in-hospital mortality (Figures 3A, B). Both CHG (p for overall = 0.023) and TyG (p for overall = 0.044) were significantly associated with increased risk of mortality. No evidence of non-linear was observed (p for non-linear = 0.911 for CHG; p for non-linear = 0.763 for TyG), indicating that the relationships between these indices and mortality risk are linear.
Figure 3

Restricted cubic spline models analyzed the relationship between CHG (A) and TyG (B), and 28-day hospital mortality. Adjusted for age, gender, ethnicity, ventilation status, SOFA score, diabetes, sepsis, COPD, CHF, AMI, arrhythmia, pneumonia, serum creatinine, BUN, serum potassium, and sodium levels. CHG, cholesterol, high-density lipoprotein, and glucose index; TyG, triglyceride–glucose.
3.4 Comparison of CHG and TyG for 28-day in-hospital mortality discrimination
ROC analysis was conducted to evaluate the ability of the CHG and TyG indices to predict 28-day hospital mortality (Figure 4). The CHG index demonstrated an area under the curve (AUC) of 0.617 (95% CI: 0.570–0.665), which was slightly greater than that of the TyG index (AUC = 0.610; 95% CI: 0.564–0.656), indicating that both indices have comparable predictive abilities for short-term mortality risk.
Figure 4
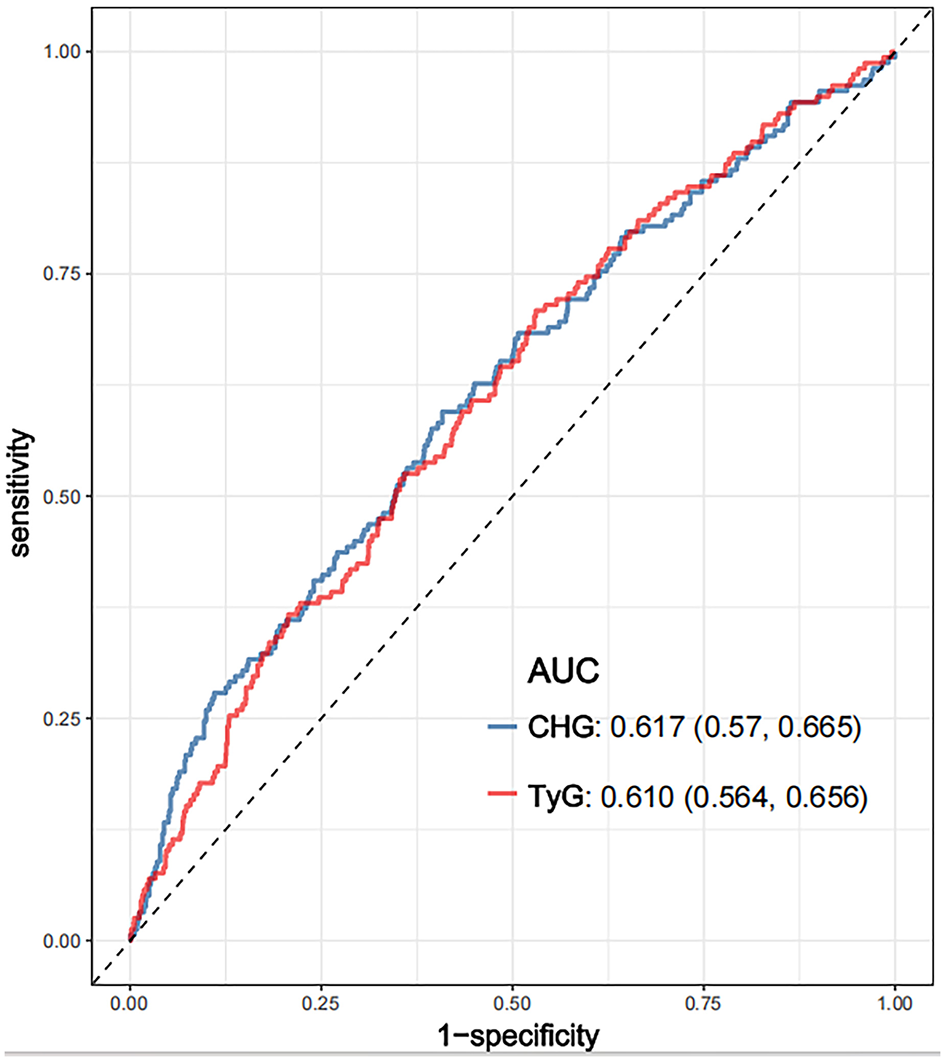
ROC curves compared the predictive efficacy of the CHG and TyG for 28-day hospital mortality. CHG: cholesterol, high-density lipoprotein, and glucose index; TyG, triglyceride–glucose; ROC, receiver operating characteristic.
3.5 Subgroup analysis of the CHG and TyG indices
As illustrated in Figures 5, 6, no significant interactions were observed between CHG or TyG indices and clinical subgroups, including age, sex, mechanical ventilation status, serum creatinine, BUN, or the presence of pneumonia (all p for interaction >0.05). These findings suggest that the associations of both the CHG and TyG indices with 28-day in-hospital mortality were consistent across different baseline characteristics and were not significantly modified by stratifying variables.
Figure 5

Subgroup analysis of CHG in predicting 28-day hospital mortality. Adjusted for age, gender, ethnicity, ventilation status, SOFA score, diabetes, sepsis, COPD, CHF, AMI, arrhythmia, pneumonia, serum creatinine, BUN, serum potassium, and sodium levels. CHG: cholesterol, high-density lipoprotein, and glucose index.
Figure 6

Subgroup analysis of TyG in predicting 28-day hospital mortality. Adjusted for age, gender, ethnicity, ventilation status, SOFA score, diabetes, sepsis, COPD, CHF, AMI, arrhythmia, pneumonia, serum creatinine, BUN, serum potassium, and sodium levels. TyG, triglyceride–glucose.
3.6 Sensitivity analyses
To assess the robustness of the findings, several sensitivity analyses were performed. First, a complete-case analysis excluding individuals with missing data demonstrated that the CHG index remained significantly associated with 28-day in-hospital mortality, both as a continuous variable (HR = 1.601, 95% CI: 1.184–2.164, p = 0.002) and in Q3 (Q3 vs. Q1: HR = 1.758, 95% CI: 1.120–2.759, p = 0.014; Supplementary Table S7). The TyG index also showed a significant association in the continuous model (HR = 1.433, 95% CI: 1.118–1.836, p = 0.005) but not in the categorical model (Q3 vs. Q1: p = 0.090). Second, multiple imputation yielded consistent results (Supplementary Table S8). CHG remained strongly associated with mortality in both the continuous (HR = 1.559, 95% CI: 1.156–2.104, p = 0.004) and categorical models (Q3 vs. Q1: HR = 1.728, 95% CI: 1.102–2.710, p = 0.017). TyG also remained a significant as a continuous variable (p = 0.007), whereas its categorical association with Q3 remained non-significant (p = 0.058). Third, in the propensity score-weighted analysis, the three-group classification of CHG demonstrated a significant association with 28-day in-hospital mortality (Figure 7A). Regardless of the weighting method used (IPTW, overlap weighting, matching weighting, entropy weighting, or treated weighting), both the Q3 groups were significantly associated with an increased risk of mortality. However, the relationship between TyG and 28-day in-hospital mortality was not stable (Figure 7B). Forth, E-value analysis revealed that an unmeasured confounder would need to be associated with both the exposure and outcome with a risk ratio of at least 2.91 for CHG and 2.50 for TyG to fully account for the observed associations, indicating moderate robustness to potential unmeasured confounding (Supplementary Figure S1).
Figure 7

Multi-group propensity score weighting analysis of the relationship between CHG (A) and TyG (B), and 28-day hospital mortality. Adjusted for age, gender, ethnicity, ventilation status, SOFA score, diabetes, sepsis, COPD, CHF, AMI, arrhythmia, pneumonia, serum creatinine, BUN, serum potassium, and sodium levels. CHG, cholesterol, high-density lipoprotein, and glucose index; TyG, triglyceride–glucose.
4 Discussion
This study, which is based on the eICU multicenter critical care database, is the first to examine the predictive value of the CHG index for 28-day in-hospital mortality in critically ill IS patients and to compare it with the established TyG index. These findings indicate that, after extensive adjustment for various confounding factors, both indices are significantly associated with an increased risk of 28-day in-hospital mortality. RCS analysis further demonstrated a positive linear relationship with 28-day in-hospital mortality. Notably, the CHG index demonstrated a higher HR than the TyG index did, and ROC analysis further revealed that the CHG index had a stronger ability to predict 28-day in-hospital mortality than did the TyG index.
The TyG index, a well-established marker for IR, has been associated with adverse outcomes in stroke patients (24, 25). Elevated TyG is associated with unfavorable functional outcomes and an increased risk of recurrent stroke (26, 27). Studies using the MIMIC-IV and eICU databases have shown a significant correlation between elevated TyG levels and mortality following both ischemic and hemorrhagic stroke (28, 29), supporting its role as a prognostic tool. Additionally, TyG-derived indices, such as TyG-BMI (30) and TyG-WC (31), are strongly associated with mortality after stroke. However, the study by Bukke et al. revealed no significant associations between TyG and IS recurrence or mortality (32), likely because of the a small sample size. Despite this, most studies suggest a positive relationship between the TyG index and mortality in IS patients.
This study is the first to explore the association between the CHG index and 28-day in-hospital mortality in critically ill IS patients and to compare it with the TyG index. In our study, ROC curve analysis suggested that CHG and TyG have similar predictive power for short-term mortality. However, after adjusting for confounding factors, the CHG index had a greater HR and more stable p-values than the TyG index did. This may indicate that, while their predictive power is similar, the CHG index offers a more sensitive measure, potentially owing to its more comprehensive evaluation of metabolic dimensions, which encompass a broader range of factors than TyG. As a novel biomarker introduced in 2024, the CHG index innovatively integrates three key metabolic parameters—TC, HDL-C, and glucose—enabling a comprehensive assessment of both metabolic function and vascular health (22). Specifically, elevated LDL-C levels increase the risk of IS mortality by promoting plaque formation, exacerbating vascular obstruction, and reducing brain tissue perfusion (33–35). In contrast, HDL-C exerts a protective effect by inhibiting cholesterol deposition and delaying the progression of atherosclerosis, thus reducing stroke-related mortality (36). In comparison, while the TyG index effectively reflects IR, its lack of consideration for critical vascular risk factors such as TC limits its predictive value for stroke outcomes.
From a pathophysiological perspective, the TyG index and CHG index influence stroke prognosis through different molecular pathways. The TyG index primarily reflects metabolic disorders associated with insulin resistance (37), including high blood glucose and elevated TG, which indirectly worsen cerebral blood flow dynamics by promoting atherosclerosis, damaging endothelial function, and increasing vascular stiffness, ultimately increasing stroke risk (38–41). In contrast, the CHG index, which integrates TC and glucose, provides a more comprehensive metabolic-vascular health evaluation system. Notably, large-scale epidemiological studies (n = 9,704) have confirmed that the CHG index outperforms the TyG index in the diagnosis of type 2 diabetes (22), indicating its prominent value in metabolic disease risk assessment. Moreover, Degang et al. demonstrated that the CHG index has a relatively high HR for cardiovascular disease risk stratification, further validating its clinical potential as a comprehensive predictive tool (21). Although these studies differ in terms of endpoints from the current study, they collectively reinforce the superior predictive value of the CHG index for metabolic-related diseases, providing a solid theoretical foundation for the conclusions of this study.
This study is the first to reveal a significant positive correlation between the CHG index and short-term mortality risk in critically ill IS patients while also comparing it to the widely recognized TyG index. Additionally, the study employed various statistical methods, including Cox regression, RCS, ROC curve, subgroup analysis, and multiple imputation, to develop a comprehensive assessment model. This multifaceted approach not only enhanced the diversity of the analysis but also strengthened the reliability and depth of the findings. Furthermore, the use of a large-scale cohort study based on the eICU database effectively minimized selection bias and ensured the representativeness of the sample. Finally, this study provides a new reference for clinicians assessing the risk of critically ill IS patients, facilitating personalized management and enabling targeted interventions for a broader population.
However, there are several limitations in this study. First, it relies on data from the eICU database, which, although representative, does not capture the characteristics of populations from other countries, limiting its external validity. Second, the lack of stroke subtype information in the database limits the ability to analyze and compare the predictive value of the two indices for different IS types. Third, although the study accounted for multiple confounding factors, it still lacked several important variables, such as the National Institutes of Health Stroke Scale score, hypertension, cause of death, and interventions including intravenous thrombolysis, thrombectomy, or pharmacological treatments. These limitations may impact the comprehensiveness of the results. In the future, we plan to collect more comprehensive data to facilitate further analysis. Fourth, the absence of long-term follow-up data restricts ability of these indices to predict long-term mortality risk in critically ill IS patients. Therefore, future research should conduct multicenter, large-sample, and long-term studies across diverse populations and various stroke subtypes to further explore the prognostic value of these two indices.
5 Conclusion
An elevated CHG index is significantly associated with increased 28-day in-hospital mortality in critically ill IS patients, indicating a linear relationship. CHG also demonstrates predictive performance similar to that of the TyG index in assessing mortality risk. However, its broader evaluation of metabolic factors may make it a superior marker. Integrating CHG into clinical practice could enhance decision-making and aid in the early identification of high-risk patients in critical care settings.
Statements
Data availability statement
The datasets presented in this study can be found in online repositories. The names of the repository/repositories and accession number(s) can be found below: the data utilized in this study were obtained from the eICU Collaborative Research Database, which is publicly available via PhysioNet (https://eicu-crd.mit.edu) following the completion of a data use agreement.
Ethics statement
Ethical review and approval was not required for the study on human participants in accordance with the local legislation and institutional requirements. Written informed consent from the patients/participants or patients/participants' legal guardian/next of kin was not required to participate in this study in accordance with the national legislation and the institutional requirements.
Author contributions
HL: Conceptualization, Data curation, Formal analysis, Methodology, Writing – original draft. LL: Conceptualization, Formal analysis, Investigation, Writing – original draft. YM: Formal analysis, Methodology, Supervision, Writing – review & editing. XL: Conceptualization, Formal analysis, Methodology, Supervision, Writing – review & editing.
Funding
The author(s) declare that no financial support was received for the research and/or publication of this article.
Acknowledgments
This study utilized data from the eICU Collaborative Research Database, which was developed through a collaboration between Philips Healthcare and the MIT Laboratory for Computational Physiology. We acknowledge and thank these institutions for their efforts in creating and maintaining this valuable resource.
Conflict of interest
The authors declare that the research was conducted in the absence of any commercial or financial relationships that could be construed as a potential conflict of interest.
Generative AI statement
The author(s) declare that no Gen AI was used in the creation of this manuscript.
Any alternative text (alt text) provided alongside figures in this article has been generated by Frontiers with the support of artificial intelligence and reasonable efforts have been made to ensure accuracy, including review by the authors wherever possible. If you identify any issues, please contact us.
Publisher’s note
All claims expressed in this article are solely those of the authors and do not necessarily represent those of their affiliated organizations, or those of the publisher, the editors and the reviewers. Any product that may be evaluated in this article, or claim that may be made by its manufacturer, is not guaranteed or endorsed by the publisher.
Supplementary material
The Supplementary Material for this article can be found online at: https://www.frontiersin.org/articles/10.3389/fneur.2025.1664891/full#supplementary-material
References
1.
GBD 2016 Stroke Collaborators . Global, regional, and national burden of stroke, 1990-2016: a systematic analysis for the Global Burden of Disease Study 2016. Lancet Neurol. (2019) 18:439–58. 10.1016/S1474-4422(19)30034-1
2.
eClinicalMedicine . The rising global burden of stroke. EClinicalMedicine. (2023) 59:102028. 10.1016/j.eclinm.2023.102028
3.
GBD 2016 Neurology Collaborators . Global, regional, and national burden of neurological disorders, 1990-2016: a systematic analysis for the Global Burden of Disease Study 2016. Lancet Neurol. (2019) 18:459–80. 10.1016/S1474-4422(18)30499-X
4.
Fatahzadeh M Glick M . Stroke: epidemiology, classification, risk factors, complications, diagnosis, prevention, and medical and dental management. Oral Surg Oral Med Oral Pathol Oral Radiol Endod. (2006) 102:180–91. 10.1016/j.tripleo.2005.07.031
5.
Ding Q Liu S Yao Y Liu H Cai T Han L . Global, regional, and national burden of ischemic stroke, 1990-2019. Neurology. (2022) 98:e279–90. 10.1212/WNL.0000000000013115
6.
GBD 2021 Causes of Death Collaborators . Global burden of 288 causes of death and life expectancy decomposition in 204 countries and territories and 811 subnational locations, 1990-2021: a systematic analysis for the Global Burden of Disease Study 2021. Lancet. (2024) 403:2100–32. 10.1016/S0140-6736(24)00367-2
7.
Shin JA Lee KJ Lee JS Kang J Kim BJ Han MK et al . Relationship between blood pressure and outcome changes over time in acute ischemic stroke. Neurology. (2020) 95:e1362–71. 10.1212/WNL.0000000000010203
8.
Yoon JA Shin YI Kim DY Sohn MK Lee J Lee SG et al . Post-stroke hyperglycemia in non-diabetic ischemic stroke is related with worse functional outcome: a cohort study. Ann Rehabil Med. (2021) 45:359–67. 10.5535/arm.21124
9.
Kitagawa K Hosomi N Nagai Y Kagimura T Ohtsuki T Maruyama H et al . Cumulative effects of LDL cholesterol and CRP levels on recurrent stroke and TIA. J Atheroscler Thromb. (2019) 26:432–41. 10.5551/jat.45989
10.
Shridharan P Nair R Gorthi SP Prakashini K Chatterjee A . Effects of serum cholesterol on severity of stroke and dosage of statins on functional outcome in acute ischemic stroke. Neurol India. (2023) 71:923–7. 10.4103/0028-3886.388115
11.
Akhtar N Singh R Kamran S Joseph S Morgan D Uy RT et al . Association between serum triglycerides and stroke type, severity, and prognosis. Analysis in 6558 patients. BMC Neurol. (2024) 24:88. 10.1186/s12883-024-03572-9
12.
Liu F Yang P Wang Y Shi M Wang R Xu Q et al . HS-CRP modifies the prognostic value of platelet count for clinical outcomes after ischemic stroke. J Am Heart Assoc. (2023) 12:e030007. 10.1161/JAHA.123.030007
13.
Munir M Bashir H Qamar M . Correlation of C-reactive protein with stroke severity in patients with acute ischemic cerebrovascular stroke. Tpmj. (2021) 28:306–10. 10.29309/TPMJ/2021.28.03.5374
14.
Jin A Wang S Li J Wang M Lin J Li H et al . Mediation of systemic inflammation on insulin resistance and prognosis of nondiabetic patients with ischemic stroke. Stroke. (2023) 54:759–69. 10.1161/STROKEAHA.122.039542
15.
Jing J Pan Y Zhao X Zheng H Jia Q Mi D et al . Insulin resistance and prognosis of nondiabetic patients with ischemic stroke: the ACROSS-China Study (Abnormal glucose regulation in patients with acute stroke across China). Stroke. (2017) 48:887–93. 10.1161/STROKEAHA.116.015613
16.
Pan Y Jing J Chen W Zheng H Jia Q Mi D et al . Post-glucose load measures of insulin resistance and prognosis of nondiabetic patients with ischemic stroke. J Am Heart Assoc. (2017) 6:e004990. 10.1161/JAHA.116.004990
17.
Ozturk D Sivaslioglu A Bulus H Ozturk B . TyG index is positively associated with HOMA-IR in cholelithiasis patients with insulin resistance: based on a retrospective observational study. Asian J Surg. (2024) 47:2579–83. 10.1016/j.asjsur.2024.03.004
18.
Khan SH Sobia F Niazi NK Manzoor SM Fazal N Ahmad F . Metabolic clustering of risk factors: evaluation of Triglyceride-glucose index (TyG index) for evaluation of insulin resistance. Diabetol Metab Syndr. (2018) 10:74. 10.1186/s13098-018-0376-8
19.
Liu R Li L Wang L Zhang S . Triglyceride-glucose index predicts death in patients with stroke younger than 65. Front Neurol. (2023) 14:1198487. 10.3389/fneur.2023.1198487
20.
Sun Y Deng W Luo L Chen M . Effect of insulin resistance on prognosis of intravenous thrombolysis in acute ischemic stroke patients with or without type 2 diabetes mellitus. Diabetes Metab Syndr Obes. (2025) 18:1299–309. 10.2147/DMSO.S513652
21.
Mo D Zhang P Zhang M Dai H Guan J . Cholesterol, high-density lipoprotein, and glucose index versus triglyceride-glucose index in predicting cardiovascular disease risk: a cohort study. Cardiovasc Diabetol. (2025) 24:116. 10.1186/s12933-025-02675-y
22.
Mansoori A Nosrati M Dorchin M Mohammadyari F Derakhshan-Nezhad E Ferns G et al . A novel index for diagnosis of type 2 diabetes mellitus: cholesterol, High density lipoprotein, and Glucose (CHG) index. J Diabetes Investig. (2025) 16:309–14. 10.1111/jdi.14343
23.
Pollard TJ Johnson AEW Raffa JD Celi LA Mark RG Badawi O . The eICU Collaborative research database, a freely available multi-center database for critical care research. Sci Data. (2018) 5:180178. 10.1038/sdata.2018.178
24.
Vasques AC Novaes FS de Oliveira Mda S Souza JR Yamanaka A Pareja JC et al . TyG index performs better than HOMA in a Brazilian population: a hyperglycemic clamp validated study. Diabetes Res Clin Pract. (2011) 93:e98–100. 10.1016/j.diabres.2011.05.030
25.
Minh HV Tien HA Sinh CT Thang DC Chen CH Tay JC et al . Assessment of preferred methods to measure insulin resistance in Asian patients with hypertension. J Clin Hypertens. (2021) 23:529–37. 10.1111/jch.14155
26.
Miao M Bi Y Hao L Bao A Sun Y Du H et al . Triglyceride-glucose index and short-term functional outcome and in-hospital mortality in patients with ischemic stroke. Nutr Metab Cardiovasc Dis. (2023) 33:399–407. 10.1016/j.numecd.2022.11.004
27.
Guo W Liu Z Liu P Lu Q Chang Q Zhang M et al . Association between triglyceride-glucose index and 1-year recurrent stroke after acute ischemic stroke: results from the Xi'an Stroke Registry Study of China. Cerebrovasc Dis. (2024) 53:391–402. 10.1159/000534240
28.
Huang Y Li Z Yin X . Triglyceride-glucose index: a novel evaluation tool for all-cause mortality in critically ill hemorrhagic stroke patients-a retrospective analysis of the MIMIC-IV database. Cardiovasc Diabetol. (2024) 23:100. 10.1186/s12933-024-02193-3
29.
Chen Y Yang Z Liu Y Li Y Zhong Z McDowell G et al . Exploring the prognostic impact of triglyceride-glucose index in critically ill patients with first-ever stroke: insights from traditional methods and machine learning-based mortality prediction. Cardiovasc Diabetol. (2024) 23:443. 10.1186/s12933-024-02538-y
30.
Ouyang Q Xu L Yu M . Associations of triglyceride glucose-body mass index with short-term mortality in critically ill patients with ischemic stroke. Cardiovasc Diabetol. (2025) 24:91. 10.1186/s12933-025-02583-1
31.
Rabiee Rad M Ghasempour Dabaghi G Sadri H Darouei B Amani-Beni R Mazaheri-Tehrani S . Triglyceride glucose-waist circumference as a predictor of mortality and subtypes of cardiovascular disease: a systematic review and meta-analysis. Diabetol Metab Syndr. (2025) 17:59. 10.1186/s13098-025-01616-9
32.
Bukke SPN Pathange BBR Nelluri KDD Yadesa TM Kamepalli S Suvarna K et al . Association of triglyceride glucose index with clinical outcomes in ischemic stroke: a retrospective study. BMC Neurol. (2024) 24:371. 10.1186/s12883-024-03873-z
33.
Zeljkovic A Vekic J Spasojevic-Kalimanovska V Jelic-Ivanovic Z Bogavac-Stanojevic N Gulan B et al . LDL and HDL subclasses in acute ischemic stroke: prediction of risk and short-term mortality. Atherosclerosis. (2010) 210:548–54. 10.1016/j.atherosclerosis.2009.11.040
34.
Guo X Guo Y Wang Z Cao B Zheng C Zeng Z et al . Reducing the damage of Ox-LDL/LOX-1 pathway to vascular endothelial barrier can inhibit atherosclerosis. Oxid Med Cell Longev. (2022) 2022:7541411. 10.1155/2022/7541411
35.
Guo J Du L . An update on ox-LDL-inducing vascular smooth muscle cell-derived foam cells in atherosclerosis. Front Cell Dev Biol. (2024) 12:1481505. 10.3389/fcell.2024.1481505
36.
Watanabe J Kakehi E Kotani K Kayaba K Nakamura Y Ishikawa S . Isolated low levels of high-density lipoprotein cholesterol and stroke incidence: JMS Cohort Study. J Clin Lab Anal. (2020) 34:e23087. 10.1002/jcla.23087
37.
Simental-Mendía LE Rodríguez-Morán M Guerrero-Romero F . The product of fasting glucose and triglycerides as surrogate for identifying insulin resistance in apparently healthy subjects. Metab Syndr Relat Disord. (2008) 6:299–304. 10.1089/met.2008.0034
38.
Rong N Li ZW Yuan J Shao ZM Deng Y Zhu DS et al . The role of platelet distribution width in the association between blood glucose and neurological impairment severity in acute ischemic stroke: a moderated mediation model. J Inflamm Res. (2024) 17:6039–50. 10.2147/JIR.S471841
39.
Wu Z Wang J Li Z Han Z Miao X Liu X et al . Triglyceride glucose index and carotid atherosclerosis incidence in the Chinese population: a prospective cohort study. Nutr Metab Cardiovasc Dis. (2021) 31:2042–50. 10.1016/j.numecd.2021.03.027
40.
Baydar O Kilic A Okcuoglu J Apaydin Z Can MM . The triglyceride-glucose index, a predictor of insulin resistance, is associated with subclinical atherosclerosis. Angiology. (2021) 72:994–1000. 10.1177/00033197211007719
41.
Demirci I Haymana C Candemir B Yuksel B Eser M Meric C et al . Triglyceride-glucose index levels in patients with Klinefelter syndrome and its relationship with endothelial dysfunction and insulin resistance: a cross-sectional observational study. Arch Endocrinol Metab. (2023) 67:378–84. 10.20945/2359-3997000000594
Summary
Keywords
ischemic stroke, cholesterol–high-density lipoprotein–glucose index, triglyceride–glucose index, mortality, eICU
Citation
Luwen H, Linlin L, Ming Y and Lei X (2025) A comparative analysis of the cholesterol–high-density lipoprotein–glucose index and the triglyceride–glucose index in predicting in-hospital mortality in critically ill ischemic stroke patients. Front. Neurol. 16:1664891. doi: 10.3389/fneur.2025.1664891
Received
13 July 2025
Accepted
09 October 2025
Published
22 October 2025
Volume
16 - 2025
Edited by
Giuseppe Castaldo, University of Naples Federico II, Italy
Reviewed by
Omer Iqbal, Loyola University Chicago, United States
Yong'An Jiang, Jiangxi Provincial People's Hospital (The First Affiliated Hospital of Nanchang Medical College), China
Updates
Copyright
© 2025 Luwen, Linlin, Ming and Lei.
This is an open-access article distributed under the terms of the Creative Commons Attribution License (CC BY). The use, distribution or reproduction in other forums is permitted, provided the original author(s) and the copyright owner(s) are credited and that the original publication in this journal is cited, in accordance with accepted academic practice. No use, distribution or reproduction is permitted which does not comply with these terms.
*Correspondence: Yu Ming yuming609800@163.comXu Lei xulei@sns120.cn
†These authors have contributed equally to this work
Disclaimer
All claims expressed in this article are solely those of the authors and do not necessarily represent those of their affiliated organizations, or those of the publisher, the editors and the reviewers. Any product that may be evaluated in this article or claim that may be made by its manufacturer is not guaranteed or endorsed by the publisher.