Abstract
Objective:
Core cerebrospinal fluid (CSF) biomarkers serve as pivotal diagnostic indicators for Alzheimer’s disease, yet their diagnostic efficacy varies substantially across different markers. This study employs a Bayesian meta-analytic approach to comprehensively evaluate the diagnostic accuracy of individual core CSF biomarkers for Alzheimer’s disease (AD).
Methods:
A comprehensive literature search was conducted in Web of Science, PubMed, and other databases for English-language studies published between January 2013 and April 2025. Following predefined inclusion/exclusion criteria, eligible studies were selected for methodological quality assessment using standardized tools. Data extraction was subsequently performed, and statistical analyses were conducted using Meta-DiSc 1.4, Stata 15.1, and R 4.3.2 software packages.
Results:
This meta-analysis systematically evaluated the diagnostic value of eight core CSF biomarkers for AD, incorporating 23 eligible studies (2,187 AD cases and 2,019 non-AD). Key findings revealed: (1) Among individual biomarkers, p-tau217 demonstrated superior diagnostic performance, with sensitivity of 0.95 (95% CI: 0.92–0.97), specificity of 0.94 (95% CI: 0.88–0.98), area under the curve (AUC) of 0.99 (95% CI: 0.97–1.00), and an exceptionally high diagnostic odds ratio (DOR) of 395.28 (95% CI: 92.17–1,305.79), all parameters being significantly better than other biomarkers (p < 0.001). Both p-tau231 (AUC = 0.97) and p-tau181 (AUC = 0.90) also exhibited commendable diagnostic accuracy. (2) For biomarker ratios, the Aβ42/p-tau181 ratio showed optimal overall diagnostic efficacy, with sensitivity of 0.90 (95% CI: 0.86–0.94) and AUC of 0.93 (95% CI: 0.90–0.96), significantly outperforming other ratio combinations (p < 0.05).
Conclusion:
This study demonstrates that among core CSF biomarkers for AD, p-tau217 exhibits the most outstanding diagnostic performance as a standalone biomarker, while the Aβ42/p-tau181 ratio shows superior diagnostic efficacy among biomarker combinations. Based on current evidence-based medical data, we recommend the combined use of p-tau217 and Aβ42/p-tau181 ratio as first-line core CSF biomarker panel for AD diagnosis, providing reliable laboratory evidence for early screening and differential diagnosis of AD in clinical practice.
1 Introduction
Alzheimer’s disease (AD) is a progressively developing neurodegenerative disorder (1, 2), for 60 to 80% of all cases of cognitive impairment (3). With the continued progression of global population aging, it is projected that the number of individuals diagnosed with dementia worldwide will increase significantly, reaching an estimated 152 million by the year 2050 (4–6). Although the currently available drugs for treating AD exhibit some efficacy in delaying disease progression, their capacity to provide a complete cure remains limited (7). Consequently, researchers are placing greater emphasis on exploring innovative strategies for the prevention and diagnosis of AD by focusing on risk factors and early diagnostic methods.
The pathological features of AD encompass the abnormal accumulation of extracellular β-amyloid protein (Aβ), the formation of intracellular neurofibrillary tangles composed of phosphorylated tau protein (p-tau181), and the resultant neuronal loss (8, 9). In recent years, the detection of biomarkers in CSF, such as amyloid PET, the ratio of Aβ42 to Aβ40 (Aβ42/Aβ40), the ratio of Aβ42 to p-tau181 (Aβ42/p-tau181), and the ratio of Aβ42 to total tau (Aβ42/t-tau), has played a key role in the initial diagnosis of AD (10). Furthermore, other biomarkers, including phosphorylated tau (p-tau), total tau (t-tau), RBKS, PDGFC, NUCB2, TNFSF14, CASP3, and SQSTM1/p62, are also considered potential supplements or substitutes for biomarkers in the diagnostic composite reference criteria (10–12). Although several studies have reported the potential of these biomarkers in predicting the progression of AD, enabling the identification of patients at an early stage, monitoring the disease process, and evaluating drug efficacy, there is currently a lack of systematic evaluation and diagnostic meta-analysis comparing different biomarkers suitable for the differential diagnosis of AD. Previous reviews have either focused on a single biomarker or neglected to conduct comparative analyses of cerebrospinal fluid samples under real-life conditions or in professional care settings, thereby failing to evaluate their diagnostic accuracy for AD (13, 14).
This study employed the Bayesian meta-analysis method to systematically evaluate the diagnostic accuracy of core CSF for AD. This approach effectively accommodates the challenges posed by small sample sizes and complex data by allowing for flexible prior distribution settings, thereby significantly enhancing the model’s estimation accuracy. This research not only provides an in-depth analysis of the diagnostic mechanisms of biomarkers but also accurately identifies the potential factors influencing their efficacy. Furthermore, it offers a theoretical basis and practical value for enhancing the diagnostic accuracy of AD and guiding clinical practice.
2 Methods
2.1 Search strategy
This investigation was prospectively registered on the PROSPERO international prospective register of systematic reviews (Registration No. CRD420251021602), with strict adherence to the Preferred Reporting Items for Systematic Reviews and Meta-Analyses (PRISMA) guidelines. A comprehensive electronic literature search was conducted in the Web of Science Core Collection and PubMed/MEDLINE databases, encompassing studies published between January 2013 and April 2025. The search strategy employed a structured Boolean query combining Medical Subject Headings (MeSH) terms and free-text keywords with the following syntax: (“Biomarker” OR “Diagnostic Test” OR “Alzheimer’s disease” [MeSH] OR “Cerebrospinal Fluid” [MeSH] OR “Aβ42” OR “p-tau181” OR “p-tau217” OR “p-tau231” OR “p-tau205” OR “t-tau”).
2.2 Inclusion and exclusion criteria
Studies were selected for inclusion in this meta-analysis based on the following rigorous criteria: (1) original diagnostic accuracy studies evaluating the performance of core CSF biomarkers in differentiating AD from other neurological disorders in clinical settings; (2) application of validated diagnostic criteria for both AD and non-AD control groups including mild cognitive impairment (MCI), Lewy body dementia, Parkinson’s disease dementia, and other neurodegenerative conditions; (3) comprehensive reporting of sample characteristics, analytical methods, reference standards, and sufficient data to construct complete diagnostic contingency tables, with clearly defined cutoff values derived either from established clinical thresholds or training datasets; (4) no restrictions on publication date, language, patient demographics, or reference standards to ensure global representation of evidence; and (5) primary focus on core CSF AD pathological markers including amyloid-β isoforms (e.g., Aβ42), tau protein (e.g., t-tau and p-tau species), and their clinically validated ratios (e.g., Aβ42/Aβ40, Aβ42/p-tau181).
Studies were systematically excluded from this meta-analysis based on the following predefined criteria: (1) investigations employing exclusively peripheral blood biomarkers or neuroimaging modalities without concurrent CSF biomarker analysis; (2) studies utilizing healthy controls as the sole comparator group rather than defined neurological disorders; (3) The data is incomplete, making it impossible to directly extract or compute the necessary information to construct the diagnostic contingency table; (4) preclinical research limited to animal models; and (5) non-diagnostic studies including purely mechanistic, pathological, or therapeutic investigations.
2.3 Data extraction
First, remove duplicate references using reference management software. Subsequently, two independent reviewers screen the remaining references by evaluating their abstracts and full texts. In cases of disagreement, a third reviewer is consulted to resolve discrepancies. The extracted data comprise the author’s name, publication year, sample size, as well as the sensitivity, specificity, AUC values, and detection methods for Aβ42, t-tau, p-tau181, p-tau217, p-tau231, Aβ42/Aβ40, Aβ42/t-tau, and Aβ42/p-tau181.
2.4 Assessment of literature quality
QUADAS-2 encompasses four key areas: patient selection, index test, reference standard, and flow and timing. Each area contains specific signaling problems that aid in identifying potential risks of bias and applicability issues. The response options for signaling problems in each area are typically “Yes,” “No,” or “Unclear.” Based on the responses to these questions, the risk of bias and applicability can be categorized as “low,” “high,” or “unclear,” respectively.
2.5 Data analysis
All statistical analyses were performed using Meta-Disc 1.4, Stata 15.1, and R 4.3.2. A contingency table was employed to derive the values of True Positive, False Positive, False Negative, and True Negative for each study included in the analysis, facilitating the evaluation of the diagnostic tests’ accuracy. Heterogeneity tests were conducted to assess the variability among studies, utilizing the I2 statistic for this purpose. An I2 < 50% indicated low heterogeneity, warranting the use of a fixed-effect model. Conversely, an I2 > 50% suggested high heterogeneity, necessitating the adoption of random effects models. The analysis encompassed sensitivity, specificity, positive likelihood ratio (LR+), negative likelihood ratio (LR−), diagnostic odds ratio (DOR), and the area under the receiver operating characteristic curve (AUC).
3 Results
3.1 Study search results
Our systematic search identified 4,103 potentially relevant publications from electronic databases. After removing 1,910 duplicate records, we excluded 1,319 articles through abstract screening based on predefined inclusion/exclusion criteria. Of the remaining 874 full-text articles assessed for eligibility, 23 studies met all selection criteria and were included in the final analysis (see Figure 1). The analysis encompassed eight distinct core CSF biomarkers, with pooled data from 2,187 AD patients and 2,019 non-AD dementia controls. Detailed characteristics of included studies are presented in Table 1.
Figure 1

The flowchart of study selection.
Table 1
| Study | Case sample size | CSF biomarker | Sen | Spc | TP | FP | FN | TN | Cut off | AUC | Technology | |
|---|---|---|---|---|---|---|---|---|---|---|---|---|
| AD | non-AD | |||||||||||
| Slaets et al. (25) | 80 | 75 | Aβ42 | 0.81 | 0.59 | 65 | 31 | 15 | 44 | 517 | 0.747 | ELISA |
| Aβ42/Aβ40 | 0.81 | 0.6 | 65 | 30 | 15 | 45 | 0.057 | 0.749 | ||||
| Dumurgier et al. (26) | 160 | 207 | Aβ42 | 0.78 | 0.79 | 125 | 43 | 35 | 164 | 752 | 0.81 | ELISA |
| t-tau | 0.84 | 0.81 | 134 | 39 | 26 | 168 | 330 | 0.87 | ||||
| p-tau181 | 0.84 | 0.81 | 134 | 39 | 26 | 168 | 62 | 0.9 | ||||
| Aβ42/Aβ40 | 0.73 | 0.78 | 117 | 45 | 43 | 162 | 0.055 | 0.81 | ||||
| Struyfs et al. (27) |
100 | 50 | Aβ42 | 0.959 | 0.4 | 96 | 30 | 4 | 20 | 694 | 0.686 | ELISA |
| t-tau | 0.878 | 0.64 | 88 | 18 | 12 | 32 | 335.5 | 0.819 | ||||
| p-tau181 | 0.918 | 0.66 | 92 | 17 | 8 | 33 | 50 | 0.82 | ||||
| Aβ42/Aβ40 | 0.939 | 0.5 | 94 | 25 | 6 | 25 | 0.1215 | 0.782 | ||||
| Aβ42/t-tau | 0.878 | 0.76 | 88 | 12 | 12 | 38 | 1.42 | 0.842 | ||||
| Aβ42/p-tau181 | 0.878 | 0.72 | 88 | 14 | 12 | 36 | 9.44 | 0.84 | ||||
| Bousiges et al. (28) | 9 | 13 | Aβ42/Aβ40 | 0.923 | 0.889 | 8 | 1 | 1 | 12 | 0.0799 | 0.86 | ELISA |
| Constantinides et al. (29) | 98 | 144 | Aβ42 | 0.95 | 0.669 | 93 | 48 | 5 | 96 | 430.7 | 0.831 | ELISA |
| t-tau | 1 | 0.845 | 98 | 22 | 0 | 122 | 397 | 0.948 | ||||
| p-tau181 | 0.95 | 0.873 | 93 | 18 | 5 | 126 | 74.8 | 0.96 | ||||
| Aβ42/Aβ40 | 0.95 | 0.857 | 93 | 21 | 5 | 123 | 0.078 | 0.939 | ||||
| Aβ42/t-tau | 1 | 0.901 | 98 | 15 | 0 | 129 | 1.03 | 0.975 | ||||
| Aβ42/p-tau181 | 0.983 | 0.84 | 96 | 23 | 2 | 121 | 0.155 | 0.952 | ||||
| Ortner et al. (30) | 86 | 44 | Aβ42 | 0.855 | 0.75 | 74 | 11 | 12 | 33 | 825 | 0.812 | CLIA |
| t-tau | 0.494 | 0.864 | 43 | 6 | 43 | 38 | 323 | 0.706 | ||||
| p-tau181 | 0.843 | 0.705 | 73 | 13 | 13 | 31 | 21 | 0.793 | ||||
| Aβ42/Aβ40 | 0.867 | 0.773 | 75 | 10 | 11 | 34 | 0.055 | 0.829 | ||||
| Aβ42/t-tau | 0.892 | 0.75 | 77 | 11 | 9 | 33 | 0.27 | 0.822 | ||||
| Aβ42/p-tau181 | 0.892 | 0.773 | 77 | 10 | 9 | 34 | 0.022 | 0.841 | ||||
| Oudart et al. (31) | 140 | 240 | Aβ42 | 0.857 | 0.546 | 120 | 109 | 20 | 131 | 706 | 0.738 | ELISA |
| t-tau | 0.814 | 0.725 | 114 | 66 | 26 | 174 | 355 | 0.822 | ||||
| p-tau181 | 0.829 | 0.733 | 116 | 64 | 24 | 176 | 57 | 0.831 | ||||
| Aβ42/Aβ40 | 0.871 | 0.688 | 122 | 75 | 18 | 165 | 0.059 | 0.823 | ||||
| Baldeiras et al. (32) | 107 | 107 | Aβ42 | 0.7 | 0.82 | 75 | 19 | 32 | 88 | 538 | 0.791 | ELISA |
| t-tau | 0.61 | 0.82 | 65 | 19 | 42 | 88 | 300 | 0.756 | ||||
| Aβ42/Aβ40 | 0.59 | 0.87 | 63 | 14 | 44 | 93 | 5.4 | 0.778 | ||||
| Aβ42/t-tau | 0.79 | 0.84 | 84 | 17 | 23 | 90 | 0.77 | 0.864 | ||||
| Mazzeo et al. (33) | 101 | 44 | Aβ42 | 0.868 | 0.486 | 88 | 23 | 13 | 21 | 776.34 | 0.567 | CLIA |
| t-tau | 0.915 | 0.829 | 92 | 8 | 9 | 36 | 509.09 | 0.941 | ||||
| Aβ42/Aβ40 | 0.882 | 0.868 | 89 | 6 | 12 | 38 | 0.068 | 0.943 | ||||
| Keshavan et al. (34) | 13 | 50 | Aβ42 | 1 | 0.74 | 13 | 13 | 0 | 37 | 1,423 | 0.891 | CLIA |
| t-tau | 0.54 | 0.82 | 7 | 9 | 6 | 41 | 443 | 0.665 | ||||
| p-tau181 | 1 | 0.66 | 13 | 17 | 0 | 33 | 49 | 0.879 | ||||
| Aβ42/Aβ40 | 1 | 0.94 | 13 | 3 | 0 | 47 | 0.11 | 0.966 | ||||
| Aβ42/t-tau | 0.92 | 0.90 | 12 | 5 | 1 | 45 | 3.167 | 0.955 | ||||
| Aβ42/p-tau181 | 1 | 0.94 | 13 | 3 | 0 | 47 | 25.25 | 0.966 | ||||
| Dorey et al. (35) | 281 | 244 | Aβ42/Aβ40 | 0.762 | 0.582 | 214 | 102 | 67 | 142 | 0.06 | 0.7 | ELISA |
| Frölich et al. (36) | 28 | 87 | Aβ42 | 0.74 | 0.64 | 21 | 31 | 7 | 56 | 749 | 0.68 | ELISA |
| t-tau | 0.62 | 0.86 | 17 | 12 | 11 | 75 | 411 | 0.77 | ||||
| Aβ42/Aβ40 | 0.59 | 0.75 | 17 | 22 | 11 | 65 | 0.08 | 0.66 | ||||
| Abildgaard et al. (37) | 123 | 89 | Aβ42 | 0.6 | 0.92 | 74 | 7 | 49 | 82 | 943 | 0.74 | CLIA |
| t-tau | 0.67 | 0.87 | 82 | 12 | 41 | 77 | 279 | 0.81 | ||||
| p-tau181 | 0.75 | 0.88 | 92 | 11 | 31 | 78 | 24 | 0.87 | ||||
| Aβ42/t-tau | 0.86 | 0.84 | 106 | 14 | 17 | 75 | 0.34 | 0.9 | ||||
| Aβ42/p-tau181 | 0.84 | 0.89 | 103 | 10 | 20 | 79 | 0.033 | 0.92 | ||||
| Struyfs et al. (38) | 140 | 77 | Aβ42 | 0.793 | 0.532 | 111 | 36 | 29 | 41 | 500.27 | 0.677 | ELISA |
| t-tau | 0.621 | 0.636 | 87 | 28 | 53 | 49 | 472.35 | 0.592 | ||||
| p-tau181 | 0.779 | 0.61 | 109 | 29 | 31 | 48 | 50.35 | 0.72 | ||||
| Aβ42/t-tau | 0.75 | 0.571 | 105 | 33 | 35 | 44 | 1.08 | 0.678 | ||||
| Aβ42/p-tau181 | 0.829 | 0.597 | 116 | 31 | 24 | 46 | 9.11 | 0.77 | ||||
| Chiasserini et al. (39) | 48 | 40 | Aβ42 | 0.79 | 0.6 | 38 | 16 | 10 | 24 | 537 | 0.6432 | ELISA |
| t-tau | 0.79 | 0.83 | 38 | 7 | 10 | 33 | 461.4 | 0.8524 | ||||
| p-tau181 | 0.9 | 0.78 | 43 | 9 | 5 | 31 | 69.2 | 0.8914 | ||||
| Baiardi et al. (40) | 97 | 168 | p-tau181 | 0.918 | 0.905 | 89 | 16 | 8 | 152 | 65.5 | 0.954 | CLIA |
| Vergallo et al. (41) | 45 | 20 | Aβ42/p-tau181 | 0.9 | 0.87 | 41 | 3 | 4 | 17 | 4.244 | 0.924 | ELISA |
| Forlenza et al. (42) | 41 | 35 | Aβ42 | 0.83 | 0.54 | 34 | 16 | 7 | 19 | 416 | non | FD |
| t-tau | 0.78 | 0.57 | 32 | 14 | 9 | 21 | 76.7 | non | ||||
| p-tau181 | 0.8 | 0.68 | 33 | 11 | 8 | 24 | 36.1 | non | ||||
| Aβ42/p-tau181 | 0.83 | 0.64 | 35 | 10 | 6 | 25 | 0.0867 | 0.8 | ||||
| Perani et al. (43) | 47 | 14 | Aβ42 | 0.85 | 0.43 | 40 | 8 | 7 | 6 | 515 | 0.64 | ELISA |
| t-tau | 0.38 | 0.86 | 18 | 2 | 29 | 12 | 350 | 0.67 | ||||
| p-tau181 | 0.7 | 0.64 | 33 | 5 | 14 | 9 | 52.5 | 0.62 | ||||
| Aβ42/t-tau | 0.79 | 0.68 | 37 | 4 | 10 | 10 | 0.6769 | 0.81 | ||||
| Leuzy et al. (44) |
119 | 92 | p-tau217 | 0.9386 | 0.9667 | 112 | 3 | 7 | 89 | 190.87 | 0.98 | CLIA |
| p-tau231 | 0.9298 | 0.9111 | 111 | 8 | 8 | 84 | 18.76 | 0.96 | ELISA | |||
| Ashton et al. (13) | 127 | 70 | p-tau217 | 0.96 | 0.951 | 122 | 3 | 5 | 67 | 6.15 | non | ELISA |
| p-tau231 | 0.882 | 0.9 | 112 | 7 | 15 | 63 | 100.4 | non | ||||
| Wojdała et al. (45) | 35 | 39 | p-tau231 | 1 | 0.943 | 33 | 2 | 2 | 37 | 20.8 | 0.98 | Simoa |
| Pilotto et al. (46) | 162 | 70 | p-tau217 | 0.938 | 0.887 | 152 | 8 | 10 | 62 | 0.518 | 0.955 | Simoa |
General characteristics of included publications.
Sen, Sensitivity; Spc, Specificity; FD, Fluorescence detection; ELISA, Enzy-melinked immunosorbent assay; CLIA, Chemiluminescence immunoassay; Simoa, single molecule array; Cut off: pg/mL.
3.2 Quality assessment of evidence
The methodological quality and risk of bias of the 23 included studies were systematically evaluated using the QUADAS-2 tool across four critical domains: patient selection, index test, reference standard, and flow and timing. The detailed assessment results are presented in Figure 2.
Figure 2
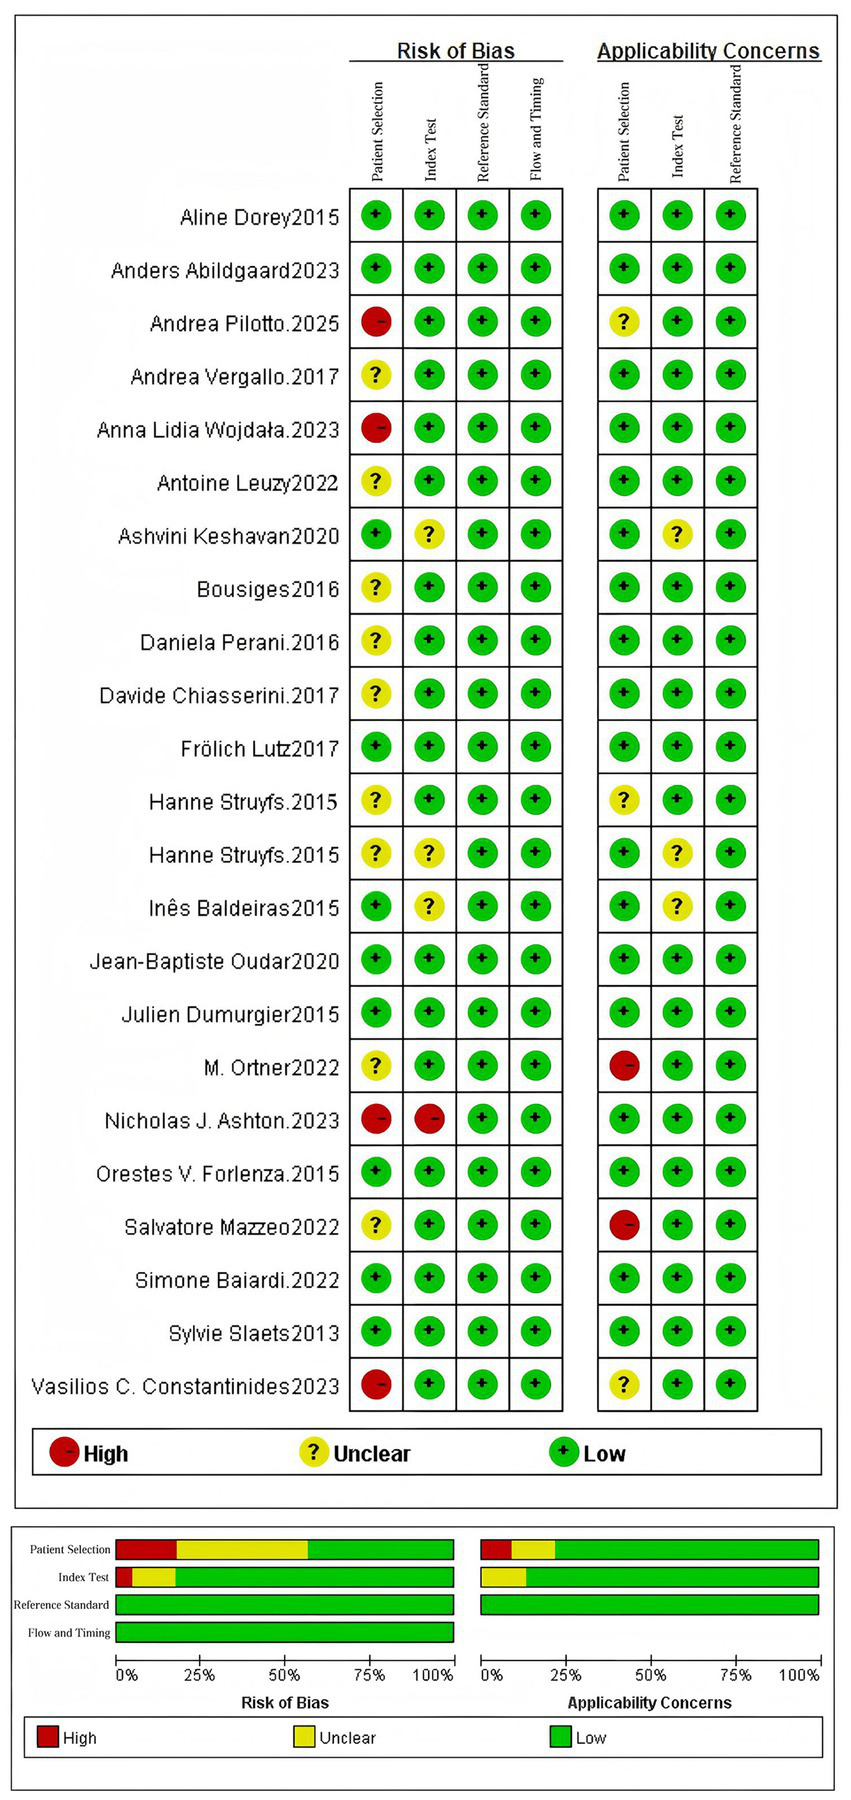
Quality assessment diagram and risk of bias summary.
3.3 Meta-analytic evidence synthesis outcomes
Comprehensive meta-analytic integration of diagnostic accuracy parameters for the eight core CSF biomarkers was performed using R software, including pooled estimates of sensitivity, specificity, LR+, LR−, DOR, and AUC. The complete statistical synthesis results are presented in Table 2.
Table 2
| Biomaker | Study (N) | Case sample size | Sensitivity | Specificity | Positive likelihood ratio | Negative likelihood ratio | Diagnostic odds ratio | AUC | |
|---|---|---|---|---|---|---|---|---|---|
| AD | non-AD | ||||||||
| Aβ42 | 15 | 1,312 | 1,303 | 0.84(0.79–0.88) | 0.65(0.57–0.73) | 2.44(1.93–3.10) | 0.25 (0.19–0.32) | 9.90 (6.74–14.28) | 0.85 (0.81–0.90) |
| t-tau | 14 | 1,232 | 1,228 | 0.76 (0.64–0.85) | 0.79 (0.75–0.83) | 3.70 (2.73–4.81) | 0.31 (0.17–0.48) | 13.16 (5.86–26.12) | 0.82 (0.77–0.87) |
| p-tau181 | 12 | 1,093 | 1,158 | 0.85 (0.81–0.89) | 0.77 (0.71–0.82) | 3.76 (2.74–5.05) | 0.19 (0.13–0.27) | 20.83 (10.76–36.94) | 0.90 (0.87–0.93) |
| p-tau217 | 3 | 408 | 232 | 0.95 (0.92–0.97) | 0.94 (0.88–0.98) | 20.13 (6.54–54.81) | 0.06 (0.03–0.10) | 395.28 (92.17–1305.79) | 0.99 (0.97–1.00) |
| p-tau231 | 3 | 281 | 201 | 0.91 (0.86–0.96) | 0.92 (0.87–0.96) | 12.24 (6.08–23.64) | 0.10 (0.04–0.17) | 152.61 (44.26–434.17) | 0.97 (0.94–1.00) |
| Aβ42/Aβ40 | 12 | 1,203 | 1,305 | 0.84 (0.78–0.90) | 0.77 (0.70–0.84) | 3.83 (2.58–5.78) | 0.20 (0.11–0.32) | 20.52 (8.81–43.45) | 0.87 (0.83–0.92) |
| Aβ42/t-tau | 8 | 714 | 575 | 0.88 (0.81–0.94) | 0.80 (0.73–0.86) | 4.61 (2.91–7.09) | 0.15 (0.06–0.28) | 37.58 (10.98–104.49) | 0.90 (0.84–0.96) |
| Aβ42/p-tau181 | 8 | 646 | 509 | 0.90 (0.86–0.94) | 0.80 (0.73–0.87) | 4.76 (3.00–7.52) | 0.13 (0.06–0.20) | 41.62 (15.88–96.73) | 0.93 (0.90–0.96) |
Diagnostic performance analysis of eight core CSF biomarkers.
3.3.1 Sensitivity analysis: comparative diagnostic sensitivity between individual biomarkers and biomarker ratios
In AD diagnosis, sensitivity quantifies a biomarker’s ability to correctly identify true AD cases. Among individual biomarkers, p-tau217 demonstrated the highest sensitivity (0.95, 95% CI: 0.92–0.97), yielding only a 5% false-negative rate. Comparative analysis revealed p-tau231 (0.91, 95% CI: 0.86–0.96) and p-tau181 (0.85, 95% CI: 0.81–0.89) as subsequent performers, while t-tau showed the lowest sensitivity (0.76, 95% CI: 0.64–0.85). Notably, biomarker ratios - particularly Aβ42/p-tau181 (0.90, 95% CI: 0.86–0.94) and Aβ42/t-tau (0.88, 95% CI: 0.81–0.94) - consistently outperformed standalone Aβ42 measurement (0.84, 95% CI: 0.79–0.88), indicating the diagnostic advantage of ratio-based approaches. In summary, both p-tau217 and p-tau231 demonstrated superior sensitivity as individual biomarkers, while the Aβ42/p-tau181 ratio exhibited optimal diagnostic performance among biomarker combinations. These findings support their clinical utility as frontline screening tools for AD (see Table 2 and Figure 3 for complete results of Sensitivity).
Figure 3
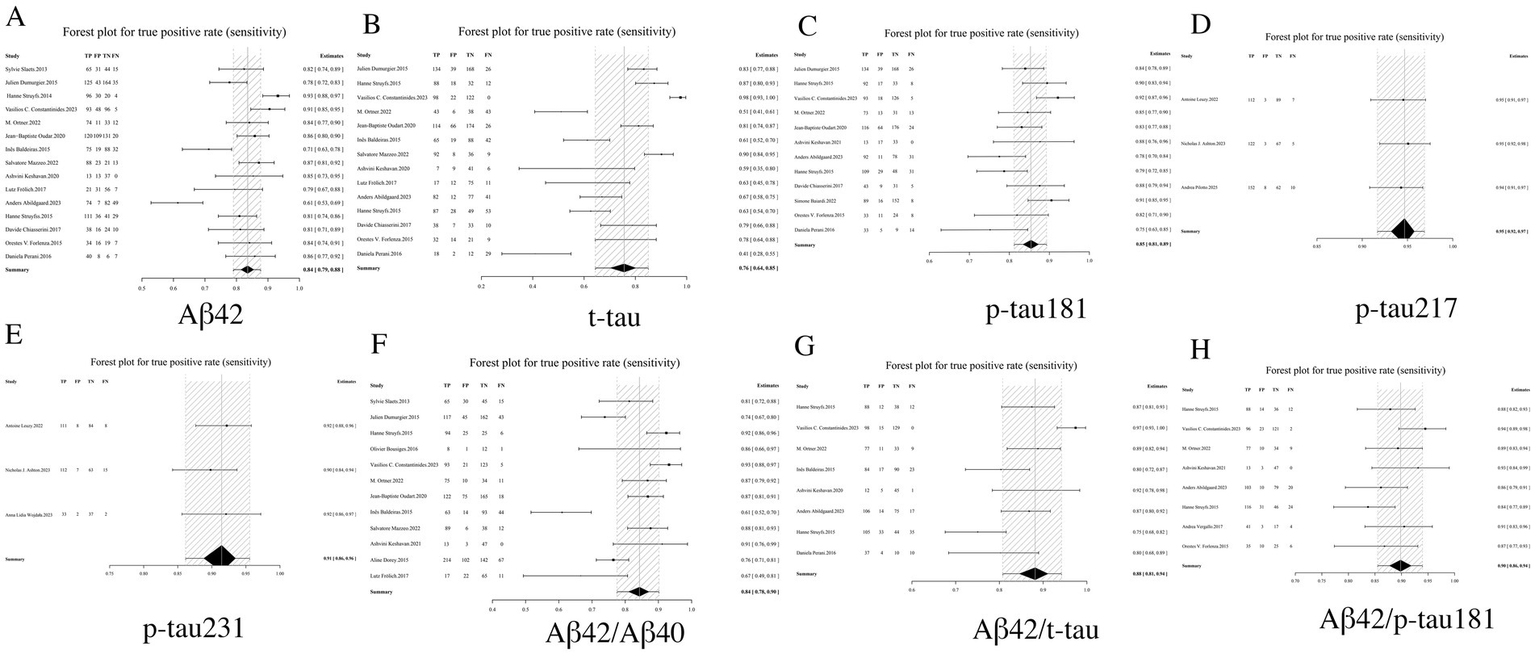
Forest plot of sensitivity for core CSF biomarkers. (A) Aβ42, (B) t-tau, (C) p-tau181, (D) p-tau217, (E) p-tau231, (F) Aβ42/Aβ40, (G) Aβ42/t-tau, (H) Aβ42/p-tau181.
3.3.2 Specificity analysis: diagnostic discriminatory power of distinct biomarkers
Specificity, a critical metric in diagnostic test evaluation, quantifies the ability of biomarkers to accurately exclude non-Alzheimer’s dementia cases. Our comprehensive analysis demonstrated that among individual CSF biomarkers, p-tau 217 (0.94, 95% CI: 0.88–0.98) and p-tau231 (0.92, 95% CI: 0.87–0.96) exhibited the highest specificity profiles, corresponding to clinically favorable false-positive rates of only 6–8%. In contrast, Aβ42 showed substantially lower specificity (0.65, 95% CI: 0.57–0.73), indicating a 39% probability of misclassification. Notably, biomarker ratios - particularly the Aβ42/p-tau181 ratio (0.80, 95% CI: 0.73–0.87) and Aβ42/t-tau ratio (0.80, 95% CI: 0.73–0.86)—demonstrated statistically superior specificity compared to Aβ42 alone, though remained slightly less specific than individual phosphorylated tau variants. Intermediate specificity was observed for standalone p-tau181 (0.77, 95% CI: 0.71–0.82) and t-tau (0.79, 95% CI: 0.75–0.83) measurements. Importantly, the combinatorial approach of biomarker ratios significantly enhanced diagnostic specificity beyond what could be achieved with single biomarkers. These findings collectively position p-tau217 and p-tau231 as optimal confirmatory biomarkers, while supporting the complementary role of ratio-based strategies in mitigating the diagnostic limitations of Aβ42 (see Table 2 and Figure 4 for complete results of Specificity).
Figure 4
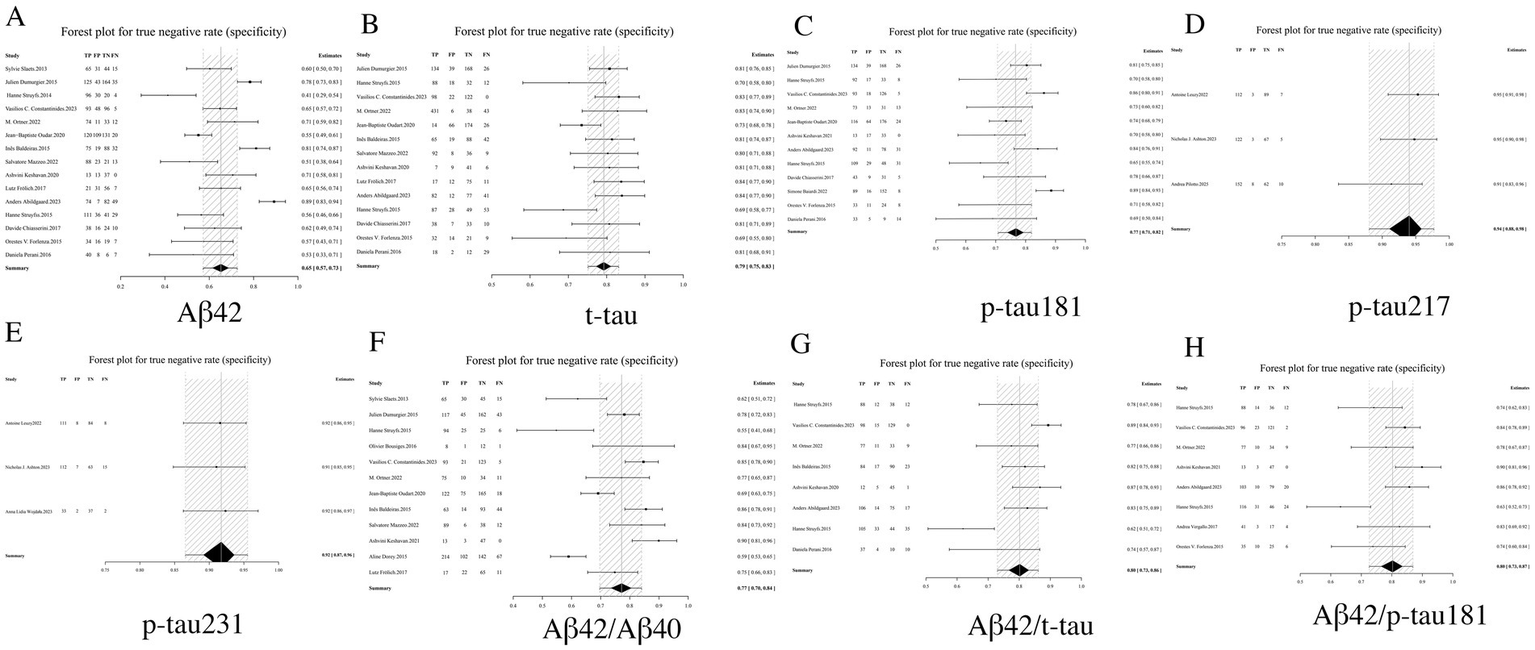
Forest plot of specificity for core CSF biomarkers. (A) Aβ42, (B) t-tau, (C) p-tau181, (D) p-tau217, (E) p-tau231, (F) Aβ42/Aβ40, (G) Aβ42/t-tau, (H) Aβ42/p-tau181.
3.3.3 LR+ analysis: quantitative assessment of diagnostic certainty
LR+, a key metric in diagnostic test evaluation, quantitatively assesses the probability of confirming AD when biomarker results are positive. Our analysis demonstrated that among individual biomarkers, p-tau217 exhibited an exceptionally high LR+ of 20.13 (95% CI: 6.54–54.81), indicating that a positive result provides near-definitive diagnostic confirmation, significantly outperforming other markers including p-tau231 (12.24, 95% CI: 6.08–23.64) and p-tau181 (3.76, 95% CI: 2.74–5.05). In contrast, Aβ42 showed limited diagnostic utility with the lowest LR + (2.44, 95% CI: 1.93–3.10). While biomarker ratios including Aβ42/p-tau181 (4.76, 95% CI: 3.00–7.52) and Aβ42/t-tau (4.61, 95% CI: 2.91–7.09) demonstrated significantly improved performance over Aβ42 alone, they remained inferior to phosphorylated tau isoforms. These findings establish p-tau217 and p-tau231 as optimal standalone biomarkers for AD confirmation, while supporting the complementary role of ratio-based approaches in enhancing Aβ42’s diagnostic value. From a laboratory medicine perspective, the markedly elevated LR + values (>10) particularly qualify p-tau217 and p-tau231 as excellent candidates for confirmatory testing, capable of substantially reducing diagnostic uncertainty in clinical practice (see Table 2 and Figure 5 for complete results of LR+).
Figure 5
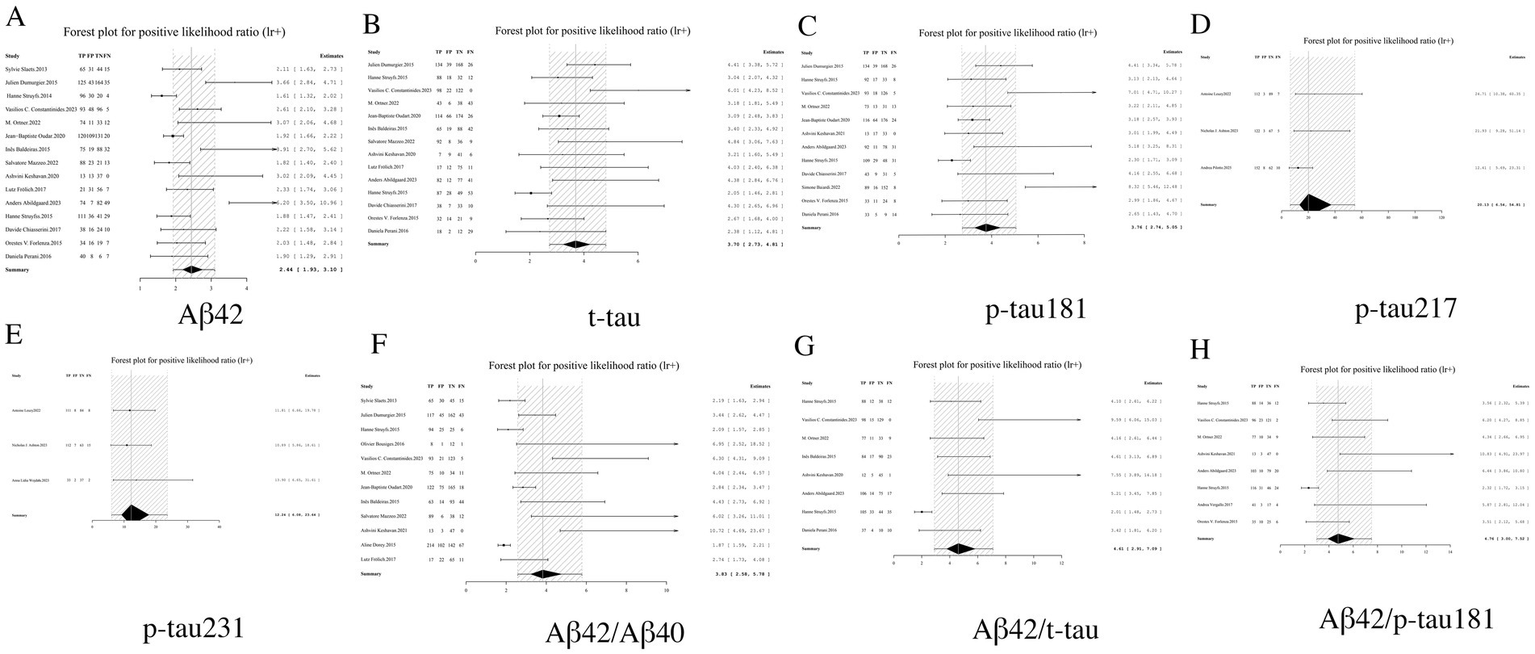
Forest plot of LR+ for core CSF biomarkers. (A) Aβ42, (B) t-tau, (C) p-tau181, (D) p-tau217, (E) p-tau231, (F) Aβ42/Aβ40, (G) Aβ42/t-tau, (H) Aβ42/p-tau181.
3.3.4 LR− analysis: systematic evaluation of disease exclusion capacity
LR− serves as a critical metric for assessing the reliability of excluding AD when biomarker results are negative, with lower values indicating superior diagnostic performance. Among individual biomarkers, p-tau217 demonstrated exceptional exclusion capacity with an LR− of 0.06 (95% CI: 0.03–0.10), suggesting near-complete certainty in ruling out AD when negative. Similarly outstanding performance was observed for p-tau231 (0.10, 95% CI: 0.04–0.17) and p-tau181 (0.19, 95% CI: 0.13–0.27). Biomarker ratios including Aβ42/p-tau181 (0.13, 95% CI: 0.06–0.20) and Aβ42/t-tau (0.15, 95% CI: 0.06–0.28) showed significantly improved exclusion capability compared to Aβ42 alone (0.25, 95% CI: 0.19–0.32), though remained slightly inferior to individual phosphorylated tau isoforms. Notably, t-tau exhibited the least favorable exclusion profile (LR− = 0.31, 95% CI: 0.17–0.48). These findings establish p-tau217 and p-tau231 as optimal biomarkers for AD exclusion, while supporting the complementary role of ratio-based approaches in enhancing the negative predictive value of Aβ42. Based on these results, we strongly recommend prioritizing biomarkers with LR− values <0.1 in clinical screening algorithms to maximize diagnostic certainty (see Table 2 and Figure 6 for complete results of LR−).
Figure 6
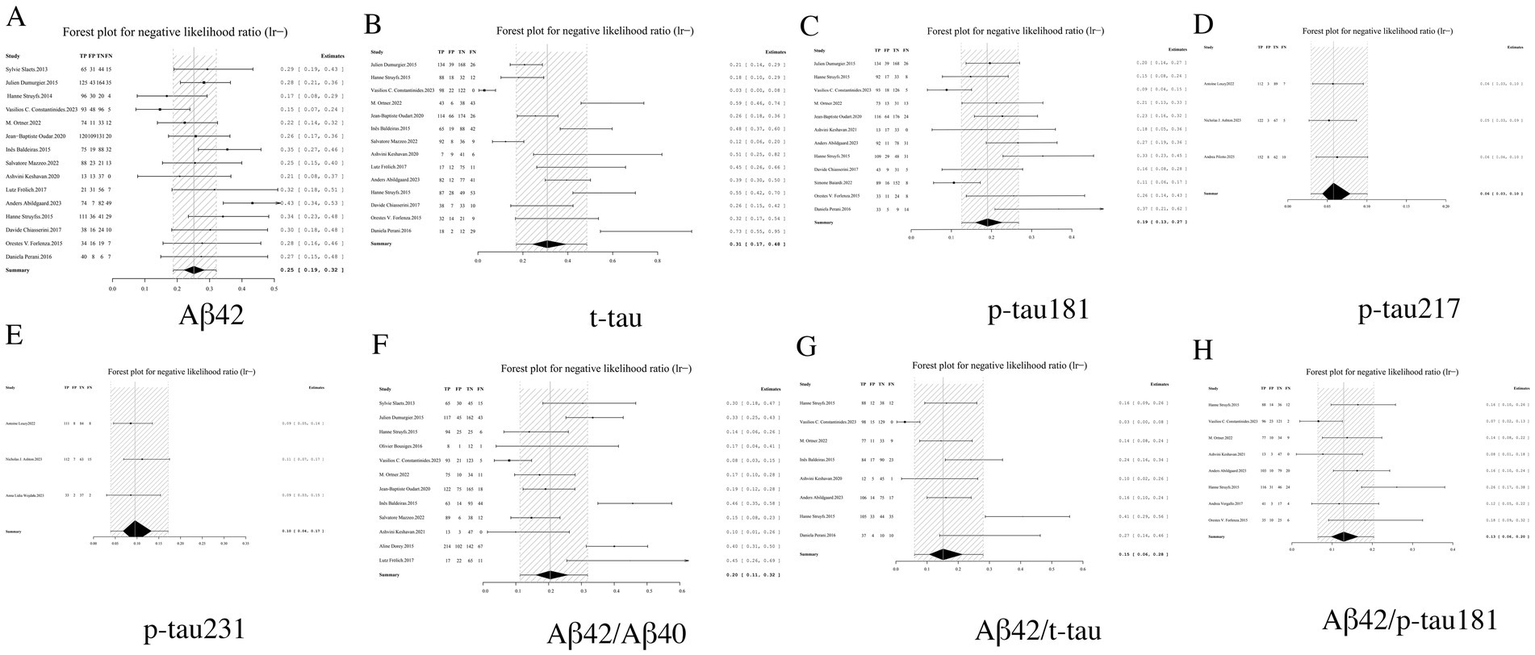
Forest plot of LR− for core CSF biomarkers. (A) Aβ42, (B) t-tau, (C) p-tau181, (D) p-tau217, (E) p-tau231, (F) Aβ42/Aβ40, (G) Aβ42/t-tau, (H) Aβ42/p-tau181.
3.3.5 DOR analysis: systematic evaluation of comprehensive diagnostic performance
DOR analysis demonstrated superior integrated diagnostic performance for p-tau217, with an exceptionally high DOR of 395.28 (95% CI: 92.17–1305.79). The performance hierarchy revealed p-tau231 (DOR = 152.61, 95% CI: 44.26–434.17) and the Aβ42/p-tau181 ratio (DOR = 41.62, 95% CI: 15.88–96.73) as secondary top performers. Notably, all biomarker ratios exhibited significantly enhanced DOR values compared to their corresponding individual biomarkers, exemplified by the Aβ42/t-tau ratio (DOR = 37.58, 95% CI: 10.98–104.49) demonstrating marked improvement over Aβ42 alone (DOR = 9.90, 95% CI: 6.74–14.28). These findings robustly validate the diagnostic superiority of ratio-based approaches. From a clinical implementation perspective, biomarkers with DOR > 100 (p-tau217 and p-tau231) qualify as potential gold-standard indicators for AD diagnosis, while ratio markers with DOR > 30 may serve as valuable alternatives in clinical algorithms (see Table 2 and Figure 7 for complete results of DOR).
Figure 7
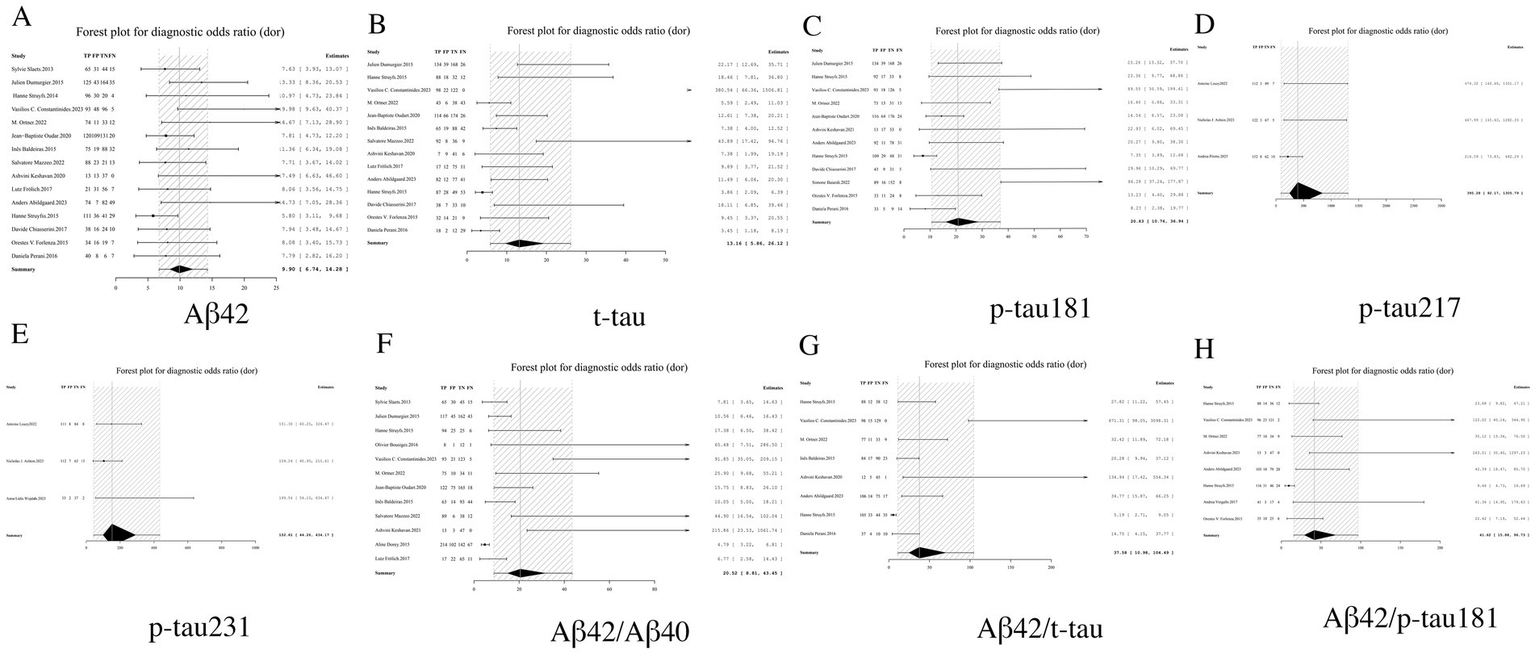
Forest plot of DOR for core CSF biomarkers. (A) Aβ42, (B) t-tau, (C) p-tau181, (D) p-tau217, (E) p-tau231, (F) Aβ42/Aβ40, (G) Aβ42/t-tau, (H) Aβ42/p-tau181.
3.3.6 AUC analysis: comprehensive evaluation of overall diagnostic accuracy
AUC analysis demonstrated superior diagnostic performance among CSF biomarkers for AD detection. Specifically, p-tau217 exhibited near-perfect discriminative capacity with an AUC of 0.99 (95% CI: 0.97–1.00), followed closely by p-tau231 (AUC = 0.97, 95% CI: 0.94–1.00) and the Aβ42/p-tau181 ratio (AUC = 0.93, 95% CI: 0.90–0.96). Notably, biomarker combinations consistently achieved higher AUC values compared to individual biomarkers, highlighting the diagnostic advantage of ratio-based approaches. According to established diagnostic accuracy benchmarks: Biomarkers with AUC values exceeding 0.90 (p-tau217, p-tau231, and Aβ42/p-tau181) are classified as having excellent diagnostic utility; Markers with AUC values between 0.80–0.90 (p-tau181 and Aβ42/t-tau ratio) demonstrate good but relatively inferior performance (15) (see Table 2; performance gradients illustrated in Figure 8).
Figure 8
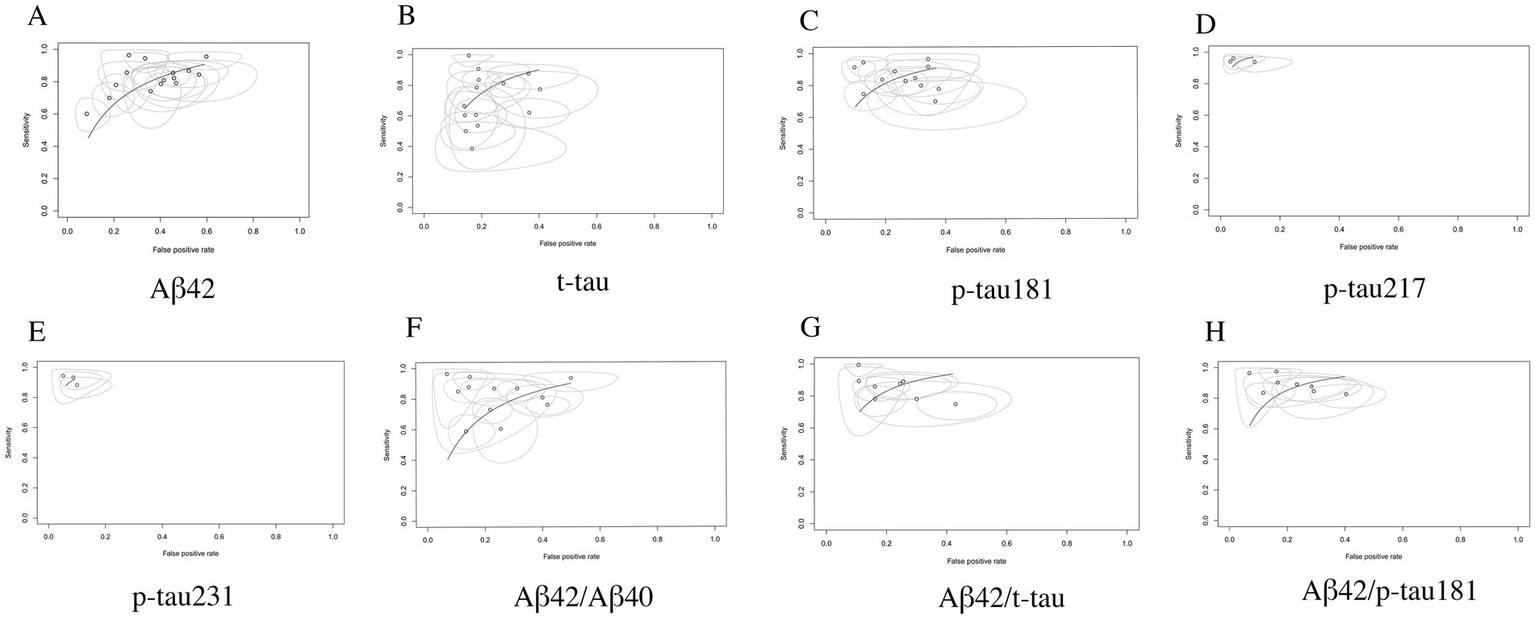
SROC curve analysis of core CSF biomarkers. (A) Aβ42, (B) t-tau, (C) p-tau181, (D) p-tau217, (E) p-tau231, (F) Aβ42/Aβ40, (G) Aβ42/t-tau, (H) Aβ42/p-tau181.
3.3.7 Heterogeneity analysis
3.3.7.1 Threshold effect heterogeneity analysis in diagnostic accuracy studies
The Spearman’s rank correlation analysis demonstrated that among the eight CSF biomarkers evaluated, only p-tau231 exhibited significant threshold effect (p < 0.05). In contrast, the remaining seven core CSF biomarkers showed no statistically significant threshold effect (all p-values >0.05), indicating the absence of threshold-induced heterogeneity in these markers. This finding suggests that for most biomarkers examined (87.5%), diagnostic accuracy remains consistent across different cutoff values, with p-tau231 being the sole exception requiring careful threshold optimization in clinical applications. Detailed correlation coefficients and corresponding p-values are presented in Table 3.
Table 3
| Biomaker | Spearman correlation coefficient | p-value |
|---|---|---|
| Aβ42 | 0.39 | 0.16 |
| t-tau | 0.41 | 0.14 |
| p-tau181 | −0.20 | 0.53 |
| p-tau217 | −0.50 | 0.67 |
| p-tau231 | −1.00 | 0.00 |
| Aβ42/Aβ40 | −0.25 | 0.43 |
| Aβ42/t-tau | −0.69 | 0.06 |
| Aβ42/p-tau181 | −0.55 | 0.16 |
Heterogeneity analysist results induced by threshold effects.
3.3.7.2 Non-threshold effect heterogeneity analysis in diagnostic accuracy studies
The Cochran’s Q test for heterogeneity across the eight core CSF biomarkers revealed significant non-threshold effect induced variability in diagnostic odds ratios (DORs). While Aβ42, p-tau217, and p-tau231 demonstrated relative homogeneity (p ≥ 0.01), all remaining biomarkers showed statistically significant heterogeneity (p < 0.01). Quantitative assessment using I2 statistics further confirmed this pattern: only Aβ42, p-tau217, and p-tau231 exhibited moderate heterogeneity (I2 < 50%) across effect sizes, whereas other biomarkers displayed substantial variability (I2 > 50%) in all diagnostic parameters including sensitivity, specificity, positive/negative likelihood ratios, and DORs. Therefore, the results of this study were analyzed using a random effects model for Bayesian meta-analysis.
3.3.8 Publication bias
Deeks’ funnel plot analysis revealed no significant publication bias among the eight evaluated core CSF biomarkers (all p-values >0.05), indicating balanced representation of studies in our meta-analysis. The results are shown in Figure 9.
Figure 9
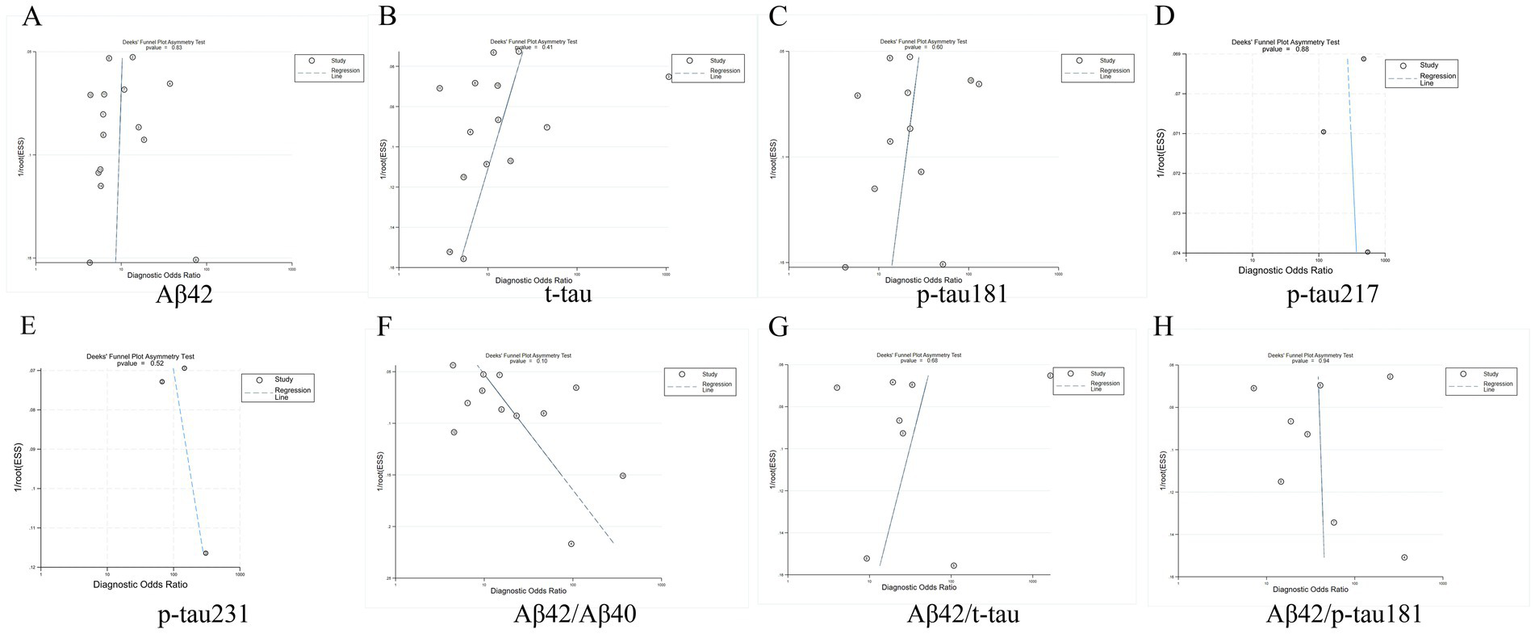
Deeks funnel chart. (A) Aβ42, (B) t-tau, (C) p-tau181, (D) p-tau217, (E) p-tau231, (F) Aβ42/Aβ40, (G) Aβ42/t-tau, (H) Aβ42/p-tau181.
4 Discussion
In the current research, CSF biomarkers represent the longest-studied and most comprehensively analyzed indicators for AD, effectively reflecting the pathological changes in affected patients. The Aβ protein indicates Aβ deposition, while p-tau181 signifies the excessive phosphorylation of tau protein and the formation of neurofibrillary tangles. Currently, both Aβ and tau pathological markers, recognized as core CSF indicators in AD (16). As research progresses, the ratios of CSF (Hybrid ratios) demonstrate superior diagnostic performance compared to individual markers, providing unique diagnostic value in differentiating AD patients from those without the condition. Specifically, the ratio of Aβ subtypes (e.g., Aβ42/Aβ40) is believed to mitigate the influence of individual variability and certain objective analytical factors, outperforming individual Aβ polypeptide subtypes (9, 10), Furthermore, the Aβ42 to tau protein ratio exhibits enhanced diagnostic efficacy over single biomarkers in distinguishing AD patients from non-affected individuals. However, there remains a lack of evidence to ascertain which ratio, between Aβ42/Aβ40 and Aβ42 to tau protein, possesses higher diagnostic accuracy (17).
To further optimize diagnostic strategies for AD in clinical practice, this study comprehensively evaluated the diagnostic performance of various core CSF biomarkers in distinguishing patients with AD from those without it, utilizing the Bayesian meta-analysis method. The results indicated that the overall diagnostic performance of the CSF biomarker ratios Aβ42/Aβ40, Aβ42/t-tau, and Aβ42/p-tau181 surpassed that of the individual markers Aβ42, t-tau, and p-tau181, yet was inferior to that of the individual markers p-tau217 and p-tau231. Notably, compared to p-tau181, the Aβ42/Aβ40 ratio demonstrates superior diagnostic performance. Furthermore, the diagnostic performance of Aβ42/t-tau is very similar to that of p-tau181. Recent studies have highlighted that p-tau217 and p-tau231, which are related to Phosphorylated tau protein, exhibit strong correlations with the pathologies of Aβ and tau, while also demonstrating excellent diagnostic performance (18, 19). The results of the meta-analysis may further reveal a strong correlation between phosphorylated tau protein, represented by p-tau181, and Alzheimer’s disease-related Aβ and tau pathology. This indicates the unique advantage of p-tau181 in distinguishing Alzheimer’s disease from other conditions. In the comparison of different types of CSF biomarkers and their ratios, p-tau217, p-tau231, and Aβ42/p-tau181 demonstrated the best diagnostic performance, with high values for key indicators such as sensitivity, specificity, and AUC.
The results of this study provide a significant foundation for the application of core CSF biomarkers in diagnosing AD. The p-tau217 biomarker demonstrates high diagnostic performance, suggesting a strong correlation between p-tau217 and the pathology of amyloid-beta (Aβ) and tau in AD (20). In the future, more comprehensive diagnostic tests should be conducted for various threonine sites, such as p-tau217, p-tau231, and p-tau205. Additionally, the ratios of core CSF biomarkers, particularly the ratio of Aβ42 protein to tau protein (e.g., Aβ42/p-tau181), have demonstrated superior diagnostic performance compared to the Aβ42/Aβ40 ratio. This maximizes the diagnostic accuracy of core CSF biomarkers in differentiating AD from non-AD. This suggests that the Aβ42 to p-tau181 ratio will increasingly play a crucial role in distinguishing AD from other conditions with similar clinical manifestations. However, CSF testing necessitates lumbar puncture, a procedure that is complex and often results in low patient compliance (21). Therefore, it is essential to further optimize detection methods to enhance their convenience and acceptability. Additionally, ongoing research that combines other non-invasive or minimally invasive markers, such as blood markers, is expected to provide a more comprehensive solution for the early diagnosis of AD (22).
Although this study provides valuable insights, it is not without limitations. Firstly, the primary detection method for core CSF biomarkers employed in the included studies was ELISA, which may have constrained the generalizability of the findings (23). Second, the included studies contain retrospective studies, which may bring about certain heterogeneity (24). Third, the included studies lacked pathological confirmation, potentially leading to false-positive or false-negative results. The last point highlights the heterogeneity present in the included research sections. Additionally, beyond the eight core CSF biomarkers mentioned, other biomarkers such as p-tau205 should also be considered. However, due to the limited number of studies available, no research meeting the necessary criteria for in-depth analysis has been identified. Future studies should integrate clinical practice, include a broader range of core CSF biomarkers, verify the diagnostic efficacy of these biomarkers across diverse populations, and investigate other potential biomarkers.
5 Conclusion
This study employs a Bayesian meta-analysis approach to confirm the significance of core CSF biomarkers in the diagnosis of AD, particularly the single biomarker p-tau217 and the biomarker ratio Aβ42/p-tau181. The high AUC values and sensitivity of these biomarkers indicate their substantial potential for early identification of AD patients, providing valuable reference tools for clinicians. Future research will further expand the sample size, delve into the mechanisms of action of core CSF biomarkers in AD, and optimize diagnostic methods to enhance the diagnostic accuracy and clinical applicability of AD.
Statements
Author contributions
BD: Validation, Project administration, Formal analysis, Writing – original draft. YanZ: Data curation, Visualization, Investigation, Writing – review & editing, Software. YG: Validation, Data curation, Writing – review & editing. YafZ: Data curation, Resources, Writing – review & editing. LM: Funding acquisition, Resources, Supervision, Methodology, Writing – review & editing, Conceptualization. LC: Funding acquisition, Writing – review & editing, Resources, Methodology, Conceptualization, Supervision.
Funding
The author(s) declare that financial support was received for the research and/or publication of this article. The study was supported by grants from Guangdong Provincial Innovation and Entrepreneurship Training Program for Undergraduates (No. S2025105591550; No. S202510559192X); Guangzhou Chinese medicine and integrated traditional Chinese and Western medicine science and technology project of China (20242A010020).
Conflict of interest
The authors declare that the research was conducted in the absence of any commercial or financial relationships that could be construed as a potential conflict of interest.
Generative AI statement
The authors declare that no Gen AI was used in the creation of this manuscript.
Any alternative text (alt text) provided alongside figures in this article has been generated by Frontiers with the support of artificial intelligence and reasonable efforts have been made to ensure accuracy, including review by the authors wherever possible. If you identify any issues, please contact us.
Publisher’s note
All claims expressed in this article are solely those of the authors and do not necessarily represent those of their affiliated organizations, or those of the publisher, the editors and the reviewers. Any product that may be evaluated in this article, or claim that may be made by its manufacturer, is not guaranteed or endorsed by the publisher.
References
1.
Guo Q Zheng X Yang P Pang X Qian K Wang P et al . Small interfering RNA delivery to the neurons near the amyloid plaques for improved treatment of Alzheimer′s disease. Acta Pharm Sin B. (2019) 9:590–603. doi: 10.1016/j.apsb.2018.12.010
2.
Weber C Dilthey A Finzer P . The role of microbiome-host interactions in the development of Alzheimer’s disease. Front Cell Infect Microbiol. (2023) 13:1151021. doi: 10.3389/fcimb.2023.1151021
3.
Dai Z He Y . Disrupted structural and functional brain connectomes in mild cognitive impairment and Alzheimer's disease. Neurosci Bull. (2014) 30:217–32. doi: 10.1007/s12264-013-1421-0
4.
Li Z Yang N He L Wang J Yang Y Ping F et al . Global burden of dementia death from 1990 to 2019, with projections to 2050: an analysis of 2019 global burden of disease study. J Prev Alzheimers Dis. (2024) 11:1013–21. doi: 10.14283/jpad.2024.21
5.
World Health Organization . Global status report on the public health response to dementia: executive summary. Geneva: World Health Organization (2021).
6.
Zhang X Guo T Zhang Y Jiao M Ji L Dong Z et al . Global burden of Alzheimer's disease and other dementias attributed to metabolic risks from 1990 to 2021: results from the global burden of disease study 2021. BMC Psychiatry. (2024) 24:910. doi: 10.1186/s12888-024-06375-x
7.
Scheltens P De Strooper B Kivipelto M Holstege H Chételat G Teunissen CE et al . Alzheimer's disease. Lancet. (2021) 397:1577–90. doi: 10.1016/S0140-6736(20)32205-4
8.
Mu Y Chang KX Chen YF Yan K Wang CX Hua Q . Diagnosis of Alzheimer's disease: towards accuracy and accessibility. J Biol Methods. (2024) 11:e99010010. doi: 10.14440/jbm.2024.412
9.
Serrano-Pozo A Qian J Monsell SE Blacker D Gómez-Isla T Betensky RA et al . Mild to moderate Alzheimer dementia with insufficient neuropathological changes. Ann Neurol. (2014) 75:597–601. doi: 10.1002/ana.24125
10.
Jack CR Jr Bennett DA Blennow K Carrillo MC Dunn B Haeberlein SB et al . NIA-AA research framework: toward a biological definition of Alzheimer's disease. Alzheimers Dement. (2018) 14:535–62. doi: 10.1016/j.jalz.2018.02.018
11.
Lei D Mao C Li J Huang X Sha L Liu C et al . CSF biomarkers for early-onset Alzheimer's disease in Chinese population from PUMCH dementia cohort. Front Neurol. (2022) 13:1030019. doi: 10.3389/fneur.2022.1030019
12.
Dong W Cui MC Hu WZ Zeng Q Wang YL Zhang W et al . Genetic and molecular evaluation of SQSTM1/p62 on the Neuropathologies of Alzheimer's disease. Front Aging Neurosci. (2022) 14:829232. doi: 10.3389/fnagi.2022.829232
13.
Ashton NJ Puig-Pijoan A Milà-Alomà M Fernández-Lebrero A García-Escobar G González-Ortiz F et al . Plasma and CSF biomarkers in a memory clinic: head-to-head comparison of phosphorylated tau immunoassays. Alzheimers Dement. (2023) 19:1913–24. doi: 10.1002/alz.12841
14.
Karikari TK Emeršič A Vrillon A Lantero-Rodriguez J Ashton NJ Kramberger MG et al . Head-to-head comparison of clinical performance of CSF phospho-tau T181 and T217 biomarkers for Alzheimer's disease diagnosis. Alzheimers Dement. (2021) 17:755–67. doi: 10.1002/alz.12236
15.
White N Parsons R Collins G Barnett A . Evidence of questionable research practices in clinical prediction models. BMC Med. (2023) 21:339. doi: 10.1186/s12916-023-03048-6
16.
An S Lu W Zhang Y Yuan Q Wang D . Pharmacological basis for use of Armillaria mellea polysaccharides in Alzheimer's disease: Antiapoptosis and Antioxidation. Oxidative Med Cell Longev. (2017) 2017:4184562. doi: 10.1155/2017/4184562
17.
National Health Commission Capacity Building and Continuing Education Center . Chinese guideline for clinical application of fluid biomarkers for Alzheimer's disease (2024 edition). Zhonghua Yi Xue Za Zhi. (2024) 104:3292–306. doi: 10.3760/cma.j.cn112137-20240523-01174
18.
Ashton NJ Benedet AL Pascoal TA Karikari TK Lantero-Rodriguez J Brum WS et al . Cerebrospinal fluid p-tau231 as an early indicator of emerging pathology in Alzheimer's disease. EBioMedicine. (2022) 76:103836. doi: 10.1016/j.ebiom.2022.103836
19.
Janelidze S Stomrud E Smith R Palmqvist S Mattsson N Airey DC et al . Cerebrospinal fluid p-tau217 performs better than p-tau181 as a biomarker of Alzheimer's disease. Nat Commun. (2020) 11:1683. doi: 10.1038/s41467-020-15436-0
20.
Casey E Li Z Liang D Ebelt S Levey AI Lah JJ et al . Association between fine particulate matter exposure and cerebrospinal fluid biomarkers of Alzheimer's disease among a cognitively healthy population-based cohort. Environ Health Perspect. (2024) 132:47001. doi: 10.1289/ehp13503
21.
Suridjan I van der Flier WM Monsch AU Burnie N Baldor R Sabbagh M et al . Blood-based biomarkers in Alzheimer's disease: future directions for implementation. Alzheimers Dement (Amst). (2023) 15:e12508. doi: 10.1002/dad2.12508
22.
Rudolph MD Sutphen CL Register TC Whitlow CT Solingapuram Sai KK Hughes TM et al . Associations among plasma, MRI, and amyloid PET biomarkers of Alzheimer's disease and related dementias and the impact of health-related comorbidities in a community-dwelling cohort. Alzheimers Dement. (2024) 20:4159–73. doi: 10.1002/alz.13835
23.
Yang W Guan F Yang L Shou G Zhu F Xu Y et al . Highly sensitive blood-based biomarkers detection of beta-amyloid and phosphorylated-tau181 for Alzheimer's disease. Front Neurol. (2024) 15:1445479. doi: 10.3389/fneur.2024.1445479
24.
Hansson O Seibyl J Stomrud E Zetterberg H Trojanowski JQ Bittner T et al . CSF biomarkers of Alzheimer's disease concord with amyloid-β PET and predict clinical progression: a study of fully automated immunoassays in BioFINDER and ADNI cohorts. Alzheimers Dement. (2018) 14:1470–81. doi: 10.1016/j.jalz.2018.01.010
25.
Slaets S Le Bastard N Martin JJ Sleegers K Van Broeckhoven C De Deyn PP et al . Cerebrospinal fluid Aβ1-40 improves differential dementia diagnosis in patients with intermediate P-tau181P levels. J Alzheimer's Dis. (2013) 36:759–67. doi: 10.3233/jad-130107
26.
Dumurgier J Schraen S Gabelle A Vercruysse O Bombois S Laplanche JL et al . Cerebrospinal fluid amyloid-β 42/40 ratio in clinical setting of memory centers: a multicentric study. Alzheimer's Res Ther. (2015) 7:30. doi: 10.1186/s13195-015-0114-5
27.
Struyfs H Van Broeck B Timmers M Fransen E Sleegers K Van Broeckhoven C et al . Diagnostic accuracy of cerebrospinal fluid amyloid-β isoforms for early and differential dementia diagnosis. J Alzheimer's Dis. (2015) 45:813–22. doi: 10.3233/jad-141986
28.
Bousiges O Cretin B Lavaux T Philippi N Jung B Hezard S et al . Diagnostic value of cerebrospinal fluid biomarkers (Phospho-Tau181, total-tau, Aβ42, and Aβ40) in prodromal stage of Alzheimer's disease and dementia with Lewy bodies. J Alzheimer's Dis. (2016) 51:1069–83. doi: 10.3233/jad-150731
29.
Constantinides VC Paraskevas GP Boufidou F Bourbouli M Pyrgelis ES Stefanis L et al . CSF Aβ42 and Aβ42/Aβ40 ratio in Alzheimer's disease and frontotemporal dementias. Diagnostics (Basel). (2023) 13:783. doi: 10.3390/diagnostics13040783
30.
Ortner M Goldhardt O Diehl-Schmid J Yakushev I Lanz K Hedderich DM et al . Elecsys cerebrospinal fluid assays accurately distinguish Alzheimer's disease from frontotemporal lobar degeneration. J Prev Alzheimers Dis. (2022) 9:491–8. doi: 10.14283/jpad.2022.27
31.
Oudart JB Djerada Z Nonnonhou V Badr S Bertholon LA Dammak A et al . Incremental value of CSF biomarkers in clinically diagnosed AD and non-AD dementia. Front Neurol. (2020) 11:560. doi: 10.3389/fneur.2020.00560
32.
Baldeiras I Santana I Leitão MJ Ribeiro MH Pascoal R Duro D et al . Cerebrospinal fluid Aβ40 is similarly reduced in patients with frontotemporal lobar degeneration and Alzheimer's disease. J Neurol Sci. (2015) 358:308–16. doi: 10.1016/j.jns.2015.09.022
33.
Mazzeo S Emiliani F Bagnoli S Padiglioni S Del Re LM Giacomucci G et al . Alzheimer's disease CSF biomarker profiles in idiopathic Normal pressure hydrocephalus. J Pers Med. (2022) 12:935. doi: 10.3390/jpm12060935
34.
Keshavan A Wellington H Chen Z Khatun A Chapman M Hart M et al . Concordance of CSF measures of Alzheimer's pathology with amyloid PET status in a preclinical cohort: a comparison of Lumipulse and established immunoassays. Alzheimers Dement (Amst). (2021) 13:e12131. doi: 10.1002/dad2.12131
35.
Dorey A Perret-Liaudet A Tholance Y Fourier A Quadrio I . Cerebrospinal fluid Aβ40 improves the interpretation of Aβ42 concentration for diagnosing Alzheimer's disease. Front Neurol. (2015) 6:247. doi: 10.3389/fneur.2015.00247
36.
Frölich L Peters O Lewczuk P Gruber O Teipel SJ Gertz HJ et al . Incremental value of biomarker combinations to predict progression of mild cognitive impairment to Alzheimer's dementia. Alzheimer's Res Ther. (2017) 9:84. doi: 10.1186/s13195-017-0301-7
37.
Abildgaard A Parkner T Knudsen CS Gottrup H Klit H . Diagnostic cut-offs for CSF β-amyloid and tau proteins in a Danish dementia clinic. Clin Chim Acta. (2023) 539:244–9. doi: 10.1016/j.cca.2022.12.023
38.
Struyfs H Niemantsverdriet E Goossens J Fransen E Martin JJ De Deyn PP et al . Cerebrospinal fluid P-Tau181P: biomarker for improved differential dementia diagnosis. Front Neurol. (2015) 6:138. doi: 10.3389/fneur.2015.00138
39.
Chiasserini D Biscetti L Eusebi P Salvadori N Frattini G Simoni S et al . Differential role of CSF fatty acid binding protein 3, α-synuclein, and Alzheimer's disease core biomarkers in Lewy body disorders and Alzheimer's dementia. Alzheimer's Res Ther. (2017) 9:52. doi: 10.1186/s13195-017-0276-4
40.
Baiardi S Quadalti C Mammana A Dellavalle S Zenesini C Sambati L et al . Diagnostic value of plasma p-tau181, NfL, and GFAP in a clinical setting cohort of prevalent neurodegenerative dementias. Alzheimer's Res Ther. (2022) 14:153. doi: 10.1186/s13195-022-01093-6
41.
Vergallo A Carlesi C Pagni C Giorgi FS Baldacci F Petrozzi L et al . A single center study: Aβ42/p-tau(181) CSF ratio to discriminate AD from FTD in clinical setting. Neurol Sci. (2017) 38:1791–7. doi: 10.1007/s10072-017-3053-z
42.
Forlenza OV Radanovic M Talib LL Aprahamian I Diniz BS Zetterberg H et al . Cerebrospinal fluid biomarkers in Alzheimer's disease: diagnostic accuracy and prediction of dementia. Alzheimers Dement (Amst). (2015) 1:455–63. doi: 10.1016/j.dadm.2015.09.003
43.
Perani D Cerami C Caminiti SP Santangelo R Coppi E Ferrari L et al . Cross-validation of biomarkers for the early differential diagnosis and prognosis of dementia in a clinical setting. Eur J Nucl Med Mol Imaging. (2016) 43:499–508. doi: 10.1007/s00259-015-3170-y
44.
Leuzy A Mattsson-Carlgren N Palmqvist S Janelidze S Dage JL Hansson O . Blood-based biomarkers for Alzheimer's disease. EMBO Mol Med. (2022) 14:e14408. doi: 10.15252/emmm.202114408
45.
Wojdała AL Bellomo G Gaetani L Toja A Chipi E Shan D et al . Trajectories of CSF and plasma biomarkers across Alzheimer's disease continuum: disease staging by NF-L, p-tau181, and GFAP. Neurobiol Dis. (2023) 189:106356. doi: 10.1016/j.nbd.2023.106356
46.
Pilotto A Quaresima V Trasciatti C Tolassi C Bertoli D Mordenti C et al . Plasma p-tau217 in Alzheimer's disease: Lumipulse and ALZpath SIMOA head-to-head comparison. Brain. (2025) 148:408–15. doi: 10.1093/brain/awae368
Summary
Keywords
Bayesian meta-analysis, Alzheimer’s disease, core cerebrospinal fluid biomarkers, β-Amyloid protein, tau protein, diagnostic performance evaluation
Citation
Deng B, Zheng Y, Gao Y, Zhuang Y, Ma L and Cao L (2025) Evaluation of the diagnostic efficacy of core biomarkers in cerebrospinal fluid for Alzheimer’s disease: a systematic review and meta-analysis. Front. Neurol. 16:1667402. doi: 10.3389/fneur.2025.1667402
Received
25 July 2025
Accepted
21 August 2025
Published
30 September 2025
Volume
16 - 2025
Edited by
Lucas Caldi Gomes, NanoTemper Technologies GmbH, Germany
Reviewed by
José Antonio Monge-Argilés, Hospital General Universitario de Alicante, Spain
Dan Lei, Tsinghua University, China
Updates
Copyright
© 2025 Deng, Zheng, Gao, Zhuang, Ma and Cao.
This is an open-access article distributed under the terms of the Creative Commons Attribution License (CC BY). The use, distribution or reproduction in other forums is permitted, provided the original author(s) and the copyright owner(s) are credited and that the original publication in this journal is cited, in accordance with accepted academic practice. No use, distribution or reproduction is permitted which does not comply with these terms.
*Correspondence: Li Ma, mali1906@jnu.edu.cn; Lihui Cao, hui5244@gzhmu.edu.cn
†These authors have contributed equally to this work
Disclaimer
All claims expressed in this article are solely those of the authors and do not necessarily represent those of their affiliated organizations, or those of the publisher, the editors and the reviewers. Any product that may be evaluated in this article or claim that may be made by its manufacturer is not guaranteed or endorsed by the publisher.