Abstract
Introduction:
Acute ischemic stroke is a major cause of global mortality and disability. This study aimed to investigate the association between mean corpuscular volume (MCV) and 3-month outcomes in acute ischemic stroke patients.
Methods:
This study is a secondary analysis based on a prospective cohort study conducted at a single center in Korea from January 2010 to December 2016. The study included 1,906 acute ischemic stroke patients. The exposure variable was MCV measured within 24 hours of admission, and the outcome variable was the modified Rankin Scale (mRS) score at 3 months post-admission. Covariates included age, gender, body mass index, hemoglobin, hematocrit, liver function indicators, diabetes history, and stroke etiology.
Results:
Piecewise linear regression analysis revealed a non-linear U‑shaped association of MCV on adverse outcomes, with a critical turning point at 92.1 fl. After full adjustment (Model 3), when MCV was below 92.1 fL, each 1 fL increase was associated with an 8% lower odds of poor 3-month outcome (OR = 0.92, 95% CI: 0.88–0.96, p = 0.0003). Conversely, when MCV exceeded 92.1 fL, each 1 fL increase was associated with a 4% higher odds of poor outcome (OR = 1.04, 95% CI: 1.00–1.08, p = 0.0391).
Conclusion:
There was a U‑shaped association between MCV and three-month outcome in patients with acute ischemic stroke.
Introduction
Acute ischemic stroke (AIS) is a major cause of death and disability worldwide (1, 2). According to a 2021 study, approximately 12 million people experience a stroke each year globally, with acute ischemic stroke accounting for about 87% of all stroke cases (3). In China, the incidence of acute ischemic stroke is also increasing annually, with data from 2019 indicating that there are about 3 million new stroke cases each year, the majority of which are acute ischemic strokes (4, 5). Three-month outcomes, such as functional recovery and mortality rates, are key indicators for assessing the prognosis of stroke patients (6). Research has found that the mortality rate for acute ischemic stroke patients within 3 months is approximately 20 to 30% (7), while the proportion of functional recovery varies depending on the patients’ clinical characteristics and treatment measures.
Mean corpuscular volume (MCV) refers to the average volume of red blood cells and is typically used to assess the type of anemia and the health status of red blood cells (8). The normal range for MCV is typically 80–100 fL (9). Recent studies have shown that MCV is associated not only with anemia but also with the incidence and poor prognosis of various diseases. For example, elevated MCV has been found to be associated with increased mortality in patients with cardiovascular diseases (10). Additionally, changes in MCV are considered potential biomarkers for poor prognosis in various clinical conditions (11).
According to the existing literature, there is some controversy regarding the relationship between mean corpuscular volume (MCV) and 3 month outcomes in stroke patients. Some studies have shown that MCV is associated with the prognosis of stroke patients (12). For instance, research has found that MCV is related to functional outcomes in stroke patients (13). However, other studies have failed to find a significant association between MCV and 3 month outcomes, or the results are inconsistent, potentially influenced by sample size, study design, or other confounding factors (14). Importantly, while several studies have examined linear associations between MCV and stroke prognosis, the potential non-linear relationship—such as threshold or U-shaped patterns—has not been adequately explored. Therefore, this study aimed to investigate the non-linear association between MCV and 3 month functional outcomes in patients with acute ischemic stroke through a secondary analysis based on a prospective cohort, thereby providing new insights into its prognostic significance.
Methods
Study population
This study is a secondary analysis based on a previously published prospective cohort study conducted at a single tertiary center in South Korea from January 2010 to December 2016, involving patients with acute ischemic stroke who were admitted within 7 days of the study period. A total of 1,906 patients were included in the analysis. Exclusion criteria included a lack of laboratory information or swallowing function assessment within 24 h of admission, as well as missing 3 month mRS score data. Patients who did not undergo swallowing function assessment were excluded, as early swallowing function evaluation may impact the prevention of complications and prognosis. The flow chart of the study is shown in Figure 1.
Figure 1

Flow chart of study population.
Data source
This study utilized data from a previously published research by Kang et al. (15), which investigated the relationship between geriatric nutritional risk index and outcomes in acute ischemic stroke patients. The original dataset was accessed through an open-access publication under the Creative Commons Attribution License. The source study was conducted at a single tertiary hospital in South Korea. Data can be downloaded from the ‘PLos one’ database.1
Variables
The exposure variable in this study was mean corpuscular volume (MCV), measured using an automated blood cell analyzer within 24 h of admission. The outcome variable was the 3 month functional outcome, determined by the modified Rankin Scale (mRS) score. Covariates included age, sex, body mass index (BMI), hemoglobin, hematocrit, aspartate aminotransferase, blood urea nitrogen, albumin, fibrinogen, diabetes, history of stroke or transient ischemic attack, hypertension, coronary heart disease, stroke etiology, smoking history, and NIHSS score. Univariate logistic regression was first performed to identify variables potentially associated with the 3 month outcome (p < 0.10). These variables, together with clinically important factors reported in previous studies (e.g., age, sex, NIHSS score), were included in the multivariate model to control for confounding. Covariates were chosen based on clinical relevance and prior evidence linking them to both MCV and stroke prognosis. Missing data were minimal; triglyceride (TG) values were missing for 9 participants (<0.5%), and no missing values were observed for other variables. Thus, the influence of missing data on the overall results is likely negligible.
Outcomes
Functional outcomes were assessed using the modified Rankin Scale (mRS) at 3 months after acute ischemic stroke onset. Outcome data were obtained through outpatient clinical visits or standardized telephone interviews. Based on the mRS scores, patients were dichotomized into two groups: favorable outcome (mRS 0–2) and unfavorable outcome (mRS 3–6).
Statistical analysis
Continuous variables are presented as mean ± standard deviation or median (interquartile range), and categorical variables as numbers (percentages). Patients were stratified into quartiles based on mean corpuscular volume levels. One-way analysis of variance (ANOVA) was used to compare continuous variables among groups, while categorical variables were compared using chi-square tests. Generalized additive models (GAM) were employed to explore the dose–response relationship between mean corpuscular volume and outcomes. Logistic regression models were used to evaluate the association between mean corpuscular volume and 3 month outcomes, adjusting for confounding factors including age, sex, BMI, laboratory parameters (hemoglobin, hematocrit, AST, BUN, albumin, fibrinogen), underlying conditions (diabetes, previous stroke/TIA, hypertension, coronary heart disease), and clinical characteristics (stroke etiology, smoking status, NIHSS score).
A two-piecewise linear regression model was applied to examine the threshold effect between mean corpuscular volume and outcomes. The turning point was determined through “exploratory” analysis by moving the trial turning point along a pre-defined interval and selecting the point that yielded the maximum model likelihood. Log-likelihood ratio tests were performed to compare the fitness of one-line linear regression models with two-piecewise linear regression models. All statistical analyses were performed using R software version 4.0.3.2 A two-sided p < 0.05 was considered statistically significant.
Additionally, to assess the robustness of the observed associations to potential unmeasured confounding, E-values were calculated for the main odds ratios according to the method proposed by Vander Weele and Ding (16).
Ethics statement
This study was a secondary analysis based on a previous prospective cohort study conducted at Seoul National University Hospital. All methods were performed in accordance with the relevant guidelines and regulations. The original study was approved by the Institutional Review Board of Seoul National University Hospital, and the Institutional Review Board waived the need for informed consent (IRB No. 1009–062-332).
Results
Characteristics of participants
Based on an analysis of 1,906 participants stratified into four quartiles by Mean Corpuscular Volume (MCV), we identified significant differences in demographic, metabolic, and clinical characteristics (most comparisons p < 0.001). Notable age-related trends were observed, with the proportion of participants under 60 years decreasing from 32.20 to 15.91%, while the proportion aged 70–80 years increased from 29.87 to 40.29% (p < 0.001). As MCV increased, the Body Mass Index (BMI) showed a significant decline from 23.70 ± 3.22 to 22.93 ± 3.11 (p < 0.001). Additionally, lipid profile alterations included a decrease in Total Cholesterol (TC) from 181.71 ± 46.95 mg/dL to 173.49 ± 42.15 mg/dL (p = 0.010), an increase in High-Density Lipoprotein Cholesterol (HDL-C) from 41.65 ± 16.60 mg/dL to 46.37 ± 16.87 mg/dL (p < 0.001), and a decline in Low-Density Lipoprotein Cholesterol (LDL-C) from 106.58 ± 45.30 mg/dL to 98.88 ± 38.58 mg/dL (p = 0.011). The prevalence of Diabetes Mellitus decreased from 42.16 to 27.69% (p < 0.001), while Atrial Fibrillation increased from 16.53 to 29.96% (p < 0.001). Stroke etiology also changed, with the proportion of Large Artery Atherosclerosis (LAA) decreasing from 37.08 to 26.45% and Cardioembolism increasing from 20.13 to 34.71% (p < 0.001). These findings suggest a complex interplay between MCV levels and age-related metabolic and cardiovascular modifications, indicating that MCV may serve as a potential biomarker reflecting systemic physiological changes across different life stages (Table 1).
Table 1
| Parameters | MCV (fl) | p-value | |||
|---|---|---|---|---|---|
| Quartile 1 | Quartile 2 | Quartile 3 | Quartile 4 | ||
| 65.9–89.8 | 89.9–92.8 | 92.9–95.9 | 96.0–121.5 | ||
| n = 472 | n = 481 | n = 469 | n = 484 | ||
| Continuous | |||||
| BMI (kg/m2), mean ± sd | 23.70 ± 3.22 | 23.95 ± 3.39 | 23.41 ± 3.21 | 22.93 ± 3.11 | <0.001 |
| HGB (g/dL), mean ± sd | 13.34 ± 2.14 | 13.72 ± 1.89 | 13.55 ± 1.95 | 13.31 ± 2.01 | 0.004 |
| HCT (%), mean ± sd | 39.53 ± 5.75 | 40.66 ± 5.28 | 40.30 ± 5.56 | 39.80 ± 5.72 | 0.009 |
| PLT (10^9/L), mean ± sd | 240.38 ± 81.60 | 231.16 ± 66.28 | 219.43 ± 67.84 | 203.81 ± 63.22 | <0.001 |
| TC (mg/dL), mean ± sd | 181.71 ± 46.95 | 181.52 ± 42.75 | 180.44 ± 43.47 | 173.49 ± 42.15 | 0.010 |
| TG* (mg/dL), mean ± sd | 108.72 ± 66.74 | 110.82 ± 61.36 | 101.73 ± 55.56 | 100.12 ± 55.01 | 0.013 |
| HDL-c (mg/dL), mean ± sd | 41.65 ± 16.60 | 43.81 ± 15.58 | 44.77 ± 17.83 | 46.37 ± 16.87 | <0.001 |
| LDL-c (mg/dL), mean ± sd | 106.58 ± 45.30 | 106.89 ± 41.76 | 104.35 ± 43.41 | 98.88 ± 38.58 | 0.011 |
| BUN (mg/dL),median (quartile) | 15.00 (12.00–19.00) | 15.00 (12.00–19.00) | 16.00 (13.00–19.00) | 16.50 (13.00–21.00) | 0.006 |
| Scr (mg/dL), median (quartile) | 0.88 (0.73–1.09) | 0.88 (0.73–1.07) | 0.89 (0.73–1.05) | 0.91 (0.76–1.12) | 0.065 |
| AST (U/L), median (quartile) | 22.00 (17.00–28.00) | 23.00 (18.00–29.00) | 23.00 (19.00–29.00) | 24.00 (20.00–31.00) | <0.001 |
| ALT (U/L), median (quartile) | 18.00 (13.00–28.00) | 19.00 (14.00–26.00) | 18.00 (14.00–25.00) | 18.00 (13.00–26.00) | 0.473 |
| ALB (g/dL), mean ± sd | 4.05 ± 0.46 | 4.05 ± 0.43 | 4.02 ± 0.41 | 3.95 ± 0.41 | 0.001 |
| HBA1c (%), mean ± sd | 5.29 ± 3.00 | 5.09 ± 2.77 | 5.17 ± 2.57 | 4.83 ± 2.64 | 0.071 |
| FIB (mg/L), mean ± sd | 337.16 ± 97.17 | 329.17 ± 91.82 | 330.56 ± 87.60 | 324.60 ± 90.73 | 0.206 |
| NIHSS score, median (quartile) | 3.00 (1.00–7.00) | 3.00 (1.00–7.00) | 3.00 (1.00–7.00) | 4.00 (1.00–8.00) | 0.290 |
| Categorical | |||||
| Sex, n (%) | 0.865 | ||||
| Male | 290 (61.44%) | 294 (61.12%) | 281 (59.91%) | 303 (62.60%) | |
| Female | 182 (38.56%) | 187 (38.88%) | 188 (40.09%) | 181 (37.40%) | |
| Age (years), n (%) | <0.001 | ||||
| <60 | 152 (32.20%) | 114 (23.70%) | 93 (19.83%) | 77 (15.91%) | |
| 60 to <70 | 115 (24.36%) | 140 (29.11%) | 126 (26.87%) | 124 (25.62%) | |
| 70 to <80 | 141 (29.87%) | 162 (33.68%) | 172 (36.67%) | 195 (40.29%) | |
| ≥80 | 64 (13.56%) | 65 (13.51%) | 78 (16.63%) | 88 (18.18%) | |
| Previous stroke/TIA, n (%) | 107 (22.67%) | 94 (19.54%) | 90 (19.19%) | 111 (22.93%) | 0.333 |
| Hypertension, n (%) | 307 (65.04%) | 314 (65.28%) | 294 (62.69%) | 296 (61.16%) | 0.489 |
| Diabetes, n (%) | 199 (42.16%) | 160 (33.26%) | 121 (25.80%) | 134 (27.69%) | <0.001 |
| Smoking, n (%) | 173 (36.65%) | 207 (43.04%) | 184 (39.23%) | 186 (38.43%) | 0.226 |
| Atrial fibrillation, n (%) | 78 (16.53%) | 93 (19.33%) | 91 (19.40%) | 145 (29.96%) | <0.001 |
| CHD, n (%) | 53 (11.23%) | 54 (11.23%) | 43 (9.17%) | 70 (14.46%) | 0.081 |
| Stroke etiology, n (%) | <0.001 | ||||
| LAA | 175 (37.08%) | 160 (33.26%) | 144 (30.70%) | 128 (26.45%) | |
| SVO | 82 (17.37%) | 102 (21.21%) | 93 (19.83%) | 88 (18.18%) | |
| CE | 95 (20.13%) | 108 (22.45%) | 122 (26.01%) | 168 (34.71%) | |
| Other determined | 57 (12.08%) | 38 (7.90%) | 36 (7.68%) | 40 (8.26%) | |
| Undetermined | 63 (13.35%) | 73 (15.18%) | 74 (15.78%) | 60 (12.40%) | |
| The unfavorable outcome | 99 (29.46%) | 85 (22.79%) | 84 (24.14%) | 91 (26.69%) | 0.189 |
Baseline characteristics and 3 month outcomes according to quartiles of mean corpuscular volume (MCV) (n = 1,906).
Data are presented as mean ± standard deviation (SD), median (interquartile range), or percentage, as appropriate. *Triglyceride (TG) data were missing for 9 participants (<0.5%), while no missing values were observed for other variables.
MCV, mean corpuscular volume; BMI, body mass index; HGB, hemoglobin; HCT, hematocrit; PLT, platelet count; TC, total cholesterol; TG, triglyceride; HDL-C, high-density lipoprotein cholesterol; LDL-C, low-density lipoprotein cholesterol; BUN, blood urea nitrogen; Scr, serum creatinine; AST, aspartate aminotransferase; ALT, alanine aminotransferase; ALB, albumin; FIB, fibrinogen; NIHSS, National Institutes of Health Stroke Scale; CHD, coronary heart disease; TIA, transient ischemic attack.
Unadjusted association between baseline variables and the unfavorable outcomes
In this comprehensive univariate analysis of stroke patients, we systematically evaluated the impact of various demographic, clinical, and biological factors on stroke unfavorable outcomes. The results revealed several significant risk and protective factors (Table 2).
Table 2
| Parameters | Statistics | Odds ratio (95% CI) | p value |
|---|---|---|---|
| MCV (fl) | 92.96 ± 5.22 | 0.99 (0.97, 1.01) | 0.2187 |
| MCV (fl) quartile | |||
| Q1 | 472 (24.76%) | Reference | |
| Q2 | 481 (25.24%) | 0.68 (0.51, 0.90) | 0.0074 |
| Q3 | 469 (24.61%) | 0.74 (0.56, 0.97) | 0.0323 |
| Q4 | 484 (25.39%) | 0.86 (0.65, 1.13) | 0.2720 |
| Sex, n (%) | |||
| Male | 1,168 (61.28%) | Reference | |
| Female | 738 (38.72%) | 1.66 (1.36, 2.03) | <0.0001 |
| Age (years), n (%) | |||
| <60 | 436 (22.88%) | Reference | |
| 60 to <70 | 505 (26.50%) | 1.15 (0.84, 1.59) | 0.3801 |
| 70 to <80 | 670 (35.15%) | 1.90 (1.42, 2.54) | <0.0001 |
| ≥80 | 295 (15.48%) | 4.00 (2.87, 5.56) | <0.0001 |
| BMI (kg/m2), mean ± sd | 23.50 ± 3.25 | 0.92 (0.89, 0.94) | <0.0001 |
| HGB (g/dL), mean ± sd | 13.48 ± 2.00 | 0.82 (0.78, 0.86) | <0.0001 |
| HCT (%), mean ± sd | 40.07 ± 5.59 | 0.93 (0.92, 0.95) | <0.0001 |
| PLT (10^9/L), mean ± sd | 223.61 ± 71.31 | 1.00 (1.00, 1.00) | 0.3042 |
| TC (mg/dL), mean ± sd | 179.26 ± 43.95 | 1.00 (0.99, 1.00) | 0.0002 |
| TG (mg/dL), mean ± sd | 105.34 ± 59.97 | 1.00 (0.99, 1.00) | <0.0001 |
| HDL-c (mg/dL), mean ± sd | 44.16 ± 16.81 | 0.99 (0.99, 1.00) | 0.0331 |
| LDL-c (mg/dL), mean ± sd | 104.15 ± 42.40 | 1.00 (0.99, 1.00) | 0.0011 |
| BUN (mg/dL), median (quartile) | 17.60 ± 8.88 | 1.02 (1.01, 1.03) | 0.0027 |
| Scr (mg/dL), median (quartile) | 1.09 ± 1.04 | 1.02 (0.93, 1.12) | 0.7316 |
| AST (U/L), median (quartile) | 26.11 ± 14.34 | 1.01 (1.00, 1.02) | 0.0086 |
| ALT (U/L), median (quartile) | 22.38 ± 16.10 | 0.99 (0.99, 1.00) | 0.0409 |
| ALB (g/dL), mean ± sd | 4.02 ± 0.43 | 0.27 (0.21, 0.35) | <0.0001 |
| HBA1c (%), mean ± sd | 5.09 ± 2.75 | 1.01 (0.97, 1.05) | 0.6481 |
| FIB (mg/L), mean ± sd | 330.33 ± 91.93 | 1.00 (1.00, 1.00) | <0.0001 |
| NIHSS score, median (quartile) | 5.39 ± 5.72 | 1.23 (1.20, 1.26) | <0.0001 |
| Previous stroke/TIA, n (%) | |||
| No | 1,504 (78.91%) | Reference | |
| Yes | 402 (21.09%) | 1.81 (1.44, 2.28) | <0.0001 |
| Hypertension, n (%) | |||
| No | 695 (36.46%) | Reference | |
| Yes | 1,211 (63.54%) | 1.34 (1.09, 1.66) | 0.0061 |
| Diabetes, n (%) | |||
| No | 1,292 (67.79%) | Reference | |
| Yes | 614 (32.21%) | 1.45 (1.17, 1.78) | 0.0005 |
| Smoking, n (%) | |||
| No | 1,156 (60.65%) | 1.0 | |
| Yes | 750 (39.35%) | 0.61 (0.49, 0.75) | <0.0001 |
| Atrial fibrillation, n (%) | |||
| No | 1,499 (78.65%) | Reference | |
| Yes | 407 (21.35%) | 2.00 (1.59, 2.52) | <0.0001 |
| CHD, n (%) | |||
| No | 1,686 (88.46%) | Reference | |
| Yes | 220 (11.54%) | 1.02 (0.75, 1.40) | 0.8768 |
| Stroke etiology, n (%) | |||
| LAA | 607 (31.85%) | Reference | |
| SVO | 365 (19.15%) | 0.62 (0.45, 0.85) | 0.0031 |
| CE | 493 (25.87%) | 1.49 (1.15, 1.92) | 0.0025 |
| Other determined | 171 (8.97%) | 2.06 (1.45, 2.93) | <0.0001 |
| Undetermined | 270 (14.17%) | 0.86 (0.61, 1.19) | 0.3598 |
The unadjusted association between baseline variables and the unfavorable outcome (n = 1906).
Data are expressed as mean ± SD, median (interquartile range), or percentage.
Gender analysis demonstrated that female patients have a significantly higher stroke unfavorable outcome risk compared to males (OR = 1.66, 95% CI: 1.36–2.03, p < 0.0001). Age emerged as a critical influencing factor, with particularly pronounced risk in populations over 70 years, where the stroke unfavorable outcome risk significantly increases (≥80 years group: OR = 4.00, 95% CI: 2.87–5.56, p < 0.0001) (Table 2).
Previous stroke/TIA history (OR = 1.81, 95% CI: 1.44–2.28, p < 0.0001) and atrial fibrillation (OR = 2.00, 95% CI: 1.59–2.52, p < 0.0001) substantially elevated stroke unfavorable outcomes risk. In the stroke etiology analysis, Cardiogenic Embolism (CE) and other determined cause groups showed 1.49-fold (95% CI: 1.15–1.92, p = 0.0025) and 2.06-fold (95% CI: 1.45–2.93, p < 0.0001) increased risks, respectively (Table 2).
Neurological deficit severity (NIHSS) demonstrated a significant positive correlation with stroke unfavorable outcome risk, with a 23% risk increase per point (OR = 1.23, 95% CI: 1.20–1.26, p < 0.0001). Notably, albumin levels exhibited a significant protective effect, with a 73% risk reduction per unit increase (OR = 0.27, 95% CI: 0.21–0.35, p < 0.0001) (Table 2).
Identification of nonlinear relationship
In investigating the impact of Mean Corpuscular Volume (MCV) on stroke unfavorable outcomes, we employed an innovative piecewise linear regression model, revealing the complex non-linear relationship between MCV and adverse clinical results (Figure 2; Table 3).
Figure 2
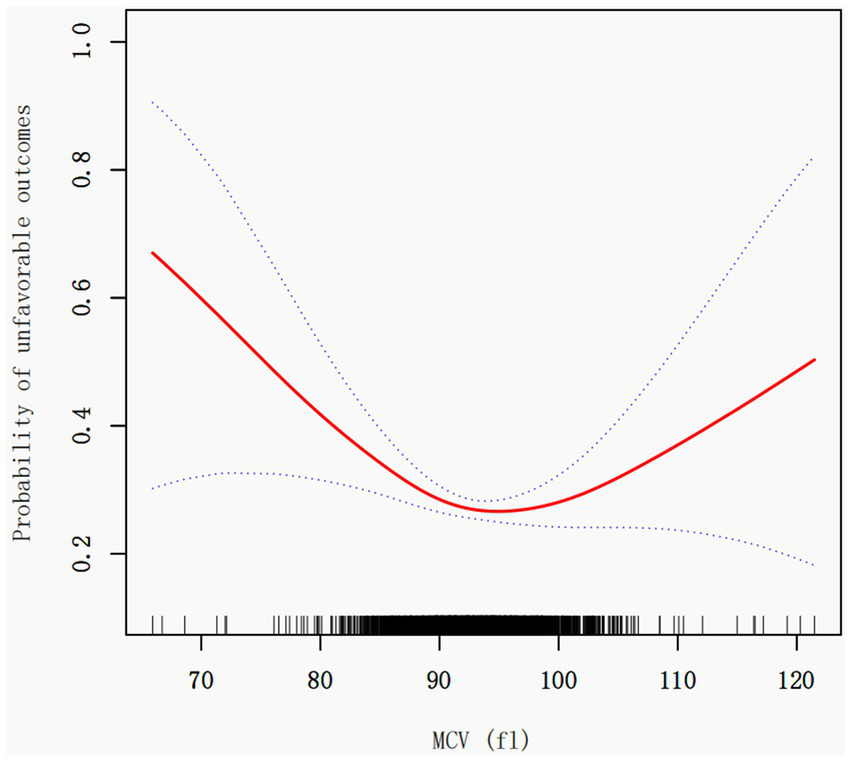
Association between MCV and the unfavorable outcome in patients with acute ischemic stroke. A threshold, nonlinear association between the MCV and 3 month outcome was found in a generalized additive model (GAM). The red solid line represents the smooth curve fit between variables. The blue bands represent the 95% confidence interval from the fit. Adjusted for age, sex, BMI, laboratory parameters (hemoglobin, hematocrit, AST, BUN, albumin, fibrinogen), underlying conditions (diabetes, previous stroke/TIA, hypertension, coronary heart disease), and clinical characteristics (stroke etiology, smoking status, NIHSS score).
Table 3
| Unfavorable outcome | Model I | Model II | Model III | |||
|---|---|---|---|---|---|---|
| OR (95%CI) | p value | OR (95%CI) | p value | OR (95%CI) | p value | |
| Fitting model by standard linear regression | ||||||
| One line effect | 0.99 (0.97, 1.01) | 0.2187 | 0.98 (0.96, 1.00) | 0.0143 | 0.99 (0.96, 1.01) | 0.2260 |
| Fitting model by two-piecewise linear regression | ||||||
| Turning point (K) | 92.1 | 92.3 | 92.1 | |||
| MCV < K | 0.92 (0.89, 0.95) | <0.0001 | 0.91 (0.88, 0.95) | <0.0001 | 0.92 (0.88, 0.96) | 0.0003 |
| MCV > K | 1.04 (1.01, 1.08) | 0.0052 | 1.03 (1.00, 1.07) | 0.0466 | 1.04 (1.00, 1.08) | 0.0391 |
| P value for LRT test* | <0.001 | <0.001 | <0.001 | |||
Threshold effect analysis of MCV and the unfavorable outcome.
Data are presented as odds ratios (OR) (95% confidence interval) and p values; Model I is not adjusted. Model II adjusted for age, sex, BMI. Model III adjusted for age, sex, BMI, HGB, HCT, AST, BUN, ALB, FIB, diabetes, previous stroke/TIA, hypertension, CHD, stroke etiology, smoking, NIHSS score. CI stands for confidence interval, OR stands for odds ratio, and LRT stands for likelihood ratio test. *p < 0.05 indicates that fitting model by two-piecewise linear regression is significantly different from fitting model by standard linear regression.
Through rigorous statistical analysis, we identified a critical MCV threshold point at 92.1 fl. Notably, the effect of MCV on unfavorable outcomes demonstrates significant variations before and after this threshold. Each 1 fL increase in MCV (when MCV < 92.1 fL) was associated with an 8% lower odds of poor 3 month outcome (OR = 0.92, 95% CI: 0.89–0.95, p < 0.0001). Conversely, when MCV exceeds 92.1 fl, the risk of unfavorable outcomes slightly increases [OR = 1.04, 95% CI: 1.01–1.08, p = 0.0052], with each unit increase in MCV resulting in a approximately 4% higher risk (Table 3).
The Likelihood Ratio Test (LRT) results (p < 0.001) provide robust support for the piecewise linear model’s significance, conclusively demonstrating the non-linear threshold effect between MCV and unfavorable outcomes.
To further evaluate the robustness of these findings to potential unmeasured confounding, E-values were calculated. The E-value for MCV < 92.1 fL was 1.43 and for MCV > 92.1 fL was 1.29, indicating moderate robustness to residual confounding.
In a sensitivity analysis excluding patients with baseline anemia (defined as hemoglobin <12 g/dL for women and <13 g/dL for men), 1,398 participants remained. The results (see Supplementary Table S1) were consistent with the main findings, confirming a persistent U-shaped association between MCV and 3 month unfavorable outcomes.
Discussion
In this cohort study involving 1,906 patients, the research innovatively employed a piecewise linear regression model to explore the U-shaped relationship between MCV and stroke prognosis. A critical threshold of 92.1 fl was identified: Each 1 fL increase in MCV (when MCV < 92.1 fL) was associated with an 8% lower odds of poor 3 month outcome (OR = 0.92, 95% CI: 0.89–0.95, p < 0.0001); conversely, when MCV exceeded 92.1 fl, each unit increase slightly elevated unfavorable outcome risk by about 4% (OR = 1.04, 95% CI: 1.01–1.08, p = 0.0052). To illustrate the clinical significance of the U-shaped relationship, we compared the absolute risk of unfavorable outcomes (mRS ≥ 3) across MCV quartiles. Patients at the lowest (Q1, 87.1 fL) and highest (Q4, 98.8 fL) quartiles had 6.7 and 3.9% higher risks of unfavorable outcomes compared with those near the threshold (Q2, 91.4 fL), respectively. This finding underscores that even modest deviations in MCV within the normal range may have prognostic implications.
MCV is a parameter in the complete blood count (CBC) used for the clinical differential diagnosis of anemia. Currently, only a few clinical studies have assessed the association between MCV and outcomes in cerebrovascular diseases. Zhang et al. (17) analyzed the relationship between Mean Corpuscular Volume (MCV) and 30-day mortality in intracerebral hemorrhage patients using the MIMIC-III database, finding significantly higher mortality in the high MCV group (≥92 fl). Wu et al. (18) further supported the association between MCV and disease prognosis, discovering a gradient relationship between MCV levels and mortality in ischemic stroke and ischemic heart disease among 66,294 Taiwanese individuals. Wang et al. (19) highlighted the close association between MCV and post-stroke psychiatric disorders. Gamaldo et al. (20) found that cognitive recovery in early post-stroke cognitive impairment survivors was related to MCV levels. Overall, although some studies support the association between MCV and outcomes in stroke patients, the diversity of research findings and methodological differences have prevented a clear consensus from forming. Therefore, it can be said that the research results in this field are controversial.
We observed a U-shaped association between MCV and 3 month outcomes in patients with acute ischemic stroke. The potential mechanisms underlying this relationship may involve multiple pathophysiological pathways. Several hypotheses have been proposed regarding how both elevated and decreased MCV levels might contribute to adverse cerebrovascular outcomes. First, larger red blood cells (RBCs) may become obstructed within the microcirculation, potentially increasing blood viscosity and reducing cerebral perfusion, which could exacerbate ischemic injury and lead to poorer functional outcomes (21). Secondly, higher MCV levels might reflect underlying metabolic or nutritional imbalances, such as iron or folate deficiency, low body mass index, low LDL cholesterol, or elevated homocysteine, all of which are associated with increased cerebrovascular risk (22). Third, the body’s antioxidant capacity may be linked to the total circulating RBC volume (23). thus, an increase in MCV could be associated with alterations in oxidative balance, which may partially explain the observed relationship. Conversely, a lower MCV is often observed in inflammatory states. In such conditions, elevated hepcidin levels can interfere with iron metabolism, reducing erythropoiesis, while increased IL-6 concentrations may suppress erythroid precursor proliferation, thereby decreasing MCV values (24). In addition, lower MCV levels have been associated with elevated thrombomodulin and activation of thrombin-activatable fibrinolysis inhibitor (TAFI), which may reduce fibrinolytic activity and increase thrombosis risk (25). Finally, microcytic anemia (MCV < 80 fL)—often related to iron deficiency or hemolytic anemia—could also partly explain the poorer prognosis observed among individuals with lower MCV values (26). Taken together, these hypotheses suggest possible biological pathways linking MCV to stroke outcomes; however, causal relationships cannot be established based on this observational study, and further experimental and longitudinal research is warranted to confirm these mechanisms.
Our study innovatively used a piecewise linear regression model to systematically reveal the non-linear U-shaped association between MCV and adverse outcomes, with a critical turning point at 92.1 fl. Compared to existing research, our methodology is more refined, not only quantifying MCV’s impact on prognosis but also elucidating its complex non-linear mechanism. The identified threshold of 92.1 fL lies within the conventional normal MCV range (80–100 fL), but closer to its lower limit, suggesting that even subtle reductions in MCV within the ‘normal’ range may carry prognostic significance. Previous studies support this interpretation: for instance, Li et al. (27) observed nonlinear relationships between MCV and cardiovascular mortality in a U.S. cohort; Wu et al. (18) reported that MCV is positively associated with vascular mortality in a Taiwanese population; and Wang et al. (28) found that MCV correlates with the severity of coronary artery disease. Therefore, the 92.1 fL cutoff identified in this study is clinically intuitive and highlights that mild microcytic tendencies may reflect subclinical inflammation or impaired erythropoiesis that adversely affect stroke recovery.
The primary strengths of our study lie in its innovative research design and rigorous data analysis strategies. First, we utilized data from a previously published Korean prospective cohort of acute ischemic stroke patients, which substantially enhanced the study’s sample size and representativeness. Second, we employed Logistic regression model, progressively adjusting for potential confounding factors such as age, gender, body mass index, hemoglobin, hematocrit, liver function indicators, diabetes history, and stroke etiology, substantially improving the internal validity of the results. Although this study did not include a priori sample size calculation, a post-hoc power analysis indicated that with a total of 1,906 participants and an unfavorable outcome rate of approximately 25%, the study had more than 90% statistical power to detect an association of the observed magnitude (OR = 0.92) at a two-sided α of 0.05. Therefore, the sample size was sufficient to ensure the reliability of the main findings.
Several inevitable limitations of this study warrant acknowledgment. First, this was a secondary analysis based on a single-center Korean prospective cohort study, which may limit the generalizability and external validity of our findings. Differences in ethnicity, dietary patterns, clinical management practices, and healthcare systems may influence MCV levels and stroke outcomes. Therefore, multi-center studies involving diverse populations are needed to confirm the external validity of these results. Second, despite the large sample size, caution is advised when applying our findings to other racial or geographical populations. Additionally, the inclusion criterion requiring completion of a swallowing function test may have introduced selection bias by excluding patients with severe neurological deficits or unstable conditions who were unable to undergo such testing. Consequently, the study population may not fully represent the entire spectrum of patients with acute ischemic stroke, and our findings should be interpreted with caution when extrapolated to broader populations. Third, as an observational study, despite employing rigorous statistical methods, we can only demonstrate an association between MCV and stroke prognosis rather than a causal relationship. Fourth, although we adjusted for multiple potential confounding factors, unmeasured confounders such as genetic background and lifestyle habits may still have influenced the results. Lastly, our study did not explore the underlying biological mechanisms driving the U-shaped association between MCV and outcomes, which should be addressed in future research.
Conclusion
In conclusion, a U-shaped association was observed between MCV and 3 month outcomes in patients with acute ischemic stroke. MCV may serve as a potential prognostic biomarker to assist in risk stratification. However, as this study was based on a single-center Korean cohort, caution should be exercised when generalizing these findings to other populations. Validation in multicenter and multiethnic cohorts is warranted to confirm the robustness and applicability of our results.
Statements
Data availability statement
The datasets presented in this study can be found in online repositories. The names of the repository/repositories and accession number(s) can be found in the article/Supplementary material.
Ethics statement
The studies involving humans were approved by the Institutional Review Board of Seoul National University Hospital. The studies were conducted in accordance with the local legislation and institutional requirements. The ethics committee/institutional review board waived the requirement of written informed consent for participation from the participants or the participants’ legal guardians/next of kin because The research involves secondary analysis of anonymized, pre-existing data from a prospective cohort study. No new interventions, biological samples, or personally identifiable information are collected. The study design poses no physical, psychological, or social risks beyond everyday life, meeting the criteria of “no greater than minimal risk” as defined in national ethical guidelines.
Author contributions
ZL: Conceptualization, Writing – original draft, Writing – review & editing. YM: Writing – original draft, Writing – review & editing. MZ: Formal analysis, Methodology, Writing – review & editing. FL: Conceptualization, Data curation, Writing – original draft, Writing – review & editing.
Funding
The author(s) declare that financial support was received for the research and/or publication of this article. This project was funded by the Wu Jieping Clinical Research Fund (No. 320.6750.2021-11-19) and 2024 Shenzhen Longgang Central Hospital In-Hospital Research Talent Training Program.
Acknowledgments
The author is very grateful to the data providers of the study.
Conflict of interest
The authors declare that the research was conducted in the absence of any commercial or financial relationships that could be construed as a potential conflict of interest.
Generative AI statement
The authors declare that no Gen AI was used in the creation of this manuscript.
Any alternative text (alt text) provided alongside figures in this article has been generated by Frontiers with the support of artificial intelligence and reasonable efforts have been made to ensure accuracy, including review by the authors wherever possible. If you identify any issues, please contact us.
Publisher’s note
All claims expressed in this article are solely those of the authors and do not necessarily represent those of their affiliated organizations, or those of the publisher, the editors and the reviewers. Any product that may be evaluated in this article, or claim that may be made by its manufacturer, is not guaranteed or endorsed by the publisher.
Supplementary material
The Supplementary material for this article can be found online at: https://www.frontiersin.org/articles/10.3389/fneur.2025.1675822/full#supplementary-material
SUPPLEMENTARY TABLE S1Threshold effect analysis of mean corpuscular volume (MCV) and 3 month unfavorable outcomes in non-anemic patients with acute ischemic stroke. Data are presented as odds ratios (OR) (95% confidence interval) and p values; Model I is not adjusted. Model II adjusted for age, sex, BMI. Model III adjusted for age, sex, BMI, HGB, HCT, AST, BUN, ALB, FIB, diabetes, previous stroke/TIA, hypertension, CHD, stroke etiology, smoking, NIHSS score. CI stands for confidence interval, OR stands for odds ratio, and LRT stands for likelihood ratio test. *p < 0.05 indicates that fitting model by two-piecewise linear regression is significantly different from fitting model by standard linear regression.
References
1.
Han Z Zhao W Lee H Wills M Tong Y Cheng Z et al . Remote ischemic conditioning with exercise (rice)-rehabilitative strategy in patients with acute ischemic stroke: rationale, design, and protocol for a randomized controlled study. Front Neurol. (2021) 12:654669. doi: 10.3389/fneur.2021.654669
2.
Liu Y Zhai TT Wang WJ Zhang YR Wei C Zhu L et al . Impact of covid-19 on acute ischemic stroke presentation and prognosis in a county-level stroke center. Eur Rev Med Pharmacol Sci. (2022) 26:5574–80. doi: 10.26355/eurrev_202208_29429
3.
GBD 2019 Stroke Collaborators . Global, regional, and national burden of stroke and its risk factors, 1990-2019: a systematic analysis for the global burden of disease study 2019. Lancet Neurol. (2021) 20:795–820. doi: 10.1016/S1474-4422(21)00252-0
4.
Wang YJ Li ZX Gu HQ Zhai Y Jiang Y Zhao XQ et al . China stroke statistics 2019: a report from the national center for healthcare quality management in neurological diseases, China national clinical research center for neurological diseases, the Chinese stroke association, national center for chronic and non-communicable disease control and prevention, Chinese center for disease control and prevention and institute for global neuroscience and stroke collaborations. Stroke Vasc Neurol. (2020) 5:211–39. doi: 10.1136/svn-2020-000457
5.
Zhu S Meng B Jiang J Wang X Luo N Liu N et al . The updated role of transcranial ultrasound neuromodulation in ischemic stroke: from clinical and basic research. Front Cell Neurosci. (2022) 16:839023. doi: 10.3389/fncel.2022.839023
6.
Eriksson M Norrving B Terent A Stegmayr B . Functional outcome 3 months after stroke predicts long-term survival. Cerebrovasc Dis. (2008) 25:423–9. doi: 10.1159/000121343
7.
Wang Y Jing J Meng X Pan Y Wang Y Zhao X et al . The third China national stroke registry (CNSR-III) for patients with acute ischaemic stroke or transient ischaemic attack: design, rationale and baseline patient characteristics. Stroke Vasc Neurol. (2019) 4:158–64. doi: 10.1136/svn-2019-000242
8.
Yavorkovsky LL . Mean corpuscular volume, hematocrit and polycythemia. Hematology. (2021) 26:881–4. doi: 10.1080/16078454.2021.1994173
9.
Silver H Frankel S . Normal values for mean corpuscular volume as determined by the model s coulter counter. Am J Clin Pathol. (1971) 55:438–41. doi: 10.1093/ajcp/55.4.438
10.
Duchnowski P Hryniewiecki T Kusmierczyk M Szymanski P . Red cell distribution width is a prognostic marker of perioperative stroke in patients undergoing cardiac valve surgery. Interact Cardiovasc Thorac Surg. (2017) 25:925–9. doi: 10.1093/icvts/ivx216
11.
Salvagno GL Sanchis-Gomar F Picanza A Lippi G . Red blood cell distribution width: a simple parameter with multiple clinical applications. Crit Rev Clin Lab Sci. (2015) 52:86–105. doi: 10.3109/10408363.2014.992064
12.
Shams VS Ala A Vahed N Mohammadi S Ameli H . Complete blood count parameters as prognostic factor of stroke: a systematic review. Basic Clin Neurosci. (2022) 13:745–54. doi: 10.32598/bcn.2021.2168.2
13.
Siegler JE Marcaccio C Nawalinski K Quattrone F Sandsmark DK Maloney-Wilensky E et al . Elevated red cell distribution width is associated with cerebral infarction in aneurysmal subarachnoid hemorrhage. Neurocrit Care. (2017) 26:26–33. doi: 10.1007/s12028-016-0306-2
14.
Patel KV Mohanty JG Kanapuru B Hesdorffer C Ershler WB Rifkind JM . Association of the red cell distribution width with red blood cell deformability. Adv Exp Med Biol. (2013) 765:211–6. doi: 10.1007/978-1-4614-4989-8_29
15.
Kang MK Kim TJ Kim Y Nam KW Jeong HY Kim SK et al . Geriatric nutritional risk index predicts poor outcomes in patients with acute ischemic stroke - automated undernutrition screen tool. PLoS One. (2020) 15:e228738. doi: 10.1371/journal.pone.0228738
16.
Vanderweele TJ Ding P . Sensitivity analysis in observational research: introducing the e-value. Ann Intern Med. (2017) 167:268–74. doi: 10.7326/M16-2607
17.
Zhang L Yin J Sun H Li J Zhao X Liu Y et al . Relationship between mean corpuscular volume and 30-day mortality in patients with intracerebral hemorrhage: evidence from the mimic-iii database. Medicine (Baltimore). (2022) 101:e31415. doi: 10.1097/MD.0000000000031415
18.
Wu TH Fann JC Chen SL Yen AM Wen CJ Lu YR et al . Gradient relationship between increased mean corpuscular volume and mortality associated with cerebral ischemic stroke and ischemic heart disease: a longitudinal study on 66,294 Taiwanese. Sci Rep. (2018) 8:16517. doi: 10.1038/s41598-018-34403-w
19.
Wang H Gong L Xia X Dong Q Jin A Gu Y et al . Red blood cell indices in relation to post-stroke psychiatric disorders: a longitudinal study in a follow-up stroke clinic. Curr Neurovasc Res. (2020) 17:218–23. doi: 10.2174/1567202617666200423090958
20.
Gamaldo AA Ferrucci L Rifkind J Longo DL Zonderman AB . Relationship between mean corpuscular volume and cognitive performance in older adults. J Am Geriatr Soc. (2013) 61:84–9. doi: 10.1111/jgs.12066
21.
Buletko AB Thacker T Cho SM Mathew J Thompson NR Organek N et al . Cerebral ischemia and deterioration with lower blood pressure target in intracerebral hemorrhage. Neurology. (2018) 91:e1058–66. doi: 10.1212/WNL.0000000000006156
22.
Borelli P Blatt S Pereira J de Maurino BB Tsujita M de Souza AC et al . Reduction of erythroid progenitors in protein-energy malnutrition. Br J Nutr. (2007) 97:307–14. doi: 10.1017/S0007114507172731
23.
Tsantes AE Bonovas S Travlou A Sitaras NM . Redox imbalance, macrocytosis, and RBC homeostasis. Antioxid Redox Signal. (2006) 8:1205–16. doi: 10.1089/ars.2006.8.1205
24.
Noguchi-Sasaki M Sasaki Y Shimonaka Y Mori K Fujimoto-Ouchi K . Treatment with anti-IL-6 receptor antibody prevented increase in serum hepcidin levels and improved anemia in mice inoculated with IL-6-producing lung carcinoma cells. BMC Cancer. (2016) 16:270. doi: 10.1186/s12885-016-2305-2
25.
Khongkhatithum C Kadegasem P Sasanakul W Thampratankul L Chuansumrit A Sirachainan N . Abnormal red blood cell indices increase the risk of arterial ischemic stroke in children. J Clin Neurosci. (2019) 62:117–20. doi: 10.1016/j.jocn.2018.12.005
26.
Tichil I Mitre I Zdrenghea MT Bojan AS Tomuleasa CI Cenariu D . A review of key regulators of steady-state and ineffective erythropoiesis. J Clin Med. (2024) 13:2585. doi: 10.3390/jcm13092585
27.
Li D Wang A Li Y Ruan Z Zhao H Li J et al . Nonlinear relationship of red blood cell indices (MCH, MCHC, and MCV) with all-cause and cardiovascular mortality: a cohort study in U.S. adults. PLoS One. (2024) 19:e307609. doi: 10.1371/journal.pone.0307609
28.
Wang H Yang G Zhao J Wang M . Association between mean corpuscular volume and severity of coronary artery disease in the northern Chinese population: a cross-sectional study. J Int Med Res. (2020) 48:1219696265. doi: 10.1177/0300060519896713
Summary
Keywords
acute ischemic stroke, mean corpuscular volume, prognosis, non-linear relationship, risk stratification
Citation
Lv Z, Miao Y, Zhu M and Li F (2025) Association between mean corpuscular volume and 3 month outcome in patients with acute ischemic stroke: a second analysis based on a prospective cohort study. Front. Neurol. 16:1675822. doi: 10.3389/fneur.2025.1675822
Received
15 August 2025
Accepted
21 October 2025
Published
05 November 2025
Volume
16 - 2025
Edited by
Yuzhou Xue, Peking University Third Hospital, China
Reviewed by
Jiaping Xu, Second Affiliated Hospital of Soochow University, China
Ökkeş Zortuk, TC Saglik Bakanligi Bandirma Egitim ve Arastirma Hastanesi, Türkiye
Updates
Copyright
© 2025 Lv, Miao, Zhu and Li.
This is an open-access article distributed under the terms of the Creative Commons Attribution License (CC BY). The use, distribution or reproduction in other forums is permitted, provided the original author(s) and the copyright owner(s) are credited and that the original publication in this journal is cited, in accordance with accepted academic practice. No use, distribution or reproduction is permitted which does not comply with these terms.
*Correspondence: Fei Li, 18854808671@163.com
†These authors have contributed equally to this work
Disclaimer
All claims expressed in this article are solely those of the authors and do not necessarily represent those of their affiliated organizations, or those of the publisher, the editors and the reviewers. Any product that may be evaluated in this article or claim that may be made by its manufacturer is not guaranteed or endorsed by the publisher.