Abstract
Background:
Stress hyperglycemia is common in acute ischemic stroke (IS) and has been linked to adverse outcomes. The fasting glucose-to-glycated hemoglobin (HbA1c) ratio (GAR) has been proposed as a simple marker reflecting stress hyperglycemia relative to chronic glycemic status. Still, its prognostic value in patients undergoing endovascular treatment (EVT) remains unclear. This meta-analysis aimed to evaluate the association between GAR and 90d-day functional outcomes in these patients.
Methods:
PubMed, Embase, Web of Science, Wanfang, and Chinese National Knowledge Infrastructure (CNKI) were systematically searched through May 29, 2025. Studies reporting the association between GAR and poor functional outcome, defined as a modified Rankin Scale (mRS) score of 3–6 at 90 days, were included. Odds ratios (ORs) with 95% confidence intervals (CIs) were pooled using a random-effects model accounting for heterogeneity.
Results:
Twelve datasets from 10 retrospective cohort studies involving 3,878 patients were analyzed. The pooled analysis showed that a high GAR was significantly associated with an increased risk of poor functional outcome at 90 days after EVT (OR: 2.94, 95% CI: 2.22–3.88, p < 0.001; I2 = 14%). Meta-regression indicated that the proportion of diabetic patients showed a trend toward explaining the observed heterogeneity (coefficient = −0.0088, p = 0.08; I2 residual = 0%), whereas other factors showed no significant influence. Subgroup analyses yielded consistent results across age, sex, diabetes status, National Institutes of Health Stroke Scale (NIHSS), GAR cutoffs, and study quality (p for subgroup difference all > 0.05). The certainty of evidence for the primary outcome was rated as moderate according to the GRADE framework, mainly due to the retrospective design.
Conclusion:
High GAR may independently predict poor 90-day functional outcomes after EVT in patients with IS, supporting its potential prognostic value in clinical practice.
Introduction
Ischemic stroke (IS) remains one of the leading causes of mortality and long-term disability worldwide, accounting for the majority of all stroke cases and imposing a significant global health burden (1, 2). Despite advances in prevention and acute care, the incidence of IS continues to rise due to aging populations and the growing prevalence of vascular risk factors such as hypertension, diabetes, and atrial fibrillation (3). Endovascular treatment (EVT) has revolutionized IS management, especially for large-vessel occlusions, by achieving higher reperfusion rates and better functional outcomes than intravenous thrombolysis alone (4, 5). However, even with technically successful recanalization, many patients fail to regain functional independence, suggesting that factors beyond vessel reopening influence prognosis (6). Identifying reliable predictors of functional outcome after EVT is therefore crucial for early risk stratification, individualized decision-making, and optimization of post-procedural care (7).
Stress hyperglycemia, reflecting acute metabolic stress during critical illness, is common in IS and has been linked to worse clinical outcomes through mechanisms including oxidative stress, endothelial dysfunction, inflammation, and impaired fibrinolysis (8, 9). To better characterize stress hyperglycemia, indices that adjust acute glucose levels for chronic glycemic status using glycated hemoglobin (HbA1c) have been proposed (10). These include admission glucose/HbA1c, admission glucose/estimated chronic glucose, and fasting glucose/HbA1c ratios (11). All three reflect acute-on-chronic glycemic imbalance, but the fasting glucose-to-HbA1c ratio—also termed the glucose-to-HbA1c ratio (GAR)—is less influenced by prandial fluctuations and may better capture true stress hyperglycemia (11). Emerging evidence suggests that GAR provides superior predictive value for mortality and poor functional outcomes compared with other indices in patients with IS receiving intravenous thrombolysis (12, 13). Nevertheless, studies evaluating GAR in IS patients treated with EVT remain limited. To the best of our knowledge, 10 retrospective cohort studies including 3,878 patients have examined GAR in this setting, with sample sizes ranging from 79 to 691 (14–23). Most reported that higher GAR was associated with an increased risk of poor 90-day functional outcome, although the strength of the association varied across studies (14–23). Accordingly, we conducted a meta-analysis to comprehensively assess the association between GAR and 90-day functional outcomes in IS patients undergoing EVT and to explore potential sources of heterogeneity across studies.
Methods
We conducted this systematic review and meta-analysis in accordance with the Preferred Reporting Items for Systematic reviews and Meta-Analyses 2020 (PRISMA 2020) statement (24) and the recommendations outlined in the Cochrane Handbook (25), ensuring standardized procedures for study selection, data extraction, statistical analysis, and result interpretation. The study protocol was prospectively registered in the International Prospective Register of Systematic Reviews (PROSPERO) (CRD420251132513).
Study inclusion and exclusion criteria
The inclusion criteria were established using the PICOS framework.
Population (P): Adult patients (≥18 years) with acute IS who underwent EVT (e.g., mechanical thrombectomy, intra-arterial thrombolysis).
Intervention/exposure (I): Measurement of GAR, defined as FPG divided by HbA1c, assessed at admission or within 24 h of admission. Patients with a high GAR were considered the exposure, with the cutoffs for defining high GAR consistent with the values used in the original studies.
Comparator (C): Patients with a low GAR at baseline.
Outcomes (O): Functional outcomes, defined as a modified Rankin Scale (mRS) score of 3–6 at 90 days, compared between patients in the high vs. the low GAR categories.
Study design (S): Longitudinal observational studies, such as cohort studies (prospective or retrospective), nested case–control studies, or post hoc analysis of randomized controlled trials (RCTs).
Studies were excluded if they (1) did not involve patients undergoing EVT for IS; (2) lacked assessment of GAR (fasting glucose/HbA1c) as the exposure of interest or analyzed GAR only as a continuous variable; (3) did not report functional outcomes at follow-up; (4) provided insufficient data to calculate effect estimates or lacked a comparator group; (5) were case reports, reviews, editorials, meta-analyses, or animal studies; or (6) were duplicate publications or involved overlapping populations with the same dataset. For studies with overlapping populations, the analysis included the one with the largest sample size. Although we initially planned to exclude studies reporting only continuous GAR due to the potentially insurmountable and error-prone conversion of β coefficients or hazard ratios into odds ratios (ORs) for pooling, no study was excluded for this reason during literature screening.
Database search
We performed a comprehensive literature search in PubMed, Embase, Web of Science, Wanfang, and Chinese National Knowledge Infrastructure (CNKI) to identify eligible studies. The search strategy combined terms related to: (1) glycemic parameters, including “relative hyperglycemia,” “acute-to-chronic glycemic ratio,” “glucose-to-glycated hemoglobin,” “glucose-to-HbA1c,” “stress hyperglycemia ratio,” “SHR,” and “GAR”; (2) disease terms such as “ischemic stroke,” “stroke,” “cerebral infarction,” and “cerebrovascular infarction”; (3) interventions, including “endovascular therapy,” “mechanical thrombectomy,” “intra-arterial thrombolysis,” “neurointervention,” “endovascular treatment,” and related procedures; and (4) outcomes and study design descriptors, such as “mortality,” “survival,” “prognosis,” “functional outcome,” “cohort,” “prospective,” “retrospective,” and “follow-up.” The search was limited to human studies and full-text articles published in English or Chinese in peer-reviewed journals. Reference lists of relevant articles and reviews were also screened to identify additional studies. The search period extended from database inception to 29 May 2025. The full search strategy for each database is shown in Supplementary File S1.
Study quality evaluation
Two authors independently conducted the literature search, study selection, quality assessment, and data extraction, with disagreements resolved through discussion with the corresponding author. Study quality was evaluated using the Newcastle–Ottawa Scale (NOS) (26), which assesses selection, control of confounders, and outcome evaluation, with total scores ranging from 1 to 9 and scores ≥ 8 indicating high quality.
Data extraction
Data extracted for analysis included study characteristics (author, year, country, and design), patient information [sample size, diagnosis, mean age, sex distribution, baseline National Institutes of Health Stroke Scale (NIHSS) score, proportion of diabetic patients, and type of EVT], exposure details (timing of GAR measurement, methods and cutoff values used to define high GAR), incidence of poor functional outcomes at 90 days, and covariates adjusted for in the regression analyses examining the association between GAR and 90-day outcomes.
Statistical analysis
We used ORs with 95% confidence intervals (CIs) to evaluate the association between GAR and 90-day functional outcomes in IS patients after EVT. ORs and standard errors were directly obtained or derived from 95% CIs or p-values and then log-transformed to stabilize variance and normalize the data (25). When multiple models were available, we selected the OR with the most comprehensive adjustment. Heterogeneity was assessed using the Cochrane Q test and the I2 statistic (27), with p < 0.10 indicating significant heterogeneity and I2 values < 25, 25–75, and > 75 representing low, moderate, and high heterogeneity, respectively. A random-effects model was applied to account for between-study variation (25). Sensitivity analyses were performed by sequentially excluding each study to test the robustness of the findings (25). Univariate meta-regression was conducted to explore whether study-level factors, such as sample size, mean age, sex distribution, baseline NIHSS, proportion of diabetic patients, GAR cutoff methods, incidence of poor outcomes, and study quality scores, influenced the pooled estimates (25). Pre-specified subgroup analyses were carried out according to patient age, sex distribution, baseline NIHSS, diabetic status, methods for defining GAR cutoffs, cutoff values, and NOS scores, using median values of continuous variables for stratification. Publication bias was examined through visual inspection of funnel plots and Egger’s test (28). All statistical analyses were performed using RevMan (Version 5.3; Cochrane Collaboration, Oxford, UK) and Stata (Version 17.0; Stata Corporation, College Station, TX, USA). A p < 0.05 indicates statistical significance. The certainty of evidence for the primary outcome was assessed using the Grading of Recommendations Assessment, Development and Evaluation (GRADE) framework, evaluating five domains (risk of bias, inconsistency, indirectness, imprecision, and publication bias) (25). A Summary of Findings table was generated to present the certainty ratings and reasons for downgrading or upgrading accordingly.
Results
Study selection
The study selection process is summarized in Figure 1. A total of 161 records were initially retrieved from five databases. After removing 44 duplicates, 117 articles underwent title and abstract screening, with 95 excluded for not meeting the inclusion criteria. The full texts of the remaining 22 articles were reviewed independently by two authors, and 12 were excluded for various reasons (Figure 1). Ultimately, 10 studies were included in the quantitative analysis (14–23).
Figure 1
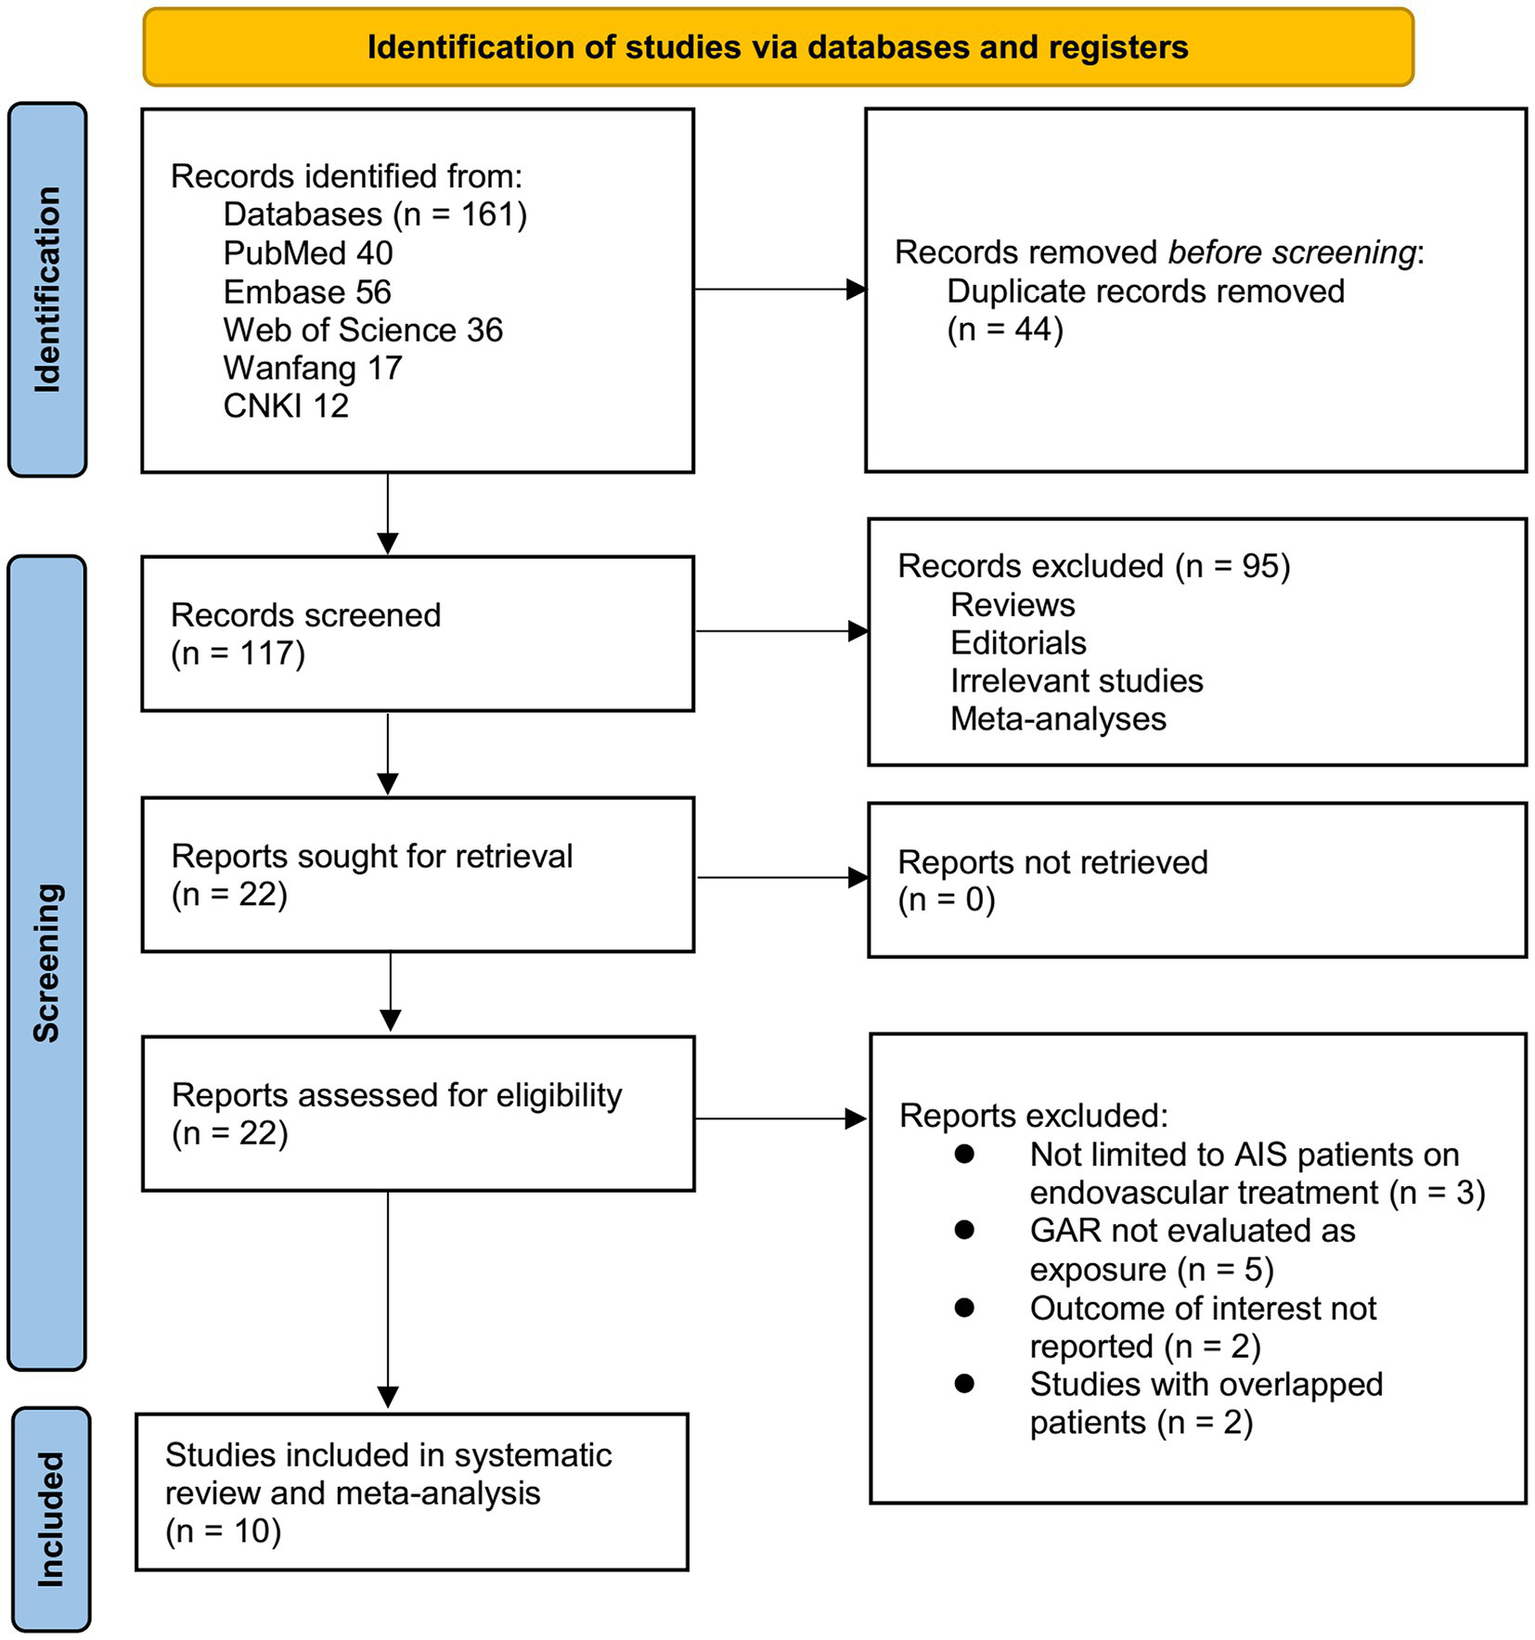
Flowchart of database search and study inclusion.
Study characteristics
Table 1 summarizes the key characteristics of the 12 datasets derived from 10 studies included in this meta-analysis (14–23). Two studies (16, 17) reported outcomes separately for patients with and without diabetes, and these were analyzed as independent datasets, making 12 datasets available for the meta-analysis. The studies were published between 2021 and 2025 and conducted across Italy, the United Kingdom, Japan, and China. All were retrospective cohort studies and together included 3,878 patients with acute IS treated with EVT. Sample sizes ranged from 79 to 691 patients, with mean ages spanning 62.0 to 75.5 years, and the proportion of male patients ranging from 45.4 to 66.5%. Baseline stroke severity, measured by the NIHSS, varied between studies, with mean values from 12.6 to 16.5. GAR was consistently measured within 24 h of hospitalization or symptom onset, but detailed information on whether the glucose sample was strictly fasting, or on the exact timing relative to the EVT procedure, was generally not reported. The cutoff values for defining high vs. low GAR varied: most studies used the highest vs. lowest quartile (Q4: Q1) (14, 16, 18, 20, 21, 23), while others applied tertile-based cutoffs (T3: T1) (17, 22) or receiver operating characteristic (ROC) curve analysis (15, 19). The cutoff values for defining a high GAR varied from 1.07 to 1.50. Poor functional outcome was uniformly defined as an mRS score of 3–6 at 90 days, with incidence rates ranging from 34.0 to 69.1%. Overall, 2,125 (54.8%) patients had a poor functional outcome at 90 days. Multivariate analysis was performed in all studies. Covariate adjustment varied across studies, with most models including age, sex, baseline NIHSS, vascular risk factors (e.g., hypertension, diabetes, atrial fibrillation), pre-stroke mRS, imaging parameters (e.g., Alberta Stroke Program Early CT Score, collateral status), and procedural factors such as time to reperfusion.
Table 1
| Study | Design | Country | Number of patients with stroke | Mean age (years) | Male (%) | Mean NIHSS at admission | DM (%) | Details of EVT | Timing of GAR evaluation | Methods for defining GAR cutoff | Cutoff value of high GAR (mmol/L per %) | Number of patients with poor functional outcome | Incidence (%) of poor functional outcome | Variables adjusted |
|---|---|---|---|---|---|---|---|---|---|---|---|---|---|---|
| Merlino et al. (14) | R | Italy | 204 | 74.4 | 49 | 16.5 | 10.3 | MT (40.3% direct MT, 59.3% MT + intravenous alteplase) | Within 24 h of hospitalization | Q4: Q1 | 1.22 | 122 | 59.8 | Age, history of DM, ASPECTS score, baseline NIHSS score, pre-stroke mRS, time from symptom onset to MT, door-to-groin time, procedure duration |
| Zhang et al. (19) | R | China | 408 | 64.8 | 65 | 14.5 | 34.1 | MT for anterior circulation large-vessel occlusion | Within 24 h of hospitalization | Q4: Q1 | 1.49 | 282 | 69.1 | Age, sex, previous TIA/stroke, history of hypertension, smoking, hemoglobin, hs-CRP, SBP, NIHSS score at admission, pre-stroke mRS, and IV tPA administration |
| Dai et al. (15) | R | China | 559 | 70 | 63.9 | 13.9 | 25.8 | MT (with Solitaire and/or Catalyst6 devices) | Within 24 h of hospitalization | ROC curve analysis | 1.07 | 275 | 49.2 | Age, baseline NIHSS, NIHSS at 24 h, puncture-to-recanalization time, pre-procedure ASITN/SIR grade, and successful recanalization |
| Duan et al. (16) NDM | R | China | 346 | 66.4 | 51.8 | 15.3 | 0 | MT and/or stent implantation | Within 24 h of symptom onset | Q4: Q1 | 1.33 | 147 | 42.5 | Age, CHD, AF, NIHSS at admission, any ICH |
| Duan et al. (16) DM | R | China | 230 | 68 | 52.6 | 14.5 | 100 | MT and/or stent implantation | Within 2 4 h of symptom onset | Q4: Q1 | 1.50 | 122 | 53.0 | Age, hypertension, hyperlipidemia, previous stroke, NIHSS at admission, any ICH, respiratory failure |
| Zhang et al. (20) | R | China | 159 | 69.8 | 61.6 | 12.6 | 35.8 | MT (stent retriever, aspiration, or a combination) | Within 24 h of symptom onset | ROC curve analysis | 1.21 | 54 | 34.0 | Age, baseline NIHSS, ASITN/SIR collateral grade, and symptomatic ICH |
| Wang and Fan (17) NDM | R | China | 130 | 65.9 | 56.2 | 14.4 | 0 | MT with complete recanalization | Within 24 h of hospitalization | T3: T1 | 1.36 | 67 | 51.5 | Age, hemoglobin, TG, HDL, admission NIHSS, admission SBP, ASITN/SIR collateral score, ASPECTS, and atherosclerotic stroke etiology |
| Wang and Fan (17) DM | R | China | 79 | 69.9 | 46.8 | 14.3 | 100 | MT with complete recanalization | Within 24 h of hospitalization | T3: T1 | 1.41 | 49 | 62.0 | Age, AF, admission DBP, and onset to reperfusion time |
| Yang et al. (21) | R | China | 553 | 62 | 66.5 | 15 | 24.6 | MT | Within 24 h of hospitalization | Q4: Q1 | 1.39 | 318 | 57.5 | Age, sex, SBP, NIHSS score at admission, pre-stroke mRS, CVD, previous TIA/stroke, smoking, hemoglobin, and serum creatinine |
| Merlino et al. (20) | R | Italy and UK | 691 | 75.5 | 45.4 | 16.3 | 14 | MT | Within 24 h of hospitalization | Q4: Q1 | 1.38 | 403 | 58.3 | Age, sex, hypertension, AF, anticoagulant Use, NIHSS at admission, ASPECTS, site of Occlusion (Tandem vs. MCA), number of retrieval attempts >3, procedure length, and alteplase use before MT |
| Gao et al. (22) | R | China | 415 | 72 | 61.4 | 14 | 29.2 | MT (stent retriever, aspiration, or a combination) | Within 24 h of hospitalization | T3: T1 | 1.18 | 246 | 59.3 | Age, sex, hypertension, DM, AF, pre-stroke mRS score, admission SBP, baseline NIHSS, BUN, eGFR, successful recanalization, door-to-puncture time |
| Tsuji et al. (23) | R | Japan | 104 | 73.1 | 66.3 | 15.4 | 24 | MT | Within 24 h of hospitalization | Q4: Q1 | 1.25 | 40 | 38.5 | Age, SBP, DWI-ASPECTS score, number of passes, puncture-to-reperfusion time |
Characteristics of the included studies.
AF, atrial fibrillation; ASITN/SIR, American Society of Interventional and Therapeutic Neuroradiology/Society of Interventional Radiology; ASPECTS, Alberta Stroke Program Early CT Score; BUN, blood urea nitrogen; CVD, cardiovascular disease; DBP, diastolic blood pressure; DM, diabetes mellitus; DWI, diffusion-weighted imaging; eGFR, estimated glomerular filtration rate; EVT, endovascular treatment; GAR, glucose-to-HbA1c ratio; HDL, high-density lipoprotein; hs-CRP, high-sensitivity C-reactive protein; ICH, intracerebral hemorrhage; IV tPA, intravenous tissue plasminogen activator; MCA, middle cerebral artery; mRS, modified Rankin Scale; MT, mechanical thrombectomy; NIHSS, National Institutes of Health Stroke Scale; Q4: Q1, highest quartile vs. lowest quartile; ROC, receiver operating characteristic; SBP, systolic blood pressure; TIA, transient ischemic attack; TG, triglyceride; T3: T1, highest quartile vs. lowest tertile.
Study quality assessment
Table 2 presents the quality assessment of the included datasets using the NOS. Overall, methodological quality was moderate to high, with total scores ranging from 8 to 9 out of a maximum of 9. Six datasets achieved the maximum score of 9 (14, 17, 20–22), while the remaining six scored 8 points (15, 16, 18, 19, 23). Lower scores were mainly attributed to the limited representativeness of the exposed cohort or slightly incomplete follow-up. All datasets demonstrated robust ascertainment of exposure, appropriate selection of non-exposed cohorts, and reliable outcome assessment, supporting the validity of the data synthesized in this meta-analysis.
Table 2
| Study | Representativeness of the exposed cohort | Selection of the non-exposed cohort | Ascertainment of exposure | Outcome not present at baseline | Control for age | Control for other confounding factors | Assessment of outcome | Enough long follow-up duration | Adequacy of follow-up of the cohort | Total |
|---|---|---|---|---|---|---|---|---|---|---|
| Merlino et al. (14) | 1 | 1 | 1 | 1 | 1 | 1 | 1 | 1 | 1 | 9 |
| Zhang et al. (19) | 1 | 1 | 1 | 1 | 1 | 1 | 1 | 1 | 0 | 8 |
| Dai et al. (15) | 0 | 1 | 1 | 1 | 1 | 1 | 1 | 1 | 1 | 8 |
| Duan et al. (16) NDM | 0 | 1 | 1 | 1 | 1 | 1 | 1 | 1 | 1 | 8 |
| Duan et al. (16) DM | 0 | 1 | 1 | 1 | 1 | 1 | 1 | 1 | 1 | 8 |
| Zhang et al. (20) | 0 | 1 | 1 | 1 | 1 | 1 | 1 | 1 | 1 | 8 |
| Wang and Fan (17) NDM | 1 | 1 | 1 | 1 | 1 | 1 | 1 | 1 | 1 | 9 |
| Wang and Fan (17) DM | 1 | 1 | 1 | 1 | 1 | 1 | 1 | 1 | 1 | 9 |
| Yang et al. (21) | 1 | 1 | 1 | 1 | 1 | 1 | 1 | 1 | 1 | 9 |
| Merlino et al. (20) | 1 | 1 | 1 | 1 | 1 | 1 | 1 | 1 | 1 | 9 |
| Gao et al. (22) | 1 | 1 | 1 | 1 | 1 | 1 | 1 | 1 | 1 | 9 |
| Tsuji et al. (23) | 1 | 1 | 1 | 1 | 1 | 1 | 0 | 1 | 1 | 8 |
Study quality evaluation via the Newcastle–Ottawa Scale.
Meta-analysis and sensitivity analysis results
Mild heterogeneity was observed among the included studies evaluating the association between GAR and 90-day functional outcome of IS patients after EVT (p for Cochrane Q test = 0.30; I2 = 14%). The pooled results of the 12 datasets (14–23) with a random-effects model showed that overall, a high GAR at baseline was associated with a higher risk of poor functional outcome at 90 days after EVT (OR: 2.94, 95% CI: 2.22 to 3.88, p < 0.001; Figure 2A). Sensitivity analyses were performed by removing one dataset at a time, and the results remained stable (OR: 2.76 to 3.13, all p < 0.05).
Figure 2
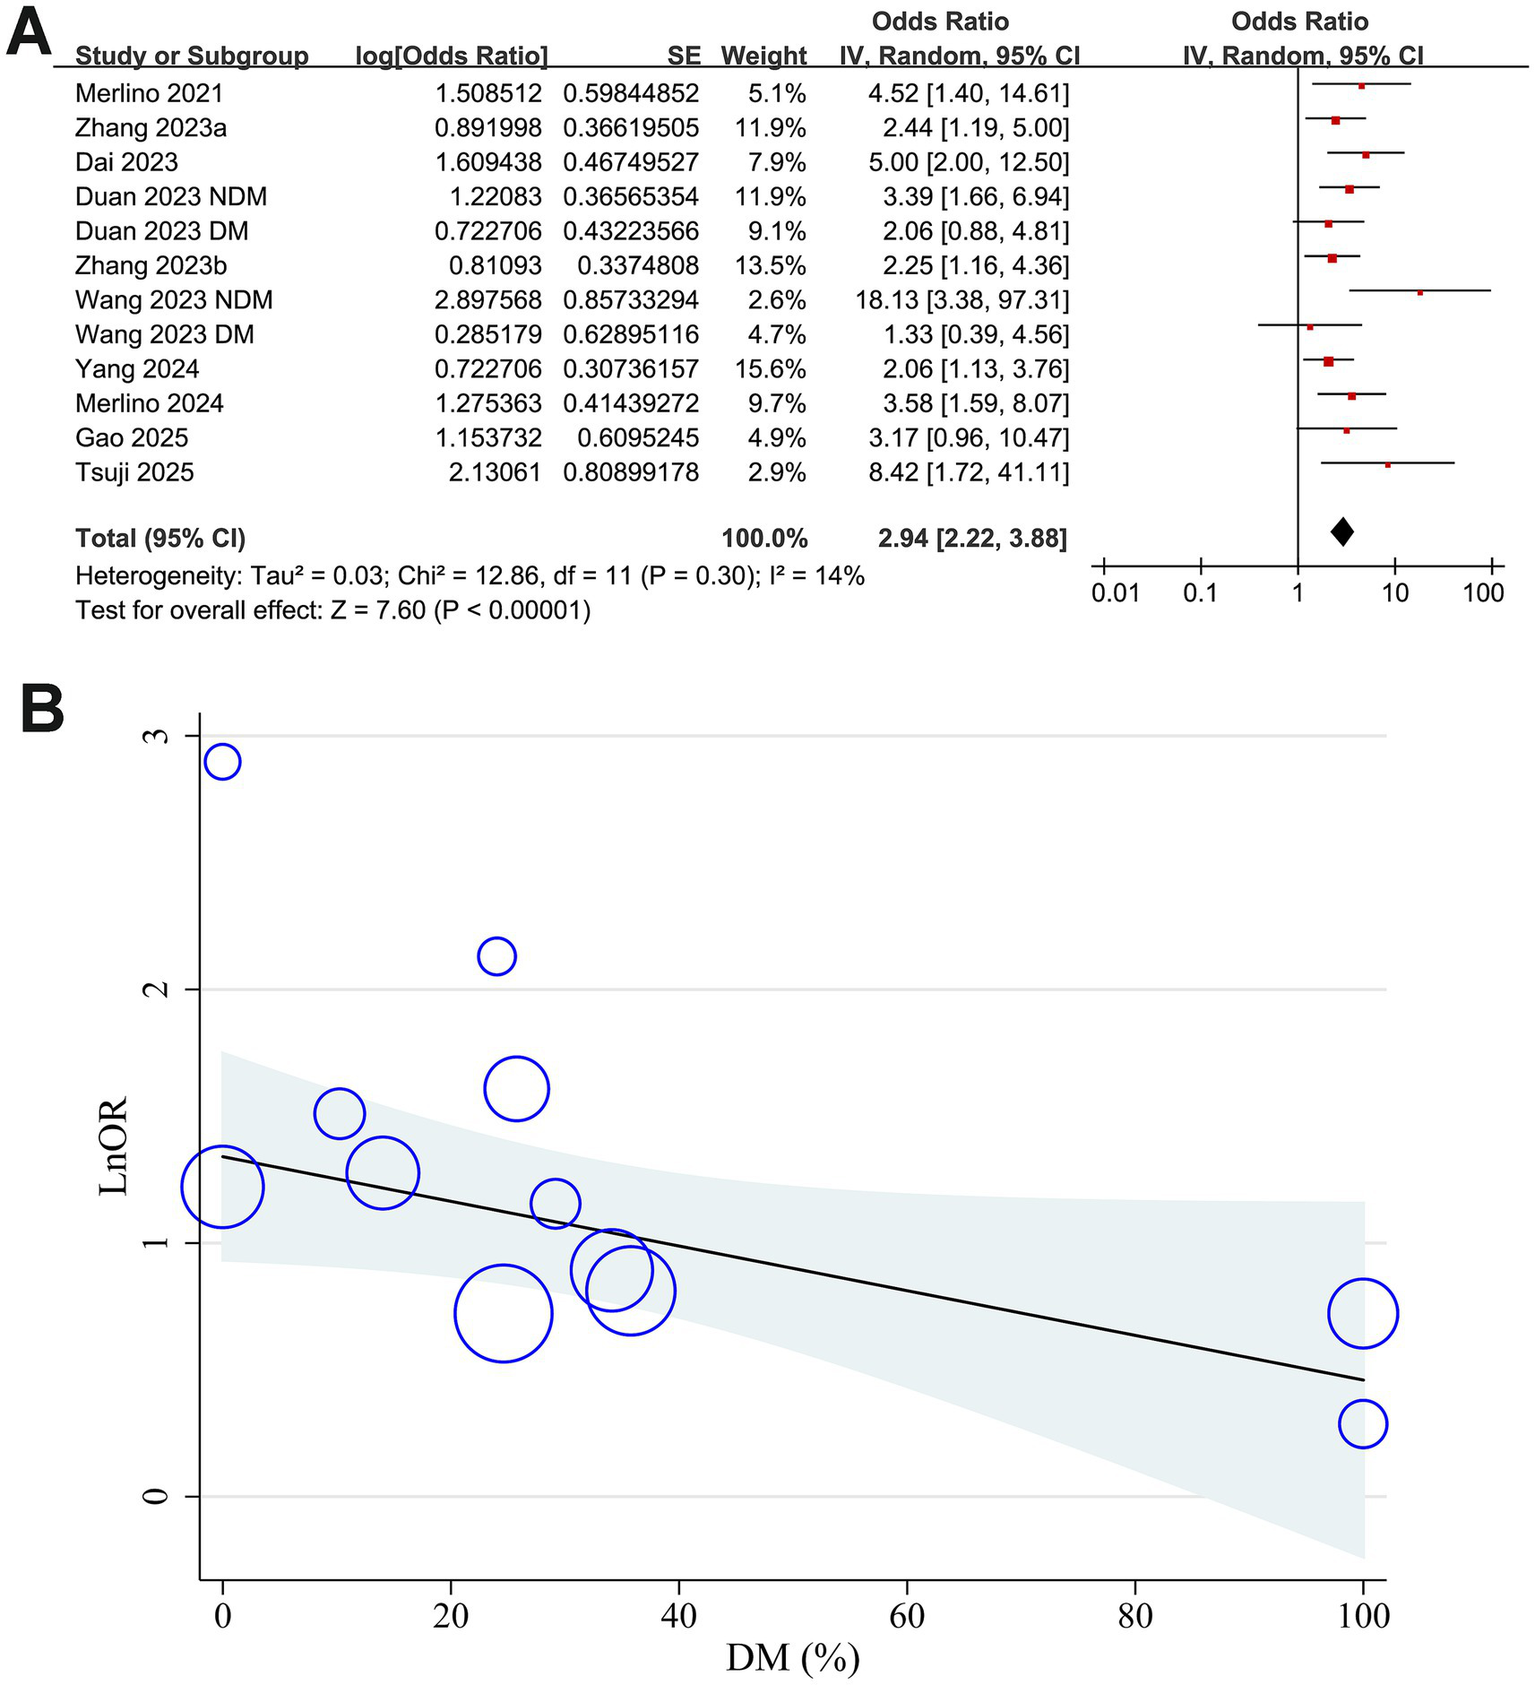
Forest plots and meta-regression analysis examining the impact of diabetes on the association between GAR and 90-day poor functional outcome in patients with IS after EVT. (A) Overall meta-analysis; (B) correlation between the proportion of patients with diabetes and the pooled OR.
Meta-regression analysis results
Results of the univariate meta-regression analysis are presented in Table 3. The proportion of patients with diabetes in each study showed a negative, though not statistically significant, correlation with the pooled OR for the association between GAR and poor functional outcome (coefficient = −0.0088, p = 0.08; Table 3 and Figure 2B). Notably, variation in diabetic status across datasets appeared to fully account for the observed heterogeneity (I2 residual = 0%). In contrast, other study-level factors, including sample size, mean age, proportion of men, baseline NIHSS, GAR cutoff values, incidence of poor functional outcome, and study quality scores, did not demonstrate any meaningful association with the pooled results.
Table 3
| Variables | OR for the association between high GAR and the risk of a 90-day poor functional outcome | |||
|---|---|---|---|---|
| Coefficient | 95% CI | p-values | I2 residual (%) | |
| Sample size | 0.000095 | −0.00164 to 0.00183 | 0.91 | 22.1 |
| Mean age (years) | 0.0040 | −0.0323 to 0.1122 | 0.25 | 10.5 |
| Men (%) | −0.0073 | −0.0499 to 0.0354 | 0.71 | 21.1 |
| Baseline NIHSS | 0.11 | −0.17 to 0.39 | 0.40 | 16.3 |
| DM (%) | −0.0088 | −0.0188 to 0.0012 | 0.08 | 0 |
| Cutoff of GAR (mmol/L) | −1.51 | −3.86 to 0.85 | 0.19 | 6.5 |
| Incidence of poor functional outcome (%) | −0.0064 | −0.0359 to 0.0232 | 0.64 | 20.5 |
| NOS | −0.014 | −0.669 to 0.642 | 0.96 | 22.2 |
Results of univariate meta-regression analysis.
CI, confidence interval; DM, diabetes mellitus; GAR, glucose-to-HbA1c ratio; NIHSS, National Institutes of Health Stroke Scale; NOS, Newcastle–Ottawa Scale; OR, odds ratio.
Subgroup analysis results
Further subgroup analyses showed that the association between GAR and the increased risk of poor functional outcome at 90 days after EVT remained consistent across multiple study-level factors. Similar results were observed in studies with mean patient age < or ≥ 70 years (OR: 2.49 vs. 4.29, p for subgroup difference = 0.07; Figure 3A), proportion of men < or ≥ 60% (OR: 3.25 vs. 2.68, p = 0.53; Figure 3B), and mean baseline NIHSS < or ≥ 15 (OR: 2.82 vs. 3.07, p = 0.77; Figure 3C). Comparable findings were also noted for studies with a proportion of diabetic patients < or ≥ 25% (OR: 3.76 vs. 2.51, p = 0.19; Figure 4A), for those defining high GAR by quartiles, tertiles, or ROC analysis (OR: 2.80, 3.82, and 3.14, p = 0.88; Figure 4B), for studies with cutoff values for high GAR < or ≥ 1.35 (OR: 3.41 vs. 2.59, p = 0.35; Figure 5A), and for studies with NOS scores of 8 or 9 (OR: 2.90 vs. 3.12, p = 0.82; Figure 5B).
Figure 3
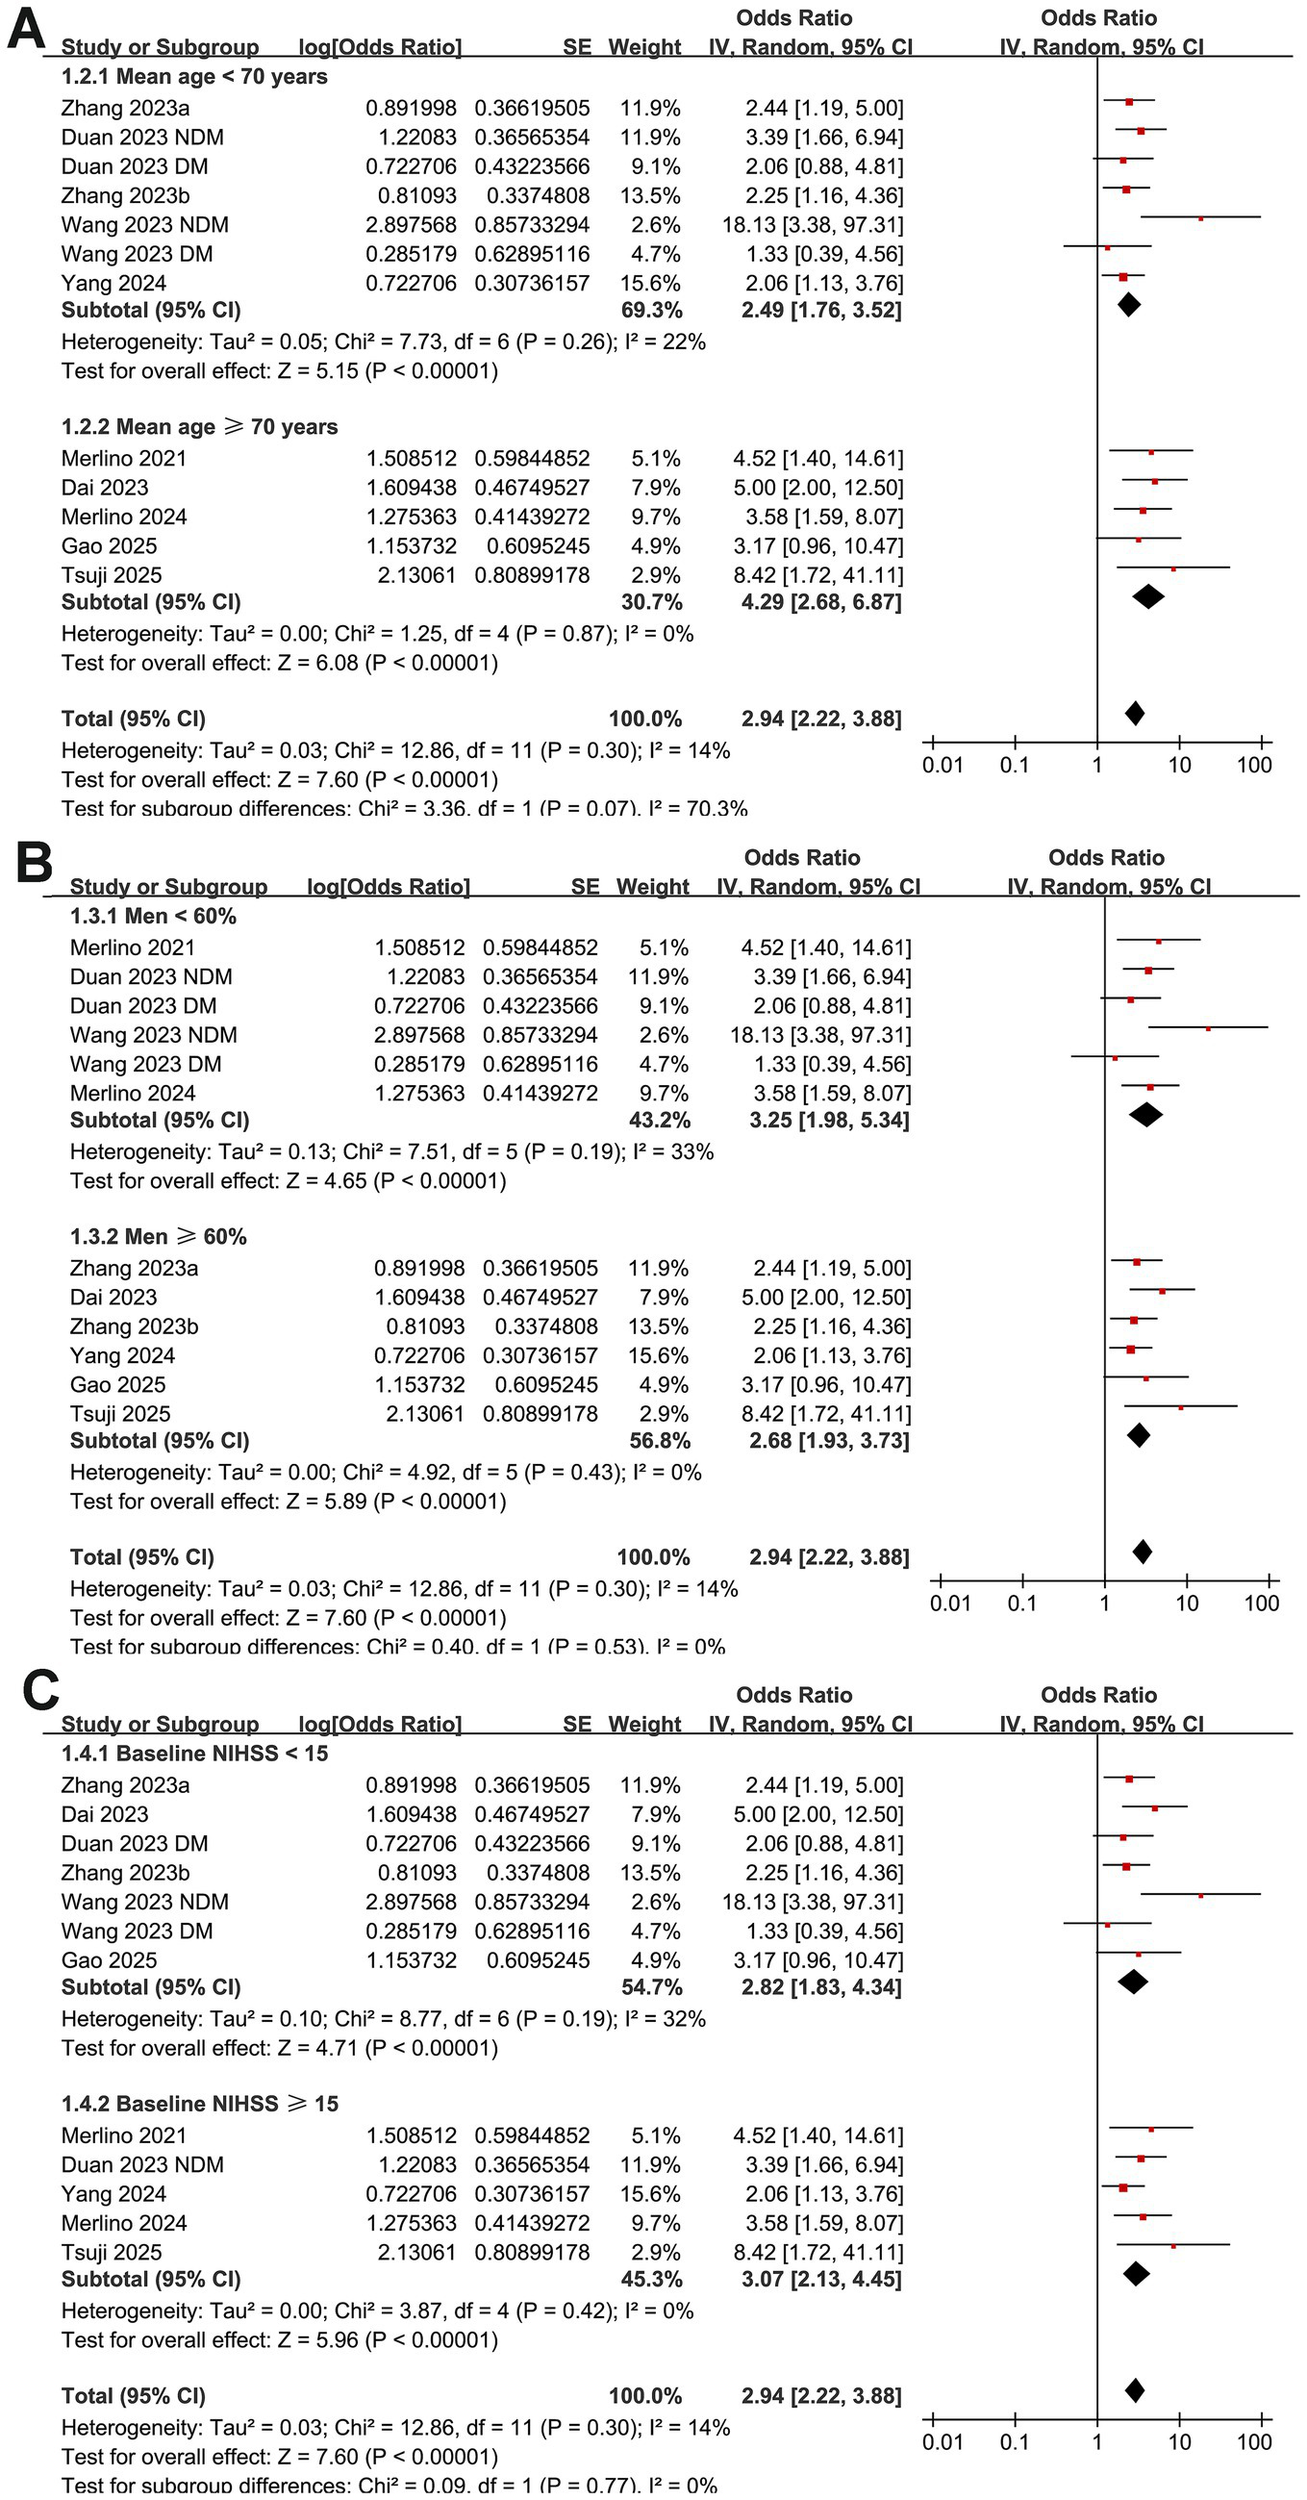
Forest plots for the subgroup analyses of the association between GAR and 90-day poor functional outcome in patients with IS after EVT. (A) Subgroup analysis according to mean ages of the patients; (B) subgroup analysis according to the proportion of men; (C) subgroup analysis according to the mean NIHSS at admission.
Figure 4
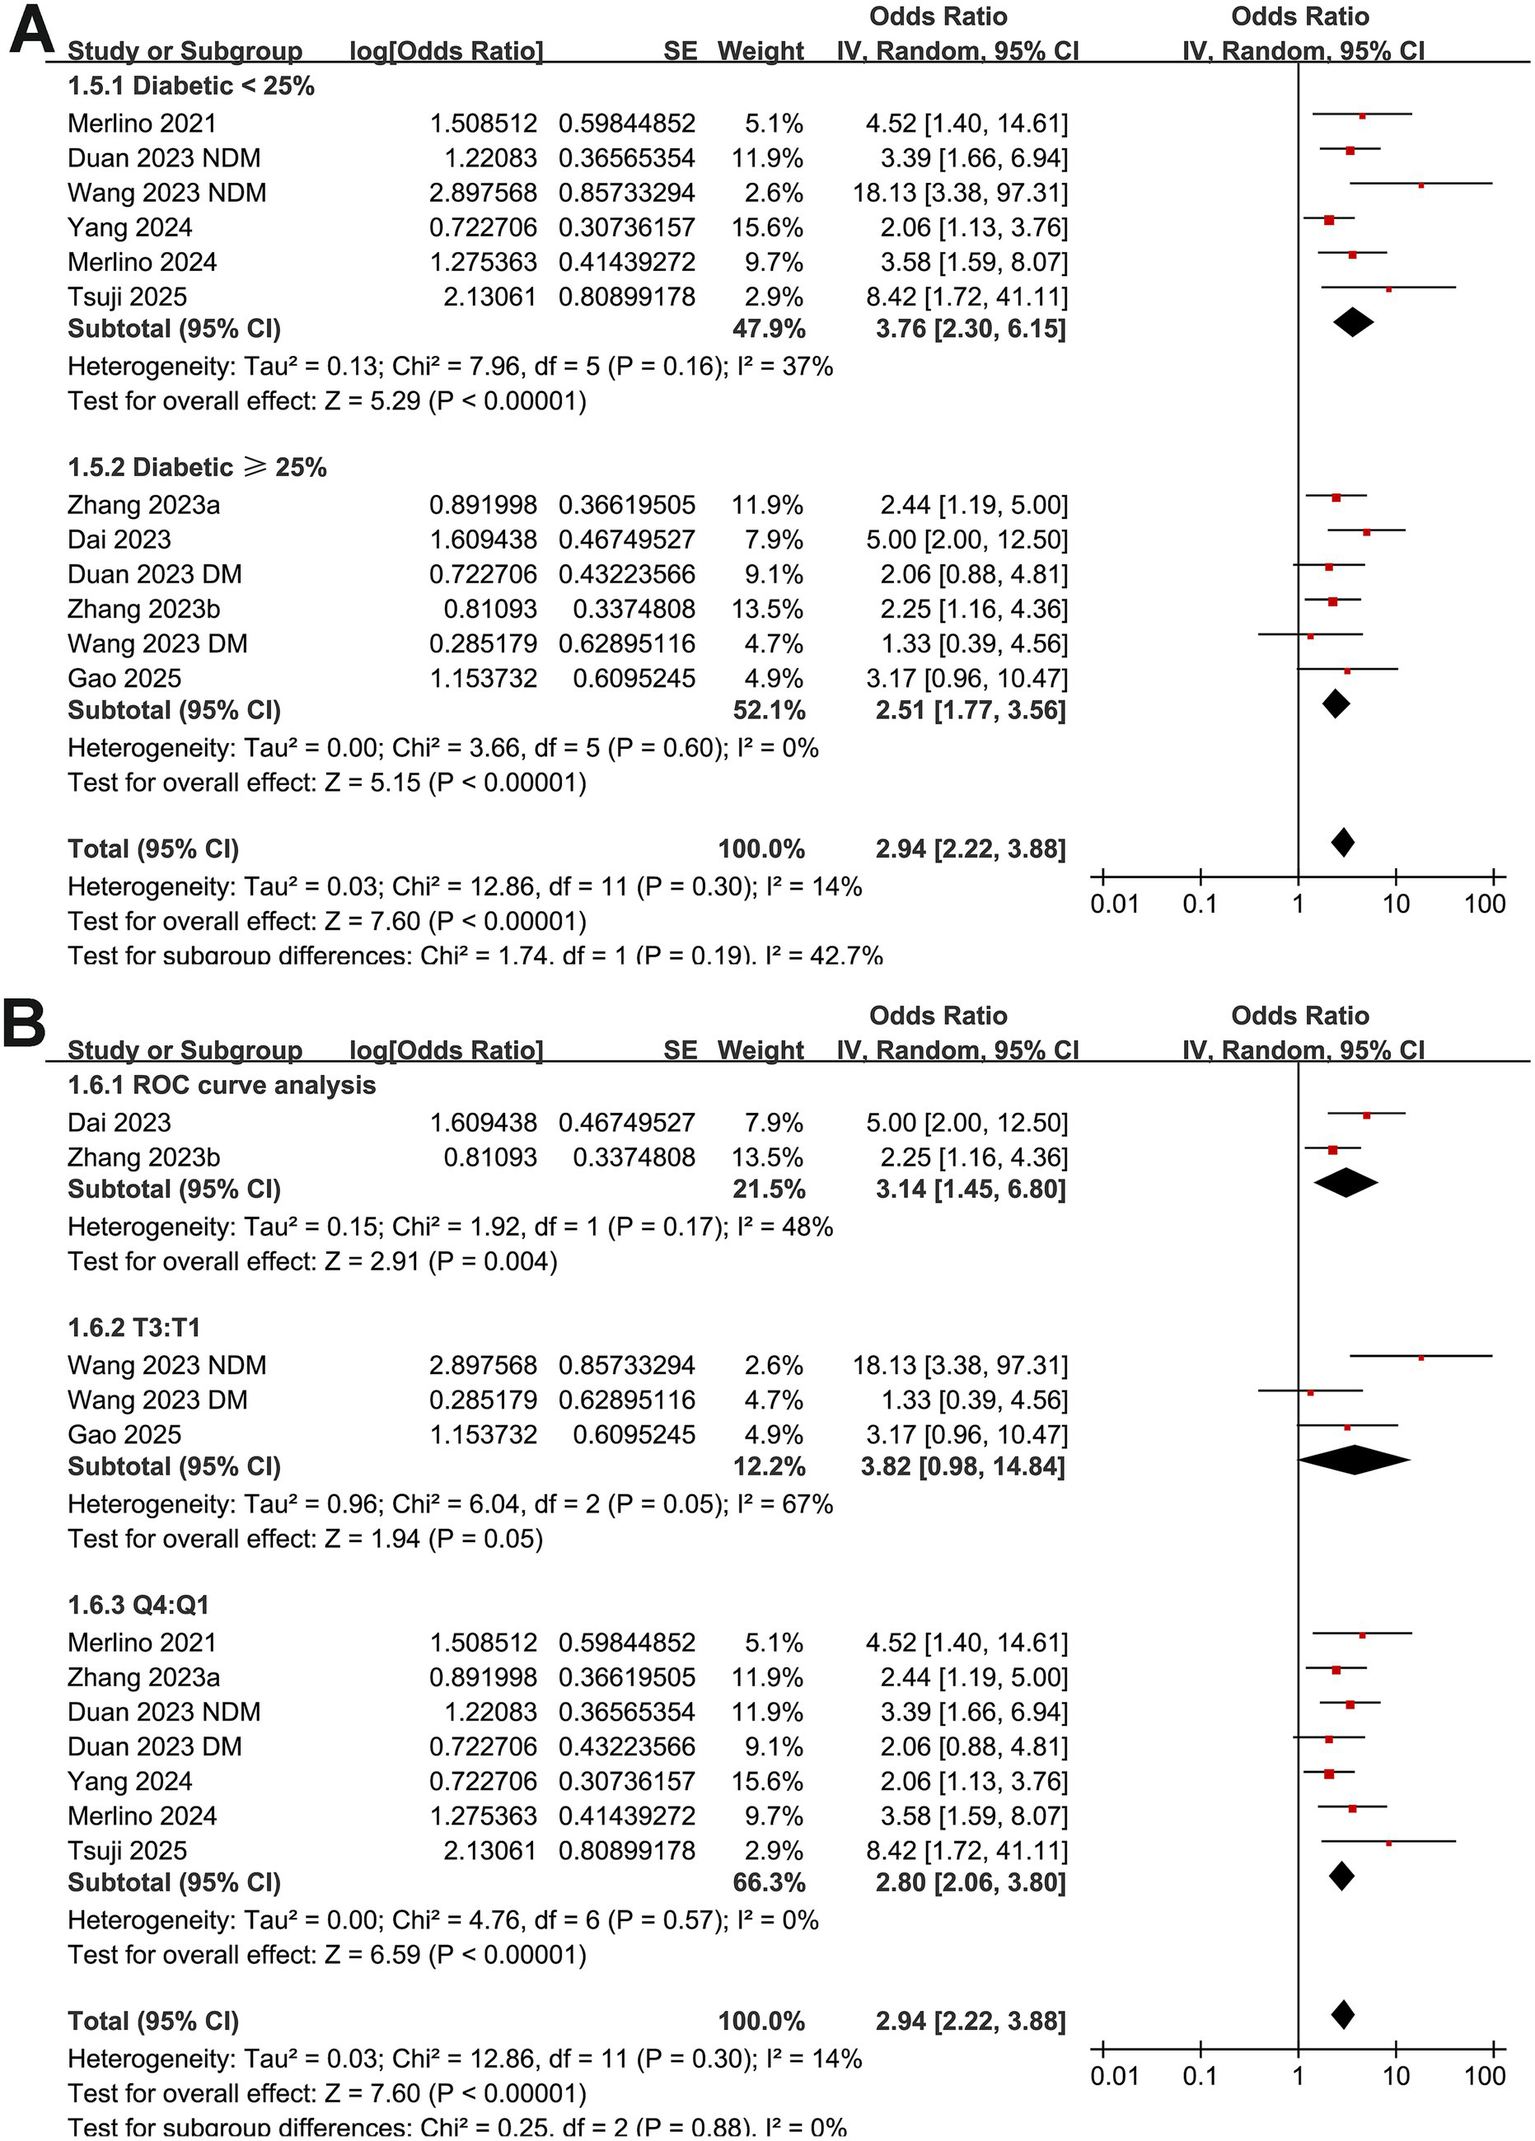
Forest plots for the subgroup analyses of the association between GAR and 90-day poor functional outcome in patients with IS after EVT. (A) Subgroup analysis according to the proportion of patients with diabetes; (B) subgroup analysis according to the methods for defining cutoffs of GAR.
Figure 5
![Forest plots comparing odds ratios. Panel A: Two subgroups based on AGR cutoff of less than 1.35 and at least 1.35. Studies show various log odds ratios, weights, and confidence intervals. The overall effect size for the subgroup with AGR less than 1.35 is 3.41 [2.35, 4.95], and for AGR at least 1.35, it is 2.59 [1.66, 4.03]. Panel B: Two subgroups based on NOS score of eight and nine. Studies show corresponding log odds ratios, weights, and confidence intervals. The overall effect size for NOS eight is 2.90 [2.08, 4.05], and for NOS nine, it is 3.12 [1.83, 5.31]. Both panels show total effect sizes around 2.94 [2.22, 3.88].](https://www.frontiersin.org/files/Articles/1692103/xml-images/fneur-16-1692103-g005.webp)
Forest plots for the subgroup analyses of the association between GAR and 90-day poor functional outcome in patients with IS after EVT. (A) Subgroup analysis according to the cutoff values of GAR; (B) subgroup analysis according to the NOS scores.
Publication bias test
Funnel plots assessing the association between GAR and the risk of 90-day poor functional outcome are presented in Figure 6. The plots appeared symmetrical, indicating a low likelihood of publication bias, which was further supported by Egger’s test (p = 0.38).
Figure 6
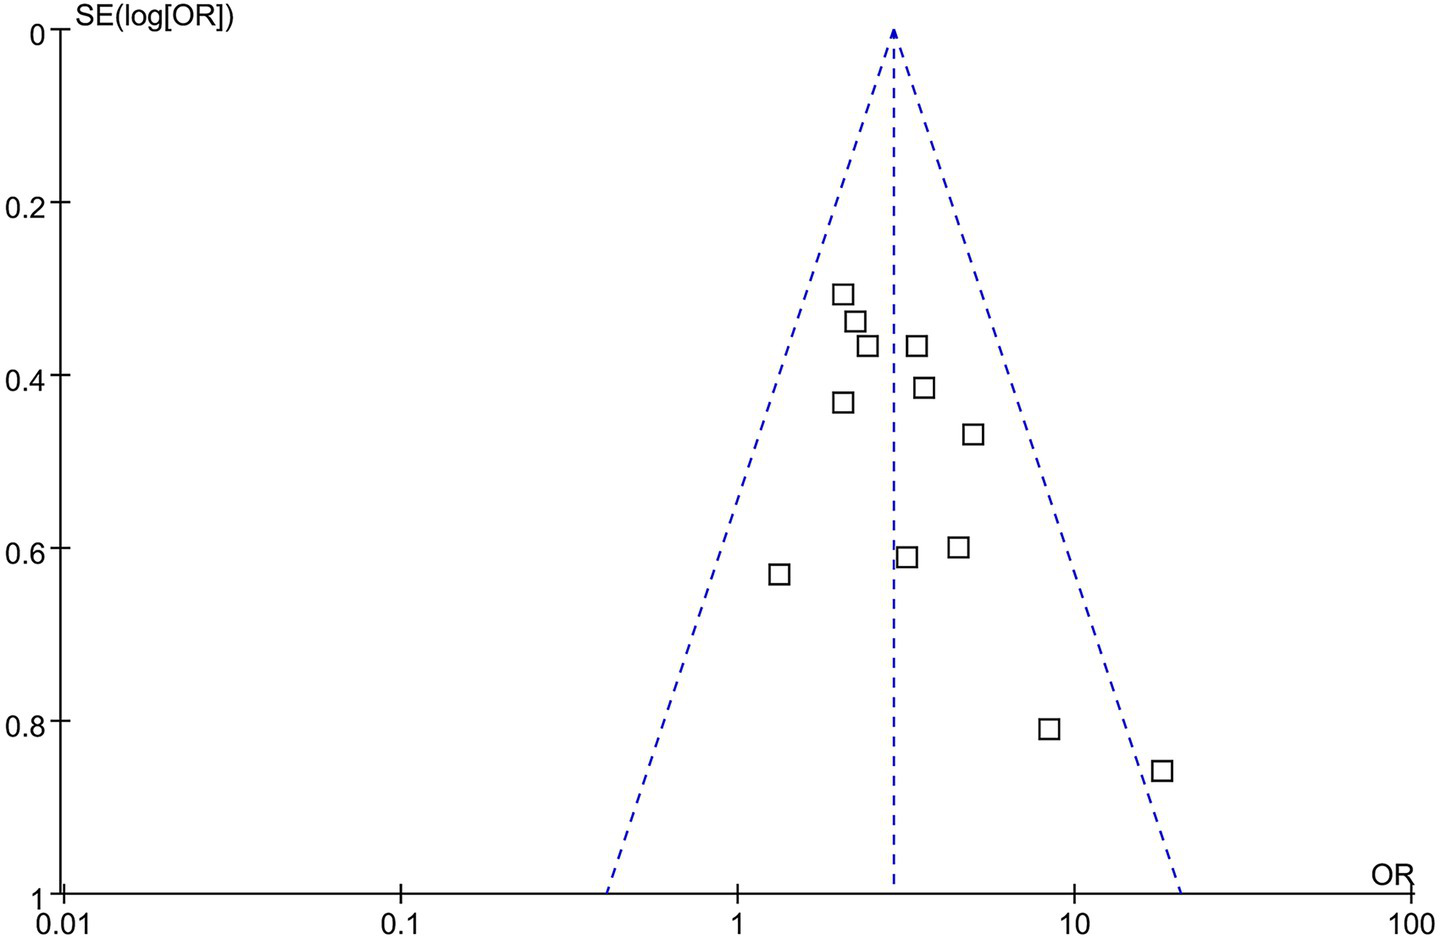
Funnel plots for estimating the potential publication bias underlying the meta-analysis of the association between GAR and 90-day poor functional outcome in patients with IS after EVT.
Certainty of evidence
According to the GRADE assessment (Supplementary Table S1), the certainty of evidence for the association between high GAR and poor 90-day functional outcome after EVT was rated as moderate, mainly because all included studies were retrospective cohorts.
Discussion
This meta-analysis provides the most comprehensive evidence to date linking an elevated GAR, a marker of stress hyperglycemia adjusted for chronic glycemia, with poor 90-day functional outcomes in IS patients undergoing EVT. By including 12 datasets from 10 studies with multivariate-adjusted effect estimates, our findings build upon prior research on stress hyperglycemia in acute stroke but extend them by specifically focusing on EVT-treated patients and by differentiating GAR from other commonly used indices such as admission glucose/HbA1c or admission glucose/estimated average glucose ratios. This distinction is clinically meaningful because these indices, while all adjusted for chronic glycemia, differ in their susceptibility to prandial effects and short-term glycemic fluctuations, factors that may influence prognostic accuracy. Our study demonstrates that GAR, particularly when derived from fasting glucose values, provides robust and independent prognostic information across diverse patient subgroups, with results remaining stable in sensitivity and meta-regression analyses.
Several biological mechanisms may underlie the association between elevated GAR and adverse functional outcomes after EVT. Stress hyperglycemia reflects a neuroendocrine and inflammatory response triggered by acute cerebral ischemia, involving activation of the hypothalamic–pituitary–adrenal axis, catecholamine release, and cytokine-driven insulin resistance (29, 30). This acute hyperglycemic surge promotes oxidative stress, endothelial dysfunction, and blood–brain barrier disruption, thereby exacerbating cerebral edema and increasing susceptibility to hemorrhagic transformation (31, 32). Hyperglycemia also amplifies excitotoxicity by enhancing glutamate release and intracellular calcium accumulation, impairing mitochondrial function, and accelerating neuronal apoptosis (33, 34). Furthermore, elevated glucose levels inhibit fibrinolysis through increased plasminogen activator inhibitor-1 expression, which may worsen microvascular reperfusion despite successful large-vessel recanalization (35). Importantly, GAR incorporates fasting blood glucose (FBG) and HbA1c, thus accounting for premorbid glycemia and distinguishing transient stress hyperglycemia from prandial effect and chronic hyperglycemia due to diabetes (36, 37). This is clinically relevant because transient glucose surges appear more deleterious than chronic hyperglycemia alone, possibly owing to the abrupt metabolic and oxidative shifts imposed on previously normoglycemic tissues (38). Indeed, oscillating glucose levels have been shown to induce greater endothelial injury and inflammatory responses than sustained hyperglycemia, providing a plausible explanation for the observed association between high GAR and poor neurological recovery (39, 40).
Subgroup analyses in our study revealed that the association between elevated GAR and poor outcomes persisted across strata defined by age, sex, baseline stroke severity, diabetes prevalence, GAR cutoff methods, and study quality, supporting the robustness and generalizability of our findings. Interestingly, meta-regression showed a trend toward an influence of diabetes prevalence on the modest heterogeneity observed (p = 0.08), with weaker associations reported in cohorts with higher proportions of diabetic patients. Although not statistically significant, this finding aligns with biological plausibility: patients with long-standing diabetes may develop adaptive mechanisms to chronic hyperglycemia, such as upregulation of antioxidant defenses or ischemic preconditioning, mitigating the additional harm imposed by acute glucose surges (41). In contrast, stress hyperglycemia in previously normoglycemic individuals likely represents a novel metabolic insult superimposed upon acute cerebral ischemia, provoking greater oxidative and inflammatory injury (42). Similar observations were reported in previous studies, where stress hyperglycemia predicted poor outcomes more strongly in non-diabetic than diabetic patients, reinforcing the need for future individual patient data (IPD) meta-analyses to delineate such interactions more precisely (43). In addition, sensitivity analyses further confirmed the stability of our findings, as sequential exclusion of individual studies did not materially alter pooled estimates. Moreover, no significant publication bias was detected using Egger’s test, although the possibility of small-study effects cannot be entirely excluded given the modest number of available studies. Taken together, these results indicate that the adverse prognostic impact of elevated GAR after EVT is unlikely to be driven by a single outlier study or by selective reporting bias, lending credibility to the observed associations.
Our findings also complement and extend two previous meta-analyses that investigated stress hyperglycemia indices in acute ischemic stroke but did not differentiate between admission glucose/HbA1c, fasting glucose/HbA1c, and admission glucose/estimated average glucose ratios, nor did they focus specifically on EVT-treated patients (36, 37). Both studies confirmed that elevated stress hyperglycemia indices were associated with worse functional outcomes, higher mortality, and increased risk of hemorrhagic complications after ischemic stroke (36, 37). However, by pooling heterogeneous indices and patient populations, including those managed medically or with intravenous thrombolysis alone, prior analyses could not identify which parameter or clinical context conferred the strongest prognostic utility (36, 37). Our meta-analysis addresses this gap by restricting inclusion to EVT-treated patients and by analyzing GAR separately from other indices, thereby demonstrating that GAR, particularly when based on fasting glucose, may offer superior and more consistent prognostic value.
The present study also has several methodological strengths. We conducted a comprehensive and up-to-date literature search across multiple databases and included only cohort studies with multivariate-adjusted risk estimates. All included studies evaluated 90-day functional outcomes using the mRS, ensuring consistency in endpoint definition. Furthermore, prespecified subgroup, sensitivity, and meta-regression analyses were performed to explore heterogeneity and assess robustness. At the same time, all studies enrolled consecutive EVT-treated patients, enhancing clinical relevance to contemporary stroke practice. Nonetheless, several limitations warrant cautious interpretation. First, all included studies were retrospective cohorts, introducing risks of selection bias, residual confounding, and incomplete data capture (44). Second, substantial heterogeneity in patient comorbidities, stroke severity, EVT techniques (e.g., device type, anesthesia modality, and reperfusion time), and operator experience could not be fully explored due to a lack of IPD. Third, definitions and cutoff values for high GAR varied across studies, although subgroup analyses stratified by cutoff determination methods yielded consistent results. Fourth, despite multivariate adjustment in individual studies, unmeasured confounders such as peri-procedural glucose management, nutritional status, infection, or withdrawal-of-care decisions might still influence outcomes. Another limitation is the lack of standardized timing and fasting status for glucose measurement across studies. While most reports specified that GAR was calculated within 24 h of admission or symptom onset, few clarified whether patients were fasted or whether samples were taken before, during, or after the EVT procedure. As EVT is often performed urgently, GAR values may have been influenced by peri-procedural stress responses, potentially contributing to between-study variability. Finally, the observational design precludes causal inference; whether stress hyperglycemia directly worsens neurological recovery or merely reflects overall illness severity remains unresolved.
From a clinical perspective, GAR offers several advantages as a prognostic biomarker. It is inexpensive, widely available, and easily calculated from routine laboratory tests, requiring no specialized equipment or delayed assays. By incorporating chronic glycemia, GAR improves upon absolute glucose values in distinguishing transient stress hyperglycemia from pre-existing diabetes, thereby refining early risk stratification after EVT. Patients with markedly elevated GAR might benefit from closer hemodynamic and metabolic monitoring, early initiation of neuroprotective strategies, or enrollment into future trials testing intensive glucose control in the hyper-acute phase of IS. However, given the observational nature and methodological limitations of current evidence, routine clinical implementation of GAR-based interventions should await confirmation from large-scale prospective studies and randomized controlled trials.
Conclusion
In conclusion, this meta-analysis demonstrates that elevated GAR is independently associated with an increased risk of poor 90-day functional outcomes in IS patients undergoing EVT. By distinguishing GAR from other stress hyperglycemia indices and focusing specifically on EVT-treated populations, our findings provide novel insights into the prognostic significance of acute-on-chronic glycemic imbalance in IS. Future multi-center prospective studies with standardized GAR assessment, IPD-level analyses, and interventional designs are needed to validate these findings, establish optimal cutoff values, and determine whether GAR-guided metabolic management can improve neurological recovery after EVT.
Statements
Data availability statement
The original contributions presented in the study are included in the article/Supplementary material, further inquiries can be directed to the corresponding author.
Author contributions
CH: Writing – original draft, Writing – review & editing, Resources, Visualization, Investigation, Formal analysis, Validation, Methodology, Data curation, Conceptualization. XW: Validation, Methodology, Formal analysis, Project administration, Writing – review & editing, Data curation, Investigation, Visualization. HC: Methodology, Data curation, Validation, Investigation, Formal analysis, Writing – review & editing, Software, Visualization. YS: Writing – review & editing, Project administration, Supervision, Formal analysis, Methodology, Conceptualization, Visualization, Investigation, Data curation, Software, Validation.
Funding
The author(s) declare that no financial support was received for the research and/or publication of this article.
Conflict of interest
The authors declare that the research was conducted in the absence of any commercial or financial relationships that could be construed as a potential conflict of interest.
Generative AI statement
The authors declare that no Gen AI was used in the creation of this manuscript.
Any alternative text (alt text) provided alongside figures in this article has been generated by Frontiers with the support of artificial intelligence and reasonable efforts have been made to ensure accuracy, including review by the authors wherever possible. If you identify any issues, please contact us.
Publisher’s note
All claims expressed in this article are solely those of the authors and do not necessarily represent those of their affiliated organizations, or those of the publisher, the editors and the reviewers. Any product that may be evaluated in this article, or claim that may be made by its manufacturer, is not guaranteed or endorsed by the publisher.
Supplementary material
The Supplementary material for this article can be found online at: https://www.frontiersin.org/articles/10.3389/fneur.2025.1692103/full#supplementary-material
References
1.
Martin SS Aday AW Allen NB Almarzooq ZI Anderson CAM Arora P et al . 2025 heart disease and stroke statistics: a report of US and global data from the American Heart Association. Circulation. (2025) 151:e41–e660. doi: 10.1161/cir.0000000000001303
2.
Feigin VL Brainin M Norrving B Martins SO Pandian J Lindsay P et al . World stroke organization: global stroke fact sheet 2025. Int J Stroke. (2025) 20:132–44. doi: 10.1177/17474930241308142
3.
Feigin VL Owolabi MO . Pragmatic solutions to reduce the global burden of stroke: a world stroke organization-lancet neurology commission. Lancet Neurol. (2023) 22:1160–206. doi: 10.1016/s1474-4422(23)00277-6
4.
Sahoo A Abdalkader M Yamagami H Huo X Sun D Jia B et al . Endovascular therapy for acute stroke: new evidence and indications. J Neuroendovasc Ther. (2023) 17:232–42. doi: 10.5797/jnet.ra.2023-0047
5.
Lauer D Sulženko J Malíková H Štětkářová I Widimský P . Advances in endovascular thrombectomy for the treatment of acute ischemic stroke. Expert Rev Neurother. (2025) 25:675–87. doi: 10.1080/14737175.2025.2490538
6.
Deng G Chu YH Xiao J Shang K Zhou LQ Qin C et al . Risk factors, pathophysiologic mechanisms, and potential treatment strategies of futile recanalization after endovascular therapy in acute ischemic stroke. Aging Dis. (2023) 14:2096–112. doi: 10.14336/ad.2023.0321-1
7.
Kremers F Venema E Duvekot M Yo L Bokkers R Lycklama À. Nijeholt G et al . Outcome prediction models for endovascular treatment of ischemic stroke: systematic review and external validation. Stroke. (2022) 53:825–36. doi: 10.1161/strokeaha.120.033445
8.
Zhang H Yue K Jiang Z Wu X Li X Luo P et al . Incidence of stress-induced hyperglycemia in acute ischemic stroke: a systematic review and Meta-analysis. Brain Sci. (2023) 13:556. doi: 10.3390/brainsci13040556
9.
Ferrari F Moretti A Villa RF . Hyperglycemia in acute ischemic stroke: physiopathological and therapeutic complexity. Neural Regen Res. (2022) 17:292–9. doi: 10.4103/1673-5374.317959
10.
Roberts GW Quinn SJ Valentine N Alhawassi T O'Dea H Stranks SN et al . Relative hyperglycemia, a marker of critical illness: introducing the stress hyperglycemia ratio. J Clin Endocrinol Metab. (2015) 100:4490–7. doi: 10.1210/jc.2015-2660
11.
Song G Liu X Lu Z Guan J Chen X Li Y et al . Relationship between stress hyperglycaemic ratio (SHR) and critical illness: a systematic review. Cardiovasc Diabetol. (2025) 24:188. doi: 10.1186/s12933-025-02751-3
12.
Krongsut S Kaewkrasaesin C . Performance comparison of stress hyperglycemia ratio for predicting fatal outcomes in patients with thrombolyzed acute ischemic stroke. PLoS One. (2024) 19:e0297809. doi: 10.1371/journal.pone.0297809
13.
Shen CL Xia NG Wang H Zhang WL . Association of stress hyperglycemia ratio with acute ischemic stroke outcomes post-thrombolysis. Front Neurol. (2021) 12:785428. doi: 10.3389/fneur.2021.785428
14.
Merlino G Pez S Gigli GL Sponza M Lorenzut S Surcinelli A et al . Stress hyperglycemia in patients with acute ischemic stroke due to large vessel occlusion undergoing mechanical Thrombectomy. Front Neurol. (2021) 12:725002. doi: 10.3389/fneur.2021.725002
15.
Dai Z Cao H Wang F Li L Guo H Zhang X et al . Impacts of stress hyperglycemia ratio on early neurological deterioration and functional outcome after endovascular treatment in patients with acute ischemic stroke. Front Endocrinol. (2023) 14:1094353. doi: 10.3389/fendo.2023.1094353
16.
Duan H Yun HJ Rajah GB Che F Wang Y Liu J et al . Large vessel occlusion stroke outcomes in diabetic vs. non-diabetic patients with acute stress hyperglycemia. Front Neurosci. (2023) 17:1073924. doi: 10.3389/fnins.2023.1073924
17.
Wang Z Fan L . Does stress hyperglycemia in diabetic and non-diabetic acute ischemic stroke patients predict unfavorable outcomes following endovascular treatment?Neurol Sci. (2023) 44:1695–702. doi: 10.1007/s10072-023-06625-y
18.
Zhang J Dong D Zeng Y Yang B Li F Chen X et al . The association between stress hyperglycemia and unfavorable outcomes in patients with anterior circulation stroke after mechanical thrombectomy. Front Aging Neurosci. (2023) 14:1071377. doi: 10.3389/fnagi.2022.1071377
19.
Zhang HJ Yu SH Qian MY Ge ZL Tao ZH . Stress hyperglycemia ratio predicts the outcome of successful recanalization after endovascular treatment in patients with acute ischemic stroke. Int J Cerbrovasc Dis. (2023b) 31:339–44. doi: 10.3760/cma.j.issn.1673-4165.2023.05.004
20.
Merlino G Romoli M Ornello R Foschi M del Regno C Toraldo F et al . Stress hyperglycemia is associated with futile recanalization in patients with anterior large vessel occlusion undergoing mechanical thrombectomy. Eur Stroke J. (2024) 9:613–22. doi: 10.1177/23969873241247400
21.
Yang B Chen X Li F Zhang J Dong D Ou H et al . Stress hyperglycemia increases short-term mortality in acute ischemic stroke patients after mechanical thrombectomy. Diabetol Metab Syndr. (2024) 16:32. doi: 10.1186/s13098-024-01272-5
22.
Gao J Chen X Huang Q Gu M Hong Y Xu G . Stress hyperglycemia is associated with unfavorable outcomes after mechanical thrombectomy in patients with acute ischemic stroke. Brain Sci. (2025) 15:360. doi: 10.3390/brainsci15040360
23.
Tsuji Y Kashiwagi H Fukumura M Futamura G Yagi R Hiramatsu R et al . Stress hyperglycemia could influence futile recanalization in patients who undergo mechanical Thrombectomy for stroke caused by large vessel occlusion. World Neurosurg. (2025) 195:123697. doi: 10.1016/j.wneu.2025.123697
24.
Page MJ McKenzie JE Bossuyt PM Boutron I Hoffmann T Mulrow C et al . The PRISMA 2020 statement: an updated guideline for reporting systematic reviews. BMJ. (2021) 372:n71. doi: 10.1136/bmj.n71
25.
Higgins J Thomas J Chandler J In: The Cochrane Collaboration, editor. Cochrane handbook for systematic reviews of interventions version 6.2. London: (2021)
26.
Wells GA Shea B O'Connell D . The Newcastle-Ottawa Scale (NOS) for assessing the quality of nonrandomised studies in meta-analyses. Ottawa Canada: The Ottawa Hospital Research Institute (2010).
27.
Higgins JP Thompson SG . Quantifying heterogeneity in a meta-analysis. Stat Med. (2002) 21:1539–58. doi: 10.1002/sim.1186
28.
Egger M Davey Smith G Schneider M Minder C . Bias in meta-analysis detected by a simple, graphical test. BMJ. (1997) 315:629–34. doi: 10.1136/bmj.315.7109.629
29.
Yao M Hao Y Wang T Xie M Li H Feng J et al . A review of stress-induced hyperglycaemia in the context of acute ischaemic stroke: definition, underlying mechanisms, and the status of insulin therapy. Front Neurol. (2023) 14:1149671. doi: 10.3389/fneur.2023.1149671
30.
Vedantam D Poman DS Motwani L Asif N Patel A Anne KK . Stress-induced hyperglycemia: consequences and management. Cureus. (2022) 14:e26714. doi: 10.7759/cureus.26714
31.
Venkat P Chopp M Chen J . Blood-brain barrier disruption, vascular impairment, and ischemia/reperfusion damage in diabetic stroke. J Am Heart Assoc. (2017) 6:5819. doi: 10.1161/jaha.117.005819
32.
Ergul A Li W Elgebaly MM Bruno A Fagan SC . Hyperglycemia, diabetes and stroke: focus on the cerebrovasculature. Vasc Pharmacol. (2009) 51:44–9. doi: 10.1016/j.vph.2009.02.004
33.
Long C Pu Y Keng S Tao J Zhang B Yue R . Novel insights into the mechanism and treatment of diabetes-related brain complications: focusing on the blood-brain barrier impairment. Aging Dis. (2025). doi: 10.14336/ad.2025.0296
34.
Verma M Lizama BN Chu CT . Excitotoxicity, calcium and mitochondria: a triad in synaptic neurodegeneration. Transl Neurodegener. (2022) 11:3. doi: 10.1186/s40035-021-00278-7
35.
Krinock MJ Singhal NS . Diabetes, stroke, and neuroresilience: looking beyond hyperglycemia. Ann N Y Acad Sci. (2021) 1495:78–98. doi: 10.1111/nyas.14583
36.
Huang YW Li ZP Yin XS . Stress hyperglycemia and risk of adverse outcomes in patients with acute ischemic stroke: a systematic review and dose-response meta-analysis of cohort studies. Front Neurol. (2023) 14:1219863. doi: 10.3389/fneur.2023.1219863
37.
Jiang Z Wang K Duan H du H Gao S Chen J et al . Association between stress hyperglycemia ratio and prognosis in acute ischemic stroke: a systematic review and meta-analysis. BMC Neurol. (2024) 24:13. doi: 10.1186/s12883-023-03519-6
38.
González P Lozano P Ros G Solano F . Hyperglycemia and oxidative stress: an integral, updated and critical overview of their metabolic interconnections. Int J Mol Sci. (2023) 24:352. doi: 10.3390/ijms24119352
39.
Ceriello A Esposito K Piconi L Ihnat MA Thorpe JE Testa R et al . Oscillating glucose is more deleterious to endothelial function and oxidative stress than mean glucose in normal and type 2 diabetic patients. Diabetes. (2008) 57:1349–54. doi: 10.2337/db08-0063
40.
Toma L Sanda GM Stancu CS Niculescu LS Raileanu M Sima AV . Oscillating glucose induces the increase in inflammatory stress through Ninjurin-1 up-regulation and stimulation of transport proteins in human endothelial cells. Biomolecules. (2023) 13:626. doi: 10.3390/biom13040626
41.
Chan L Terashima T Fujimiya M Kojima H . Chronic diabetic complications: the body's adaptive response to hyperglycemia gone awry?Trans Am Clin Climatol Assoc. (2006) 117:341–51.
42.
Yang Z Tian Y Liu Y Hennessy S Kron IL French BA . Acute hyperglycemia abolishes ischemic preconditioning by inhibiting Akt phosphorylation: normalizing blood glucose before ischemia restores ischemic preconditioning. Oxidative Med Cell Longev. (2013) 2013:329183. doi: 10.1155/2013/329183
43.
Bellis A Mauro C Barbato E Ceriello A Cittadini A Morisco C . Stress-induced Hyperglycaemia in non-diabetic patients with acute coronary syndrome: from molecular mechanisms to new therapeutic perspectives. Int J Mol Sci. (2021) 22:775. doi: 10.3390/ijms22020775
44.
Sedgwick P . Retrospective cohort studies: advantages and disadvantages. BMJ. (2014) 348:g1072. doi: 10.1136/bmj.g1072
Summary
Keywords
glucose-to-glycated hemoglobin ratio, ischemic stroke, functional outcome, stress hyperglycemia, meta-analysis
Citation
Hong C, Wang X, Chen H and Sun Y (2025) Fasting blood glucose-to-glycated hemoglobin ratio and functional outcomes in patients with ischemic stroke following endovascular treatment—a meta-analysis. Front. Neurol. 16:1692103. doi: 10.3389/fneur.2025.1692103
Received
25 August 2025
Accepted
11 October 2025
Published
04 December 2025
Volume
16 - 2025
Edited by
Stanley Zimba, University of Zambia, Zambia
Reviewed by
Eitzaz Sadiq, University of the Witwatersrand, South Africa
Tengfei Shao, Nanjing University, China
Updates
Copyright
© 2025 Hong, Wang, Chen and Sun.
This is an open-access article distributed under the terms of the Creative Commons Attribution License (CC BY). The use, distribution or reproduction in other forums is permitted, provided the original author(s) and the copyright owner(s) are credited and that the original publication in this journal is cited, in accordance with accepted academic practice. No use, distribution or reproduction is permitted which does not comply with these terms.
*Correspondence: Ying Sun, sunying701211@163.com
Disclaimer
All claims expressed in this article are solely those of the authors and do not necessarily represent those of their affiliated organizations, or those of the publisher, the editors and the reviewers. Any product that may be evaluated in this article or claim that may be made by its manufacturer is not guaranteed or endorsed by the publisher.