Abstract
Background:
Neuromyelitis optica spectrum disorder (NMOSD) and myelin oligodendrocyte glycoprotein antibody-associated disease (MOGAD) are demyelinating diseases of the central nervous system. Brain atrophy is well recognized in multiple sclerosis; however, approximately 50% of studies report no significant difference in overall brain volumes when comparing NMOSD patients with healthy controls (HCs). To quantitatively assess differences in brain volume and white matter integrity in NMOSD and MOGAD patients compared to HCs through a meta-analysis.
Methods:
A systematic literature search of English articles in PubMed was performed through December 2024. We analyzed sixty-one studies that met the inclusion criteria, providing volumetric MRI or diffusion tensor imaging data with HC comparisons. Outcomes of interest included brain volume, and DTI parameters. Standardized mean differences were computed, and random-effects meta-analyses were performed to account for study heterogeneity.
Results:
The studies included data from 1,786 NMOSD patients, 376 MOGAD patients, and 1,936 HCs. NMOSD patients exhibited significantly lower total brain, gray, and white matter volumes compared to HCs. Notable atrophy was observed in several regions including the accumbens, brainstem, caudate, cerebellum, hippocampus, putamen, and thalamus. MOGAD patients have reduced brain volume compared to HCs. Furthermore, comparisons demonstrated that NMOSD patients had significantly lower brain and gray matter volumes than MOGAD patients.
Conclusion:
Our meta-analysis confirms substantial brain atrophy in NMOSD patients compared to both HCs and individuals with MOGAD, indicating a more pronounced neurodegenerative impact than previously recognized. These findings carry important clinical implications by enhancing our understanding of disease-specific imaging biomarkers.
1 Introduction
Neuromyelitis optica spectrum disorder (NMOSD) is a chronic inflammatory autoimmune astrocytopathy disease of the central nervous system (CNS) characterized by optic neuritis (ON) and transverse myelitis (TM) (1, 2). NMOSD is most commonly associated with a pathogenic serum IgG antibody targeting the water channel aquaporin-4 (AQP4) (3). Although NMOSD is not a primary demyelinating disorder, astrocyte damage is followed by secondary demyelination and neuronal injury (4, 5). There are patients that have typical NMOSD symptoms in the absence of this antibody and are classified as seronegative NMOSD (6). Notably, a subset of these patients has since been reclassified as having myelin oligodendrocyte glycoprotein antibody-associated disease (MOGAD), following the identification of antibodies against myelin oligodendrocyte glycoprotein (MOG), a protein located in the myelin sheath (7, 8).
Magnetic resonance imaging (MRI) has revolutionized the diagnostic approach to demyelinating disorders (9, 10). It enables visualization of both active and inactive lesions across the CNS and plays a role in assessing disease progression and therapeutic response (11). Volumetric MRI, which assesses changes in brain and spinal cord volumes, is particularly valuable (12, 13). It provides quantitative data that reflect the extent of neurodegeneration, which is crucial for predicting long-term outcomes such as disability (14).
NMOSD exhibits a diverse range of brain MRI findings that differ markedly from those observed in multiple sclerosis (MS) and MOGAD (15). Notably, up to 40% of patients exhibit normal or only non-specific brain imaging at onset (16). When present, lesions often include unique “ground glass”-like heterogeneous lesions in the corpus callosum, which may help differentiate NMOSD from MS (17). Hypothalamic involvement, characterized by high T2/FLAIR signal intensities extending into the adjacent parenchyma and third ventricular walls, is another distinguishing feature. Although gadolinium-enhancing lesions are rare in NMOSD, a characteristic “cloud-like” enhancement patternis occasionally observed (18). Cerebral T2 lesions in NMOSD tend to shrink over time, often leaving residual high signal intensity, unlike MS, where lesions commonly persist, or MOGAD, where they frequently resolve (15). Importantly, lesions in the posterior medulla corresponding to area postrema syndrome are considered highly specific for NMOSD, as are abnormalities in the peri-aqueductal gray, nucleus tractus solitarius, and floor of the fourth ventricle (19). Brainstem and cerebellar lesions are less common overall, though dentate nucleus involvement may occur (17).
Diffusion tensor imaging (DTI) is an advanced MRI technique that tracks the diffusion of water molecules in tissue, revealing the microstructural integrity of white matter tracts (20). In demyelinating disorders, DTI provides invaluable insights into the extent of white matter damage beyond what is visible on standard MRI scans (21). It quantifies damage in terms of reduced diffusion anisotropy, which can be indicative of axonal loss and demyelination (20).
In NMOSD, DTI studies have demonstrated significant white matter abnormalities even in regions appearing normal on conventional MRI scans (22). These abnormalities include reduced fractional anisotropy and increased mean diffusivity, suggesting widespread disruption of normal white matter integrity (23).
Investigations into brain volume differences between NMOSD patients and healthy controls (HCs) have yielded inconsistent results. While approximately half of the studies report significant brain atrophy in NMOSD, others find no measurable differences compared to HCs. This meta-analysis aims to reconcile these divergent findings by conducting a comprehensive review and synthesis of the available literature on brain volume in NMOSD and MOGAD patients.
2 Methods
2.1 Search strategy
A systematic review of peer-reviewed, English-language articles from the PubMed database was conducted, utilizing the search terms “NMOSD,” “NMO,” “AQP4,” “MOG-IgG,” “MOGAD,” “MOG” without limiting the year of publication. The most recent literature search was completed in December 2024. Initial screening based on titles and abstracts led to the selection of articles pertinent to this study, followed by an in-depth analysis of the full texts. The reference lists of the selected articles were also screened for additional relevant studies; however, gray literature was not included.
2.2 Selection criteria
Information was extracted on DTI parameters, fractional anisotropy (FA), mean diffusivity (MD), axial diffusivity (AD), and radial diffusivity (RD) within normal-appearing white matter (NAWM), as well as total brain volume, gray matter volume, white matter volume, and volumes of various brain tissues including: accumbens, amygdala brainstem, caudate, cerebellum, hippocampus, pallidum, putamen and thalamus.
Inclusion criteria comprised articles presenting data on brain volumes or DTI metrics in NMOSD and MOGAD patients. Articles were selected for inclusion in one or more of three pairwise comparisons: MOGAD vs. NMOSD, MOGAD vs. HCs, and NMOSD vs. HCs. Studies reporting data on all three groups were included in all comparisons, whereas studies presenting data for only two groups were incorporated solely into the relevant pairwise comparison. Exclusion criteria were applied to non-English articles, or studies with incomplete data. The NMOSD patient group included individuals diagnosed with NMOSD who were either positive or negative for AQP4-IgG antibodies.
2.3 Data extraction
Two researchers independently screened the resulting articles initially based on title, abstract and then full text. Articles were excluded based on predefined eligibility criteria with discrepancies resolved by consensus. Two researchers independently extracted data from the included studies using a standard form. The type of data that were extracted included volumetric information, DTI information and the number of participants. Where data were not available, the authors of these studies were contacted to request the data.
2.4 Data analysis
For each pairwise comparison, the standardized mean difference (SMD) was calculated to quantify the effect size. The pooled standard deviation was computed from the standard deviations of the two groups. The corresponding variance for each SMD was estimated to account for sampling error. Random-effects meta-analyses were performed using the restricted maximum likelihood (REML) method implemented in the metafor package. This approach was chosen to account for potential heterogeneity across studies. Heterogeneity was assessed with the I2 statistic, and studies were combined for three comparisons: NMOSD vs. HC, MOGAD vs. HC, and MOGAD vs. NMOSD. Sensitivity analysis, through the leave-one-out approach, was utilized to determine the influence of individual studies on the overall meta-analytic effect. The risk of publication bias was assessed by visually inspecting funnel plots and Egger’s test (24). A p-value of less than 0.05 was determined as statistically significant.
3 Results
3.1 Search results
Our systematic search identified 6,469 records across pubmed and an additional 5 studies through manual searches. The entries were screened by title and abstract, leading to the full-text assessment of 144 articles. Of these, 83 were excluded: 55 did not report any brain volume data, 23 mentioned brain volume without providing numerical values, and 5 included data for only one group. Ultimately, 61 articles met the eligibility criteria and were included in this meta-analysis (Figure 1). In those articles were a total of 1786 NMOSD, 376 MOGAD patients and 1936 HCs (Table 1). Regarding age and sex differences between groups, most included studies either matched patients and controls on these variables, normalized results for head size, or reported no significant differences in age or sex.
Figure 1

Flowchart of the study.
Table 1
| First Author | Publication year | Participants | Mean age | Female (%) | HC vs. NMOSD volumetric | HC vs. MOGAD volumetric | MOGAD vs. NMOSD volumetric | HC vs. NMOSD DTI |
|---|---|---|---|---|---|---|---|---|
| Rocca MA (37) | 2004 | HC: 15 NMOSD:10 | HC: 48.30 NMOSD: 48.1 | HC: 60% NMOSD: 60% | Yes | Yes | ||
| Pichiecchio (38) | 2011 | HC: 17 NMOSD:8 | HC: No Information NMOSD: 50 | HC: No Information NMOSD: 100% | Yes | |||
| Liu Y (39) | 2011 | HC: 27 NMOSD:27 | HC: 34.20 NMOSD: 35.10 | HC: 93% NMOSD: 93% | Yes | |||
| Blanc F (40) | 2012 | HC: 28 NMOSD:28 | HC: 42.00 NMOSD: 45.30 | HC: 68% NMOSD: 68% | Yes | |||
| Chanson JB (41) | 2013 | HC: 30 NMOSD:30 | HC: 41.70 NMOSD: 46.20 | HC: 63% NMOSD: 63% | Yes | |||
| Calabrese M (42) | 2012 | HC: 30 NMOSD:30 | HC: 42.30 NMOSD: 42.60 | HC: 70% NMOSD: 70% | Yes | |||
| Sánchez-Catasús CA (27) | 2013 | HC: 15 NMOSD:15 | HC: 46.60 NMOSD: 41.00 | HC: 87% NMOSD: 87% | Yes | |||
| von Glehn F (43) | 2014 | HC: 34 NMOSD:21 | HC: 42.00 NMOSD: 38.00 | HC: 82% NMOSD: 90% | Yes | |||
| Weier K (44) | 2015 | HC: 34 NMOSD:30 | HC: 31.40 NMOSD: 33.50 | HC: 88% NMOSD:87% | Yes | |||
| Liu Y (45) | 2015 | HC: 35 NMOSD:35 | HC: 32.23 NMOSD: 35.40 | HC: 80% NMOSD:89% | Yes | |||
| Zhang LJ (46) | 2015 | HC: 26 NMOSD:49 | HC: 45.30 NMOSD: 47.60 | HC: 86% NMOSD:88% | Yes | |||
| Liu Y (47) | 2015 | HC: 40 NMOSD:39 | HC: 33.70 NMOSD: 36.90 | HC: 70% NMOSD:89% | Yes | |||
| Liu Y (48) | 2015 | HC: 27 NMOSD:54 | HC: 51.22 NMOSD: 49.39 | HC: 81% NMOSD:89% | Yes | Yes | ||
| Pache F (49) | 2016 | HC: 21 NMOSD:21 | HC: 44.80 NMOSD: 44.70 | HC: 86% NMOSD:86% | Yes | |||
| Schneider R (50) | 2017 | HC: 26 NMOSD:18 | HC: 39.7 NMOSD: 42.1 | HC: 46% NMOSD:78% | Yes | |||
| Finke C (51) | 2016 | HC: 36 NMOSD:36 | HC: 45.4 NMOSD: 47.9 | HC: 94% NMOSD:94% | Yes | |||
| Streitberger KJ (52) | 2017 | HC: 17 NMOSD:15 | HC: 46.00 NMOSD: 48.00 | HC: 82% NMOSD:80% | Yes | |||
| Qian W (53) | 2016 | HC: 18 NMOSD:13 | HC: 43.40 NMOSD: 44.20 | HC: 61% NMOSD:87% | Yes | |||
| Hyun JW (54) | 2017 | HC: 44 NMOSD:91 | HC: 39.00 NMOSD: 36.00 | HC: 89% NMOSD:90% | Yes | |||
| Su L (55) | 2016 | HC: 18 NMOSD:26 | HC: 48.11 NMOSD: 47.00 | HC: 83% NMOSD:81% | Yes | |||
| Kim SH (56) | 2017 | HC: 43 NMOSD:93 | HC: 39.00 NMOSD: 37.00 | HC: 88% NMOSD:83% | Yes | |||
| Liu Y (57) | 2018 | HC: 24 NMOSD:25 | HC: 34.60 NMOSD: 35.60 | HC:75% NMOSD: 84% | Yes | |||
| Tian DC (58) | 2018 | HC: 24 NMOSD:36 | HC: 40.50 NMOSD: 41.40 | HC:92% NMOSD: 83% | Yes | |||
| Kim SH (59) | 2017 | HC: 44 NMOSD:73 | HC: 38.60 NMOSD: 36.80 | HC: 89% NMOSD:96% | Yes | Yes | ||
| Sun J (60) | 2017 | HC: 30 NMOSD:36 | HC: 47.40 NMOSD: 47.23 | HC: 73% NMOSD:81% | Yes | Yes | ||
| Lee CY (61) | 2018 | HC: 18 NMOSD:13 | HC: 43.40 NMOSD: 44.20 | HC: 50% NMOSD:85% | Yes | |||
| Rueda-Lopes FC (62) | 2018 | HC: 19 NMOSD:28 | HC: 44.10 NMOSD: 38.50 | HC: 74% NMOSD:72% | Yes | |||
| Rocca MA (63) | 2019 | HC: 30 NMOSD:28 | HC: 42.30 NMOSD: 42.40 | HC: 70% NMOSD:79% | Yes | |||
| Kuchling J (64) | 2018 | HC:26 NMOSD:23 | HC: 43.70 NMOSD: 46.70 | HC: 85% NMOSD:87% | Yes | |||
| Chen X (65) | 2019 | HC:26 NMOSD:30 | HC: 36.69 NMOSD: 41.70 | HC: 92% NMOSD:96% | Yes | |||
| Savoldi F (66) | 2020 | HC:30 NMOSD:25 | HC: 42.30 NMOSD: 43.40 | HC: 70% NMOSD:76% | Yes | |||
| Papadopoulou A | 2019 | HC:37 NMOSD:39 | HC: 47.80 NMOSD: 50.10 | HC: 87% NMOSD:92% | Yes | |||
| Pudlac A (67) | 2020 | HC:20 NMOSD:20 | HC: 50.00 NMOSD: 48.00 |
HC: 80% NMOSD:80% | Yes | |||
| Tian DC (68) | 2020 | HC:55 NMOSD:90 | HC: 46.10 NMOSD: 45.30 | HC: 78% NMOSD:84% | Yes | |||
| Asseyer S (69) | 2020 | HC:37 NMOSD:32 | HC: 47.80 NMOSD: 51.10 | HC: 87% NMOSD:97% | Yes | |||
| Heine J (70) | 2020 | HC:30 NMOSD:30 | HC: 44.00 NMOSD: 45.50 | HC: 90% NMOSD:90% | Yes | |||
| Duan Y (71) | 2021 | HC:60 NMOSD:38 MOGAD:35 | HC: 36.90 NMOSD: 37.70 MOGAD:36.40 | HC: 52% NMOSD:84% MOGAD: 60% | Yes | Yes | Yes | Yes |
| Messina S (72) | 2022 | HC:18 NMOSD:19 MOGAD:20 | HC: 38.90 NMOSD: 55.60 MOGAD:41.80 | HC: 56% NMOSD:68% MOGAD: 50% | Yes | Yes | Yes | Yes |
| Gao C (73) | 2021 | HC:28 NMOSD:13 MOGAD:11 | HC: 39.64 NMOSD: 41.77 MOGAD:41.09 | HC: 68% NMOSD:85% MOGAD: 82% | Yes | Yes | Yes | Yes |
| Zheng F (74) | 2022 | HC:280 NMOSD:236 | HC: 38.90 NMOSD: 41.09 | HC:57% NMOSD:88% | Yes | |||
| Chen X (75) | 2021 | HC:56 NMOSD:42 | Yes | |||||
| Cacciaguerra L (76) | 2021 | HC:101 NMOSD:28 | HC: 37.60 NMOSD: 43.60 | HC:44% NMOSD:79% | Yes | |||
| Andica C (77) | 2022 | HC:19 NMOSD:18 | HC: 51.47 NMOSD: 52.67 | HC:68% NMOSD:89% | Yes | |||
| Rechtman A (78) | 2022 | HC:22 MOGAD:22 | HC: 38.23 MOGAD: 33.10 | HC:77% MOGAD:82% | Yes | |||
| Cacciaguerra L (79) | 2022 | HC:101 NMOSD:72 | HC: 42.60 NMOSD: 43.90 | HC:71% NMOSD:83% | Yes | |||
| Zhang Y (80) | 2022 | HC:20 NMOSD:33 | HC: 45.20 NMOSD: 44.58 | HC:100% NMOSD:94% | Yes | |||
| Cacciaguerra L (81) | 2022 | HC:27 NMOSD:30 | HC: 41.20 NMOSD: 44.10 | HC:70% NMOSD:78% | Yes | |||
| Cortese R (82) | 2023 | HC:34 NMOSD:30 MOGAD:30 | HC: 34.7 NMOSD: 40.60 MOGAD:36.90 | HC: 71% NMOSD:80% MOGAD: 67% | Yes | Yes | Yes | |
| Wei R (83) | 2023 | HC:269 NMOSD:199 | HC: 38.50 NMOSD: 41.00 | HC:57% NMOSD:88% | Yes | |||
| Lotan I (84) | 2023 | HC:37 NMOSD:47 MOGAD:24 | HC: 40.10 NMOSD: 50.40 MOGAD:39.20 | HC: 84% NMOSD:94% MOGAD: 71% | Yes | Yes | Yes | |
| Xie Y (85) | 2023 | HC:34 NMOSD:35 | HC: 35.79 NMOSD: 42.34 | HC:67% NMOSD:80% | Yes | |||
| Bartels F (86) | 2023 | HC:90 MOGAD:16 | HC: No Information MOGAD: 4.51 | HC: No Information MOGAD:50% | Yes | |||
| Zakani M (87) | 2023 | HC:11 NMOSD:9 | No Information | No Information | Yes | |||
| Sun J (88) | 2023 | HC:48 NMOSD:99 MOGAD:28 | HC: 36.00 NMOSD: 44.00 MOGAD:36.00 | HC: 6% NMOSD:89% MOGAD: 75% | Yes | Yes | Yes | |
| Masuda H (89) | 2023 | HC:29 NMOSD:29 | HC: 61.00 NMOSD: 59.00 | HC:76% NMOSD:76% | Yes | |||
| Ma H (90) | 2024 | HC:22 NMOSD:18 | HC: 44.36 NMOSD: 42.11 | HC:86% NMOSD:76% | Yes | |||
| Wang Y (91) | 2024 | HC:45 NMOSD:30 | HC: 41.84 NMOSD: 37.70 | HC:73% NMOSD:90% | Yes | |||
| Cortese R (36) | 2024 | HC:144 NMOSD:135 MOGAD:135 | HC: 37.20 NMOSD: 51.10 MOGAD:40.90 | HC: 60% NMOSD:82% MOGAD: 61% | Yes | Yes | Yes | |
| Schneider R (92) | 2024 | HC:49 MOGAD:23 | HC: 31.40 MOGAD: 33.30 | HC:53% MOGAD:73.90% | Yes | |||
| Tsai CC (93) | 2024 | HC:21 NMOSD:17 | HC: 42.00 NMOSD: 44.00 | HC:71% NMOSD:65% | Yes |
All studies included in this meta-analysis.
HC, Healthy Control; NMOSD, Neuromyelitis optica spectrum disorder; DTI, diffusion tensor imaging.
3.2 Brain volume is significantly lower in NMOSD patients compared to HCs
Our analysis demonstrated that NMOSD patients had significantly lower total brain volume compared to HCs, (SMD = −0.59, 95% CI [(−0.68) – (−0.50)], p < 0.0001, I2 = 34.31). This pattern of reduced volume was consistent across various brain structures. Specifically, the gray matter volume was lower in NMOSD patients (SMD = −0.48, 95% CI [(−0.60) – (−0.37)], p < 0.0001, I2 = 50.45), and white matter volume by (SMD = −0.40, 95% CI [(−0.57) – (−0.22)], p < 0.0001, I2 = 75.78). Furthermore, notable reductions were observed in the volume of the accumbens (SMD = −0.45, 95% CI [(−0.72) – (−0.17)], p = 0.002, I2 = 62.57), brainstem (SMD = −0.42, 95% CI [(−0.83) – (−0.01)], p = 0.05, I2 = 70.14), caudate (SMD = −0.22, 95% CI [(−0.40) – (−0.03)], p = 0.02, I2 = 54.06), cerebellum (SMD = −0.35, 95% CI [(−0.55) – (−0.14)], p = 0.0001, I2 = 27.27), hippocampus (SMD = −0.24, 95% CI [(−0.44) – (−0.05)], p = 0.01, I2 = 66.71), putamen (SMD = −0.36, 95% CI [(−0.49) – (−0.24)], p < 0.0001, I2 = 0.00), and thalamus (SMD = −0.59, 95% CI [(−0.81) – (−0.36)], p < 0.0001, I2 = 77.73) (Figure 2; Table 2).
Figure 2
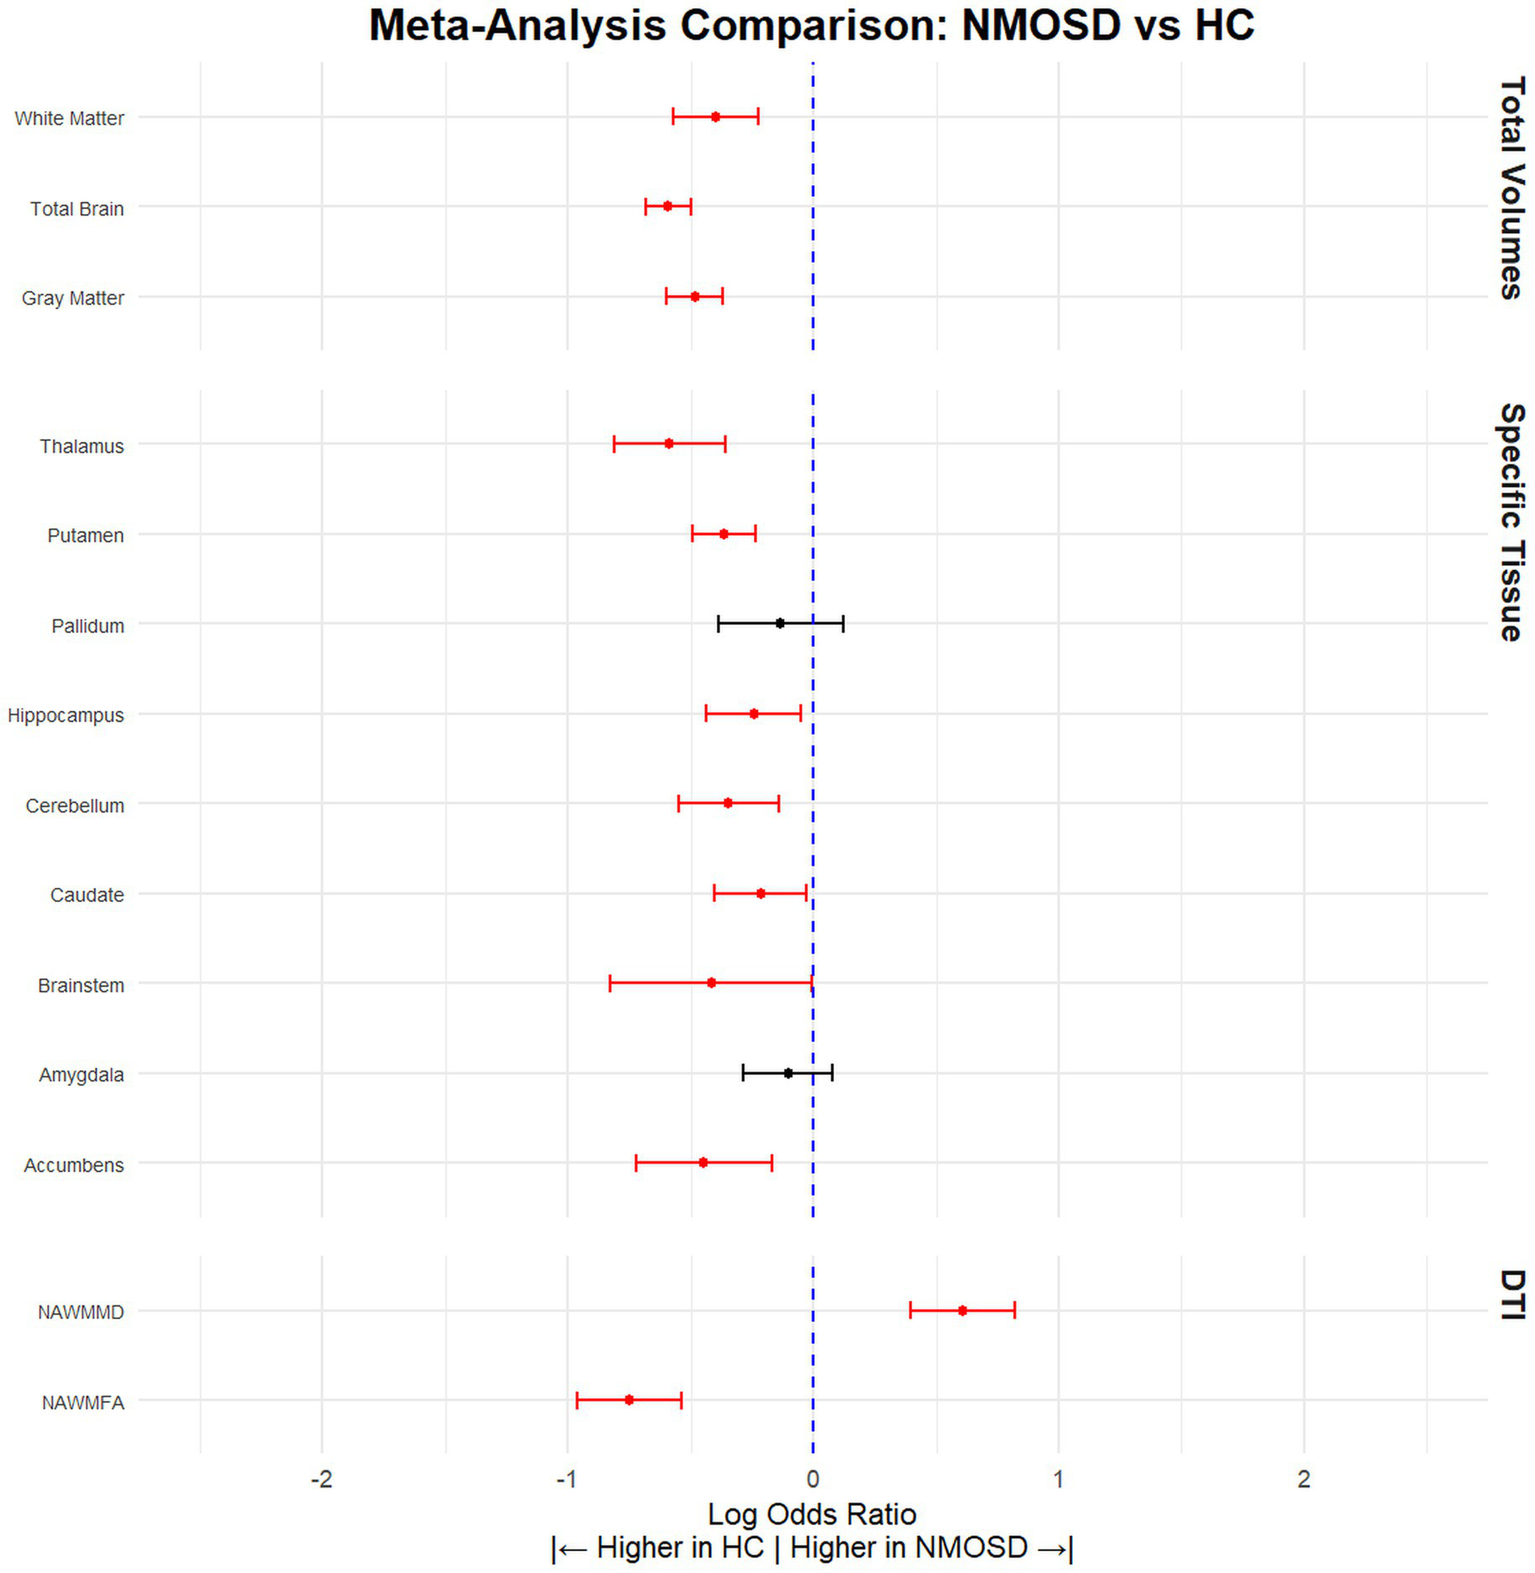
NMOSD patients have significantly lower brain volume compared to HCs. Meta-analysis of volumetric parameters between HCs and NMOSD patients. (Red is significant | Black is not significant) total brain volume (SMD = −0.59, 95% CI [(−0.68) – (−0.50)], p < 0.0001, I2 = 34.31), white matter (SMD = −0.40, 95% CI [(−0.57) – (−0.22)], p < 0.0001, I2 = 75.78), gray matter (SMD = −0.48, 95% CI [(−0.60) – (−0.37)], p < 0.0001, I2 = 50.45), thalamus (SMD = −0.59, 95% CI [(−0.81) – (−0.36)], p < 0.0001, I2 = 77.73), putamen (SMD = −0.36, 95% CI [(−0.49) – (−0.24)], p < 0.0001, I2 = 0.00), pallidum (SMD = −0.13, 95% CI [(−0.39) – 0.12], p = 0.30, I2 = 71.40), hippocampus (SMD = −0.24, 95% CI [(−0.44) – (−0.05)], p = 0.01, I2 = 66.71), cerebellum (SMD = −0.35, 95% CI [(−0.55) – (−0.14)], p = 0.0001, I2 = 27.27), caudate (SMD = −0.22, 95% CI [(−0.40) – (−0.03)], p = 0.02, I2 = 54.06), brainstem (SMD = −0.42, 95% CI [(−0.83) – (−0.01)], p = 0.05, I2 = 70.14), amygdala (SMD = −0.10, 95% CI [(−0.29) – 0.08], p = 0.27, I2 = 28.01), accumbens (SMD = −0.45, 95% CI [(−0.72) – (−0.17)], p = 0.002, I2 = 62.57), normal appearing FA (SMD = −0.59, 95% CI [(−0.96) – (−0.54)], p < 0.0001, I2 = 34.31), and normal appearing MD (SMD = 0.59, 95% CI [0.40–0.82], p < 0.0001, I2 = 34.31).
Table 2
| Tissue | Articles (n) | HC (n) | NMOSD (n) | SDM | CILow95 | CIHigh95 | pValue | I 2 | Leave 1 out (Significane) | Egger pValue |
|---|---|---|---|---|---|---|---|---|---|---|
| Gray Matter | 35 | 1,475 | 1,375 | −0.48 | −0.60 | −0.37 | p < 0.0001 | 50.45 | Stable | 0.06 |
| Total Brain | 37 | 1,699 | 1,695 | −0.59 | −0.68 | −0.50 | p < 0.0001 | 34.31 | Stable | 0.69 |
| White Matter | 29 | 1,273 | 1,223 | −0.40 | −0.57 | −0.22 | p < 0.0001 | 75.78 | Stable | 0.003 |
| Accumbens | 8 | 366 | 253 | −0.45 | −0.72 | −0.17 | 0.002 | 62.57 | Stable | 0.008 |
| Amygdala | 10 | 415 | 293 | −0.10 | −0.29 | 0.08 | 0.27 | 28.01 | Stable | 0.37 |
| Brainstem | 6 | 156 | 193 | −0.42 | −0.83 | −0.01 | 0.05 | 70.14 | Changed (Not significant) | 0.76 |
| Caudate | 15 | 602 | 500 | −0.22 | −0.40 | −0.03 | 0.02 | 54.06 | Changed (Not significant) | 0.12 |
| Cerebellum | 9 | 253 | 299 | −0.35 | −0.55 | −0.14 | p < 0.0001 | 27.27 | Stable | 0.13 |
| Hippocampus | 16 | 813 | 787 | −0.24 | −0.44 | −0.05 | 0.01 | 66.71 | Stable | 0.35 |
| Pallidum | 12 | 526 | 432 | −0.13 | −0.39 | 0.12 | 0.30 | 71.40 | Changed (Significant) | 0.71 |
| Putamen | 14 | 566 | 464 | −0.36 | −0.49 | −0.24 | p < 0.0001 | 0.00 | Stable | 0.65 |
| Thalamus | 22 | 797 | 717 | −0.59 | −0.81 | −0.36 | p < 0.0001 | 77.73 | Stable | 0.28 |
| NAWMFA | 9 | 291 | 267 | −0.75 | −0.96 | −0.54 | p < 0.0001 | 26.73 | Stable | 0.63 |
| NAWMMD | 8 | 242 | 226 | 0.61 | 0.40 | 0.82 | p < 0.0001 | 14.54 | Stable | 0.57 |
Volumetric differences between NMOSD and HCs.
HC, Healthy Control; NMOSD, Neuromyelitis optica spectrum disorder; CI, confidence interval; SDM, standardized mean difference; NAWMFA, fractional anisotropy normally appearing white matter; NAWMMD, mean diffusivity normally appearing white matter.
3.3 Sub-analyses of brain volume reductions in NMOSD versus HCs
3.3.1 Sensitivity analysis excluding overlapping datasets
To assess the potential impact of overlapping datasets from the same research institutions, we conducted a sensitivity analysis excluding studies with a high likelihood of participant duplication. The revised meta-analysis, which included only non-overlapping cohorts, confirmed the primary findings: NMOSD patients continued to show significantly lower brain volumes compared to HCs across nearly all tissue types. Specifically, total brain volume (SMD = −0.62, 95% CI [−0.72 to −0.52], p < 0.0001, I2 = 20.6), gray matter (SMD = −0.44, 95% CI [−0.59 to −0.29], p < 0.0001, I2 = 56.1), and white matter (SMD = −0.40, 95% CI [−0.57 to −0.22], p < 0.0001, I2 = 75.8) remained significantly reduced (Supplementary Table 1).
3.3.2 Assessment of publication bias
To further examine the robustness of our findings, we compared studies that reported significant brain volume reductions in NMOSD versus HCs with those that did not. No differences were observed between the groups in MRI field strength, software used for brain volume quantification, proportion of AQP4-IgG–positive patients, or MRI sequence used for volumetric analysis. We then assessed a subset of studies that initially reported no significant differences in brain volume between NMOSD patients and HCs. Even within this subset, NMOSD patients demonstrated significantly reduced brain volumes, including total brain volume (SMD = −0.52, 95% CI [(−0.66) – (−0.37)], p < 0.0001, I2 = 39.57), gray matter (SMD = −0.42, 95% CI [(−0.63) – (−0.22)], p < 0.0001, I2 = 56.27), and white matter (SMD = −0.26, 95% CI [(−0.44) – (−0.10)], p = 0.002, I2 = 35.90).
3.3.3 Sub-analysis of AQP4-IgG–positive NMOSD cohorts
We next conducted a sub-analysis restricted to studies in which the NMOSD cohort consisted exclusively of AQP4-IgG–positive patients. In this subset, NMOSD-AQP4 + patients continued to exhibit significantly reduced total brain volume (SMD = −0.59, 95% CI [(−0.74) – (−0.43)], p < 0.0001, I2 = 36.82), gray matter volume (SMD = −0.71, 95% CI [(−0.84) – (−0.58)], p < 0.0001, I2 = 14.01), and white matter volume (SMD = −0.14, 95% CI [(−0.26) – (−0.02)], p = 0.02, I2 = 0) compared to HCs. Notably, however, hippocampal volume did not differ between NMOSD-AQP4 + patients and HCs in this analysis (SMD = −0.22, 95% CI [(−0.58) – 0.10], p = 0.18, I2 = 65.70).
3.3.4 Sub-analysis of age- and sex-matched cohorts
Brain volume is strongly influenced by both age and sex. To address these potential confounding factors, we conducted a sub-analysis restricted to studies in which the NMOSD and HC groups were age- and sex-matched. The results were consistent with the primary meta-analysis: NMOSD patients continued to show reduced (SMD = −0.54, 95% CI [(−0.65) – (−0.44)], p < 0.0001, I2 = 25.03), gray matter volume (SMD = −0.48, 95% CI [(−0.59) – (−0.37)], p < 0.0001, I2 = 20.44), and white matter volume (SMD = −0.42, 95% CI [(−0.63) – (−0.21)], p = 0.0001, I2 = 73.82) volumes compared to HCs.
3.4 NMOSD patients have altered white matter integrity
DTI analysis revealed altered white matter integrity in NMOSD patients. Specifically, the NAWMFA was significantly lower compared to HCs (SMD = −0.59, 95% CI [(−0.96) – (−0.54)], p < 0.0001, I2 = 34.31). Conversely, the NAWMMD was higher compared to HCs (SMD = 0.59, 95% CI [0.40–0.82], p < 0.0001, I2 = 34.31).
3.5 NMOSD patients have lower brain volume compared to MOGAD patients
When comparing NMOSD patients with MOGAD patients, the results indicated that NMOSD patients had significantly lower brain volume (SMD = −0.28, 95% CI [(−0.11) – (−0.46)], p = 0.001, I2 = 14.68) and gray matter volume (SMD = −0.33, 95% CI [(−0.11) – (−0.55)], p = 0.004, I2 = 43.32), but no significant difference was observed in white matter volume (SMD = 0.05, 95% CI [(−0.20) – 0.30], p = 0.71, I2 = 50.21) (Figure 3; Table 3). Conversely, MOGAD patients exhibited lower brain volume (SMD = −0.43, 95% CI [(−0.56) – (−0.29)], p < 0.0001, I2 = 0.00) and white matter volume (SMD = −0.48, 95% CI [(−0.70) – (−0.25)], p < 0.0001, I2 = 52.39) compared to HCs (Figure 4; Table 4).
Figure 3

NMOSD patients have significantly lower brain volume compared to MOGAD patients. Meta-analysis of volumetric parameters between NMOSD and MOGAD patients. (Red is significant | Black is not significant) total brain (SMD = −0.28, 95% CI [(−0.11) – (−0.46)], p = 0.001, I2 = 14.68), gray matter (SMD = −0.33, 95% CI [(−0.11) – (−0.55)], p = 0.004, I2 = 43.32), and white matter (SMD = 0.05, 95% CI [(−0.20) – 0.30], p = 0.71, I2 = 50.21).
Table 3
| Tissue | Articles (n) | NMOSD (n) | MOGAD (n) | SDM | CILow95 | CIHigh95 | pValue | I 2 | Leave 1 out (Significance) | Egger pValue |
|---|---|---|---|---|---|---|---|---|---|---|
| Total Brain | 7 | 456 | 307 | −0.28 | −0.11 | −0.46 | 0.001 | 14.68 | Stable | 0.18 |
| Gray Matter | 6 | 443 | 296 | −0.33 | −0.11 | −0.55 | 0.004 | 43.32 | Stable | 0.10 |
| White Matter | 6 | 396 | 272 | 0.05 | −0.20 | 0.30 | 0.71 | 50.21 | Stable | 0.91 |
Volumetric differences between MOGAD and NMOSD patients.
NMOSD, Neuromyelitis optica spectrum disorder; MOGAD, myelin oligodendrocyte glycoprotein antibody-associated disease; CI, confidence interval; SDM, standardized mean difference.
Figure 4
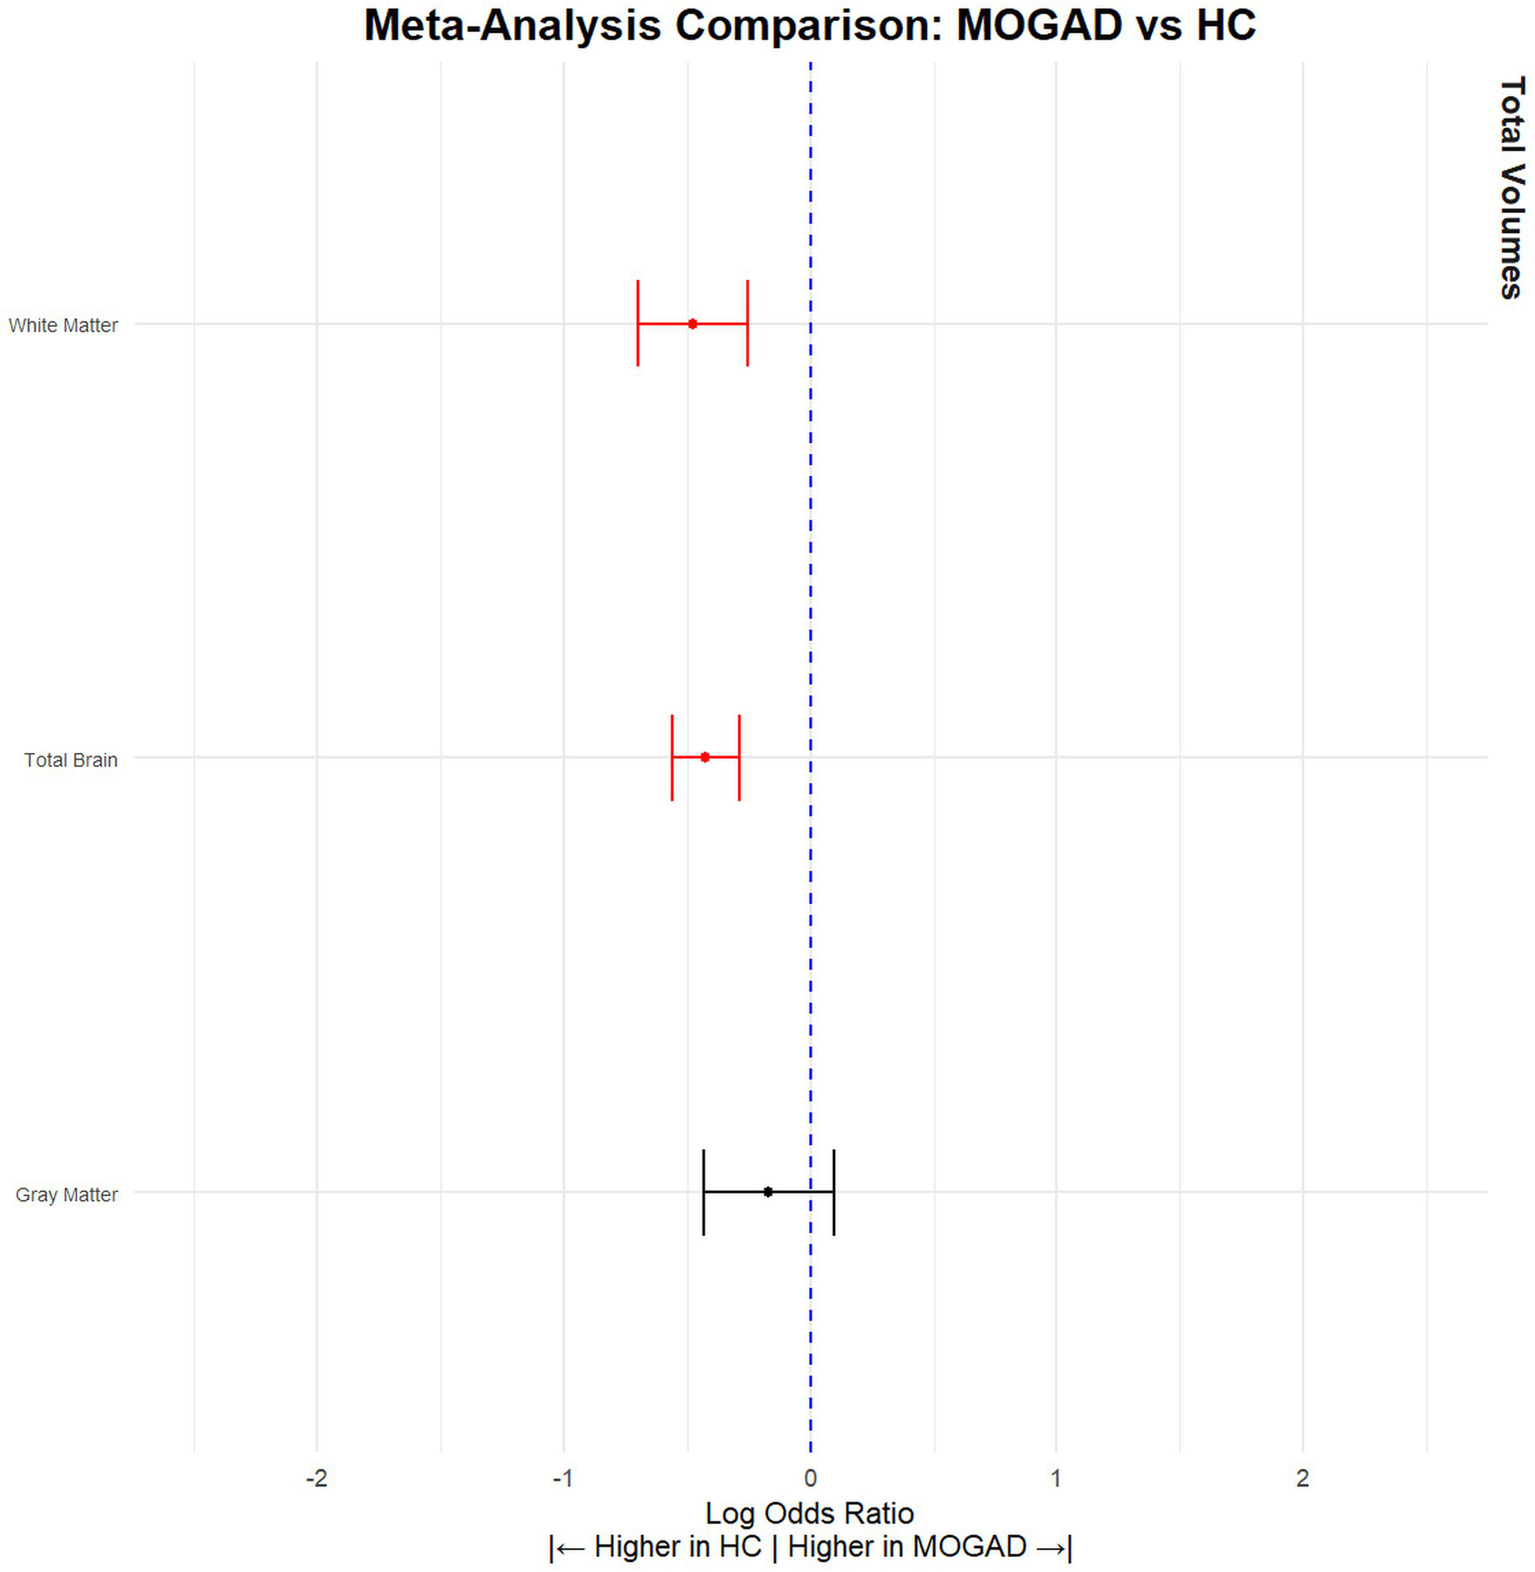
MOGAD patients have significantly lower brain volume compared to HCs. Meta-analysis of volumetric parameters between HCs and MOGAD patients. (Red is significant | Black is not significant) total brain volume (SMD = −0.43, 95% CI [(−0.56) – (−0.29)], p < 0.0001, I2 = 0.00), gray matter volume (SMD = −0.17, 95% CI [(−0.43) – (0.09)], p = 0.21, I2 = 69.36), and white matter volume (SMD = −0.48, 95% CI [(−0.70) – (−0.25)], p < 0.0001, I2 = 52.39).
Table 4
| Tissue | Articles (n) | HC (n) | MOGAD (n) | SDM | CILow95 | CIHigh95 | pValue | I 2 | Leave 1 out (Significance) | Egger pValue |
|---|---|---|---|---|---|---|---|---|---|---|
| Total Brain | 10 | 362 | 647 | −0.43 | −0.56 | −0.29 | p < 0.0001 | 0 | Stable | 0.29 |
| Gray Matter | 9 | 351 | 619 | −0.17 | −0.43 | −0.09 | p = 0.21 | 69.36 | Stable | 0.35 |
| White Matter | 8 | 582 | 327 | −0.48 | −0.70 | −0.25 | p < 0.0001 | 52.39 | Stable | 0.001 |
Volumetric differences between MOGAD patients and HCs.
HC, Healthy Control; MOGAD, myelin oligodendrocyte glycoprotein antibody-associated disease; CI, confidence interval; SDM, standardized mean difference.
4 Discussion
Our comprehensive meta-analysis, encompassing 61 studies involving substantial numbers of NMOSD, MOGAD patients, and HCs, provided robust quantitative data on brain volumes and white matter integrity across these groups. The results unequivocally demonstrated that NMOSD patients have significantly reduced brain volumes when compared to HCs and MOGAD patients. This reduction spans across total brain volume, gray matter, and specific brain structures including the accumbens, brainstem, caudate, cerebellum, hippocampus, putamen, and thalamus. The consistency of these findings, even in subset analyses that only included studies showing no initial difference between NMOSD patients and HCs, emphasize the pervasive impact of NMOSD on brain structure.
Longer disease duration and frequent relapses can contribute to cumulative neurodegeneration in NMOSD patients, while immunosuppressive therapies may help preserve brain volume by reducing inflammatory activity (25–27). These clinical factors should be considered when interpreting volumetric differences in demyelinating disorders and warrant further investigation. The significant reduction in brain volumes across multiple regions suggests a more extensive neurodegenerative component in NMOSD than previously recognized. This extensive brain volume reduction could potentially contribute to cognitive and neurological deficits observed in NMOSD patients (28). These findings highlights the importance of incorporating brain volume assessments into routine clinical management.
The integration of advanced MRI techniques, such as Neurite Orientation Dispersion and Density Imaging, Diffusion Kurtosis Imaging, Quantitative Susceptibility Mapping, and quantitative myelin imaging, has the potential to significantly enhance our understanding of demyelinating diseases (29–32). These methods enable in vivo assessment of microstructural properties, including neurite density, tissue complexity, myelin content, and iron deposition, offering insights beyond the resolution of conventional MRI. As these techniques continue to mature and become more standardized across centers, they are expected to contribute to the development of robust imaging biomarkers that can inform prognosis, stratify patient subgroups, and evaluate therapeutic response with greater precision.
In our meta-analysis, we found that MOGAD patients exhibited significantly lower total brain volumes compared to HCs, despite some individual studies reporting no significant differences. Additionally, when compared to NMOSD patients, individuals with MOGAD demonstrated relatively higher brain volumes. This finding is consistent with the generally milder clinical course observed in MOGAD compared to NMOSD and may reflect differences in underlying disease mechanisms and neurodegenerative burden.
While the meta-analysis revealed consistent patterns of brain volume reduction and altered white matter integrity in NMOSD, we acknowledge that several of the included analyses exhibited moderate to high heterogeneity, with I2 values exceeding 50% in some cases (e.g., thalamus, pallidum, white matter). This level of heterogeneity is not uncommon in neuroimaging meta-analyses and likely reflects variability in imaging protocols, scanner types, patient demographics, disease stages, and analysis pipelines across studies (33). Despite this variability, the direction and magnitude of effects remained largely consistent. Importantly, certain tissue categories, such as total brain volume (I2 = 34.31%), and DTI metrics like NAWMFA and NAWMMD (I2 < 30%)—showed low to moderate heterogeneity, lending greater reliability to these results. These lower-heterogeneity outcomes reinforce the conclusion that brain atrophy and white matter microstructural damage are key features of NMOSD pathology. Nonetheless, the observed heterogeneity in other tissues highlights the need for more standardized imaging methodologies in future studies to further refine these volumetric biomarkers.
MOGAD is a relatively recently recognized clinical entity, and as such, most existing studies are based on small patient cohorts, limiting the generalizability of their findings. In this context, meta-analytical approaches are particularly valuable, as they enable the integration of data across multiple studies, thereby increasing statistical power and improving the reliability of conclusions drawn from larger, aggregated samples. However, the overall scarcity of research, compounded by the typically low number of patients included in individual studies, has contributed to less pronounced findings in MOGAD compared to NMOSD, hindering the robust evaluation of volume differences across various brain tissues. Indeed, several studies have reported no significant differences in brain volume between patients with MOGAD and HCs, although this might largely reflect the small size of cohorts conducted to date. Conversely, NMOSD has been established for a longer period and benefits from a more extensive literature base, which is why the current study primarily focused on NMOSD.
We also compared brain volume in a subcohort of only AQP4 + patients. We observed reduced total, gray, and white matter volumes, with significant atrophy in the thalamus and putamen. In contrast to the full NMOSD cohort, the hippocampus did not show significant differences, which may reflect underlying pathophysiological differences between AQP4-positive and AQP4-negative patients, or may be due to the smaller number of studies included in this comparison.
Leave-one-out analyses demonstrated that the direction of effect sizes was stable across most tissues. In the majority of regions, statistical significance also remained consistent. Only three regions (brainstem, caudate, and pallidum in the NMOSD vs. HC comparison) exhibited changes in significance depending on the excluded study, suggesting some sensitivity to individual datasets. Egger’s test indicated potential publication bias in a subset of regions, particularly in white matter and accumbens, while most regions showed non-significant results, indicating limited evidence of small-study effects overall. The significant Egger’s test for white matter highlights the need for cautious interpretation of findings in this region, especially in studies with smaller sample sizes.
To address the potential concern of dataset redundancy, particularly due to multiple studies originating from the same research institutions, we conducted a sensitivity analysis excluding studies with a high likelihood of overlapping patient cohorts. Despite the reduction in the number of included studies, the main findings remained consistent in both direction and statistical significance, particularly for major volumetric measures such as total brain volume, gray matter, white matter, and several deep gray matter structures. These consistent results reinforce the robustness of our conclusions and strengthen the evidence for a widespread neurodegenerative process in NMOSD. Although it remains challenging to definitively verify patient overlap, especially given the complexity of multi-center collaborations, this additional analysis mitigates the risk of bias from duplicated samples and provides further confidence in the reliability of the primary findings.
Variability in brain volume estimates across software packages such as FreeSurfer, FSL, and SPM is well-documented and complicates cross-study comparisons due to differences in segmentation algorithms and anatomical templates (34). Additional variability arises from differences in MRI scanner type, field strength, and acquisition protocols (35). Meta-analyses that include studies using diverse tools are valuable, as they can uncover consistent disease-related patterns and improve generalizability in NMOSD research. For longitudinal studies within the same patient, however, maintaining consistency in scanner, sequence, and software is critical to reduce technical bias.
Although most studies included in our meta-analysis applied lesion-filling procedures to minimize segmentation errors, the potential influence of ex vacuo atrophy remains a relevant consideration. This phenomenon is well documented in MS, where larger T2 lesion volumes have been shown to correlate with increased brain atrophy, likely reflecting tissue collapse or fluid shift following focal white matter damage (36). In NMOSD and MOGAD this effect is expected to be less pronounced due to the generally lower lesion burden observed in most patients (36). However, even in these disorders, the potential for lesion-driven structural changes should be acknowledged in future volumetric studies to ensure accurate attribution of observed atrophy patterns.
The strength of our study lies in its large sample size and the rigorous methodological approach, including a comprehensive search strategy and stringent inclusion criteria, which enhance the generalizability of our findings. However, our analysis is not without limitations. The heterogeneity in imaging protocols and analysis methods across studies might have introduced variability in the measurements. Additionally, while the inclusion of both whole-brain and region-of-interest studies may increase methodological variability, we chose to include both to avoid potential selection bias and to provide a more comprehensive overview of the literature. Furthermore, the retrospective nature of most included studies limits the ability to infer causation.
In conclusion, our meta-analysis confirms significant neurodegeneration in NMOSD patients compared to HCs and MOGAD patients, with substantial reductions in brain volume and alterations in white matter integrity. These findings suggest that NMOSD may have a more pronounced neurodegenerative impact than previously understood.
Statements
Data availability statement
The raw data supporting the conclusions of this article will be made available by the authors, without undue reservation.
Author contributions
AR: Conceptualization, Data curation, Formal analysis, Investigation, Methodology, Visualization, Writing – original draft, Writing – review & editing. OZ: Data curation, Investigation, Methodology, Writing – original draft, Writing – review & editing. AV-D: Conceptualization, Methodology, Project administration, Supervision, Writing – original draft, Writing – review & editing.
Funding
The author(s) declare that no financial support was received for the research and/or publication of this article.
Conflict of interest
The authors declare that the research was conducted in the absence of any commercial or financial relationships that could be construed as a potential conflict of interest.
Generative AI statement
The authors declare that no Gen AI was used in the creation of this manuscript.
Any alternative text (alt text) provided alongside figures in this article has been generated by Frontiers with the support of artificial intelligence and reasonable efforts have been made to ensure accuracy, including review by the authors wherever possible. If you identify any issues, please contact us.
Publisher’s note
All claims expressed in this article are solely those of the authors and do not necessarily represent those of their affiliated organizations, or those of the publisher, the editors and the reviewers. Any product that may be evaluated in this article, or claim that may be made by its manufacturer, is not guaranteed or endorsed by the publisher.
Supplementary material
The Supplementary material for this article can be found online at: https://www.frontiersin.org/articles/10.3389/fneur.2025.1703283/full#supplementary-material
References
1.
Cacciaguerra L Flanagan EP . Updates in NMOSD and MOGAD diagnosis and treatment. Neurol Clin. (2024) 42:77–114. doi: 10.1016/j.ncl.2023.06.009
2.
Zveik O Rechtman A Haham N Adini I Canello T Lavon I et al . Sera of neuromyelitis optica patients increase BID-mediated apoptosis in astrocytes. Int J Mol Sci. (2022) 23:7117. doi: 10.3390/ijms23137117
3.
Höftberger R Sepulveda M Armangue T Blanco Y Rostásy K Calvo AC et al . Antibodies to MOG and AQP4 in adults with neuromyelitis optica and suspected limited forms of the disease. Mult Scler. (2016) 21:866–74. doi: 10.1177/1352458514555785
4.
Misu T Fujihara K Kakita A Konno H Nakamura M Watanabe S et al . Loss of aquaporin 4 in lesions of neuromyelitis optica: distinction from multiple sclerosis. Brain. (2007) 130:1224–34. doi: 10.1093/brain/awm047
5.
Parratt JD Prineas JW . Neuromyelitis optica: a demyelinating disease characterized by acute destruction and regeneration of perivascular astrocytes. Mult Scler J. (2010) 16:1156–72. doi: 10.1177/1352458510382324
6.
Wu Y Geraldes R Juryńczyk M Palace J . Double-negative neuromyelitis optica spectrum disorder. Mult Scler J. (2023) 29:1353–62. doi: 10.1177/13524585231199819
7.
Al-Ani A Chen JJ Costello F . Myelin oligodendrocyte glycoprotein antibody-associated disease (MOGAD): current understanding and challenges. J Neurol. (2023) 270:4132–50. doi: 10.1007/s00415-023-11737-8
8.
Marchionatti A Woodhall M Waters PJ Sato DK . Detection of MOG-IgG by cell-based assay: moving from discovery to clinical practice. Neurol Sci. (2021) 42:73–80. doi: 10.1007/s10072-020-04828-1
9.
Bartels F Lu A Oertel FC Finke C Paul F Chien C . Clinical and neuroimaging findings in MOGAD-MRI and OCT. Clin Exp Immunol. (2021) 206:266–81. doi: 10.1111/cei.13641
10.
Carnero Contentti E Okuda DT Rojas JI Chien C Paul F Alonso R . MRI to differentiate multiple sclerosis, neuromyelitis optica, and myelin oligodendrocyte glycoprotein antibody disease. J Neuroimaging. (2023) 33:688–702. doi: 10.1111/jon.13137
11.
Cortese R Testa G Assogna F De Stefano N . Magnetic resonance imaging evidence supporting the efficacy of Cladribine tablets in the treatment of relapsing-remitting multiple sclerosis. CNS Drugs. (2024) 38:267–79. doi: 10.1007/s40263-024-01074-3
12.
De Stefano N Airas L Grigoriadis N Mattle HP O’Riordan J Oreja-Guevara C et al . Clinical relevance of brain volume measures in multiple sclerosis. CNS Drugs. (2014) 28:147–56. doi: 10.1007/s40263-014-0140-z
13.
Alosaimi M Alkanhal H Aldeligan S Alkhawajah N Albishi A Hilabi B et al . Thalamic volume differentiates multiple sclerosis from neuromyelitis optica spectrum disorder: MRI-based retrospective study. Front Neurol. (2024) 15:1491193. doi: 10.3389/fneur.2024.1491193
14.
Mammi S Filippi M Martinelli V Campi A Colombo B Scotti G et al . Correlation between brain MRI lesion volume and disability in patients with multiple sclerosis. Acta Neurol Scand. (1996) 94:93–6. doi: 10.1111/j.1600-0404.1996.tb07036.x
15.
Redenbaugh V Chia NH Cacciaguerra L McCombe JA Tillema J-M Chen JJ et al . Comparison of MRI T2-lesion evolution in pediatric MOGAD, NMOSD, and MS. Mult Scler J. (2023) 29:799–808. doi: 10.1177/13524585231166834
16.
Kim HJ Paul F Lana-Peixoto MA Tenembaum S Asgari N Palace J et al . MRI characteristics of neuromyelitis optica spectrum disorder: an international update. Neurology. (2015) 84:1165–73. doi: 10.1212/WNL.0000000000001367
17.
Clarke L Arnett S Lilley K Liao J Bhuta S Broadley SA . Magnetic resonance imaging in neuromyelitis optica spectrum disorder. Clin Exp Immunol. (2021) 206:251–65. doi: 10.1111/cei.13630
18.
Xu Y Ren Y Li X Xu W Wang X Duan Y et al . Persistently gadolinium-enhancing lesion is a predictor of poor prognosis in NMOSD attack: a clinical trial. Neurotherapeutics. (2021) 18:868–77. doi: 10.1007/s13311-020-00973-9
19.
Wingerchuk DM Banwell B Bennett JL Cabre P Carroll W Chitnis T et al . International consensus diagnostic criteria for neuromyelitis optica spectrum disorders. Neurology. (2015) 85:177–89. doi: 10.1212/wnl.0000000000001729
20.
Chandrasekar SK Arthanari J Chandrasekar KK Gaviria E Shashank S Jethi A et al . Advanced imaging techniques (PET, fMRI, DTI) in early detection of neurodegenerative diseases: a systematic review. Health Sci Rep. (2025) 8:e70855. doi: 10.1002/hsr2.70855
21.
Boaventura M Fragoso DC Avolio I Pereira SA Callegaro D Sato DK et al . Brain tissue integrity in neuromyelitis optica spectrum disorder through T1-w/T2-w ratio, MTR and DTI. J Neurol. (2025) 272:157. doi: 10.1007/s00415-024-12869-1
22.
Nakaya M Sato N Suzuki F Maikusa N Matsuda H Kimura Y et al . Multimodal imaging analyses in neuromyelitis optica spectrum disorder with or without visual disturbance. J Neurol Sci. (2024) 462:123090. doi: 10.1016/j.jns.2024.123090
23.
Kim M Hwang I Park JH Chung JW Kim SM Kim J et al . Comparative analysis of glymphatic system alterations in multiple sclerosis and neuromyelitis optica spectrum disorder using MRI indices from diffusion tensor imaging. Hum Brain Mapp. (2024) 45:e26680. doi: 10.1002/hbm.26680
24.
Tang J-L Liu JL . Misleading funnel plot for detection of bias in meta-analysis. J Clin Epidemiol. (2000) 53:477–84. doi: 10.1016/S0895-4356(99)00204-8
25.
Haramati A Rechtman A Zveik O Haham N Brill L Vaknin-Dembinsky A . IL-6 as a marker for NMOSD disease activity. J Neuroimmunol. (2022) 370:577925. doi: 10.1016/j.jneuroim.2022.577925
26.
Masuda H Mori M Hirano S Uzawa A Uchida T Muto M et al . Silent progression of brain atrophy in aquaporin-4 antibody-positive neuromyelitis optica spectrum disorder. J Neurol Neurosurg Psychiatry. (2022) 93:32–40. doi: 10.1136/jnnp-2021-326386
27.
Sánchez-Catasús CA Cabrera-Gomez J Almaguer Melián W Giroud Benítez JL Rodríguez Rojas R Bayard JB et al . Brain tissue volumes and perfusion change with the number of optic neuritis attacks in relapsing Neuromyelitis Optica: a voxel-based correlation study. PLoS One. (2013) 8:e66271. doi: 10.1371/journal.pone.0066271
28.
Barzegar M Ashtari F Kafieh R Karimi Z Dehghani A Ghalamkari A et al . Association of peripapillary retinal nerve fiber layer atrophy with cognitive impairment in patients with neuromyelitis optica spectrum disorder. Neurol Sci. (2025) 46:861–70. doi: 10.1007/s10072-024-07897-8
29.
Zhang H Schneider T Wheeler-Kingshott CA Alexander DC . NODDI: practical in vivo neurite orientation dispersion and density imaging of the human brain. NeuroImage. (2012) 61:1000–16. doi: 10.1016/j.neuroimage.2012.03.072
30.
Steven AJ Zhuo J Melhem ER . Diffusion kurtosis imaging: an emerging technique for evaluating the microstructural environment of the brain. AJR Am J Roentgenol. (2014) 202:W26–33. doi: 10.2214/AJR.13.11365
31.
Uchida Y Kan H Sakurai K Arai N Kato D Kawashima S et al . Voxel-based quantitative susceptibility mapping in Parkinson’s disease with mild cognitive impairment. Mov Disord. (2019) 34:1164–73. doi: 10.1002/mds.27717
32.
van der Weijden CWJ Biondetti E Gutmann IW Dijkstra H McKerchar R Paula Faria D et al . Quantitative myelin imaging with MRI and PET: an overview of techniques and their validation status. Brain. (2023) 146:1243–66. doi: 10.1093/brain/awac436
33.
Neu S Crawford K Toga AW . Practical management of heterogeneous neuroimaging metadata by global neuroimaging data repositories. Front Neuroinform. (2012) 6:8. doi: 10.3389/fninf.2012.00008
34.
Chaves H Dorr F Costa ME Serra MM Slezak DF Farez MF et al . Brain volumes quantification from MRI in healthy controls: assessing correlation, agreement and robustness of a convolutional neural network-based software against FreeSurfer, CAT12 and FSL. J Neuroradiol. (2021) 48:147–56. doi: 10.1016/j.neurad.2020.10.001
35.
Bürkle E Nazzal A Debolski A Ernemann U Lindig T Bender B . Scan-rescan reliability assessment of brain volumetric analysis across scanners and software solutions. Sci Rep. (2025) 15:29843. doi: 10.1038/s41598-025-15283-3
36.
Cortese R Battaglini M Prados F Gentile G Luchetti L Bianchi A et al . Grey matter atrophy and its relationship with white matter lesions in patients with myelin oligodendrocyte glycoprotein antibody-associated disease, aquaporin-4 antibody-positive neuromyelitis optica spectrum disorder, and multiple sclerosis. Ann Neurol. (2024) 96:276–88. doi: 10.1002/ana.26951
37.
Rocca MA Agosta F Mezzapesa DM Martinelli V Salvi F Ghezzi A et al . Magnetization transfer and diffusion tensor MRI show gray matter damage in neuromyelitis optica. Neurology. (2004) 62:476–8. doi: 10.1212/01.WNL.0000106946.08741.41
38.
Pichiecchio A Tavazzi E Poloni G Ponzio M Palesi F Pasin M et al . Advanced magnetic resonance imaging of neuromyelitis optica: a multiparametric approach. Mult Scler J. (2012) 18:817–24. doi: 10.1177/1352458511431072
39.
Liu Y Duan Y He Y Yu C Wang J Huang J et al . A tract-based diffusion study of cerebral white matter in neuromyelitis optica reveals widespread pathological alterations. Mult Scler J. (2012) 18:1013–21. doi: 10.1177/1352458511431731
40.
Blanc F Noblet V Jung B Rousseau F Renard F Bourre B et al . White matter atrophy and cognitive dysfunctions in neuromyelitis optica. PLoS One. (2012) 7:e33878. doi: 10.1371/journal.pone.0033878
41.
Chanson JB Lamy J Rousseau F Blanc F Collongues N Fleury M et al . White matter volume is decreased in the brain of patients with neuromyelitis optica. Eur J Neurol. (2013) 20:361–7. doi: 10.1111/j.1468-1331.2012.03867.x
42.
Calabrese M Oh MS Favaretto A Rinaldi F Poretto V Alessio S et al . No MRI evidence of cortical lesions in neuromyelitis optica. Neurology. (2012) 79:1671–6. doi: 10.1212/WNL.0b013e31826e9a96
43.
Von Glehn F Jarius S Cavalcanti Lira RP Alves Ferreira MC Von Glehn FHR Costa E Castro SM et al . Structural brain abnormalities are related to retinal nerve fiber layer thinning and disease duration in neuromyelitis optica spectrum disorders. Mult Scler J. (2014) 20:1189–97. doi: 10.1177/1352458513519838
44.
Weier K Eshaghi A Magon S Andelova M Radue E-W Kappos L et al . The role of cerebellar abnormalities in neuromyelitis optica – a comparison with multiple sclerosis and healthy controls. Mult Scler J. (2015) 21:757–66. doi: 10.1177/1352458514554051
45.
Liu Y Wang J Daams M Weiler F Hahn HK Duan Y et al . Differential patterns of spinal cord and brain atrophy in NMO and MS. Neurology. (2015) 84:1465–72. doi: 10.1212/WNL.0000000000001441
46.
Zhang L-J Zhao N Fu Y Zhang D-Q Wang J Qin W et al . Olfactory dysfunction in neuromyelitis optica spectrum disorders. J Neurol. (2015) 262:1890–8. doi: 10.1007/s00415-015-7787-3
47.
Liu Y Duan Y Huang J Ren Z Ye J Dong H et al . Multimodal quantitative MR imaging of the thalamus in multiple sclerosis and Neuromyelitis Optica. Radiology. (2015) 277:784–92. doi: 10.1148/radiol.2015142786
48.
Liu Y Fu Y Schoonheim MM Zhang N Fan M Su L et al . Structural MRI substrates of cognitive impairment in neuromyelitis optica. Neurology. (2015) 85:1491–9. doi: 10.1212/WNL.0000000000002067
49.
Pache F Zimmermann H Finke C Lacheta A Papazoglou S Kuchling J et al . Brain parenchymal damage in neuromyelitis optica spectrum disorder – a multimodal MRI study. Eur Radiol. (2016) 26:4413–22. doi: 10.1007/s00330-016-4282-x
50.
Schneider R Bellenberg B Kleiter I Gold R Köster O Weiler F et al . Cervical cord and ventricle affection in neuromyelitis optica. Acta Neurol Scand. (2017) 135:324–31. doi: 10.1111/ane.12601
51.
Finke C Heine J Pache F Lacheta A Borisow N Kuchling J et al . Normal volumes and microstructural integrity of deep gray matter structures in AQP4+ NMOSD. Neurol Neuroimmunol Neuroinflamm. (2016) 3:e229. doi: 10.1212/NXI.0000000000000229
52.
Streitberger K-J Fehlner A Pache F Lacheta A Papazoglou S Bellmann-Strobl J et al . Multifrequency magnetic resonance elastography of the brain reveals tissue degeneration in neuromyelitis optica spectrum disorder. Eur Radiol. (2017) 27:2206–15. doi: 10.1007/s00330-016-4561-6
53.
Qian W Chan KH Hui ES Lee CY Hu Y Mak HK . Application of diffusional kurtosis imaging to detect occult brain damage in multiple sclerosis and neuromyelitis optica. NMR Biomed. (2016) 29:1536–45. doi: 10.1002/nbm.3607
54.
Hyun JW Park G Kwak K Jo HJ Joung A Kim JH et al . Deep gray matter atrophy in neuromyelitis optica spectrum disorder and multiple sclerosis. Eur J Neurol. (2017) 24:437–45. doi: 10.1111/ene.13224
55.
Su L Han Y Xue R Wood K Shi F-D Liu Y et al . Thalamic atrophy contributes to low slow wave sleep in Neuromyelitis Optica Spectrum disorder. Aging Dis. (2016) 7:691–6. doi: 10.14336/AD.2016.0419
56.
Kim SH Kwak K Hyun JW Joung A Lee SH Choi YH et al . Diffusion tensor imaging of normal-appearing white matter in patients with neuromyelitis optica spectrum disorder and multiple sclerosis. Eur J Neurol. (2017) 24:966–73. doi: 10.1111/ene.13321
57.
Liu Y Duan Y Huang J Ren Z Liu Z Dong H et al . Different patterns of longitudinal brain and spinal cord changes and their associations with disability progression in NMO and MS. Eur Radiol. (2018) 28:96–103. doi: 10.1007/s00330-017-4921-x
58.
Tian D-C Su L Fan M Yang J Zhang R Wen P et al . Bidirectional degeneration in the visual pathway in neuromyelitis optica spectrum disorder (NMOSD). Mult Scler J. (2018) 24:1585–93. doi: 10.1177/1352458517727604
59.
Kim S-H Park EY Park B Hyun J-W Park NY Joung A et al . Multimodal magnetic resonance imaging in relation to cognitive impairment in neuromyelitis optica spectrum disorder. Sci Rep. (2017) 7:9180. doi: 10.1038/s41598-017-08889-9
60.
Sun J Sun X Zhang N Wang Q Cai H Qi Y et al . Analysis of brain and spinal cord lesions to occult brain damage in seropositive and seronegative neuromyelitis optica. Eur J Radiol. (2017) 94:25–30. doi: 10.1016/j.ejrad.2017.07.002
61.
Lee C-Y Mak HK-F Chiu P-W Chang H-C Barkhof F Chan K-H . Differential brainstem atrophy patterns in multiple sclerosis and neuromyelitis optica spectrum disorders: differential brainstem atrophy patterns. J Magn Reson Imaging. (2018) 47:1601–9. doi: 10.1002/jmri.25866
62.
Rueda-Lopes FC Pessôa FMC Tukamoto G Malfetano FR Scherpenhuijzen SB Alves-Leon S et al . Default-mode network and deep gray-matter analysis in neuromyelitis optica patients. J Neuroradiol. (2018) 45:256–60. doi: 10.1016/j.neurad.2018.01.053
63.
Rocca MA Savoldi F Valsasina P Radaelli M Preziosa P Comi G et al . Cross-modal plasticity among sensory networks in neuromyelitis optica spectrum disorders. Mult Scler J. (2019) 25:968–79. doi: 10.1177/1352458518778008
64.
Kuchling J Backner Y Oertel FC Raz N Bellmann-Strobl J Ruprecht K et al . Comparison of probabilistic tractography and tract-based spatial statistics for assessing optic radiation damage in patients with autoimmune inflammatory disorders of the central nervous system. NeuroImage Clin. (2018) 19:538–50. doi: 10.1016/j.nicl.2018.05.004
65.
Chen X Fu J Luo Q Han Y Zheng Q Xie M et al . Altered volume and microstructural integrity of hippocampus in NMOSD. Mult Scler Relat Disord. (2019) 28:132–7. doi: 10.1016/j.msard.2018.12.009
66.
Savoldi F Rocca MA Valsasina P Riccitelli GC Mesaros S Drulovic J et al . Functional brain connectivity abnormalities and cognitive deficits in neuromyelitis optica spectrum disorder. Mult Scler J. (2020) 26:795–805. doi: 10.1177/1352458519845109
67.
Pudlac A Burgetova A Dusek P Nytrova P Vaneckova M Horakova D et al . Deep gray matter Iron content in Neuromyelitis Optica and multiple sclerosis. Biomed Res Int. (2020) 2020:6492786. doi: 10.1155/2020/6492786
68.
Tian D-C Xiu Y Wang X Shi K Fan M Li T et al . Cortical thinning and ventricle enlargement in Neuromyelitis Optica Spectrum disorders. Front Neurol. (2020) 11:872. doi: 10.3389/fneur.2020.00872
69.
Asseyer S Kuchling J Gaetano L Komnenić D Siebert N Chien C et al . Ventral posterior nucleus volume is associated with neuropathic pain intensity in neuromyelitis optica spectrum disorders. Mult Scler Relat Disord. (2020) 46:102579. doi: 10.1016/j.msard.2020.102579
70.
Heine J Prüß H Scheel M Brandt AU Gold SM Bartsch T et al . Transdiagnostic hippocampal damage patterns in neuroimmunological disorders. Neuroimage Clin. (2020) 28:102515. doi: 10.1016/j.nicl.2020.102515
71.
Duan Y Zhuo Z Li H Tian D-C Li Y Yang L et al . Brain structural alterations in MOG antibody diseases: a comparative study with AQP4 seropositive NMOSD and MS. J Neurol Neurosurg Psychiatry. (2021) 92:709–16. doi: 10.1136/jnnp-2020-324826
72.
Messina S Mariano R Roca-Fernandez A Cavey A Jurynczyk M Leite MI et al . Contrasting the brain imaging features of MOG-antibody disease, with AQP4-antibody NMOSD and multiple sclerosis. Mult Scler J. (2022) 28:217–27. doi: 10.1177/13524585211018987
73.
Gao C Zhuo Z Duan Y Yao Y Su L Zhang X et al . Structural and functional alterations in visual pathway after optic neuritis in MOG antibody disease: a comparative study with AQP4 seropositive NMOSD. Front Neurol. (2021) 12:673472. doi: 10.3389/fneur.2021.673472
74.
Zheng F Li Y Zhuo Z Duan Y Cao G Tian D et al . Structural and functional hippocampal alterations in multiple sclerosis and neuromyelitis optica spectrum disorder. Mult Scler J. (2022) 28:707–17. doi: 10.1177/13524585211032800
75.
Chen X Roberts N Zheng Q Peng Y Han Y Luo Q et al . Progressive brain microstructural damage in patients with multiple sclerosis but not in patients with neuromyelitis optica spectrum disorder: a cross-sectional and follow-up tract-based spatial statistics study. Mult Scler Relat Disord. (2021) 55:103178. doi: 10.1016/j.msard.2021.103178
76.
Cacciaguerra L Valsasina P Meani A Riccitelli GC Radaelli M Rocca MA et al . Volume of hippocampal subfields and cognitive deficits in neuromyelitis optica spectrum disorders. Eur J Neurol. (2021) 28:4167–77. doi: 10.1111/ene.15073
77.
Andica C Hagiwara A Yokoyama K Kato S Uchida W Nishimura Y et al . Multimodal magnetic resonance imaging quantification of gray matter alterations in relapsing-remitting multiple sclerosis and neuromyelitis optica spectrum disorder. J Neurosci Res. (2022) 100:1395–412. doi: 10.1002/jnr.25035
78.
Rechtman A Brill L Zveik O Uliel B Haham N Bick AS et al . Volumetric brain loss correlates with a relapsing MOGAD disease course. Front Neurol. (2022) 13:867190. doi: 10.3389/fneur.2022.867190
79.
Cacciaguerra L Pagani E Radaelli M Mesaros S Martinelli V Ivanovic J et al . MR T2-relaxation time as an indirect measure of brain water content and disease activity in NMOSD. J Neurol Neurosurg Psychiatry. (2022) 93:753–60. doi: 10.1136/jnnp-2022-328956
80.
Zhang Y Chen H Shi Z Du Q Wang J Wang X et al . Brain structural and functional connectivity alterations are associated with fatigue in neuromyelitis optica spectrum disorder. BMC Neurol. (2022) 22:235. doi: 10.1186/s12883-022-02757-4
81.
Cacciaguerra L Mistri D Valsasina P Martinelli V Filippi M Rocca MA . Time-varying connectivity of the precuneus and its association with cognition and depressive symptoms in neuromyelitis optica: a pilot MRI study. Mult Scler J. (2022) 28:2057–69. doi: 10.1177/13524585221107125
82.
Cortese R Prados Carrasco F Tur C Bianchi A Brownlee W De Angelis F et al . Differentiating multiple sclerosis from AQP4-Neuromyelitis Optica Spectrum disorder and MOG-antibody disease with imaging. Neurology. (2023) 100:e308–23. doi: 10.1212/WNL.0000000000201465
83.
Wei R Xu X Duan Y Zhang N Sun J Li H et al . Brain age gap in neuromyelitis optica spectrum disorders and multiple sclerosis. J Neurol Neurosurg Psychiatry. (2023) 94:31–7. doi: 10.1136/jnnp-2022-329680
84.
Lotan I Billiet T Ribbens A Van Hecke W Huang B Kister I et al . Volumetric brain changes in MOGAD: a cross-sectional and longitudinal comparative analysis. Mult Scler Relat Disord. (2023) 69:104436. doi: 10.1016/j.msard.2022.104436
85.
Xie Y Zhang Y Yao Y Liu D Zhu H Liu C et al . Structural covariance in subcortical regions in multiple sclerosis and neuromyelitis optica spectrum disorders: an MRI-based study with automated brain volumetry. Mult Scler Relat Disord. (2023) 70:104516. doi: 10.1016/j.msard.2023.104516
86.
Bartels F Baumgartner B Aigner A Cooper G Blaschek A Wendel EM et al . Impaired brain growth in myelin oligodendrocyte glycoprotein antibody–associated acute disseminated encephalomyelitis. Neurol Neuroimmunol Neuroinflamm. (2023) 10:e200066. doi: 10.1212/NXI.0000000000200066
87.
Zakani M Nigritinou M Ponleitner M Takai Y Hofmann D Hillebrand S et al . Paths to hippocampal damage in neuromyelitis optica spectrum disorders. Neuropathol Appl Neurobiol. (2023) 49:e12893. doi: 10.1111/nan.12893
88.
Sun J Xu S Tian D Duan Y Xu X Lv S et al . Periventricular gradients in NAWM abnormalities differ in MS, NMOSD and MOGAD. Mult Scler Relat Disord. (2023) 75:104732. doi: 10.1016/j.msard.2023.104732
89.
Masuda H Mori M Hirano S Uzawa A Uchida T Muto M et al . Higher longitudinal brain white matter atrophy rate in aquaporin-4 IgG-positive NMOSD compared with healthy controls. Sci Rep. (2023) 13:12631. doi: 10.1038/s41598-023-38893-1
90.
Ma H Zhu Y Liang X Wu L Wang Y Li X et al . In patients with mild disability NMOSD: is the alteration in the cortical morphological or functional network topological properties more significant. Front Immunol. (2024) 15:1345843. doi: 10.3389/fimmu.2024.1345843
91.
Wang Y Yang Z Zheng X Liang X Chen J He T et al . Temporal and topological properties of dynamic networks reflect disability in patients with neuromyelitis optica spectrum disorders. Sci Rep. (2024) 14:4199. doi: 10.1038/s41598-024-54518-7
92.
Schneider R Kogel A Ladopoulos T Siems N Krieger B Bellenberg B et al . Cortical atrophy patterns in myelin oligodendrocyte glycoprotein antibody-associated disease. Ann Clin Transl Neurol. (2024) 11:2166–75. doi: 10.1002/acn3.52137
93.
Tsai C Combes A McMullen K Kolind SH Traboulsee AL . Exploring subcortical pathology and processing speed in neuromyelitis optica spectrum disorder with myelin water imaging. J Neuroimaging. (2025) 35:e13250. doi: 10.1111/jon.13250
Summary
Keywords
NMOSD, MOGAD, volumetry, meta-analysis, atrophy
Citation
Rechtman A, Zveik O and Vaknin-Dembinsky A (2025) Brain atrophy in NMOSD and MOGAD: a meta-analysis of volumetric and DTI biomarkers. Front. Neurol. 16:1703283. doi: 10.3389/fneur.2025.1703283
Received
11 September 2025
Revised
14 November 2025
Accepted
18 November 2025
Published
02 December 2025
Volume
16 - 2025
Edited by
Alberto Gajofatto, University of Verona, Italy
Reviewed by
John A. Lincoln, University of Texas Health Science Center at Houston, United States
Klara Almakhanova, Kazakh National Medical University, Kazakhstan
Updates
Copyright
© 2025 Rechtman, Zveik and Vaknin-Dembinsky.
This is an open-access article distributed under the terms of the Creative Commons Attribution License (CC BY). The use, distribution or reproduction in other forums is permitted, provided the original author(s) and the copyright owner(s) are credited and that the original publication in this journal is cited, in accordance with accepted academic practice. No use, distribution or reproduction is permitted which does not comply with these terms.
*Correspondence: Ariel Rechtman, arielrechtman@gmail.com
Disclaimer
All claims expressed in this article are solely those of the authors and do not necessarily represent those of their affiliated organizations, or those of the publisher, the editors and the reviewers. Any product that may be evaluated in this article or claim that may be made by its manufacturer is not guaranteed or endorsed by the publisher.