Abstract
Background:
Delayed cerebral ischemia (DCI) remains a leading cause of secondary neurological deterioration and mortality after aneurysmal subarachnoid hemorrhage (aSAH). Accumulating evidence highlights the pivotal role of systemic inflammation in the pathogenesis of DCI, with peripheral inflammatory markers showing potential as early indicators. However, the predictive performance of individual biomarkers is limited. By leveraging machine learning (ML) techniques, it is possible to integrate heterogeneous inflammatory signals and model complex nonlinear relationships to improve individualized risk prediction.
Methods and materials:
We conducted a retrospective analysis of 562 aSAH patients admitted to a single tertiary center. Clinical, radiographic, and laboratory data—including peripheral inflammatory indices—were extracted from electronic medical records. The Boruta algorithm was applied for feature selection. Six ML models were developed and compared: logistic regression, neural network, random forest, support vector machine, gradient boosting machine (GBM), and extreme gradient boosting (XGBoost). Model performance was evaluated using the area under the receiver operating characteristic curve (AUC), sensitivity, specificity, F1 score, calibration curves, and decision curve analysis (DCA).
Results:
Among the six models, the neural network demonstrated the best balance between discrimination and calibration, with an AUC of 0.826 in the training cohort and 0.808 in the internal testing cohort. Eight predictors were included in the final model: Glasgow Coma Scale (GCS), Hunt-Hess grade, modified Fisher score, prognostic nutritional index (PNI), neutrophil-to-albumin ratio (NAR), neutrophil-to-lymphocyte platelet ratio (NLPR), C-reactive protein-to-lymphocyte ratio (CLR), and procalcitonin. SHapley Additive exPlanations (SHAP) analysis revealed Hunt-Hess grade and procalcitonin as top contributors.
Conclusion:
This study proposes a machine learning–based risk prediction tool for DCI after aSAH, built from routinely available inflammatory and clinical variables. The model demonstrated strong discriminative and calibration performance and provides a clinically interpretable, preoperative decision-support tool. Prospective multicenter validation is warranted to assess generalizability and facilitate clinical translation.
1 Introduction
Aneurysmal subarachnoid hemorrhage (aSAH) is a neurological emergency with high rates of mortality and long-term disability, accounting for a significant proportion of stroke-related morbidity (1). Despite advances in early management, more than 50% of survivors experience persistent neurological or cognitive deficits (2, 3). Delayed cerebral ischemia (DCI), occurring in 20–30% of patients between days 4–14 post-hemorrhage, is a major contributor to poor outcomes and increased healthcare burden (4–8). Its insidious onset and nonspecific symptoms hinder timely diagnosis and intervention.
There is an urgent clinical need for early, individualized risk prediction of DCI. Increasing evidence highlights the role of systemic inflammation in its pathogenesis (9–11). Blood–brain barrier disruption, microvascular dysfunction, and cytokine release after aSAH contribute to cerebral ischemia. Several peripheral inflammatory biomarkers—such as neutrophil × lymphocyte to platelet ratio (NLPR), procalcitonin (PCT), C-reactive protein-to-lymphocyte ratio (CLR), and systemic immune-inflammation index (SII)—have been explored for predicting DCI, yet single indices lack sufficient discriminative power.
Machine learning (ML) algorithms can address this limitation by modeling complex nonlinear interactions among multiple clinical and inflammatory variables (12–14). Unlike traditional statistical methods, ML enables data-driven feature selection and individualized risk estimation. Interpretability techniques such as Shapley Additive exPlanations (SHAP) further enhance transparency and support clinical integration.
In this study, we retrospectively analyzed 562 aSAH patients and developed multiple ML models to predict DCI using routinely collected inflammatory and clinical parameters. We applied Boruta for feature selection, compared six algorithms, and assessed performance in terms of discrimination, calibration, and clinical utility. Our goal was to build an interpretable, EMR-compatible risk prediction tool to support early stratification and decision-making in aSAH.
2 Materials and methods
2.1 Study design and population
This retrospective cohort study was conducted at a tertiary medical center and designed according to the Declaration of Helsinki and the STROBE guidelines. A total of 562 patients diagnosed with aSAH were included. Diagnosis was confirmed via cranial CT, CTA, or DSA, based on criteria from the Clinical Practice Guidelines for SAH.
Inclusion criteria were: (1) spontaneous SAH; (2) admission within 24 h of symptom onset; (3) blood tests and CT performed within 24 h of admission; (4) aneurysm secured by surgical clipping or endovascular coiling within 72 h; and (5) DCI occurring between days 4–14 after aSAH.
Exclusion criteria included: (1) SAH from trauma, AVM, AVF, or other non-aneurysmal causes; (2) recurrent aSAH or reoperation; (3) in-hospital death; (4) comorbid infection, autoimmune disease, malignancy, uremia, cirrhosis, chronic heart/pulmonary disease; or (5) history of stroke with residual deficits.
2.2 Data collection
Demographic and clinical data were extracted from electronic medical records, including age, sex, smoking and alcohol history, hypertension, diabetes mellitus, coronary artery disease, anticoagulant use, and other comorbidities. Neurological status on admission was assessed using the World Federation of Neurosurgical Societies (WFNS) grade, Hunt–Hess grade, and modified Fisher score. To evaluate systemic inflammation and immune-nutritional status, several derived indices were calculated from routine laboratory tests, including the prognostic nutritional index (PNI = albumin + 5 × lymphocyte count), neutrophil-to-albumin ratio (NAR), platelet-to-albumin ratio (PAR), neutrophil × lymphocyte to platelet ratio (NLPR), monocyte-to-Lymphocyte Ratio (MLR), systemic Inflammation Response Index (SIRI) and platelet-to-lymphocyte ratio (PLR). These indices have been recognized in previous studies as surrogate markers of inflammatory activation and immunonutritional imbalance in critical illness. Importantly, all laboratory parameters used for these calculations were obtained from the first routine blood test performed within 24 h after admission, typically collected by trained nurses, to ensure data consistency and minimize variability related to timing. During hospitalization, all patients received standardized treatments in accordance with established management guidelines for aSAH, including blood pressure control, intracranial pressure reduction, and prevention of cerebral vasospasm (CVS).
2.3 Outcome definition
DCI was defined according to the international consensus criteria proposed by Vergouwen et al. (15), supplemented by current clinical practice. DCI was considered present if it occurred between days 4 and 14 following aSAH and was not attributable to other causes such as rebleeding, infection, seizures, or metabolic disturbances. The diagnosis required at least one of the following: (1) new focal neurological deficits, including hemiparesis, aphasia, hemianopia, or neglect, lasting more than 1 h; (2) a decrease of two or more points in the Glasgow Coma Scale (GCS) score, either in individual domains or total score, sustained for at least 1 h; (3) new ischemic lesions on CT or MRI not observed on initial or early postoperative imaging; or (4) in patients with impaired consciousness, DCI was inferred from ancillary findings such as regional hypoperfusion on CT perfusion imaging (CTP), elevated cerebral blood flow velocity on transcranial Doppler (TCD), or cortical dysfunction indicated by diffuse slow-wave activity on electroencephalography (EEG). All cases were reviewed and confirmed by experienced neurosurgeons and neuroradiologists through clinical and imaging consensus.
2.4 Statistical analysis
All analyses were performed using SPSS version 27.0 (IBM Corp., Armonk, NY, USA), GraphPad Prism version 10.1.2 (GraphPad Software, San Diego, CA, USA), and RStudio version 4.4.2. Feature selection was conducted using the Boruta algorithm, a random forest–based wrapper method that introduces shadow features to identify variables with significant predictive importance. Based on the selected features, six supervised machine learning models were developed: logistic regression, neural network, random forest (RF), support vector machine (SVM), gradient boosting machine (GBM), and extreme gradient boosting (XGBoost).
During model development, all hyperparameters were systematically tuned using grid-search optimization, and 10-fold cross-validation was applied to reduce the risk of overfitting and enhance model stability. The key hyperparameter settings, tuning ranges, and final optimal values for each model are provided in Supplementary File S1 for transparency and reproducibility.
Model performance was evaluated using accuracy, area under the receiver operating characteristic curve (AUC), sensitivity, specificity, and F1 score. ROC curves and AUC values were computed using the “pROC” package. Calibration was assessed with Brier scores and calibration curves generated using the “caret” package, where lower Brier scores indicated better agreement between predicted probabilities and observed outcomes. Decision curve analysis (DCA) was performed using the “ggDCA” package to evaluate clinical utility across different threshold probabilities. To enhance interpretability, Shapley Additive explanations (SHAP) were implemented using the “shapviz” package to visualize feature contributions at both global and individual levels. Additional R packages used for data preprocessing, modeling, and visualization included tidyverse, ggplot2, rms, and rmda.
3 Results
3.1 Participants characteristics
A total of 562 patients with aSAH were included and randomly assigned to a training cohort (n = 393) and a testing cohort (n = 169). Baseline characteristics were largely comparable between the two groups, as shown in Table 1. The median age of the overall cohort was 58.0 years (IQR: 51.0–66.8), with no significant difference between cohorts (p = 0.506). Inflammatory and nutritional indicators—including albumin, fibrinogen, PNI, NAR, PAR, NLPR, MLR, SIRI, CLR, procalcitonin, CRP, blood glucose, and creatinine—were similarly distributed (p > 0.05), except for creatinine, which showed a borderline difference (p = 0.072). Categorical variables such as sex, smoking, alcohol use, hypertension, Hunt–Hess grade, modified Fisher score, aneurysm location, surgical modality, and GCS score were also balanced between groups (p > 0.05). The only significant difference was the prevalence of diabetes mellitus, which was higher in the testing cohort (10.65%) than in the training cohort (5.09%) (p = 0.016).
Table 1
| Variables | Total (n = 562) | Test (n = 169) | Train (n = 393) | p |
|---|---|---|---|---|
| Age, M (Q₁, Q₃) | 58.00 (51.00, 66.75) | 57.00 (50.00, 66.00) | 58.00 (51.00, 67.00) | 0.506 |
| Albumin, M (Q₁, Q₃) | 38.90 (34.60, 42.30) | 38.40 (34.10, 42.30) | 39.10 (34.60, 42.30) | 0.770 |
| Fibrinogen, M (Q₁, Q₃) | 3.00 (2.50, 3.68) | 3.00 (2.40, 3.70) | 3.00 (2.50, 3.60) | 0.959 |
| PNI, M (Q₁, Q₃) | 44.67 (39.88, 48.83) | 44.70 (40.05, 48.20) | 44.65 (39.85, 49.15) | 0.638 |
| NAR, M (Q₁, Q₃) | 0.24 (0.18, 0.31) | 0.22 (0.17, 0.30) | 0.25 (0.18, 0.31) | 0.104 |
| PAR, M (Q₁, Q₃) | 5.01 (4.06, 6.22) | 4.95 (4.00, 6.26) | 5.02 (4.08, 6.19) | 0.815 |
| NLPR, M (Q₁, Q₃) | 0.05 (0.03, 0.08) | 0.04 (0.03, 0.08) | 0.05 (0.03, 0.08) | 0.684 |
| MLR, M (Q₁, Q₃) | 0.53 (0.33, 0.89) | 0.48 (0.32, 0.92) | 0.55 (0.35, 0.88) | 0.369 |
| SIRI, M (Q₁, Q₃) | 5.04 (2.60, 9.69) | 4.24 (2.23, 9.05) | 5.20 (2.81, 9.80) | 0.139 |
| CLR, M (Q₁, Q₃) | 6.07 (1.64, 20.08) | 6.30 (1.75, 24.78) | 5.91 (1.60, 19.29) | 0.495 |
| Procalcitonin, M (Q₁, Q₃) | 0.14 (0.05, 0.60) | 0.15 (0.06, 0.66) | 0.14 (0.05, 0.58) | 0.596 |
| CRP, M (Q₁, Q₃) | 5.90 (1.72, 19.90) | 6.40 (1.90, 19.60) | 5.60 (1.70, 20.10) | 0.511 |
| Sugar, M (Q₁, Q₃) | 7.60 (6.30, 9.10) | 7.40 (6.20, 9.60) | 7.60 (6.40, 8.90) | 0.840 |
| Creatinine, M (Q₁, Q₃) | 54.50 (45.00, 67.00) | 56.00 (46.00, 69.00) | 53.00 (45.00, 66.00) | 0.072 |
| DCI, n (%) | 0.625 | |||
| No | 384 (68.33) | 113 (66.86) | 271 (68.96) | |
| Yes | 178 (31.67) | 56 (33.14) | 122 (31.04) | |
| Sex, n (%) | 0.212 | |||
| Male | 224 (39.86) | 74 (43.79) | 150 (38.17) | |
| Female | 338 (60.14) | 95 (56.21) | 243 (61.83) | |
| Smoke, n (%) | 0.428 | |||
| No | 413 (73.49) | 128 (75.74) | 285 (72.52) | |
| Yes | 149 (26.51) | 41 (24.26) | 108 (27.48) | |
| Drink, n (%) | 0.296 | |||
| No | 440 (78.29) | 137 (81.07) | 303 (77.10) | |
| Yes | 122 (21.71) | 32 (18.93) | 90 (22.90) | |
| Hypertension, n (%) | 0.899 | |||
| No | 265 (47.15) | 79 (46.75) | 186 (47.33) | |
| Yes | 297 (52.85) | 90 (53.25) | 207 (52.67) | |
| Diabetes, n (%) | 0.016 | |||
| No | 524 (93.24) | 151 (89.35) | 373 (94.91) | |
| Yes | 38 (6.76) | 18 (10.65) | 20 (5.09) | |
| GCS, n (%) | 0.287 | |||
| 13–15 | 300 (53.38) | 84 (49.70) | 216 (54.96) | |
| 8–12 | 216 (38.43) | 67 (39.64) | 149 (37.91) | |
| 3–7 | 46 (8.19) | 18 (10.65) | 28 (7.12) | |
| Hunt–Hess, n (%) | 0.197 | |||
| I, II | 342 (60.85) | 96 (56.80) | 246 (62.60) | |
| III, IV, V | 220 (39.15) | 73 (43.20) | 147 (37.40) | |
| Modified fisher, n (%) | 0.645 | |||
| I, II | 331 (58.90) | 102 (60.36) | 229 (58.27) | |
| III, IV | 231 (41.10) | 67 (39.64) | 164 (41.73) | |
| Aneurysm location, n (%) | 0.676 | |||
| Anterior circulation | 532 (94.66) | 161 (95.27) | 371 (94.40) | |
| Posterior circulation | 30 (5.34) | 8 (4.73) | 22 (5.60) | |
| Surgical method, n (%) | 0.376 | |||
| Endovascular treatment | 397 (70.64) | 115 (68.05) | 282 (71.76) | |
| Surgical clipping | 165 (29.36) | 54 (31.95) | 111 (28.24) |
Baseline characteristics of the study population across training, internal test, and external validation cohorts.
DCI, Delayed cerebral ischemia; GCS, Glasgow Coma Scale; WFNS, World Federation of Neurosurgical Societies; PNI, prognostic nutritional index; NAR, neutrophil-to-albumin ratio; NLPR, neutrophil/(lymphocyte × platelet) ratio; MLR, Monocyte-to-Lymphocyte Ratio; SIRI, Systemic Inflammation Response Index; CLR, C-reactive protein-to-lymphocyte ratio; PAR, Platelet-to-Albumin Ratio.
Data are presented as n (%). Variables were grouped according to clinical criteria or quartile distribution. p values were calculated using Pearson’s chi-square test or Fisher’s exact test for categorical variables. A two-sided p < 0.05 was considered statistically significant. Bold values represent p < 0.05, considered statistically significant.
In the training cohort, DCI occurred in 122 patients (31.04%). Comparisons between the DCI and non-DCI groups are summarized in Table 2. Patients who developed DCI exhibited significantly elevated levels of NAR (0.28 vs. 0.23, p < 0.001), MLR (0.62 vs. 0.51, p = 0.007), SIRI (7.69 vs. 4.65, p < 0.001), procalcitonin (0.30 vs. 0.11 ng/mL, p < 0.001), and blood glucose (7.80 vs. 7.40 mmol/L, p = 0.040). No significant differences were found for age, albumin, PNI, NLPR, CLR, or creatinine (p > 0.05). Additionally, patients with DCI were more likely to present with lower GCS scores (p < 0.001), higher Hunt–Hess grades, and higher modified Fisher scores (both p < 0.001). The distribution of surgical modalities also differed significantly between groups (p < 0.05).
Table 2
| Variables | Total (n = 393) | No-DCI (n = 271) | DCI (n = 122) | p |
|---|---|---|---|---|
| Age, M (Q₁, Q₃) | 58.00 (51.00, 67.00) | 58.00 (51.00, 66.00) | 59.00 (52.00, 68.00) | 0.264 |
| Albumin, M (Q₁, Q₃) | 39.10 (34.60, 42.30) | 39.10 (34.70, 42.30) | 39.05 (34.70, 42.58) | 0.889 |
| Fibrinogen, M (Q₁, Q₃) | 3.00 (2.50, 3.60) | 3.00 (2.50, 3.70) | 3.00 (2.42, 3.60) | 0.539 |
| PNI, M (Q₁, Q₃) | 44.65 (39.85, 49.15) | 44.55 (39.98, 49.08) | 45.02 (39.75, 49.19) | 0.801 |
| NAR, M (Q₁, Q₃) | 0.25 (0.18, 0.31) | 0.23 (0.18, 0.30) | 0.28 (0.20, 0.35) | <0.001 |
| PAR, M (Q₁, Q₃) | 5.02 (4.08, 6.19) | 5.02 (4.08, 6.23) | 5.02 (4.10, 6.17) | 0.958 |
| NLPR, M (Q₁, Q₃) | 0.05 (0.03, 0.08) | 0.05 (0.03, 0.07) | 0.06 (0.03, 0.10) | 0.144 |
| MLR, M (Q₁, Q₃) | 0.55 (0.35, 0.88) | 0.51 (0.34, 0.82) | 0.62 (0.36, 1.12) | 0.007 |
| SIRI, M (Q₁, Q₃) | 5.20 (2.81, 9.80) | 4.65 (2.60, 8.71) | 7.69 (3.25, 12.69) | <0.001 |
| CLR, M (Q₁, Q₃) | 5.91 (1.60, 19.29) | 6.07 (1.61, 16.96) | 5.57 (1.50, 27.14) | 0.447 |
| Procalcitonin, M (Q₁, Q₃) | 0.14 (0.05, 0.58) | 0.11 (0.04, 0.40) | 0.30 (0.07, 1.10) | <0.001 |
| CRP, M (Q₁, Q₃) | 5.60 (1.70, 20.10) | 5.60 (1.75, 17.25) | 5.50 (1.42, 28.05) | 0.447 |
| Sugar, M (Q₁, Q₃) | 7.60 (6.40, 8.90) | 7.40 (6.20, 8.80) | 7.80 (6.60, 9.40) | 0.040 |
| Creatinine, M (Q₁, Q₃) | 53.00 (45.00, 66.00) | 53.00 (45.00, 64.50) | 54.00 (46.00, 68.00) | 0.443 |
| Sex, n (%) | 0.223 | |||
| Male | 150 (38.17) | 98 (36.16) | 52 (42.62) | |
| Female | 243 (61.83) | 173 (63.84) | 70 (57.38) | |
| Smoke, n (%) | 0.709 | |||
| No | 285 (72.52) | 195 (71.96) | 90 (73.77) | |
| Yes | 108 (27.48) | 76 (28.04) | 32 (26.23) | |
| Drink, n (%) | 0.292 | |||
| No | 303 (77.10) | 213 (78.60) | 90 (73.77) | |
| Yes | 90 (22.90) | 58 (21.40) | 32 (26.23) | |
| Hypertension, n (%) | 0.210 | |||
| No | 186 (47.33) | 134 (49.45) | 52 (42.62) | |
| Yes | 207 (52.67) | 137 (50.55) | 70 (57.38) | |
| Diabetes, n (%) | 0.166 | |||
| No | 373 (94.91) | 260 (95.94) | 113 (92.62) | |
| Yes | 20 (5.09) | 11 (4.06) | 9 (7.38) | |
| GCS, n (%) | <0.001 | |||
| 13–15 | 216 (54.96) | 186 (68.63) | 30 (24.59) | |
| 8–12 | 149 (37.91) | 83 (30.63) | 66 (54.10) | |
| 3–7 | 28 (7.12) | 2 (0.74) | 26 (21.31) | |
| Hunt–Hess, n (%) | <0.001 | |||
| I, II | 246 (62.60) | 211 (77.86) | 35 (28.69) | |
| III, IV, V | 147 (37.40) | 60 (22.14) | 87 (71.31) | |
| Modified fisher, n (%) | <0.001 | |||
| I, II | 229 (58.27) | 181 (66.79) | 48 (39.34) | |
| III, IV | 164 (41.73) | 90 (33.21) | 74 (60.66) | |
| Aneurysm location, n (%) | 0.579 | |||
| Anterior circulation | 371 (94.40) | 257 (94.83) | 114 (93.44) | |
| Posterior circulation | 22 (5.60) | 14 (5.17) | 8 (6.56) | |
| Surgical method, n (%) | <0.001 | |||
| Endovascular treatment | 282 (71.76) | 209 (77.12) | 73 (59.84) | |
| Surgical clipping | 111 (28.24) | 62 (22.88) | 49 (40.16) |
Demographic characteristics of patients with different outcomes in the training cohort.
DCI, Delayed cerebral ischemia; GCS, Glasgow Coma Scale; WFNS, World Federation of Neurosurgical Societies; PNI, prognostic nutritional index; NAR, neutrophil-to-albumin ratio; NLPR, neutrophil/(lymphocyte × platelet) ratio; MLR, Monocyte-to-Lymphocyte Ratio; SIRI, Systemic Inflammation Response Index; CLR, C-reactive protein-to-lymphocyte ratio; PAR, Platelet-to-Albumin Ratio.
Data are presented as n (%). Variables were grouped according to clinical criteria or quartile distribution. p values were calculated using Pearson’s chi-square test or Fisher’s exact test for categorical variables. A two-sided p < 0.05 was considered statistically significant. Bold values represent p < 0.05, considered statistically significant.
3.2 Feature selection
A total of 24 candidate predictors were initially included, encompassing clinical grading scales, radiological scores, and a range of inflammatory and nutritional biomarkers. To identify the most relevant variables associated with DCI, we applied the Boruta algorithm, a random forest–based wrapper method that introduces shuffled shadow features to assess the relative importance of original variables (Figure 1). After iterative comparisons and statistical filtering, eight variables were retained as core predictors: GCS, modified Fisher score, Hunt–Hess grade, PNI, NAR, NLPR, CLR, and procalcitonin (Figure 1). These features demonstrated high selection stability, strong discriminative potential, and good clinical interpretability, and were used for subsequent model construction.
Figure 1

Feature selection process and final predictor selection. Feature importance identified by the Boruta algorithm (green: confirmed, red: rejected, yellow: tentative).
Subsequently, model-specific interpretability tools—including integrated gradients and permutation-based importance (in the neural network)—were used to assess and rank feature importance across all six machine learning algorithms (Figure 2). GCS score, CLR, and procalcitonin consistently ranked among the top predictors in multiple models, underscoring their pivotal role in the early identification of DCI risk.
Figure 2
Top-ranked predictors across different machine learning models. (A–F) The figure shows the top 10 most important features identified by six machine learning algorithms: (A) GBM, (B) logistic regression (LR), (C) neural network (NN), (D) random forest (RF), (E) support vector machine (SVM), and (F) XGBoost. Feature importance was calculated using internal metrics specific to each model (e.g., standardized coefficients for LR, Gini importance for RF).
3.3 Performance of machine learning models
In the training cohort, the RF model demonstrated the best apparent performance in both discrimination and calibration, with an AUC of 1.00 (95% CI: 1.00–1.00), a Brier score of 0.00, and nearly perfect accuracy, sensitivity, and specificity (Figure 3A). However, such near-perfect performance strongly suggests overfitting, where the model may rely excessively on sample-specific patterns, limiting its generalizability to unseen data (Figure 3D). In comparison, the GBM model achieved a slightly lower training AUC of 0.914 (95% CI: 0.884–0.944) but still maintained stable performance across multiple metrics. While both RF and GBM performed well on training data, their AUCs declined markedly in the testing cohort, indicating a risk of overfitting and highlighting the need for cautious evaluation before clinical application. Notably, the neural network model achieved an AUC of 0.826 in the training cohort and 0.808 in the testing cohort, with a Brier score of 0.163 (Table 3). Although its training performance was lower than that of RF and GBM, the neural network exhibited better generalization with minimal performance drop, suggesting stronger adaptability to unseen data. These findings indicate that despite a slightly weaker initial fit, the neural network holds greater promise for real-world clinical use. In addition, DCA revealed that all six models yielded a positive net clinical benefit across a wide range of risk thresholds (0–0.8), further supporting their potential clinical utility (Figures 3C,F).
Figure 3
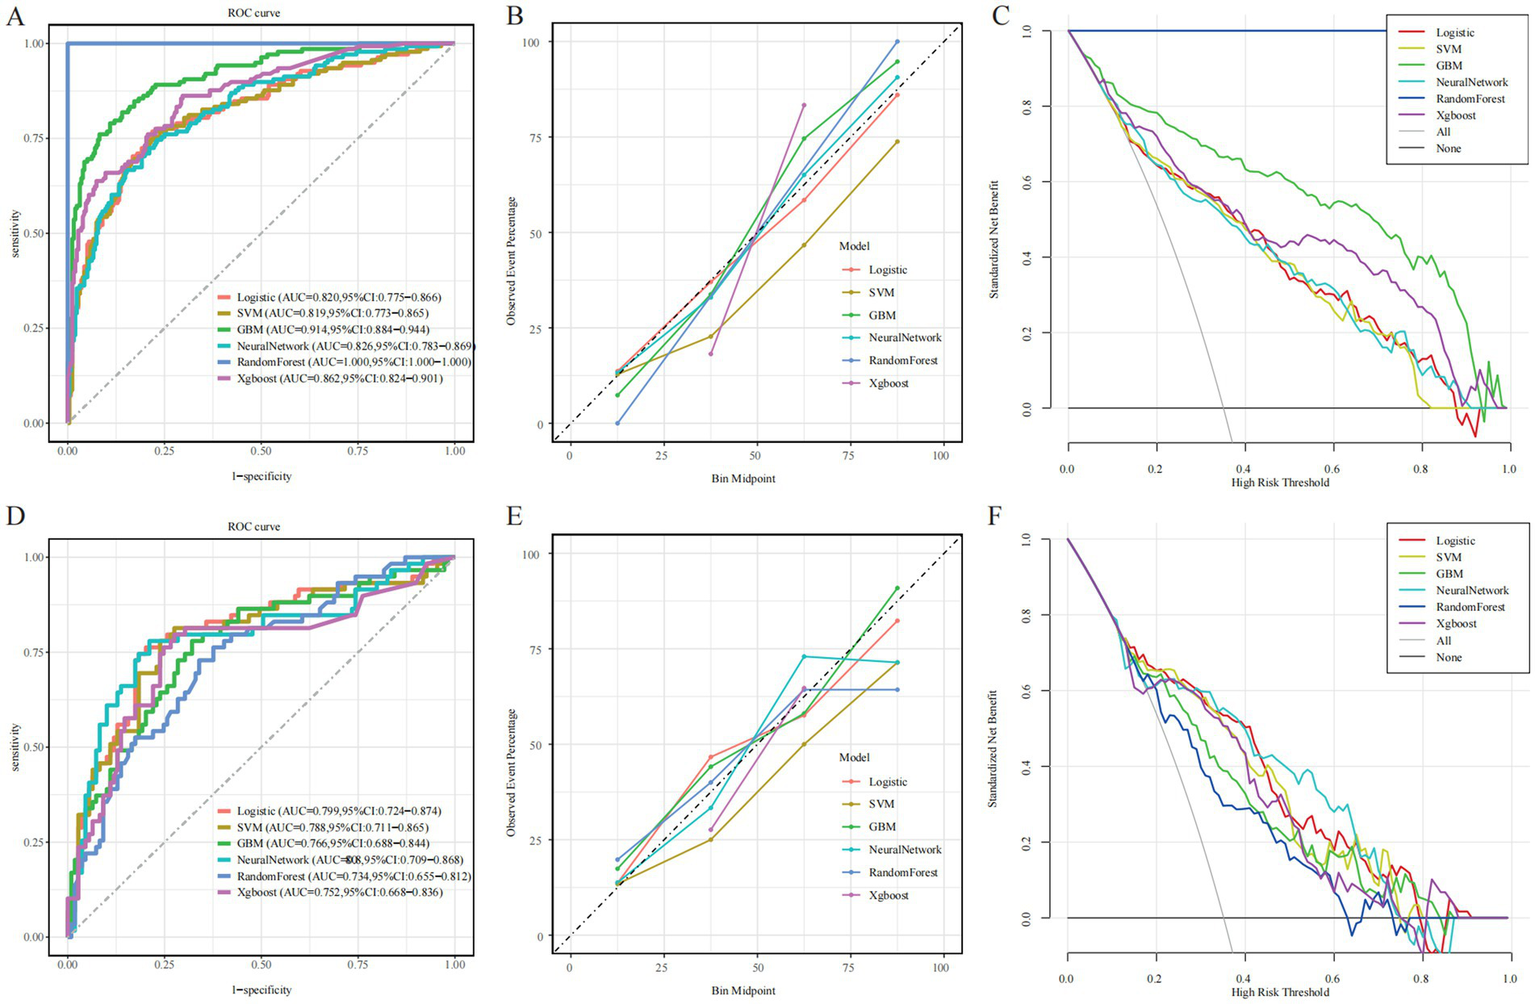
Evaluation of the predictive performance of six machine learning models. (A,D) Receiver operating characteristic (ROC) curves. (B,E) Calibration plots. (C,F) Decision curve analysis (DCA). Left, middle, and right columns represent the training, internal test, and external validation cohorts, respectively.
Table 3
| Data set | Model | Accuracy | Sensitivity | Specificity | Precision | F1 Score | Brier | C index |
|---|---|---|---|---|---|---|---|---|
| Train | LR | 0.777 | 0.768 | 0.781 | 0.654 | 0.707 | 0.155 | 0.82 |
| SVM | 0.772 | 0.746 | 0.785 | 0.652 | 0.696 | 0.167 | 0.819 | |
| GBM | 0.855 | 0.79 | 0.891 | 0.796 | 0.793 | 0.111 | 0.914 | |
| Neural Network | 0.761 | 0.746 | 0.77 | 0.636 | 0.687 | 0.157 | 0.826 | |
| RF | 1 | 1 | 1 | 1 | 1 | 0 | 1 | |
| XGBoost | 0.759 | 0.862 | 0.703 | 0.61 | 0.715 | 0.248 | 0.862 | |
| Test | LR | 0.399 | 0.792 | 0.746 | 0.817 | 0.688 | 0.163 | 0.799 |
| SVM | 0.412 | 0.768 | 0.78 | 0.761 | 0.639 | 0.176 | 0.788 | |
| GBM | 0.216 | 0.714 | 0.78 | 0.679 | 0.568 | 0.184 | 0.766 | |
| Neural Network | 0.344 | 0.806 | 0.78 | 0.837 | 0.687 | 0.163 | 0.808 | |
| RF | 0.21 | 0.685 | 0.729 | 0.661 | 0.537 | 0.207 | 0.734 | |
| XGBoost | 0.498 | 0.75 | 0.797 | 0.725 | 0.61 | 0.249 | 0.752 |
Performance of six machine learning models in the training and test sets.
LR, logistic regression; SVM, support vector machine; GBM, gradient boosting machine; NN, neural network; RF, random forest; AUC, area under the curve.
To evaluate calibration consistency across datasets, calibration curves were plotted for all six models, comparing predicted probabilities with observed event rates. In the training cohort, most models—especially RF and GBM—demonstrated systematic overestimation in the medium-to-high risk range (bin midpoint ≥ 50%), deviating from the ideal calibration line and indicating overfitting (Figure 3B). In contrast, the neural network showed closer alignment with the ideal curve in the low-to-medium risk range. In the testing cohort, overall calibration declined. RF and GBM showed pronounced deviations, overestimating event probabilities in the high-risk range, further confirming poor generalization (Figure 3E). By comparison, the neural network and logistic regression models maintained better calibration across the entire risk spectrum, suggesting more stable and reliable prediction. Confusion matrix analysis further supported the neural network’s generalization capability, showing a high proportion of true positives and true negatives and a relatively low misclassification rate in the testing cohort (Figure 4C). In contrast, the RF model exhibited a higher false-positive rate, particularly in the test set data, reflecting its weaker generalization performance (Figure 4D). The confusion matrices for the other models, including GBM (Figure 4A), logistic regression (Figure 4B), XGBoost (Figure 4E), and SVM (Figure 4F), show generally consistent performance, but they did not exhibit the same degree of overfitting seen in the RF model.
Figure 4
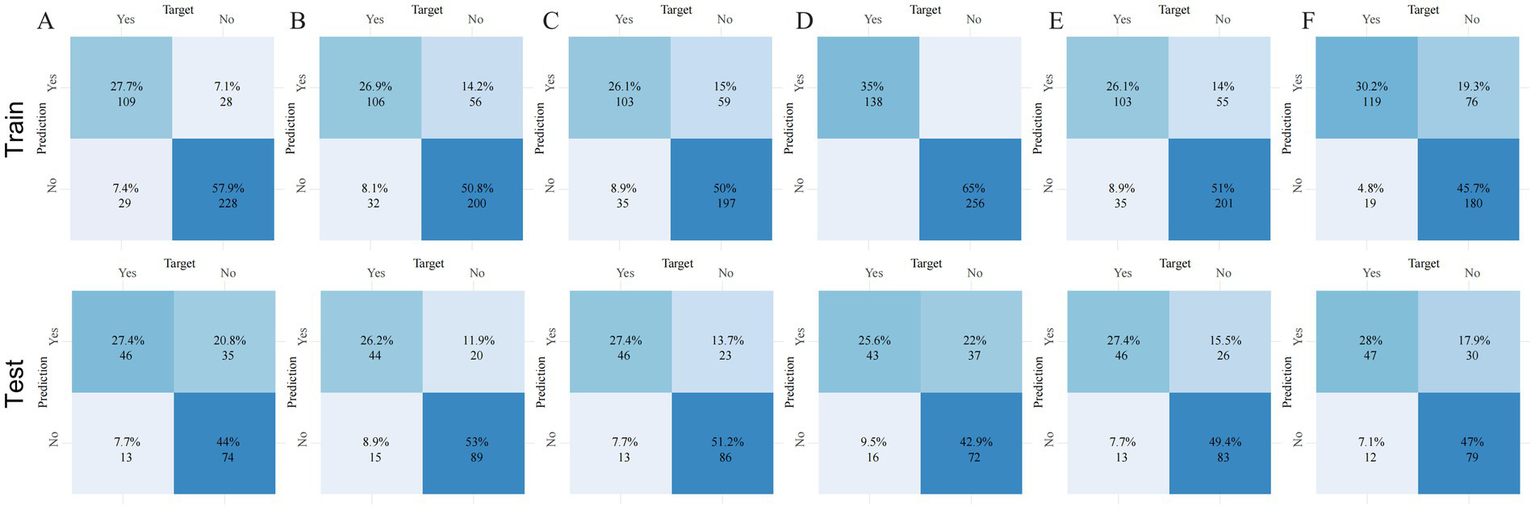
Confusion matrices of six machine learning models across three datasets. Panels (A–F) correspond to the following models: (A) gradient boosting machine (GBM), (B) logistic regression (LR), (C) neural network (NN), (D) random forest (RF), (E) extreme gradient boosting (XGBoost), and (F) support vector machine (SVM). Each panel shows the number of true positives (TP), false positives (FP), true negatives (TN), and false negatives (FN), enabling direct comparison of classification accuracy and error rates across models and datasets.
Considering overall discrimination, calibration, stability, and clinical net benefit, the neural network can be preliminarily regarded as the optimal model within the current dataset. Nonetheless, external validation remains essential to confirm its robustness and applicability in broader clinical settings.
3.4 Model interpretation
To enhance model transparency and support clinical interpretability, SHAP were applied to the neural network model. Global feature importance analysis revealed that Hunt–Hess grade, procalcitonin (PCT), GCS score, PNI, modified Fisher score, NLPR, CLR, and NAR were the top contributors to model predictions (Figure 5A). The SHAP summary plot illustrated both the magnitude and direction of each feature’s impact, showing that higher inflammatory markers and worse clinical grading scores were consistently associated with increased DCI risk (Figure 5B).
Figure 5
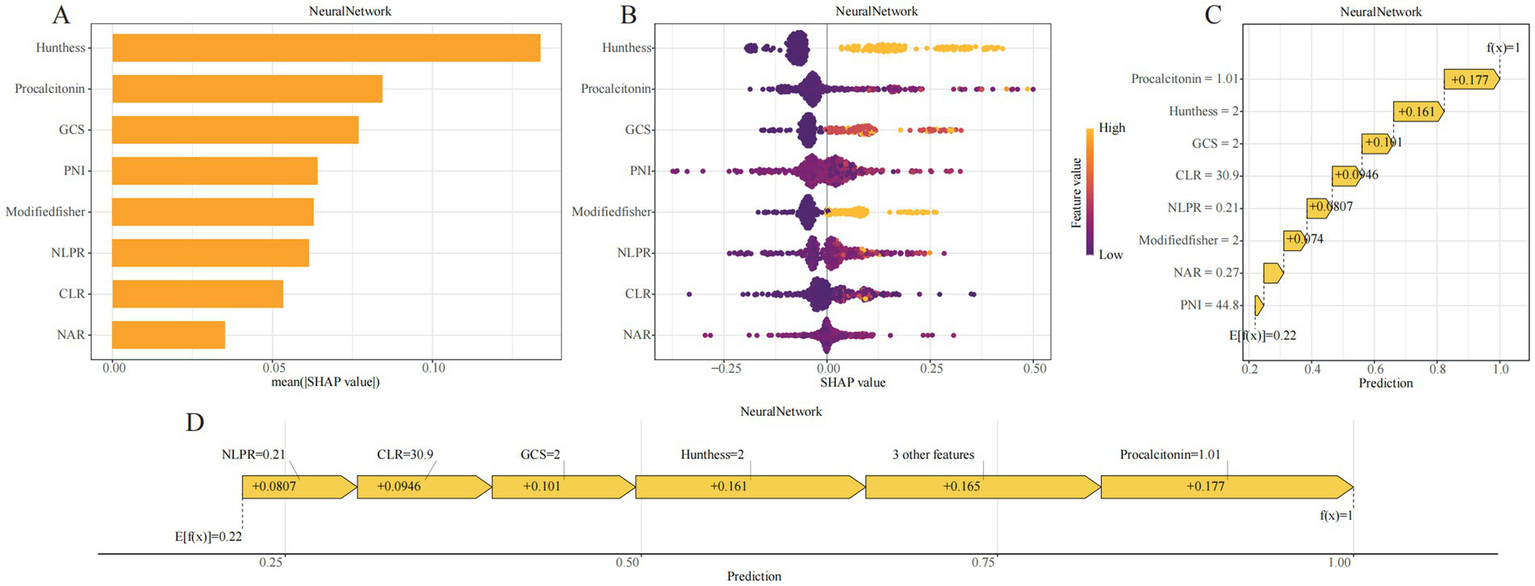
SHAP-based interpretability visualizations for the GBM model. (A) SHAP bar plot showing the mean absolute SHAP values across all samples, representing global feature importance. (B) SHAP beeswarm plot displaying the distribution of SHAP values for each feature across individual samples; color denotes the original feature value and direction of effect. (C) SHAP waterfall plot illustrating how the prediction for a representative patient evolves from the base value (E[f(x)]) to the final output (f(x)) through additive contributions of each variable. (D) SHAP force plot visualizing the positive and negative contributions of features in the same sample; arrow lengths represent effect magnitudes.
At the individual level, SHAP waterfall and force plots provided visual explanations of how each variable contributed to a given patient’s predicted probability (Figures 5C,D). For example, in one representative case, a CLR of 30.9 contributed +0.0946 to the risk estimate, Hunt–Hess grade III–IV added +0.161, PCT level of 1.01 added +0.177, and a GCS score of 8–12 added +0.101. The cumulative SHAP values yielded the final model output, offering an interpretable, traceable rationale for each prediction.
By incorporating SHAP, the neural network model provided not only accurate risk estimation but also clinically meaningful justification for its outputs. This enhanced interpretability addresses the “black-box” nature often associated with machine learning and improves the model’s potential for real-world adoption in neurocritical care.
4 Discussion
In this study, we developed a risk scoring system for predicting DCI in patients with aSAH by integrating clinical grading scales with routinely available inflammatory biomarkers. Based on a single-center retrospective cohort, we applied Boruta-based feature selection and constructed six supervised machine learning models. The proposed system was independently associated with both DCI occurrence and poor outcomes. Incorporating inflammatory markers into the model significantly enhanced its discriminative performance, supporting its potential utility in individualized risk stratification and clinical decision-making. Our findings may find a potential interrelationship among systemic inflammation, DCI, and neurological outcomes; however, confirming this hypothesis will require prospective studies incorporating formal mediation analyses to elucidate the underlying causal pathways and mechanisms.
Systemic inflammation plays a central role in the pathogenesis of intracranial aneurysms and their complications (16–18). Blood-derived inflammatory indices have become widely used due to their accessibility and scalability (19, 20). However, individual markers have limited sensitivity and are often collinear. To address this, we employed the Boruta algorithm, which effectively reduces redundancy by identifying variables with true predictive value while minimizing the impact of multicollinearity (21, 22). The final model integrated neurologic function (GCS), hemorrhage severity (modified Fisher score), and clinical status (Hunt–Hess grade), alongside immune-nutritional indicators such as PNI, NAR, CLR, and NLPR. This multidimensional strategy reflects the early physiological state more comprehensively than any single parameter. Traditional scores such as GCS and Hunt–Hess remain highly informative: in our model, Hunt–Hess grade ranked highest in SHAP importance, reaffirming the continuing value of bedside assessments in the era of machine learning (23–26). The inclusion of inflammatory biomarkers further improved model performance. Lower PNI reflects impaired nutritional and immune reserve (27), while NAR and CLR quantify the imbalance between inflammation and immune suppression (28, 29). NLPR integrates inflammatory and coagulation pathways and has been validated in stroke and critical care populations (30, 31). Among all features, procalcitonin (PCT) showed the highest SHAP contribution (+0.177), underscoring its value in identifying high-inflammatory phenotypes. Although initially developed for infection monitoring, elevated PCT is now linked to secondary brain injury and poor stroke outcomes (32–35), supporting its role in neurocritical risk assessment.
Among all algorithms tested, the neural network achieved the best balance between discrimination and calibration, with an AUC of 0.826 and Brier score of 0.157 in the training cohort, and stable performance in internal validation. SHapley Additive Explanations (SHAP) provided interpretable insights at both global and individual levels. Key contributors—particularly Hunt–Hess grade and PCT—were visualized using summary, waterfall, and force plots. These tools enhanced model transparency and clinical trust, supporting translation into practice. Overall, this study offers three major contributions: (1) construction of a practical risk score combining clinical and inflammatory data, (2) application of Boruta for robust feature selection, and (3) identification of a neural network as the most stable algorithm with strong interpretability. From a methodological perspective, the exclusion of patients who died during hospitalization helped reduce heterogeneity introduced by early catastrophic neurological deterioration. Such patients often experience rapid clinical collapse that prevents standardized neurological assessment or completion of routine laboratory testing. Including these extreme physiological outliers could have distorted model training and obscured the discriminative contributions of inflammatory biomarkers. Therefore, restricting the analysis to hospitalized survivors allowed for more consistent data acquisition and improved internal validity when evaluating early predictors of DCI.
This study has several limitations. First, it was based on retrospective data from a single center, which may restrict the generalizability of our findings. Furthermore, because patients who died during hospitalization were excluded, the study cohort predominantly represents aSAH survivors with relatively better prognoses. This selection may introduce bias and could lead to an overestimation of model performance when applied to more critically ill populations, particularly those with early fatal deterioration and distinct inflammatory trajectories. Future studies should include more comprehensive cohorts incorporating early mortality cases to enhance external validity and ensure broader applicability. Second, although key treatment-related variables such as endovascular therapy and surgical clipping were included in the analysis, other important therapeutic factors—such as nimodipine administration strategies, blood pressure and fluid management protocols, and the intensity of postoperative monitoring—were not comprehensively captured. Because DCI is highly sensitive to these clinical management details, incomplete adjustment for such variables may introduce residual confounding. In addition, the inflammatory response is a dynamic and time-dependent process, whereas our model relied on laboratory measurements obtained at a single time point on admission, limiting the ability to reflect temporal changes in inflammatory status. Therefore, future prospective, multicenter studies with standardized treatment documentation and longitudinal biomarker monitoring are needed to validate the model’s performance and further clarify the influence of dynamic inflammatory trajectories on DCI prediction.
5 Conclusion
In conclusion, we developed and internally validated a machine learning–based risk prediction model for delayed cerebral ischemia after aneurysmal subarachnoid hemorrhage, integrating clinical grading scales with peripheral inflammatory biomarkers. The final model, constructed using a neural network algorithm and interpreted via SHAP, demonstrated robust discriminative performance and clinical interpretability. This practical and accessible scoring system may aid early identification of high-risk patients and support individualized management strategies in neurocritical care. Prospective multicenter studies are warranted to confirm generalizability and assess their potential for clinical integration.
Statements
Data availability statement
The original contributions presented in the study are included in the article/Supplementary material, further inquiries can be directed to the corresponding author.
Ethics statement
The studies involving humans were approved by the Ethics Committee of the Dazhou Central Hospital. The studies were conducted in accordance with the local legislation and institutional requirements. Written informed consent for participation was not required from the participants or the participants’ legal guardians/next of kin in accordance with the national legislation and institutional requirements.
Author contributions
YL: Conceptualization, Data curation, Formal analysis, Investigation, Methodology, Resources, Software, Validation, Visualization, Writing – original draft. CL: Data curation, Formal analysis, Writing – original draft. HW: Funding acquisition, Project administration, Supervision, Writing – review & editing.
Funding
The author(s) declared that financial support was not received for this work and/or its publication.
Conflict of interest
The author(s) declared that this work was conducted in the absence of any commercial or financial relationships that could be construed as a potential conflict of interest.
Generative AI statement
The author(s) declared that Generative AI was not used in the creation of this manuscript.
Any alternative text (alt text) provided alongside figures in this article has been generated by Frontiers with the support of artificial intelligence and reasonable efforts have been made to ensure accuracy, including review by the authors wherever possible. If you identify any issues, please contact us.
Publisher’s note
All claims expressed in this article are solely those of the authors and do not necessarily represent those of their affiliated organizations, or those of the publisher, the editors and the reviewers. Any product that may be evaluated in this article, or claim that may be made by its manufacturer, is not guaranteed or endorsed by the publisher.
Supplementary material
The Supplementary material for this article can be found online at: https://www.frontiersin.org/articles/10.3389/fneur.2025.1713341/full#supplementary-material
References
1.
Feigin VL Lawes CM Bennett DA Barker-Collo SL Parag V . Worldwide stroke incidence and early case fatality reported in 56 population-based studies: a systematic review. Lancet Neurol. (2009) 8:355–69. doi: 10.1016/S1474-4422(09)70025-0,
2.
Molyneux AJ Kerr RS Yu LM Clarke M Sneade M Yarnold JA et al . International subarachnoid aneurysm trial (ISAT) of neurosurgical clipping versus endovascular coiling in 2143 patients with ruptured intracranial aneurysms: a randomised comparison of effects on survival, dependency, seizures, rebleeding, subgroups, and aneurysm occlusion. Lancet. (2005) 366:809–17. doi: 10.1016/S0140-6736(05)67214-5,
3.
Thaler C Tokareva B Wentz R Heitkamp C Bechstein M van Horn N et al . Risk factors for unfavorable functional outcome after endovascular treatment of cerebral vasospasm following aneurysmal subarachnoid hemorrhage. AJNR Am J Neuroradiol. (2025) 46:495–501. doi: 10.3174/ajnr.A8511,
4.
Macdonald RL . Delayed neurological deterioration after subarachnoid haemorrhage. Nat Rev Neurol. (2014) 10:44–58. doi: 10.1038/nrneurol.2013.246,
5.
Geraghty JR Testai FD . Delayed cerebral ischemia after subarachnoid hemorrhage: beyond vasospasm and towards a multifactorial pathophysiology. Curr Atheroscler Rep. (2017) 19:50. doi: 10.1007/s11883-017-0690-x,
6.
Lin F Li R Tu WJ Chen Y Wang K Chen X et al . An update on Antioxidative stress therapy research for early brain injury after subarachnoid hemorrhage. Front Aging Neurosci. (2021) 13:772036. doi: 10.3389/fnagi.2021.772036,
7.
Schweizer TA Al-Khindi T Macdonald RL . Mini-mental state examination versus Montreal cognitive assessment: rapid assessment tools for cognitive and functional outcome after aneurysmal subarachnoid hemorrhage. J Neurol Sci. (2012) 316:137–40. doi: 10.1016/j.jns.2012.01.003,
8.
Francoeur CL Mayer SA . Management of delayed cerebral ischemia after subarachnoid hemorrhage. Crit Care. (2016) 20:277. doi: 10.1186/s13054-016-1447-6,
9.
Okazaki T Kuroda Y . Aneurysmal subarachnoid hemorrhage: intensive care for improving neurological outcome. J Intensive Care. (2018) 6:28. doi: 10.1186/s40560-018-0297-5,
10.
Fujii M Yan J Rolland WB Soejima Y Caner B Zhang JH . Early brain injury, an evolving frontier in subarachnoid hemorrhage research. Transl Stroke Res. (2013) 4:432–46. doi: 10.1007/s12975-013-0257-2,
11.
Lauzier DC Jayaraman K Yuan JY Diwan D Vellimana AK Osbun JW et al . Early brain injury after subarachnoid hemorrhage: incidence and mechanisms. Stroke. (2023) 54:1426–40. doi: 10.1161/STROKEAHA.122.040072,
12.
Tu JV . Advantages and disadvantages of using artificial neural networks versus logistic regression for predicting medical outcomes. J Clin Epidemiol. (1996) 49:1225–31. doi: 10.1016/S0895-4356(96)00002-9,
13.
Ching T Himmelstein DS Beaulieu-Jones BK Kalinin AA Do BT Way GP et al . Opportunities and obstacles for deep learning in biology and medicine. J R Soc Interface. (2018) 15:20170387. doi: 10.1098/rsif.2017.0387,
14.
Jiang F Jiang Y Zhi H Dong Y Li H Ma S et al . Artificial intelligence in healthcare: past, present and future. Stroke Vasc Neurol. (2017) 2:230–43. doi: 10.1136/svn-2017-000101,
15.
Vergouwen MD Vermeulen M van Gijn J Rinkel GJ Wijdicks EF Muizelaar JP et al . Definition of delayed cerebral ischemia after aneurysmal subarachnoid hemorrhage as an outcome event in clinical trials and observational studies: proposal of a multidisciplinary research group. Stroke. (2010) 41:2391–5. doi: 10.1161/STROKEAHA.110.589275
16.
Coulibaly AP Provencio JJ . Aneurysmal subarachnoid hemorrhage: an overview of inflammation-induced cellular changes. Neurotherapeutics. (2020) 17:436–45. doi: 10.1007/s13311-019-00829-x,
17.
Gris T Laplante P Thebault P Cayrol R Najjar A Joannette-Pilon B et al . Innate immunity activation in the early brain injury period following subarachnoid hemorrhage. J Neuroinflammation. (2019) 16:253. doi: 10.1186/s12974-019-1629-7,
18.
Wu Z Cao Y Liu Z Geng N Pan W Zhu Y et al . Study on the predictive value of laboratory inflammatory markers and blood count-derived inflammatory markers for disease severity and prognosis in COVID-19 patients: a study conducted at a university-affiliated infectious disease hospital. Ann Med. (2024) 56:2415401. doi: 10.1080/07853890.2024.2415401,
19.
Okugawa Y Toiyama Y Yamamoto A Shigemori T Ide S Kitajima T et al . Lymphocyte-C-reactive protein ratio as promising new marker for predicting surgical and oncological outcomes in colorectal Cancer. Ann Surg. (2020) 272:342–51. doi: 10.1097/SLA.0000000000003239,
20.
Xie L Wang Q Lu H Kuang M He S Xie G et al . The systemic inflammation response index as a significant predictor of short-term adverse outcomes in acute decompensated heart failure patients: a cohort study from southern China. Front Endocrinol (Lausanne). (2024) 15:1444663. doi: 10.3389/fendo.2024.1444663,
21.
Yan F Chen X Quan X Wang L Wei X Zhu J . Association between the stress hyperglycemia ratio and 28-day all-cause mortality in critically ill patients with sepsis: a retrospective cohort study and predictive model establishment based on machine learning. Cardiovasc Diabetol. (2024) 23:163. doi: 10.1186/s12933-024-02265-4,
22.
Lin J Chen Y Xu M Chen J Huang Y Chen X et al . Association and predictive ability between significant perioperative cardiovascular adverse events and stress glucose rise in patients undergoing non-cardiac surgery. Cardiovasc Diabetol. (2024) 23:445. doi: 10.1186/s12933-024-02542-2,
23.
Anna A Marita D Lars E Lovisa T Lotti O . Patients with aneurysmal subarachnoid haemorrhage treated in Swedish intensive care: a registry study. Acta Anaesthesiol Scand. (2024) 68:1031–40. doi: 10.1111/aas.14453,
24.
Raval RN Small O Magsino K Chakravarthy V Austin B Applegate R et al . Remote ischemic pre-conditioning in subarachnoid hemorrhage: a prospective pilot trial. Neurocrit Care. (2021) 34:968–73. doi: 10.1007/s12028-020-01122-y,
25.
Eagles ME Jaja BNR Macdonald RL . Incorporating a modified Graeb score to the modified fisher scale for improved risk prediction of delayed cerebral ischemia following aneurysmal subarachnoid hemorrhage. Neurosurgery. (2018) 82:299–305. doi: 10.1093/neuros/nyx165,
26.
Snider SB Migdady I LaRose SL McKeown ME Regenhardt RW Lai PMR et al . Transcranial-Doppler-measured vasospasm severity is associated with delayed cerebral infarction after subarachnoid hemorrhage. Neurocrit Care. (2022) 36:815–21. doi: 10.1007/s12028-021-01382-2,
27.
Gu M Wang J Xiao L Chen X Wang M Huang Q et al . Malnutrition and poststroke depression in patients with ischemic stroke. J Affect Disord. (2023) 334:113–20. doi: 10.1016/j.jad.2023.04.104,
28.
Karlidag T Bingol O Sarikaya B Keskin OH Durgal A Ozdemir G . Prognostic accuracy of blood cell count ratios in predicting adverse outcomes in crush syndrome patients. Sci Rep. (2024) 14:30494. doi: 10.1038/s41598-024-82035-0,
29.
Zhang X Zhang S Wang C Li A . Neutrophil-to-albumin ratio as a novel marker predicting unfavorable outcome in aneurysmal subarachnoid hemorrhage. J Clin Neurosci. (2022) 99:282–8. doi: 10.1016/j.jocn.2022.03.027,
30.
Su X Zhao S Zhang N . Admission NLPR predicts long-term mortality in patients with acute ischemic stroke: a retrospective analysis of the MIMIC-III database. PLoS One. (2023) 18:e0283356. doi: 10.1371/journal.pone.0283356,
31.
Liao M Liu L Bai L Wang R Liu Y Zhang L et al . Correlation between novel inflammatory markers and carotid atherosclerosis: a retrospective case-control study. PLoS One. (2024) 19:e0303869. doi: 10.1371/journal.pone.0303869,
32.
Becker KL Snider R Nylen ES . Procalcitonin assay in systemic inflammation, infection, and sepsis: clinical utility and limitations. Crit Care Med. (2008) 36:941–52. doi: 10.1097/CCM.0B013E318165BABB,
33.
Muroi C Hugelshofer M Seule M Tastan I Fujioka M Mishima K et al . Correlation among systemic inflammatory parameter, occurrence of delayed neurological deficits, and outcome after aneurysmal subarachnoid hemorrhage. Neurosurgery. (2013) 72:367–75. doi: 10.1227/NEU.0b013e31828048ce
34.
Shi G Li M Zhou R Wang X Xu W Yang F et al . Procalcitonin related to stroke-associated pneumonia and clinical outcomes of acute ischemic stroke after IV rt-PA treatment. Cell Mol Neurobiol. (2022) 42:1419–27. doi: 10.1007/s10571-020-01031-w,
35.
Montellano FA Ungethüm K Ramiro L Nacu A Hellwig S Fluri F et al . Role of blood-based biomarkers in ischemic stroke prognosis: a systematic review. Stroke. (2021) 52:543–51. doi: 10.1161/STROKEAHA.120.029232,
Summary
Keywords
machine learning, risk stratification, delayed cerebral ischemia (DCI), peripheral inflammatory biomarkers, aneurysmal subarachnoid hemorrhage (aSAH)
Citation
Liu Y, Li C and Wang H (2025) Machine learning–driven risk prediction of delayed cerebral ischemia after aneurysmal subarachnoid hemorrhage using peripheral inflammatory markers. Front. Neurol. 16:1713341. doi: 10.3389/fneur.2025.1713341
Received
30 September 2025
Revised
16 November 2025
Accepted
28 November 2025
Published
11 December 2025
Volume
16 - 2025
Edited by
Tijana Nastasovic, University of Belgrade, Serbia
Reviewed by
Sanja Maricic Prijic, University of Novi Sad, Serbia
Lei Lang, Chongqing Jingjin District Hospital of Traditional Medicine, China
Updates
Copyright
© 2025 Liu, Li and Wang.
This is an open-access article distributed under the terms of the Creative Commons Attribution License (CC BY). The use, distribution or reproduction in other forums is permitted, provided the original author(s) and the copyright owner(s) are credited and that the original publication in this journal is cited, in accordance with accepted academic practice. No use, distribution or reproduction is permitted which does not comply with these terms.
*Correspondence: Honglin Wang, wanghonglin666888@163.com
Disclaimer
All claims expressed in this article are solely those of the authors and do not necessarily represent those of their affiliated organizations, or those of the publisher, the editors and the reviewers. Any product that may be evaluated in this article or claim that may be made by its manufacturer is not guaranteed or endorsed by the publisher.