 Masato Kato
 Masashi Watanabe
 Shun Hirooka
 Romain Vauchy
- 1Nuclear Plant Innovation Promotion Office, Japan Atomic Energy Agency, Ibaraki, Japan
- 2Fuel Cycle Design Office, Japan Atomic Energy Agency, Ibaraki, Japan
- 3Plutonium Fuel Development Center, Japan Atomic Energy Agency, Ibaraki, Japan
This study evaluates the self-diffusion and chemical diffusion coefficients of oxygen in the fluorite-type oxides CeO2, ThO2, UO2, PuO2, and (U, Pu)O2 using point defect chemistry (oxygen vacancies and interstitials). The self-diffusion coefficient changed in proportion to the 1/n power of oxygen partial pressure, similar to the defect concentration. All parameters used to represent the diffusion coefficients were determined, and the experimental data were accurately stated. The defect formation and migration energies of the oxides were compared, and the change in Frenkel defect concentration was found to affect the high-temperature heat capacities of CeO2 and ThO2. The oxygen chemical diffusion was evaluated in the oxides, excluding the line compound ThO2, and the coefficients increased dramatically around the stoichiometric composition, i.e., the chemical diffusion coefficient was much higher at stoichiometric composition, with the oxygen-to-metal ratio equal to 2.00, than in low oxygen-to-metal oxides. This difference altered the mechanism of the reduction and oxidation processes. In the reduction process, the chemical diffusion control rate was dominant and a new phase with the oxygen-to-metal ratio equal to 2.00 was formed, which then expanded from the surface in the oxidation process from a low oxygen-to-metal ratio to the stoichiometric composition.
1 Introduction
Understanding diffusion phenomena in nuclear oxide fuels is important for its research and development for two reasons. The first is to understand and describe various behavior at high temperatures, such as phase transformation, precipitation, oxidation, reduction, creep, sintering, solid–gas reaction, grain growth, thermal recovery of irradiation defects, and formation of fission product gas bubbles (Suzuki et al., 2007; Lösönen, 2017; Forsberg et al., 2020; Watanabe and Seki, 2021). The second is to understand the behavior of oxygen vacancy and interstitial point defects (Kato et al., 2017a; Kato et al., 2017b; Cooper et al., 2018; Watanabe et al., 2021). It is important to understand the mechanism of basic properties at high temperatures because the concentration of point defects is strongly related to various properties, such as oxygen potential, thermal conductivity, heat capacity, and electrical conductivity. The defect concentration of vacancy and interstitial atoms in oxygen sites is much greater than that of cation sites because fluorite-type oxides are nonstoichiometric oxygen compounds (Cooper et al., 2018). Therefore, understanding the chemical and thermal properties of the materials requires knowledge of oxygen diffusion behavior.
Oxygen self-diffusion and chemical diffusion coefficients were measured and explained using defect concentration and migration mechanisms (Kröger and Vink, 1956; Matzke, 1987; Stan and Cristea, 2005; Kato et al., 2017a; Kato et al., 2017b; Watanabe et al., 2021; Kato, 2022). Defect concentration is related to the oxygen potential, heat capacity, thermal conductivity, and electric conduction mechanisms (Kofstad, 1972; Kato, 2022). This study used defect concentration to determine the diffusion coefficients of CeO2, ThO2, UO2, PuO2, and (U, Pu)O2 with fluorite-type crystal structures. The oxygen potential and diffusion coefficients of the materials, excluding ThO2, were measured, along with their defect equilibria using the gas equilibrium method. The diffusion coefficient and defect concentration relationship were compared and evaluated based on defect chemistry. These results improve the understanding of the relationships between diffusion coefficient, properties, and redox behavior.
The aim of this study was to review oxygen diffusion coefficients in fluorite-type oxides and determine the relationships between the oxygen-to-metal (O/M) ratio, oxygen self-diffusion coefficients, and chemical diffusion coefficients using defect chemistry. This work contributes to a better understanding of the oxygen behavior in fuel technology and the mechanisms of high-temperature thermophysical properties.
2 Measurement techniques
Previous studies have measured oxygen self-diffusion and chemical diffusion coefficients (Watanabe et al., 2017; Vauchy et al., 2015; Sari, 1978; Murch and Catlow, 1987; Lorenzelli and El Sayed Ali, 1977; Kato et al., 2013; Kato et al., 2009; Garcia et al., 2010; Deaton and Wiedenheft, 1973; D'Annucci and Sari, 1977; Contamin et al., 1972; Breitung, 1978; Belle, 1969; Bayoglu and Lorenzelli, 1984; Bayoglu and Lorenzelli, 1979; Auskern and Belle, 1961; Ando et al., 1976; Watanabe and Kato, 2012; Kim and Olander, 1981; Floyd, 1973; Kamiya et al., 2000; Millot and Mierry, 1985; Gotte et al., 2007). The oxygen diffusion coefficients data set used in this review is shown in Table A1. The data were measured using various methods, such as the isotope method, thermogravimetry, electrical conductivity measurement, and thermal dilatometry. It was difficult to assess changes dependent on temperature and O/M ratio because the data were scattered (Floyd, 1973; Gotte et al., 2007; Kamiya et al., 2000; Millot and Mierry, 1985; Ando et al., 1976; Watanabe and Kato; Dornelas and Lacombe, 1967; Matzke, 1987; Ligeon et al., 1970; Dorado et al., 2011; Lay, 1970; Bittel et al., 1969; Ruello et al., 2004; Kato et al., 2013; Mullins, 1972; Deaton and Wiedenheft, 1973; Bayoglu et al., 1983; Bayoglu and Lorenzelli, 1979; Chereau and Wadier, 1973; Bayoglu and Lorenzelli, 1980; Bayoglu and Lorenzelli, 1984; D'Annucci and Sari, 1977; Kato et al., 2009; Watanabe et al., 2017; Watanabe et al., 2020; Vauchy et al., 2015).
Self-diffusion is the phenomenon in which oxygen ions move through oxygen vacancies and interstitial sites, i.e., without chemical gradient. The self-diffusion coefficient was measured using a gas containing an isotope of 18O. Isotope analyzers, such as the secondary ion micro spectrometer, have been used to determine the diffusion coefficient (Vauchy et al., 2015). Recently, Watanabe et al. (2020) used the weight difference between 16O and 18O to measure the oxygen self-diffusion coefficient of (U, Pu)O2 by thermogravimetry. On the other hand, chemical diffusion is driven by the oxygen content change in nonstoichiometric composition. In measurement of the chemical diffusion coefficient, oxygen partial pressure in the measurement atmosphere is altered, and the rate of sample weight change is measured to determine the value. Therefore, oxygen potential data are required to control the oxygen partial pressure in this measurement. Also, in several studies, the oxygen potential of UO2, (U, Pu)O2, PuO2, and CeO2 were determined using the gas equilibrium method (H2O/H2 gas reaction), and defect equilibria were evaluated using a constructed Brouwer diagram (Brouwer, 1954; Kröger and Vink, 1956; Watanabe and Kato, 2012; Kato et al., 2017a; Kato et al., 2017b; Watanabe et al., 2021; Kato, 2022). These techniques were used to measure the self-diffusion and chemical diffusion coefficients. When change in sample weight during the measurement is observed from only the change in type O/M ratio, the diffusion coefficients can be determined from curves of the weight change using Eqs 1–3, which represent O/M changes in the sphere, cylinder, and plate-like samples, respectively (Jost, 1933).
where
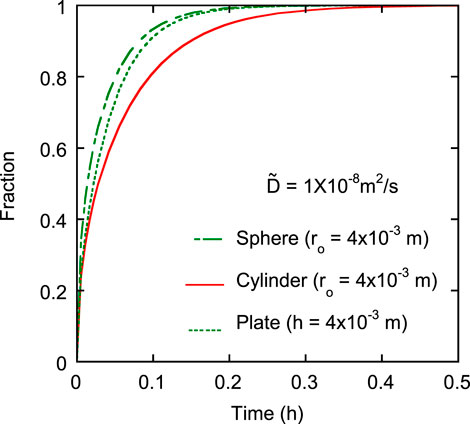
FIGURE 1. Changing fractions of the sphere-, cylinder-, and plate-like samples when diffusion coefficient and diffusion distance are 1 × 10⁻⁸ m2/s and 4 × 10⁻³ m, respectively. The three lines represent Eqs 1–3.
Previous studies have measured the chemical diffusion coefficient using O/M change curves of plate and cylinder-like samples (Kato et al., 2009; Kato et al., 2013). Oxidation and reduction curves were obtained between a low O/M ratio and O/M = 2.00, respectively. The reduction curve can be represented by Eqs 2, 3, but the oxidation curve cannot. It was assumed that the oxidation process was governed by a mechanism other than chemical diffusion, which will be discussed further.
The self-diffusion and chemical diffusion coefficients,
where
3 Evaluation of diffusion coefficients
3.1 Point defect concentrations
As shown in Eqs 4, 5, defect concentrations are needed to represent the diffusion coefficients. Here, point defect concentration in each oxide was reviewed. In previous studies, the oxygen potentials of CeO2, UO2, PuO2, and (U, Pu)O2 were measured, and defect equilibria were evaluated (Komeno et al., 2012; Watanabe and Kato, 2012; Kato et al., 2017a; Kato et al., 2017b; Suzuki et al., 2018; Watanabe et al., 2021; Kato, 2022). The Brouwer diagram was used to derive the equations to represent
(1) CeO2
(2) ThO2
(3) UO2
(4) PuO2
(5) (U, Pu)O2
where
Figure 2 shows the results obtained from the calculation of
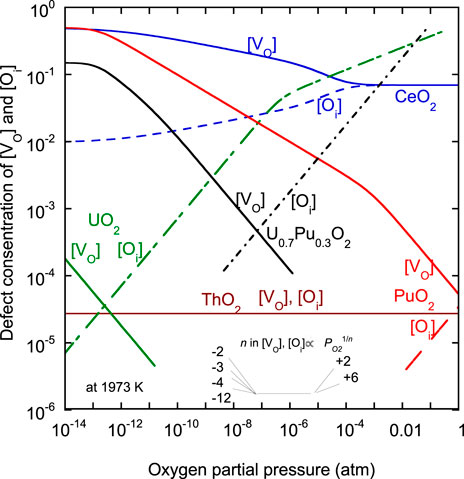
FIGURE 2. Point defect concentrations
By substituting, Eqs 4–15 can be used to evaluate
The parameters
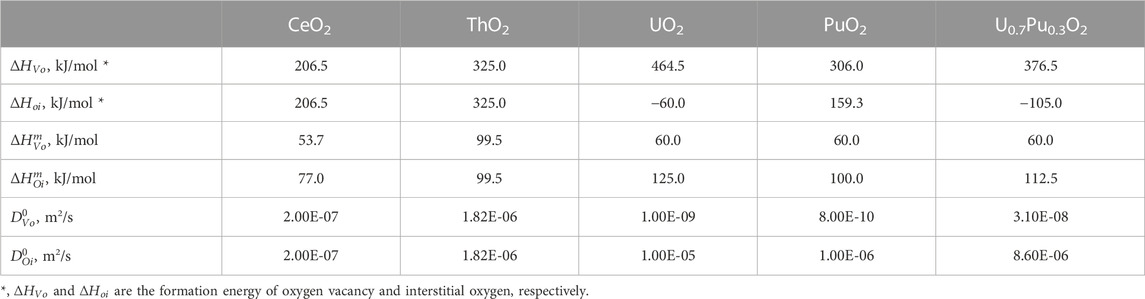
TABLE 1. List of parameters for Eq. 4.
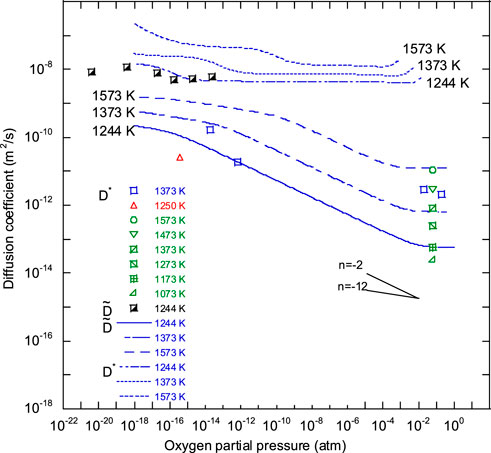
FIGURE 3.
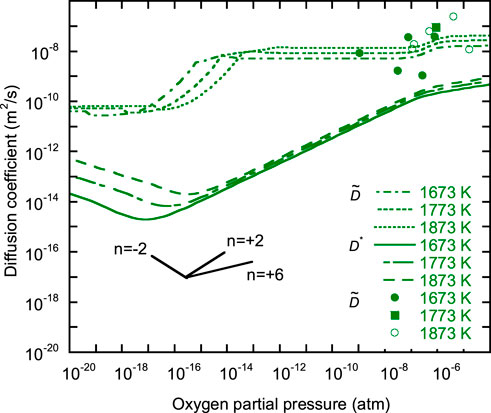
FIGURE 4.
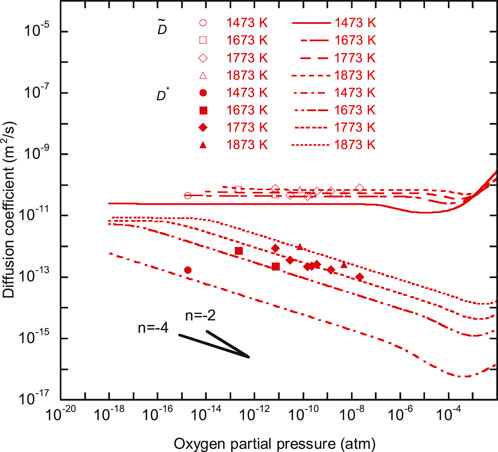
FIGURE 5.
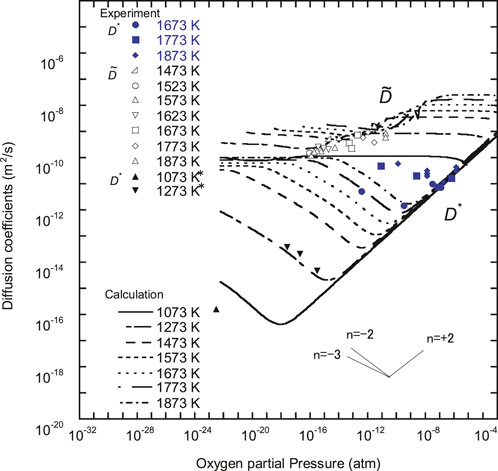
FIGURE 6.
3.2 Self-diffusion coefficients
Figure 7 shows O/M dependence of the oxygen self-diffusion coefficient (
where Q and
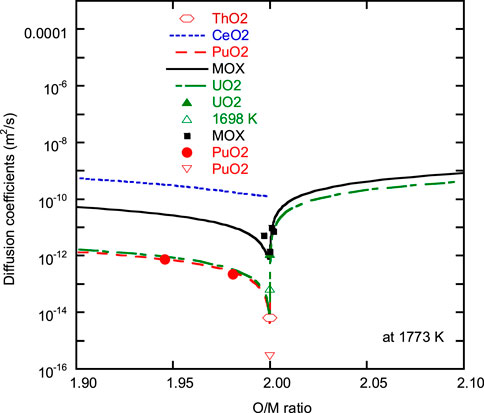
FIGURE 7. Comparison of O/M ratio dependence of
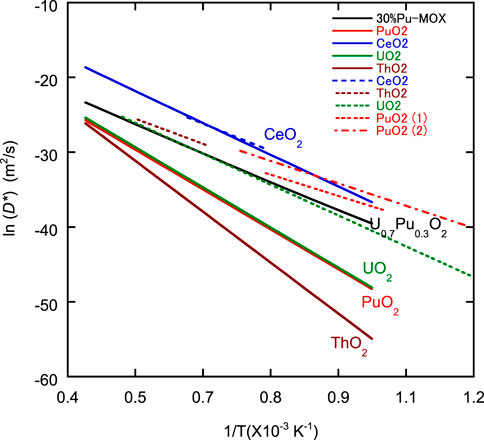
FIGURE 8. Plot of ln D* of oxygen in CeO2, ThO2, UO2, PuO2, and U0.7Pu0.3O2 against 1/T. Data used to generate the solid lines were calculated using Eq. 4. The broken lines representing CeO2, ThO2, UO2, PuO2 (1), and PuO2 (2) were reported by Kamiya et al. (2000), Ando et al. (1976), Breitung (1978), Deaton and Wiedenheft (1973), and Bayoglu et al. (1983), respectively.
Table 1 shows all the parameters required for the evaluation of
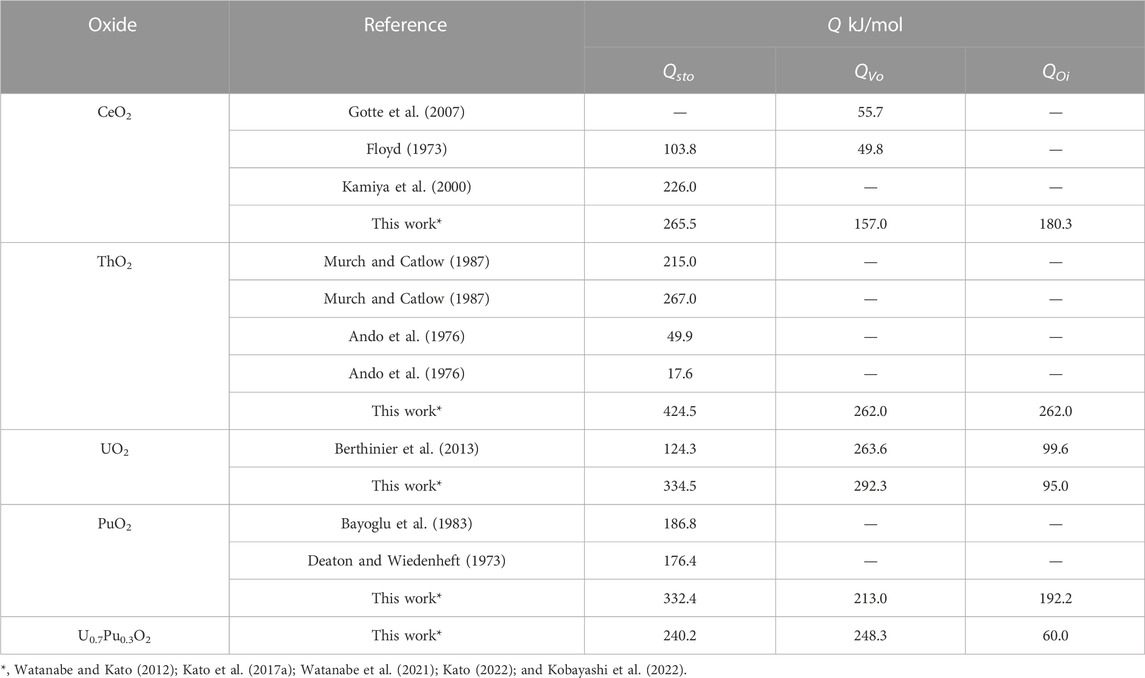
TABLE 2. Comparison of activation energy for diffusion.
The QVo and QOi of U0.7Pu0.3O2 were expected to have properties related to the QVo of PuO2 and the QOi of UO2. Recently, diffusion mechanisms, such as ion migration route, have been studied using computational simulation. State-of-the-art simulation methods have added useful information to the discussion of oxygen diffusion mechanisms. However, many challenges remain in application of the methods to the analysis of high temperature diffusion in actinide oxides (Machida, 2022).
In general, the heat capacity of oxides with fluorite structures increases rapidly at high temperatures. This study attempted to evaluate the degree to which Frenkel defect formation contributed to the increase in heat capacity (Konings and Beneš, 2013; Konings et al., 2014; Kato, 2022). Eq. 19 represents the equilibrium constant of Frenkel defect formation
where
The contribution of Frenkel defect formation,
Figure 9 shows the relationship between
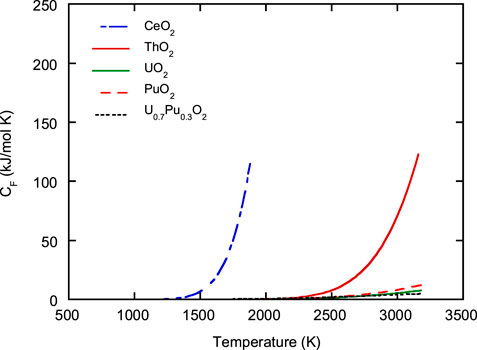
FIGURE 9. Contribution of Frenkel defect formation
3.3 Chemical diffusion coefficients
Figure 10 shows the O/M dependence of chemical diffusion coefficients (
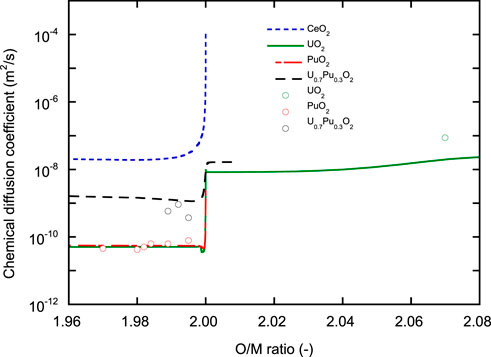
FIGURE 10. O/M ratio dependence of
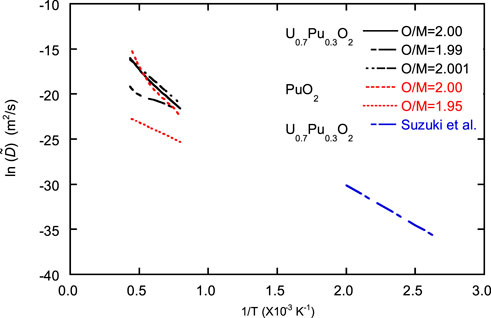
FIGURE 11. Inverse T dependence of ln
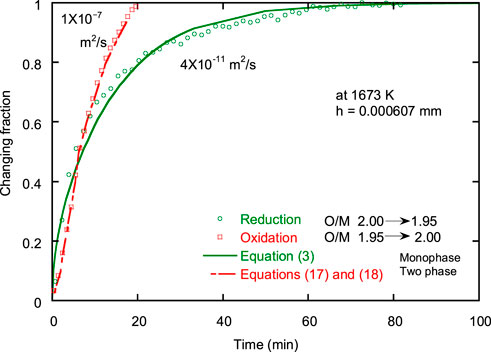
FIGURE 12. Reduction and oxidation curves between PuO2 and PuO1.95 at 1673 K. The data were obtained in a previous study by Kato et al. (2013) using the same sample.

FIGURE 13. O/M ratio gradients in the (A) reduction process and (B) oxidation process when
Eqs 26, 27 were used to analyze the oxidation process, and it was discovered that
The nuclear fuel O/M ratio is an important parameter influencing fuel performance, and its value is controlled as one of the fuel specifications. In the pellet production process, the O/M ratio is adjusted, and the rate of change of the O/M ratio can be evaluated using the chemical diffusion coefficient. To remove additives from the pressed pellets, they were pre-sintered at about 1073 K. In this process, the pellets were adjusted to O/M = 2.00, and the final adjustment to the O/M ratio occurred via the chemical diffusion-controlling reduction in the sintering process. Assuming the pellet is an infinite cylinder, the change in the O/M ratio as a function of temperature, time, and P O 2 can be represented by Eq. 2. However, due to the difficulty in maintaining P O 2 in the atmosphere when many pellets are treated in engineering scale production, a longer sintering time is required in comparison with the evaluation results (Takano et al., 2011).
After sintering, low O/M sintered pellets were exposed to an oxidation atmosphere. In previous studies (Woodley and Gibby, 1973; Suzuki et al., 2007), it was discovered that low O/M pellets were oxidized at temperatures lower than 400 K. Suzuki et al. (2007) investigated low-temperature oxidation by diffusion in a two-phase system and estimated
4 Summary
This study describes oxygen self-diffusion coefficients using the defect concentration
The evaluation of chemical diffusion coefficients revealed that the mechanism of reduction in the reaction between O/M = 2.00 and hypo-stoichiometric composition differs from that of oxidation. It is proposed that the reduction process is dominated by a monophase chemical diffusion-controlling model, whereas the oxidation process occurs in a two-phase system wherein a new phase with O/M = 2.00 is formed at the surface and expands into the interior. These mechanisms are important for understanding the various behaviors of nuclear oxides during the production process.
Data availability statement
The raw data supporting the conclusion of this article will be made available by the authors, without undue reservation.
Author contributions
MK made substantial contributions to the study concept or the data analysis or interpretation; MW, SH and RV drafted the manuscript or revised it critically for important intellectual content and agreed to be accountable for all aspects of the work.
Conflict of interest
The authors declare that the research was conducted in the absence of any commercial or financial relationships that could be construed as a potential conflict of interest.
Publisher’s note
All claims expressed in this article are solely those of the authors and do not necessarily represent those of their affiliated organizations, or those of the publisher, the editors, and the reviewers. Any product that may be evaluated in this article, or claim that may be made by its manufacturer, is not guaranteed or endorsed by the publisher.
Supplementary material
The Supplementary Material for this article can be found online at: https://www.frontiersin.org/articles/10.3389/fnuen.2022.1081473/full#supplementary-material
References
Andersson, D., Watanabe, T., Deo, C., and Uberuaga, B. (2009). Role of di-interstitial clusters in oxygen transport in UO2+x from first principles. Phys. Rev. B 80, 060101. doi:10.1103/physrevb.80.060101
Ando, K., Oishi, Y., and Hidaka, Y. (1976). Self-diffusion of oxygen in single crystal thorium oxide. J. Chem. Phys. 65, 2751–2755. doi:10.1063/1.433419
Auskern, A. B., and Belle, J. (1961). Oxygen ion self-diffusion in uranium dioxide. J. Nucl. Mater. 3, 267–276. doi:10.1016/0022-3115(61)90194-5
Bayoglu, A., and Lorenzelli, R. (1980). Chemical diffusion of oxygen in (U, Pu) O2+x. J. Nucl. Mater. 88, 315–316. doi:10.1016/0022-3115(80)90289-5
Bayoglu, A. S., Giordano, A., and Lorenzelli, R. (1983). Mesure de l'autodiffusion de l'oxygene dans PuO2.00 par echange isotopique. J. Nucl. Mater. 113, 71–74. doi:10.1016/0022-3115(83)90168-x
Bayoglu, A. S., and Lorenzelli, R. (1979). Etude de la diffusion chimique de l'oxygene dans PuO2−x par dilatometrie et thermogravimetrie. J. Nucl. Mater. 82, 403–410. doi:10.1016/0022-3115(79)90022-9
Bayoglu, A. S., and Lorenzelli, R. (1984). Oxygen diffusion in fcc fluorite type nonstoichiometric nuclear oxides MO2±x. Solid State Ionics 12, 53–66. doi:10.1016/0167-2738(84)90130-9
Belle, J. (1969). Oxygen and uranium diffusion in uranium dioxide (a review). J. Nucl. Mater. 30, 3–15. doi:10.1016/0022-3115(69)90163-9
Berthinier, C., Rado, C., Chatillon, C., and Hodaj, F. (2013). Thermodynamic assessment of oxygen diffusion in non-stoichiometric UO2±x from experimental data and Frenkel pair modeling. J. Nucl. Mater. 433, 265–286. doi:10.1016/j.jnucmat.2012.09.011
Bittel, J., Sjodahl, L., and White, J. (1969). Steam oxidation kinetics and oxygen diffusion in UOz at high temperatures. J. Am. Ceram. Soc. 52, 446–451. doi:10.1111/j.1151-2916.1969.tb11976.x
Breitung, W. (1978). Oxygen self and chemical diffusion coefficients in UO2±x. J. Nucl. Mater. 74, 10–18. doi:10.1016/0022-3115(78)90527-5
Brouwer, G. (1954). A general asymptotic solution of reaction equations common in solid-state chemistry. Philips Res. Rep. 9, 366–376.
Chereau, P., and Wadier, J. F. (1973). Mesures de resistivite et de cinetique d'oxydation dans PuO2−x. J. Nucl. Mater. 46, 1–8. doi:10.1016/0022-3115(73)90116-5
Contamin, P., Bacmann, J. J., and Marin, J. F. (1972). Autodiffusion de l'oxygene dans le dioxyde d'uranium surstoechiometrique. J. Nucl. Mater. 42, 54–64. doi:10.1016/0022-3115(72)90007-4
Cooper, M. W. D., Murphy, S. T., and Andersson, D. A. (2018). The defect chemistry of UO2±x from atomistic simulations. J. Nucl. Mater. 504, 251–260. doi:10.1016/j.jnucmat.2018.02.034
D'Annucci, F., and Sari, C. (1977). Oxygen diffusion in uranium-plutonium oxide fuels at low temperatures. J. Nucl. Mater. 68, 357–359. doi:10.1016/0022-3115(77)90265-3
Deaton, R. L., and Wiedenheft, C. J. (1973). Self-diffusion of oxygen in 238PuO. Miamisburg, OH: Monsanto Research Corp.
Dorado, B., Garcia, P., Carlot, G., Davoisne, C., Fraczkiewicz, M., Pasquet, B., et al. (2011). First-principles calculation and experimental study of oxygen diffusion in uranium dioxide. Phys. Rev. B 83, 035126. doi:10.1103/physrevb.83.035126
Dornelas, W., and Lacombe, P. (1967). Application of diffusion in an electric field between 900 and 1100°C to the determination of the coefficient of diffusion of oxygen in the uranium oxide UO. C. R. Acad. Sci. Paris 265, C359.
Floyd, J. M. (1973). Interpretation of transport phenomena in non-stoichiometric ceria. Indian J. Technol. 11, 589–594.
Forsberg, K., Jernkvist, L. O., and Massih, A. R. (2020). Modeling oxygen redistribution in UO2+x fuel pellet. J. Nucl. Mater. 528, 151829. doi:10.1016/j.jnucmat.2019.151829
Fujino, T., Yamashita, T., Ohuchi, K., Naito, K., and Tsuji, T. (1993). High temperature electrical conductivity and conduction mechanism of (U, Pu)O2±x at low oxygen partial pressures. J. Nucl. Mater. 202, 154–162. doi:10.1016/0022-3115(93)90038-z
Garcia, P. H., Fraczkiewicz, M., Davoisne, C., Carlot, G., Pasquet, B., Baldinozzi, G., et al. (2010). Oxygen diffusion in relation to p-type doping in uranium dioxide. J. Nucl. Mater. 400, 112–118. doi:10.1016/j.jnucmat.2010.02.019
Gotte, A., SpåNGBERG, D., Hermansson, K., and Baudin, M. (2007). Molecular dynamics study of oxygen self-diffusion in reduced CeO2. Solid State Ionics 178, 1421–1427. doi:10.1016/j.ssi.2007.08.003
Hadari, Z., Kroupp, M., and Wolfson, Y. (1971). Self-diffusion measurement of oxygen in UO2 by the nuclear reaction 18O(p, γ)19F. J. Appl. Phys. 42, 534–535. doi:10.1063/1.1660058
Hein, R. A., Flagella, P. N., and Conway, J. B. (1968). High-temperature enthalpy and heat of fusion of UO2. J. Am. Ceram. Soc. 51, 291–292. doi:10.1111/j.1151-2916.1968.tb13863.x
Jost, W. (1933). Diffusion and electrolytic conduction in crystals (ionic semiconductors). J. Chem. Phys. 1, 466–475. doi:10.1063/1.1749319
Kamiya, M., Shimada, E., Ikuma, Y., Komatsu, M., and Haneda, H. (2000). Intrinsic and extrinsic oxygen diffusion and surface exchange reaction in cerium oxide. J. Electrochem. Soc. 147, 1222. doi:10.1149/1.1393340
Kato, M., Morimoto, K., Tamura, T., Sunaoshi, T., Konashi, K., Aono, S., et al. (2009). Oxygen chemical diffusion in hypo-stoichiometric MOX. J. Nucl. Mater. 389, 416–419. doi:10.1016/j.jnucmat.2009.02.018
Kato, M., Nakamura, H., Watanabe, M., Matsumoto, T., and Machida, M. (2017a). Defect chemistry and basic properties of non-stoichiometric PuO2. Defect Diffusion Forum 375, 57–70. doi:10.4028/www.scientific.net/ddf.375.57
Kato, M. (2022). “Properties,” in Materials science and fuel technologies of uranium and plutonium mixed oxide. Editors M. KATO,, and M. MACHIDA (Boca Raton, FL: CRC Press).
Kato, M., Uchida, T., and Sunaoshi, T. (2013). Measurement of oxygen chemical diffusion in PuO2-xand analysis of oxygen diffusion in PuO2-x and (Pu, U)O2-x. Phys. status solidi C. 10, 189–192. doi:10.1002/pssc.201200454
Kato, M., Watanabe, M., Matsumoto, T., Hirooka, S., and Akashi, M. (2017b). Oxygen potentials, oxygen diffusion coefficients and defect equilibria of nonstoichiometric (U, Pu)O2±x. J. Nucl. Mater. 487, 424–432. doi:10.1016/j.jnucmat.2017.01.056
Kim, K. C., and Olander, D. R. (1981). Oxygen diffusion in UO2−x. J. Nucl. Mater. 102, 192–199. doi:10.1016/0022-3115(81)90559-6
Kobayashi, K., Okumura, M., Nakamura, H., Itakura, M., Machida, M., and Cooper, M. W. D. (2022). Machine learning molecular dynamics simulations toward exploration of high-temperature properties of nuclear fuel materials: Case study of thorium dioxide. Sci. Rep. 12, 9808. doi:10.1038/s41598-022-13869-9
Kofstad, P. (1972). Nonstoichiometry, diffusion, and electrical conductivity in binary metal oxides. Hoboken, New Jersey: Wiley-Interscience.
Komeno, A., Kato, M., Hirooka, S., and Sunaoshi, T. (2012). Oxygen potentials of PuO2-x. MRS Proc. 1444, 1162. doi:10.1557/opl.2012.1162
Konings, R. J. M., Beneš, O., KováCS, A., Manara, D., Sedmidubske, D., Gorokhov, L., et al. (2014). The thermodynamic properties of thef-elements and their compounds. Part 2. The lanthanide and actinide oxides. J. Phys. Chem. Reference Data 43, 013101. doi:10.1063/1.4825256
Konings, R. J. M., and Beneš, O. (2013). The heat capacity of NpO2 at high temperatures: The effect of oxygen Frenkel pair formation. J. Phys. Chem. Solids 74, 653–655. doi:10.1016/j.jpcs.2012.12.018
Lay, K. (1970). Oxygen chemical diffusion coefficient of uranium dioxide. J. Am. Ceram. Soc. 53, 369–373. doi:10.1111/j.1151-2916.1970.tb12134.x
Ligeon, E., Bontemps, A., and Contamin, P. (1970). Application de la réaction 18O(p, alpha) 15N à l’étude de l’autodiffusion de l’oxygène dans le dioxyde d’uranium’. Grenoble (France): Commissariat à l’Energie Atomique.
Lorenzelli, R., and El Sayed Ali, M. (1977). Dilatation thermique d'oxydes mixtes (UPu)O2−x en fonction de l'ecart a la stoechiometrie. J. Nucl. Mater. 68, 100–103. doi:10.1016/0022-3115(77)90221-5
LöSöNEN, P. (2017). On the effect of irradiation-induced resolution in modelling fission gas release in UO2 LWR fuel. J. Nucl. Mater. 496, 140–156. doi:10.1016/j.jnucmat.2017.09.015
Machida, M. (2022). “Theoretical and computatinal works on oxide nuclear fuel materials,” in Materials science and fuel technologies of uranium and plutonium mixed oxide. Editors M. KATO,, and M. MACHIDA (Boca Raton, FL: CRC Press).
Matzke, H. (1987). Atomic transport properties in UO2 and mixed oxides (U, Pu)O2. J. Chem. Soc. Faraday Trans. 2 Mol. Chem. Phys. 83, 1121–1142. doi:10.1039/f29878301121
Millot, F., and Mierry, P. D. (1985). A new method for the study of chemical diffusion in oxides with application to cerium oxide CeO2–x. J. Phys. Chem. Solids 46, 797–801. doi:10.1016/0022-3697(85)90003-4
Mullins, L. (1972). Preparation and evaluation of medical-grade $ sup 238$ Pu fuels. N. Mex: Los Alamos Scientific Lab.
Murch, G. E., and Catlow, C. R. A. (1987). Oxygen diffusion in UO2, ThO2 and PuO2. A review. J. Chem. Soc. Faraday Trans. 2, 83.
Ruello, P., Chirlesan, G., Petot-Ervas, G., Petot, C., and Desgranges, L. (2004). Chemical diffusion in uranium dioxide–influence of defect interactions. J. Nucl. Mater. 325, 202–209. doi:10.1016/j.jnucmat.2003.12.007
Sari, C. (1978). Oxygen chemical diffusion coefficient of uranium-plutonium oxides. J. Nucl. Mater. 78, 425–426. doi:10.1016/0022-3115(78)90465-8
Stan, M., and Cristea, P. (2005). Defects and oxygen diffusion in PuO2−x. J. Nucl. Mater. 344, 213–218. doi:10.1016/j.jnucmat.2005.04.044
Suzuki, K., Kato, M., Sunaoshi, T., Uno, H., Carvajal-Nunez, U., Nelson, A. T., et al. (2018). Thermal and mechanical properties of CeO2. J. Am. Ceram. Soc. 102, 1994. doi:10.1111/jace.16055
Suzuki, K., Kato, M., Tamura, T., Aono, S., and Kashimura, M. (2007). The oxidation rate of (U0.7Pu0.3)O2−x with two fcc phases. J. Alloys Compd. 444-445, 590–593. doi:10.1016/j.jallcom.2007.02.062
Takano, T., Sudo, K., Takeuchi, K., Kihara, Y., and Kato, M. 2011. “Development of oxygen-to-metal ratio of MOX pellet adjustment technology for the simplified MOX pellet fabrication method in the FaCT project,” in Proceedings of GLOBAL 2011, Makuhari, Japan, December 11-16, 2011.
Vauchy, R., Robisson, A. C., Bienvenu, P., Roure, I., Hodaj, F., and Garcia, P. (2015). Oxygen self-diffusion in polycrystalline uranium–plutonium mixed oxide U0.55Pu0.45O2. J. Nucl. Mater. 467, 886–893. doi:10.1016/j.jnucmat.2015.11.003
Watanabe, M., and Kato, M. (2012). Oxygen potential and defect equilibria in UO2±x. Accepted in Frontiers in Nuclear Engineering Nuclear Materials.
Watanabe, M., Kato, M., and Sunaoshi, T. (2020). Oxygen self-diffusion in near stoichiometric (U, Pu)O2 at high temperatures of 1673-1873 K. J. Nucl. Mater. 542, 152472. doi:10.1016/j.jnucmat.2020.152472
Watanabe, M., Nakamura, H., Suzuki, K., Machida, M., and Kato, M. (2021). Defect equilibria and thermophysical properties of CeO2-x based on experimental data and density functional theory calculation result. J. Am. Ceram. Soc. 105, 2248–2257. doi:10.1111/jace.18249
Watanabe, M., and Seki, T. (2021). Initial sintering kinetics of non-stoichiometric CeO2−x. Mater. Sci. Eng. B 272, 115369. doi:10.1016/j.mseb.2021.115369
Watanabe, M., Sunaoshi, T., and Kato, M. (2017). Oxygen chemical diffusion coefficients of (U, Pu)O2-x. Defect Diffusion Forum 375, 84–90. doi:10.4028/www.scientific.net/ddf.375.84
Woodley, R. E., and Gibby, R. L. (1973). Room-temperature oxidation of (U,Pu)O2–x. Richland, WA: Westinghouse Hanford Company Report.
Zamzamian, S. M., Zolfaghari, A., and Kowsar, Z. (2022). Molecular dynamics investigation of xenon, uranium, and oxygen diffusion in UO2 nuclear fuel. Comput. Mater. Sci. 211, 111553. doi:10.1016/j.commatsci.2022.111553
Keywords: oxygen diffusion, self-diffusion, chemical diffusion, point defect, oxygen vacancy, interstitial oxygen, fluorite-type structure, Frenkel defect
Citation: Kato M, Watanabe M, Hirooka S and Vauchy R (2023) Oxygen diffusion in the fluorite-type oxides CeO2, ThO2, UO2, PuO2, and (U, Pu)O2. Front. Nucl. Eng. 1:1081473. doi: 10.3389/fnuen.2022.1081473
Received: 27 October 2022; Accepted: 16 December 2022;
Published: 27 January 2023.
Edited by:
Lelio Luzzi, Politecnico di Milano, ItalyReviewed by:
Jianwei Wang, Louisiana State University, United StatesAnna Romanchuk, Lomonosov Moscow State University, Russia
Copyright © 2023 Kato, Watanabe, Hirooka and Vauchy. This is an open-access article distributed under the terms of the Creative Commons Attribution License (CC BY). The use, distribution or reproduction in other forums is permitted, provided the original author(s) and the copyright owner(s) are credited and that the original publication in this journal is cited, in accordance with accepted academic practice. No use, distribution or reproduction is permitted which does not comply with these terms.
*Correspondence: Masato Kato, a2F0by5tYXNhdG9AamFlYS5nby5qcA==