 Masashi Watanabe
 Masato Kato
- Fuel Cycle Design Office, Japan Atomic Energy Agency, Oarai-machi, Japan
Since the oxygen potential and the oxygen diffusion coefficient of UO2 have a significant impact on fuel performance, many experimental data have been obtained. However, experimental data of the oxygen potential and the oxygen diffusion coefficient in the high temperature region above 1673 K are very limited. In the present study, we aimed to obtain these data and analyze them by defect chemistry. the oxygen potentials and the oxygen chemical diffusion coefficient of UO2 were measured by the gas equilibrium method in the near stoichiometric region at temperatures ranging from 1673 to 1873 K. A data set of oxygen potentials was made together with literature data and analyzed by defect chemistry. The oxygen potential of UO2 was determined as a function of O/U ratio and temperature, and an equation representing the relationship was derived. The oxygen chemical diffusion coefficient values obtained in this study were reasonably close to the literature values. The oxygen partial pressure dependence of the oxygen chemical diffusion coefficients was predicted from the evaluated results of the oxygen potential data, but no clear dependence was observed.
1 Introduction
It is well-known that UO2, which has a fluorite structure, is a non-stoichiometric oxide that is stable in the hyper-stoichiometric composition range. It has also been shown that UO2 can lose oxygen to form a hypo-stoichiometric phase at high temperatures and low oxygen potentials. Many researchers have investigated oxygen potentials to determine the oxygen-to-uranium (O/U) ratio and chemical stability (Aronson and Belle 1958; Markin TL. and Bones RJ. 1962; Aukrust, Forland, and Hagemark 1962; Markin TL. and Bones RJ. 1962; Aitken, Brassfield, and Fryxell 1966; Hagemark and Broli 1966; Markin, Wheeler, and Bones 1968; Tetenbaum and Hunt 1968; Ackermann, Rauh, and Chandrasekharaiah 1969; Wheeler 1971; Javed 1972; Wheeler and Jones 1972; Chilton and Edwards 1980; Ugajin 1983), because its stoichiometry significantly affects thermal properties and fuel performance. Ugajin (1983) investigated the near-stoichiometric region by thermogravimetry in a mixed-gas atmosphere of CO/CO2. Oxygen partial pressure was determined in situ with a stabilized zirconia oxygen sensor. Aronson and Belle (1958) and Markin and Bones (1962) determined the oxygen potential for O/U ratios in the range of 2.01 to 2.53 by the electromotive force (EMF) method. The oxygen potential in UO2−x was also measured at temperatures above 1873 K using H2 and CO gases (Wheeler 1971; Javed 1972), and various methods were employed in the measurements. However, the data were scattered over a range larger than 200 kJ/mol, especially when located in the near-stoichiometric region because of difficulty in determining the O/U ratio and oxygen potential pressure. The relationship between the O/U ratio, the temperature, and the oxygen potential has been represented in previous works. Lindemer and Besmann (1985) derived the relationship from the literature data and the classical thermodynamic theory for a solid solution. Some studies represented the relationship by means of the thermodynamic database (Guéneau et al., 2002; Baichi et al., 2006).
The diffusion kinetics for the oxygen ions in oxide fuels are closely involved in diffusion-controlled phenomena such as oxidation and reduction, sintering, and irradiation behavior. For this reason, the oxygen diffusion coefficients of UO2 have been measured since the 1960s (Auskern and Belle 1961; Belle 1969; Bittel, Sjodahl, and White 1969; Marin and Contamin 1969; Lay 1970; Murch, Bradhurst, and De Bruin 1975; Breitung 1978; Murch and Thorn 1978; Kim and Olander 1981; Bayoglu and Lorenzelli 1984; Ruello et al., 2004). The oxidation and reduction of oxide fuels rely on chemical diffusion in thermodynamically non-ideal systems where oxygen ions are the faster species. The oxygen chemical diffusion coefficient,
In this work, the oxygen potentials of UO2 were obtained in hyper-stoichiometric compositions by the gas equilibrium method, a Brouwer diagram was constructed, and correlations to represent the O/U ratio were derived as functions of temperature and oxygen partial pressure. In addition, the oxygen chemical diffusion coefficients of UO2+x in the temperature range above 1673 K were measured and compared with literature data, and the dependence of oxygen chemical diffusion coefficients on oxygen partial pressure was discussed.
2 Experimental procedures
Samples of UO2 were prepared by powder metallurgy, with UO2 powder made by the ammonium diuranate (ADU) process used as the starting material. The main impurities contained in the raw powder are listed in Table 1. The powder was pressed into a disk-like sample and sintered at 1973 K for 2.5 h in a gas mixture of 4.5% H2–Ar, with added moisture. The amount of moisture was adjusted by passing 4.5% H2–Ar mixed gas through a water bath kept at a constant temperature. The sample weight was 331.91 mg, and the size was 4.253 mm in diameter by 2.275 mm in thickness.
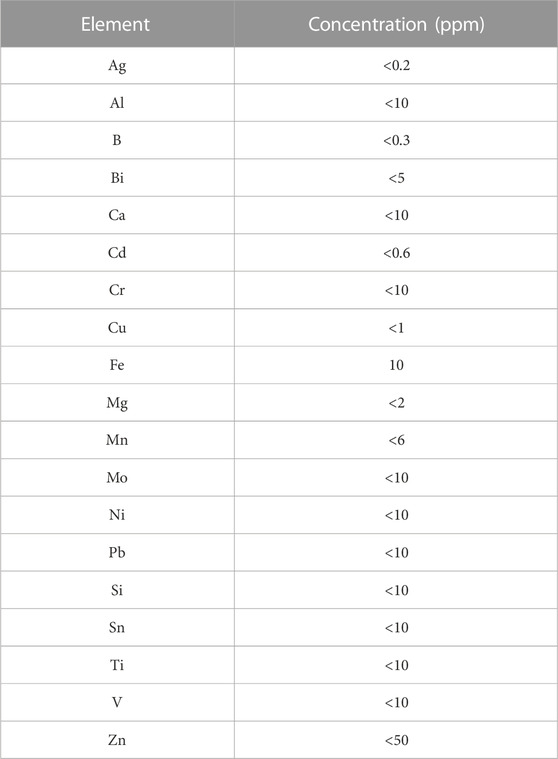
TABLE 1. Impurities in the UO2 raw powder.
The oxygen potential and the oxygen chemical diffusion coefficient measurements were carried out at 1673 K, 1773 K, and 1873 K by the gas equilibrium method using a thermogravimeter (TG-DTA 2000SA, Bruker AXS). The uncertainty of the thermogravimeter was ±0.01 mg, which corresponds to ±0.0005 in the O/U ratio. In the measurements, it was observed that the sample weight was reduced by 60 μg/h. It was concluded that the high vapor pressure of the UO3 species caused the large weight reduction. Due to the small sample volume and short time to reach equilibrium, the measurement of a data point was carried out in less than 30 min; therefore, the uncertainty in the O/U ratio determination was estimated to be ±0.00015.
The oxygen partial pressure in the atmosphere was controlled by the equilibrium reaction of H2O = H2 + 1/2O2 and determined by oxygen sensors that measured the oxygen partial pressure at the equipment inlet and outlet. The gas phase equilibrium was related to the standard Gibbs free energy of formation of water,
where R is the gas constant (8.3145 J/K/mol) and T is absolute temperature. Eq. 1 represents the value from 298 K to 2500 K. The ratio of
The uncertainty of
3 Results
The oxygen potential was measured at temperatures of 1673 K, 1773 K, and 1873 K, and data are shown in Figure 1. The
where n is a characteristic number identifying the type of point defect in agreement with literature data (Aronson and Belle 1958; Wheeler 1971; Javed 1972; Wheeler and Jones 1972). The figure shows that the present data changed in accordance with the relationship of n = +2. The literature data were also plotted in the figure and analyzed using the relationship of Eq. 4. In the higher
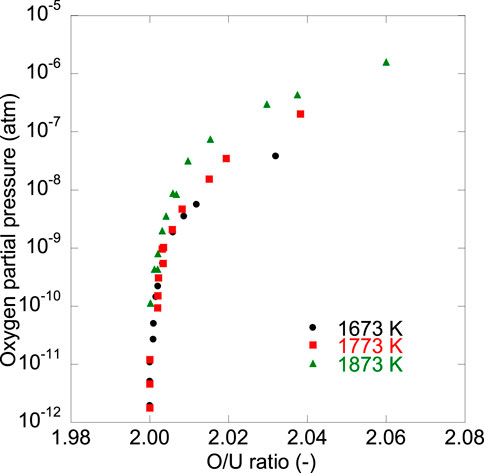
FIGURE 1. Oxygen potential measurement results at 1673 K, 1773 K, and 1873 K.
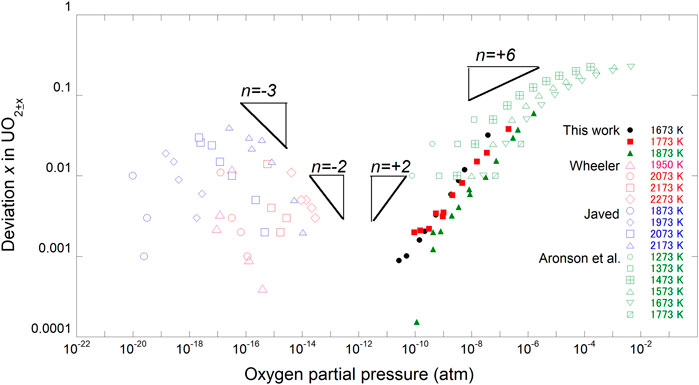
FIGURE 2. Relationships among oxygen partial pressures and deviations, x, in UO2±x.
Since the specimen used in this work had the shape of a planar sheet, the diffusion equation was set up for planar sheet geometry with a thickness of 2L. If the sheet is initially at a uniform concentration, C1, and the surface condition (Crank 1979) is such that
where D is the diffusion coefficient, C is the concentration of diffusing substance in the planar sheet, k is the rate constant for surface reaction, Cs is the actual concentration just within the planar sheet, and C0 is the concentration required to maintain equilibrium with the surrounding atmosphere. The obtained solution is
where the
and
is a dimensionless parameter. The total amount of diffusing substance,
The measured data were fitted by Eq. 9 using D and k as parameters. The experimental conditions and the fitting results are listed in Table 2, and Figure 3 shows the weight-change curve and the fitted curve at 1673 K. Good agreement can be seen between the experimental data and the fitted curve. The error in the oxygen chemical diffusion coefficient was calculated to be 84%. It is presumed that the periodic noise from the thermogravimeter degraded the fitting accuracy.
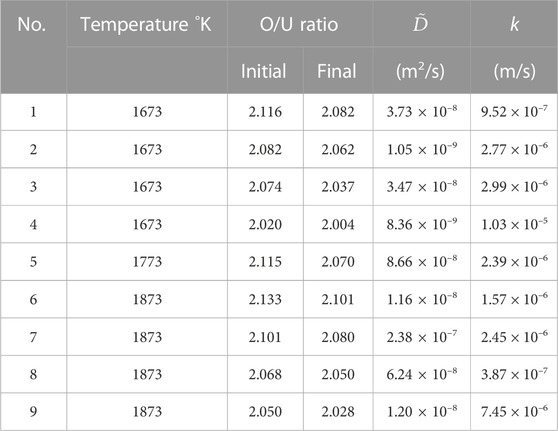
TABLE 2. Experimental conditions, oxygen chemical diffusion coefficient
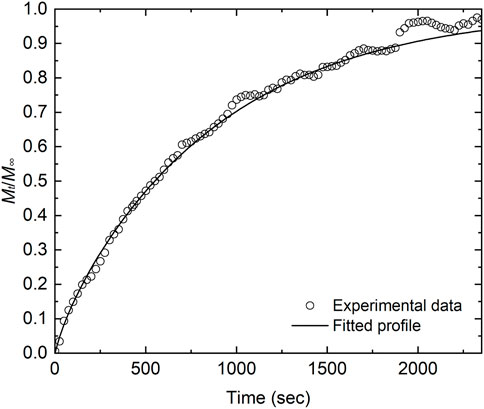
FIGURE 3. Experimental data and fitted curves after variation of the O/U ratio from 2.082 to 2.062 at 1673 K. The experimental data correspond to No. 2 in Table 2.
4 Discussion
The relationships among n = +6, +2, and −3 are shown in Figure 2. Two types of Brouwer diagram are proposed depending on the kinds of dominant point defects: intrinsic defects and Frenkel defects. The reported electrical conductivity measurements showed that the electronic conduction mechanism was observed, therefore, it is assumed that intrinsic defects were dominant in the stoichiometric composition. Cooper et al. (2018) calculated a Brouwer diagram of UO2 using an ab initio approach in which intrinsic defects were dominant. In the near stoichiometric region, defect equilibria were considered in reactions (10)–(13):
The equilibrium constants in the aforementioned defect reactions can be described by Eqs 14–17, respectively:
In the case where intrinsic defects are dominant, the defect concentrations of
In the oxidation region where n = +2, the (2:2:2) Willis cluster (Willis 1987) was assumed as follows:
The equilibrium constant in the aforementioned defect reaction can be described by the following equation:
In the hypo-stoichiometric region, n = −3 has been reported by previous studies (Tetenbaum and Hunt 1968; Javed 1972). Kofstad proposed that interstitial uranium ions with two effective charges,
In the oxidation region where n = +6, more complex defects were expected; however, there have been no reports describing this relationship. Defect reactions were not assumed in this region, and only the relationship of n = +6 was described by the following equation:
The relationships of n = +2 and −2 should be observed in the near-stoichiometric region because intrinsic ionization dominates. The relationships among n = −3, +2 and +6, are shown in Figure 2. The experimental data were fitted by Eqs. 26 and 19–27 assuming that x =
Enthalpy,
In addition, it was assumed that Eq. 19 equals Eq. 24. The
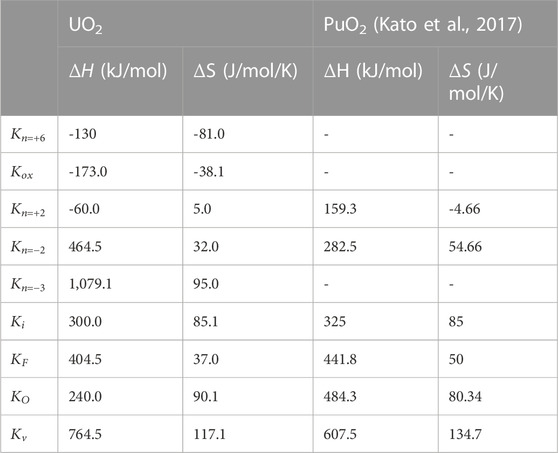
TABLE 3. Defect formation energies of UO2 and PuO2.
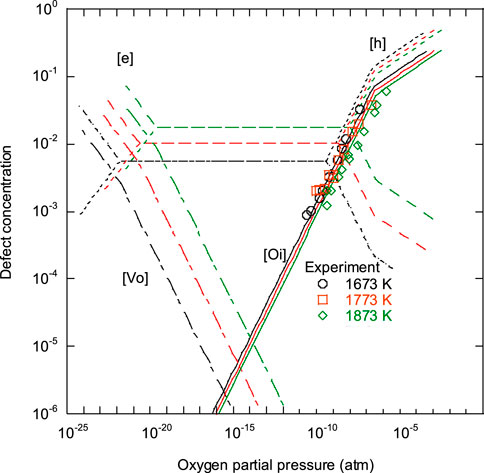
FIGURE 4. Brouwer diagram of UO2±x at 1673 K, 1773 K, and 1873 K.
Eq. 32 was rewritten as Eq. 35 using Eqs 33 and 34, which can represent the O/U ratio as functions of
Eq. 35 gives the relationships between oxygen potential, temperature, and composition in UO2±x. Figure 5 shows the relationships between x, T, and
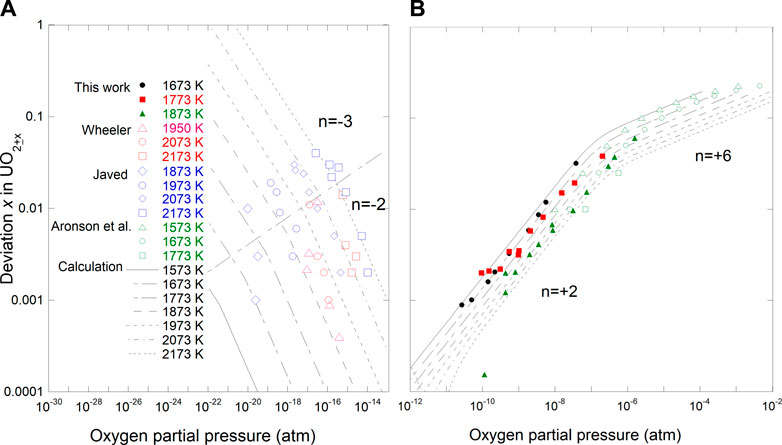
FIGURE 5. Comparison of deviation from stoichiometry vs temperature and oxygen partial pressure with calculated results using Eq. (35). (A) hypo-stoichiometric region; (B) hyper-stoichiometric region.
The
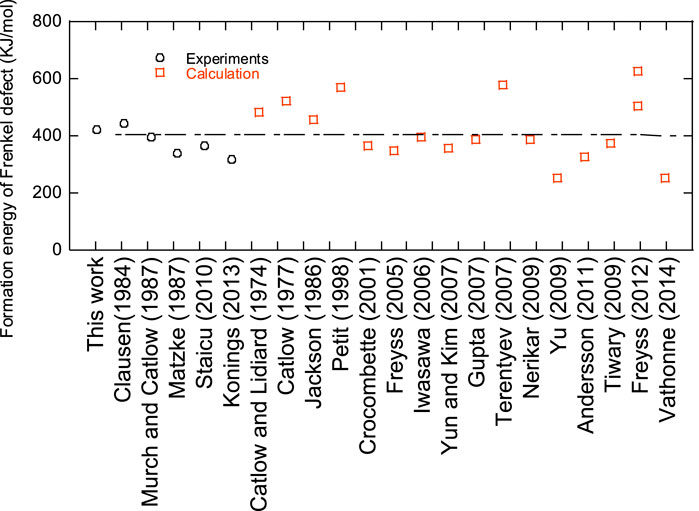
FIGURE 6. Comparison of Frenkel defect formation energy in UO2±x.
Figure 7 shows a comparison between the experimental data (Aronson and Belle 1958; Markin TL. and Bones RJ. 1962; Aukrust, Forland, and Hagemark 1962; Markin TL. and Bones RJ. 1962; Aitken, Brassfield, and Fryxell 1966; Hagemark and Broli 1966; Markin, Wheeler, and Bones 1968; Tetenbaum and Hunt 1968; Ackermann, Rauh, and Chandrasekharaiah 1969; Wheeler 1971; Javed 1972; Wheeler and Jones 1972; Chilton and Edwards 1980; Ugajin 1983) and the calculated results of the oxygen potential of UO2. The results of the calculations represent the data within
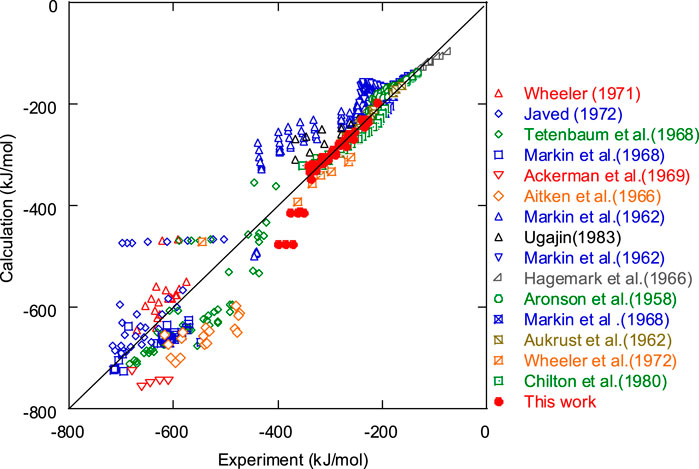
FIGURE 7. Comparison between measured and calculated data.
Figure 8 shows the comparison between the oxygen chemical diffusion coefficients measured in this study and the literature data (Bittel, Sjodahl, and White 1969; Lay 1970; Breitung 1978; Bayoglu and Lorenzelli 1979; Ruello et al., 2004; Berthinier et al., 2013). The data obtained in this study have larger values than those reported by Bittel et al. and Breitung, but smaller values than those in the near-stoichiometric composition proposed by Berthinier et al. (2013). The data reported by Bittel et al. are the only experimental data in the temperature range above 1673 K. They evaluated the oxygen chemical diffusion coefficients from the results of the steam oxidation of UO2, but it was pointed out that the U4O9 phase was formed on the sample surface, which caused the evaluated oxygen chemical diffusion coefficients to be lower (Breitung 1978). According to the calculation results reported by Berthinier et al., the oxygen chemical diffusion coefficients had maximum values near the stoichiometric composition and decreased with increasing deviation from the stoichiometric composition (Berthinier et al., 2013). Thus, the oxygen chemical diffusion coefficients measured in this study can be considered reasonable, in general. The dependence of the measured diffusion coefficients on oxygen partial pressure is shown in Figure 9. The oxygen chemical diffusion coefficients and the oxygen self-diffusion coefficients (
where the positive and negative signs apply to the hyper- and hypo-stoichiometric ranges, respectively. The oxygen self-diffusion coefficient follows the equation of (Berthinier et al., 2013; Watanabe, Kato, and Sunaoshi 2020)
where
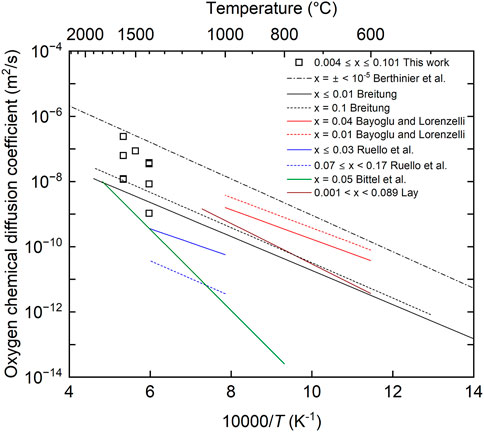
FIGURE 8. Comparison between oxygen chemical diffusion coefficients in this work and literature data.
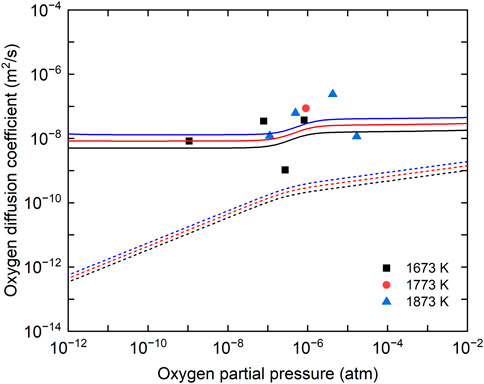
FIGURE 9. Dependence of measured oxygen chemical diffusion coefficients on oxygen partial pressure with calculation results. Solid lines show the calculation results of the oxygen chemical diffusion coefficients. Dashed lines show the calculation results of oxygen self-diffusion coefficients.
5 Conclusions
The oxygen potentials and oxygen chemical diffusion coefficients of UO2 were measured by the gas equilibrium method. A data set of oxygen potential was made and analyzed based on defect chemistry. The relationships between deviation x from stoichiometric composition and the oxygen partial pressure were investigated. Defect equilibrium constants were evaluated by fitting the experimental data and defect formation energies were determined and used to construct a Brouwer diagram. The correlation with UO2 oxygen potential was then derived. The correlation described the oxygen potential very well even in the near-stoichiometric composition range. The oxygen Frenkel formation energy was estimated to be 404.5 kJ/mol, which was in good agreement with literature values. As a result of comparison with the literature values, it was found that the values of the oxygen chemical diffusion coefficients obtained in this study were generally reasonable. The oxygen partial pressure dependence of the oxygen chemical diffusion coefficient was predicted from the evaluated results of the oxygen potential data, but no clear dependence was observed.
Data availability statement
The original contributions presented in the study are included in the article/Supplementary Material, further inquiries can be directed to the corresponding author.
Author contributions
MW: investigation, analysis, and writing the original draft; MK: conceptualization, analysis, and reviewing and editing the original draft.
Conflict of interest
The authors declare that the research was conducted in the absence of any commercial or financial relationships that could be construed as a potential conflict of interest.
Publisher’s note
All claims expressed in this article are solely those of the authors and do not necessarily represent those of their affiliated organizations, or those of the publisher, the editors, and the reviewers. Any product that may be evaluated in this article, or claim that may be made by its manufacturer, is not guaranteed or endorsed by the publisher.
References
Ackermann, R. J., Rauh, E. G., and Chandrasekharaiah, M. S. (1969). 'Thermodynamics study of the urania-uranium system. J. Phys. Chem. 73, 762–769. doi:10.1021/j100724a002
Aitken, E. A., Brassfield, H. C., and Fryxell, R. E. (1966). “Thermodynamic behaviour of hypostoichiometric UO2,” in Conference: Symposium on thermodynamics with emphasis on nuclear materials and atomic transport in solids (Vienna (Austria), 435–453.
Andersson, D. A., Uberuaga, B. P., Nerikar, P. V., Unal, C., and Stanek, C. R. (2011). U and Xe transport in UO2±x: Density functional theory calculations. Phys. Rev. B 84, 054105. doi:10.1103/physrevb.84.054105
Aronson, S., and Belle, J. (1958). 'Nonstoichiometry in uranium dioxide. J. Chem. Phys. 29, 151–158. doi:10.1063/1.1744415
Aukrust, E., Forland, T., and Hagemark, K. (1962). “Equilibrium measurements and interpretation of non-stoichiometry in UO2+x,” in Thermodynamics of nuclear materials (Vienna: IAEA), 713–722.
Auskern, A. B., and Belle, J. (1961). 'Oxygen ion self-diffusion in uranium dioxide. J. Nucl. Mater. 3, 267–276. doi:10.1016/0022-3115(61)90194-5
Baichi, M., Chatillon, C., Ducros, G., and Froment, K. (2006). 'Thermodynamics of the O–U system. IV – critical assessment of chemical potentials in the U–UO2.01 composition range. J. Nucl. Mater. 349, 17–56. doi:10.1016/j.jnucmat.2005.09.001
Bayoglu, A., and Lorenzelli, R. (1984). 'Oxygen diffusion in fcc fluorite type nonstoichiometric nuclear oxides MO2±x☆', Solid State Ionics, 12, 53–66. doi:10.1016/0167-2738(84)90130-9
Bayoglu, A. S., and Lorenzelli, R. (1979). 'Etude de la diffusion chimique de l'oxygene dans puo2−x par dilatometrie et thermogravimetrie. J. Nucl. Mater. 82, 403–410. doi:10.1016/0022-3115(79)90022-9
Belle, J. (1969). 'Oxygen and uranium diffusion in uranium dioxide (a review). J. Nucl. Mater. 30, 3–15. doi:10.1016/0022-3115(69)90163-9
Berthinier, C., Rado, C., Chatillon, C., and Hodaj, F. (2013). 'Thermodynamic assessment of oxygen diffusion in non-stoichiometric UO2±x from experimental data and Frenkel pair modeling. J. Nucl. Mater. 433, 265–286. doi:10.1016/j.jnucmat.2012.09.011
Bittel, J. T., Sjodahl, L. H., and White, J. F. (1969). 'Steam oxidation kinetics and oxygen diffusion in UOz at high temperatures. J. Am. Ceram. Soc. 52, 446–451. doi:10.1111/j.1151-2916.1969.tb11976.x
Breitung, W. (1978). Oxygen self and chemical diffusion coefficients in. J. Nucl. Mater. 74, 10–18. doi:10.1016/0022-3115(78)90527-5
Catlow, C. R. A. (1977). 'Point-Defect and electronic properties of uranium-dioxide. Proc. R. Soc. Lond. Ser. a-Mathematical Phys. Eng. Sci. 353, 533–561.
Catlow, C. R. A., and Lidiard, A. B. (1974). Symposium on the thermodynamics of nuclear materials, 27-42. Vienna, Austria: IAEA.Theoretical studies of point-defect properties of uranium dioxide.
Chilton, G. R., and Edwards, J. (1980). Oxygen potentials of U0.77Pu0.23O2+x in the temperature range 1523-1822 K." 17, United Kingdom Atomic Energy Authority, Northern DivisionIn.
Clausen, K., Hayes, W., Macdonald, J. E., Osborn, R., and Hutchings, M. T. (1984). 'Observation of oxygen Frenkel disorder in uranium-dioxide above 2000-K by use of neutron-scattering techniques. Phys. Rev. Lett. 52, 1238–1241. doi:10.1103/physrevlett.52.1238
Cooper, M. W. D., Murphy, S. T., and Andersson, D. A. (2018). 'The defect chemistry of UO2±x from atomistic simulations. J. Nucl. Mater. 504, 251–260. doi:10.1016/j.jnucmat.2018.02.034
Crocombette, J. P., Jollet, F., Nga, L. N., and Petit, T. (2001). 'Plane-wave pseudopotential study of point defects in uranium dioxide. Phys. Rev. B 64, 104107. doi:10.1103/physrevb.64.104107
Freyss, M., Dorado, B., Bertolus, M., Jomard, G., Vathonne, E., Garcia, P., et al. (2012). “First-principles DFT + U study of radiation damage in UO2 : f electron correlations and the local energy minima issue,” in Psi-k newsletter, 35–61.
Freyss, M., Petit, T., and Crocombette, J. P. (2005). 'Point defects in uranium dioxide: Ab initio pseudopotential approach in the generalized gradient approximation. J. Nucl. Mater. 347, 44–51. doi:10.1016/j.jnucmat.2005.07.003
Guéneau, C., Baichi, M., Labroche, D., Chatillon, C., and Sundman, B. (2002). 'Thermodynamic assessment of the uranium–oxygen system. J. Nucl. Mater. 304, 161–175. doi:10.1016/s0022-3115(02)00878-4
Gupta, F., Brillant, G., and Pasturel, A. (2007). 'Correlation effects and energetics of point defects in uranium dioxide: A first principle investigation. Philos. Mag. 87, 2561–2569. doi:10.1080/14786430701235814
Hagemark, K., and Broli, M. (1966). 'Equilibrium oxygen pressures over the nonstoicheiometric uranium oxides UO2+x and U3O8-z at higher temperatures. J. Inorg. Nucl. Chem. 28, 2837–2850. doi:10.1016/0022-1902(66)80010-6
Iwasawa, M., Chen, Y., Kaneta, Y., Ohnuma, T., Geng, H. Y., and Kinoshita, M. (2006). 'First-principles calculation of point defects in uranium dioxide. Mater. Trans. 47, 2651–2657. doi:10.2320/matertrans.47.2651
Jackson, R. A., Murray, A. D., Harding, J. H., and Catlow, C. R. A. (1986). The calculation of defect parameters in UO2. Philosophical Mag. a-Physics Condens. Matter Struct. Defects Mech. Prop. 53, 27–50. doi:10.1080/01418618608242805
Javed, N. A. (1972). 'Thermodynamic study of hypostoichiometric urania. J. Nucl. Mater. 43, 219–224. doi:10.1016/0022-3115(72)90053-0
Kato, M., Nakamura, H., Watanabe, M., Matsumoto, T., and Machida, M. (2017). Defect chemistry and basic properties of non-stoichiometric PuO2. Defect Diffusion Forum 375, 57–70. doi:10.4028/www.scientific.net/ddf.375.57
Kato, M., Watanabe, M., Hirooka, S., and Vauchy, R. (In press 2023). Oxygen diffusion in flurotite-tyoe oxides, CeO2, ThO2, UO2, PuO2, and (U, Pu)O2. Front. Nucl. Eng.
Kim, K. C., and Olander, D. R. (1981). Oxygen diffusion in UO2−x. J. Nucl. Mater. 102, 192–199. doi:10.1016/0022-3115(81)90559-6
Kofstad, P. (1972). Nonstoichiometry, diffusion, and electrical conductivity in binary metal oxides. Hoboken, New Jersey, United States, John Wiley & Sons.
Konings, R. J. M., and Benes, O. (2013). 'The heat capacity of NpO2 at high temperatures: The effect of oxygen Frenkel pair formation. J. Phys. Chem. Solids 74, 653–655. doi:10.1016/j.jpcs.2012.12.018
Kubaschewski, O., and Alcock, C. B. (1979). Metallurgical thermochemistry. Pergamon; 5th edition, Pergamon, Turkey.
Lay, K. W. (1970). 'Oxygen chemical diffusion coefficient of uranium dioxide. J. Am. Ceram. Soc. 53, 369–373. doi:10.1111/j.1151-2916.1970.tb12134.x
Lindemer, T. B., and Besmann, T. M. (1985). Chemical thermodynamic representation of UO2±x. J. Nucl. Mater. 130, 473–488. doi:10.1016/0022-3115(85)90334-4
Maillard, S., Andersson, D., Freyss, M., and Bruneval, F. (2022). 'Assessment of atomistic data for predicting the phase diagram and defect thermodynamics. The example of non-stoichiometric uranium dioxide. J. Nucl. Mater. 569, 153864. doi:10.1016/j.jnucmat.2022.153864
Marin, J. F., and Contamin, P. (1969). Uranium and oxygen self-diffusion in UO2. J. Nucl. Mater. 30, 16–25. doi:10.1016/0022-3115(69)90164-0
Markin, T. L., and Bones, R. J. (1962a). The determination of changes in free energy for uranium oxides using a high temperature galvanic cell Part 1.
Markin, T. L., and Bones, R. J. (1962b). The determination of some thermodynamic properties of uranium oxides with O/U ratios between 2.00 and 2.03 using a high temperature galvanic cell Part 2.
Markin, T. L., Wheeler, V. J., and Bones, R. J. (1968). High temperature thermodynamic data for UO2±x. J. Inorg. Nucl. Chem. 30, 807–817. doi:10.1016/0022-1902(68)80441-5
Matzke, H. (1987). Atomic transport properties in UO2 and mixed oxides (U, Pu)O2. J. Chem. Soc. Faraday Trans. 2, 1243. doi:10.1039/ft9908601243
Murch, G. E., Bradhurst, D. H., and De Bruin, H. J. (1975). Oxygen self-diffusion in non-stoichiometric uranium dioxide. Philosophical Mag. A J. Theor. Exp. Appl. Phys. 32, 1141–1150. doi:10.1080/14786437508228095
Murch, G. E., and Catlow, C. R. A. (1987). 'Oxygen diffusion in UO2, ThO2 and PuO2 a review. J. Chem. Society-Faraday Trans. Ii 83, 1157–1169. doi:10.1039/f29878301157
Murch, G. E., and Thorn, R. J. (1978). 'The mechanism of oxygen diffusion in near stoichiometric uranium dioxide. J. Nucl. Mater. 71, 219–226. doi:10.1016/0022-3115(78)90419-1
Nerikar, P., Watanabe, T., Tulenko, J. S., Phillpot, S. R., and Sinnott, S. B. (2009). 'Energetics of intrinsic point defects in uranium dioxide from electronic-structure calculations. J. Nucl. Mater. 384, 61–69. doi:10.1016/j.jnucmat.2008.10.003
Petit, T., Lemaignan, C., Jollet, F., Bigot, B., and Pasturel, A. (1998). 'Point defects in uranium dioxide. Philosophical Mag. B-Physics Condens. Matter Stat. Mech. Electron. Opt. Magnetic Prop. 77, 779–786. doi:10.1080/014186398259176
Ruello, P., Chirlesan, G., Petot-Ervas, G., Petot, C., and Desgranges, L. (2004). 'Chemical diffusion in uranium dioxide – influence of defect interactions. J. Nucl. Mater. 325, 202–209. doi:10.1016/j.jnucmat.2003.12.007
Staicu, D., Wiss, T., Rondinella, V. V., Hiernaut, J. P., Konings, R. J. M., and Ronchi, C. (2010). 'Impact of auto-irradiation on the thermophysical properties of oxide nuclear reactor fuels. J. Nucl. Mater. 397, 8–18. doi:10.1016/j.jnucmat.2009.11.024
Terentyev, D. (2007). 'Molecular dynamics study of oxygen transport and thermal properties of mixed oxide fuels. Comput. Mater. Sci. 40, 319–326. doi:10.1016/j.commatsci.2007.01.002
Tetenbaum, M., and Hunt, P. D. (1968). 'High-Temperature thermodynamic properties of oxygen-deficient urania. J. Chem. Phys. 49, 4739–4744. doi:10.1063/1.1669953
Tiwary, P., van de Walle, A., and Gronbech-Jensen, N. (2009). 'ab initio construction of interatomic potentials for uranium dioxide across all interatomic distances. Phys. Rev. B 80, 174302. doi:10.1103/physrevb.80.174302
Ugajin, M. (1983). 'Measurements of O/U ratio and oxygen potential for UO2+x (0≤x≲0.1). J. Nucl. Sci. Technol. 20, 228–236. doi:10.1080/18811248.1983.9733384
Vathonne, E., Wiktor, J., Freyss, M., Jomard, G., and Bertolus, M. (2014). 'DFT + U investigation of charged point defects and clusters in UO2. J. Phys. Condens Matter 26, 325501. doi:10.1088/0953-8984/26/32/325501
Watanabe, M., Kato, M., and Sunaoshi, T. (2020). Oxygen self-diffusion in near stoichiometric (U, Pu)O2 at high temperatures of 1673-1873 K. J. Nucl. Mater. 542, 152472. doi:10.1016/j.jnucmat.2020.152472
Wheeler, V. J. (1971). High temperature thermodynamic data for UO2−x. J. Nucl. Mater. 39, 315–318. doi:10.1016/0022-3115(71)90151-6
Wheeler, V. J., and Jones, I. G. (1972). Thermodynamic and composition changes in UO2±x (x< 0.005) at 1950 K. J. Nucl. Mater. 42, 117–121. doi:10.1016/0022-3115(72)90018-9
Willis, B. T. M. (1987). 'Crystallographic studies of anion-excess uranium-oxides. J. Chem. Society-Faraday Trans. Ii 83, 1073–1081. doi:10.1039/f29878301073
Yu, J., Devanathan, R., and Weber, W. J. (2009). 'First-principles study of defects and phase transition in UO2. J. Phys. Condens Matter 21, 435401. doi:10.1088/0953-8984/21/43/435401
Keywords: oxygen potential, oxygen chemical diffusion, defect chemistry, uranium dioxide, oxygen self-diffusion
Citation: Watanabe M and Kato M (2023) Oxygen potential, oxygen diffusion, and defect equilibria in UO2±x. Front. Nucl. Eng. 1:1082324. doi: 10.3389/fnuen.2022.1082324
Received: 28 October 2022; Accepted: 13 December 2022;
Published: 06 January 2023.
Edited by:
Lelio Luzzi, Politecnico di Milano, ItalyReviewed by:
Lionel Desgranges, Commissariat à l'Energie Atomique et aux Energies Alternatives (CEA), FranceJacques Lechelle, Commissariat à l'Energie Atomique et aux Energies Alternatives (CEA), France
Copyright © 2023 Watanabe and Kato. This is an open-access article distributed under the terms of the Creative Commons Attribution License (CC BY). The use, distribution or reproduction in other forums is permitted, provided the original author(s) and the copyright owner(s) are credited and that the original publication in this journal is cited, in accordance with accepted academic practice. No use, distribution or reproduction is permitted which does not comply with these terms.
*Correspondence: Masashi Watanabe, d2F0YW5hYmUubWFzYXNoaTgxQGphZWEuZ28uanA=