 Tyler L. Spano
 Ashley E. Shields
 Jennifer L. Niedziela
 Andrew Miskowiec
- Nuclear Nonproliferation Division, Oak Ridge National Laboratory, Oak Ridge, TN, United States
Uranium trioxide displays a complex chemical phase space, with at least six structurally distinct polymorphs accessible via different synthetic routes. Remarkably, despite its technological importance, full structural and electronic characterization of these polymorphs remains an open area of study. δ-UO3 in particular has attracted significant theoretical attention due to its high point group and space group symmetries, having U (VI) in octahedral coordination with polyhedra interconnected through corner-sharing to build a 3-D cubic lattice with space group symmetry Pm-3m and Z = 1. Critical experimental information, such as its optical vibrational spectra, are not known. Here, we study the Raman and infrared (IR) spectra of δ-UO3 together with the support of density functional theory (DFT) calculations for spectral interpretation. A symmetry analysis of the DFT-predicted phonon eigenmodes indicates that δ-UO3 should have two IR active modes and no Raman active modes. Experimental results, however, indicate significant Raman scattering from δ-UO3. We therefore propose four potential explanations for this apparent contradiction: a possible tetragonal distortion to the cubic cell, the existence of a surface impurity layer, vacancy scattering, and structural activation of Raman signal. We use powder X-ray diffraction and confocal Raman spectroscopy with depth profiling to investigate these possibilities and suggest future experiments to explore this phenomenon in more detail. Understanding the lattice dynamics of δ-UO3 is important for identification of technogenic U phases via Raman and infrared spectroscopy and our results indicate that the simple understanding of δ-UO3 as a high-symmetry cubic structure should be reconsidered.
Introduction
The diverse crystal chemistry and resulting variety of optical vibrational (Raman and IR) spectroscopic features of members of the uranium trioxide polymorph system have been of interest to researchers for several decades (Sheft et al., 1950; Hoekstra and Siegel, 1961; Cornman, 1962; Sweet et al., 2013). UO3 is an important intermediate in U processing in both front (Cornman, 1962) and proposed back-end (Johnson et al., 2017; Spano et al., 2021) fuel cycle processes. Resultingly, some polymorphs within UO3 phase space, such as the α, γ, and amorphous modifications are easily synthesized with extensive literature reports of these materials (Loopstra and Cordfunke, 1966; Sweet et al., 2013; Guo et al., 2016; Colmenero et al., 2017). Other, more exotic polymorphs such as β- and ε-UO3 have only recently been investigated for their structural and optical spectroscopic properties (Spano et al., 2020; Spano et al., 2021).
Given its high crystallographic symmetry (Pm-3m) and simple structure [U(VI) in regular octahedral coordination, Z = 1, Figure 1], δ-UO3 has been an ideal candidate for numerous computational investigations. For instance, Pickard et al. investigated δ-UO3, among other lanthanide and actinide phases, to confirm the applicability of plane wave ultrasoft pseudopotential methods for determining structural properties (Pickard et al., 2000). U-O bond length, covalency, and electron charge density (Casillas-Trujillo et al., 2017) studies by Casillas-Trujillo et al. also employed δ-UO3 as a model compound. Similarly, theoretical modeling of U 4f X-ray photoelectron spectra used cubic δ-UO3 to examine differences in photoelectron spectra resulting from variations in U-O bond length (Bagus et al., 2013). Additional investigations involving δ-UO3 have explored the band gap of uranium oxides (He et al., 2013) and other electronic, elastic, and structural properties (Geng et al., 2011; Brincat et al., 2014).
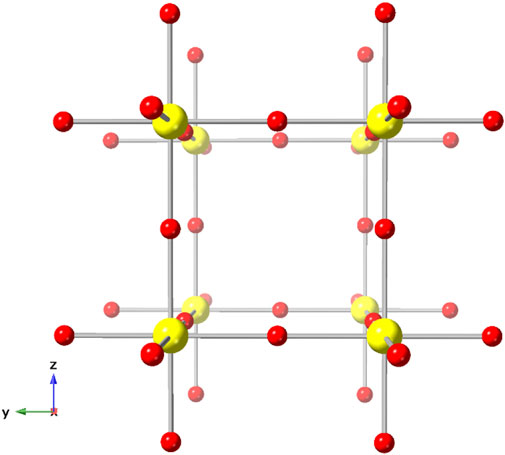
FIGURE 1. The cubic (Fm-3m) crystal structure of δ-UO3, modified from Weller et al., 1988.
However, despite abundant computational studies regarding δ-UO3, experimental investigations of this phase are limited. These include an initial report that describes a phase transition from δ-to a mix of α- and γ-UO3 prior to further thermal degradation to U3O8 (Cornman, 1962) and the crystal structure determination for δ-UO3 (Weller et al., 1988). Other studies have investigated the applicability of δ-UO3 as an insertion compound (Dueber, 1993). Of note, only one method of preparation is reported for δ-UO3, and it involves calcination of a β-UO2OH2 precursor. Furthermore, an IR spectrum has been reported for δ-UO319, but Raman spectroscopic data for this phase do not appear anywhere in the literature.
We seek to fill the gap in available experimental information for δ-UO3 by using Raman and IR spectroscopy combined with density functional perturbation theory (DFPT) for spectral interpretation. Through synthesis and computationally guided experimental characterization of δ-UO3, optical vibrational spectra provide new insight into potential structural complexity of this phase. A central question raised by this work is our observation of significant Raman scattering for δ-UO3, despite symmetry analysis and DFPT predictions indicating that no Raman active modes should be present in the spectra of this phase. Herein, we suggest several potential explanations for the activation of Raman scattering, including a possible tetragonal distortion of the cubic lattice, the presence of a secondary Raman-active phase on the surface of δ-UO3, vacancy scattering contributions, or activation of optically silent modes via perturbation of the cubic symmetry.
Materials and methods
δ-UO3 was prepared following a method described by Weller et al. (Weller et al., 1988). First, UO2(NO3)2·6H2O (International Bioanalytics, reagent grade) was heated from room temperature to 350°C at 1°C/min and held at this temperature for 7 days to produce γ-UO3. Formation of γ-UO3 was confirmed through examination of powder X-ray diffraction (PXRD) and Raman spectroscopic data collected for this intermediate (see, Supplementary Figures S1A,B). Next, γ-UO3 was placed in a 23 ml Teflon liner with ∼10 ml of deionized H2O and inserted into a Parr autoclave. Hydrothermal reaction proceeded for 24 h at 180 °C, after which the contents were retrieved via vacuum filtration. Formation of β-UO2OH2 was confirmed by PXRD (Supplementary Figure S2). Finally, δ-UO3 was prepared by heating the prepared β-UO2OH2 to 425 °C for 24 h in a porcelain crucible. δ-UO3 forms large tabular euhedral crystals that are translucent and brick red in color (Figure 2), consistent with literature reports (Weller et al., 1988).
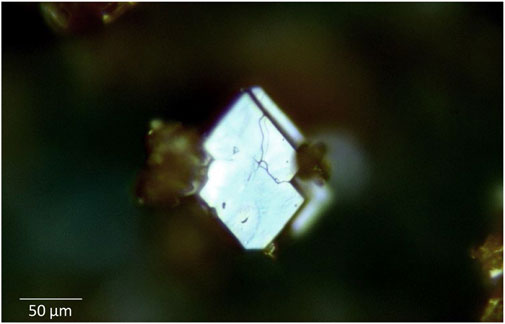
FIGURE 2. Optical image of δ-UO3 showing a large tabular euhedral crystal that is translucent and brick red in color.
Characterization of δ-UO3 proceeded with PXRD, and Raman and infrared spectroscopy. Approximately 50 mg of δ-UO3 was combined with NIST 640e line standard and transferred to a zero-background silicon substrate for PXRD analysis. Data were collected with a Proto AXRD benchtop powder diffractometer in Bragg-Brentano configuration. The sample was illuminated with a Cu–Kα (λ = 1.5406 Å) X-ray source, and data were collected with a Dectris Mythen 1K 1D detector equipped with a β-filter. Incident and diffracted beam Soller slits and a 0.2 mm divergence slit were used to reduce axial divergence of the X-ray beam. Data were collected with a step velocity of 0.06° 2θ/min in the range of 10–80° 2θ. Zero shift errors were corrected using the (111), (220), (311), (400), and (331) reflections of NIST 640e.
Raman spectra were collected for δ-UO3 using a Renishaw inVia™ micro-Raman spectrometer. An excitation wavelength of 785 nm was used to collect data in the range of 35–1,000 cm−1 in combination with a 1,200 L/mm diffraction grating, resulting in a resolution of ∼2.5–3.1 cm −1. A holographic notch filter provides spectral sensitivity to 35 cm−1 with the 785 nm excitation wavelength. Data were also collected with a 532 nm laser, in the range of 150–1,000 cm−1 with a 2,400 L/mm diffraction grating, resulting in a resolution of ∼0.80–1.01 cm−1. Power densities for both measurements are ∼100 W/cm2 based on estimated laser power (10 mW) and spot size (∼1 μm2). Reported spectra from the 785 nm laser are the sum of 20 accumulations, each with a 10 s exposure time. Background corrections were done using an asymmetric least squares method after Eilers (Eilers, 2003). Fitting of Raman spectra was performed with the Fityk software package using a series of Voigt functions (Wojdyr, 2010). Several of the peaks evaluate to zero FWHM for either Gaussian or Lorentzian component, which is interpreted as pure Lorentzian or Gaussian peak shape, respectively.
Infrared spectra were collected using a Bruker INVENIO attenuated total reflectance–Fourier transform infrared spectrometer (ATR-FTIR). Microgram subsamples of crystalline powder were transferred to the diamond lens and were pressed using the ATR tip. Data were collected in the range of 100–1,000 cm−1. Background spectra were collected in air before the measurement of δ-UO3 and applied for baseline subtractions.
Geometry optimization of the experimentally determined structure of Weller (Weller et al., 1988) (Inorganic Crystal Structure Database Collection Code 65556) and phonon mode calculations using the DFPT approach were done with the Vienna ab initio Simulation Package (VASP) using the generalized gradient approximation (GGA) (Kresse and Hafner, 1994; Kresse and Furthmüller, 1996a; Kresse and Furthmüller, 1996b; Kresse and Joubert, 1999) with the PBEsol exchange-correlation functional of Perdew, Burke, and Ernzerhof, modified for solids (Perdew et al., 1996). The Brillouin zone was sampled with a Γ-centered k-point mesh with 0.1 Å-1 spacing in reciprocal space with a plane-wave cutoff energy of 600 eV. The ions were relaxed until the total free energy converged to 10−8 eV/atom and forces were less than 10−3 eV/atom. The Phonopy Python package (Togo and Tanaka, 2015) was utilized for calculation setup and post-processing of DFPT data. Eigenvector images were created with VESTA (Momma and Izumi, 2011).
Results and discussion
Powder X-ray diffraction data collected for δ-UO3 are shown in Figure 3 and are consistent with the reported pattern for this phase provided by Weller et al., albeit with a slight shift of reflections to higher angle (Weller et al., 1988). We note minor contributions to the diffraction pattern from the γ-UO3 precursor and/or the β-UO2OH2 intermediate at ∼25.8° and ∼33° 2θ, respectively. While these low intensity reflections suggest that small fractions of bulk material were not fully converted to δ-UO3 during calcination, we are confident that the Raman and IR data collected for our material was measured for pure δ-UO3 due to the highly euhedral appearance of this phase (Figure 1) relative to the precursors. Lattice parameters, domain size broadening (with an isotropic model), isotropic strain broadening, surface roughness, and sample transparency were refined for our synthesized δ-UO3 from crystallographic information provided by Weller et al. (Weller et al., 1988) using the GSASII software package (Rw = 12.40%, Supplementary Table S1, Supplementary Figure S3) (Balzar et al., 2004; Toby and Von Dreele, 2013). As can be inferred from the slight 2θ shift to higher angles seen in our diffraction data relative to the pattern reported by Weller et al., minor unit cell contraction and resultingly, a higher density is observed in our synthesized material (a = 4.141 Å, ρ = 6.689), with respect to reported crystallographic information (a = 4.165 Å, ρ = 6.570 Weller et al., 1988) and results from our geometry optimization (a = 4.162 Å, ρ = 6.586). Significant broadening of δ-UO3 reflections are observed with increasing angle. Possible physical phenomena that can give rise to significant broadening of Bragg peaks include finite crystallite sizes and/or strain. Because we cannot distinguish between the effect of strain and finite crystallite size domains, we attribute the Bragg peak broadening to small crystallite domains in a phenomenological way. In other words, we quantify the broadening using a standard Scherrer approximation (Patterson, 1939), but we remain agnostic as to the fundamental origin of the broadening. The 10 most intense reflections originating from δ-UO3 were fit to Voigt peaks using OriginPro 2021 (Origin Pro, 2021); and using the FWHM (θB) of these peaks, the average crystallite domain size (t) was calculated following
where λ = 1.5406 Å, the instrumental broadening factor, B = 0.096 (calculated from line broadening of NIST 640e standard reference material), and the Scherrer constant K = 0.94 (for approximately spherical cubic crystals (Langford and Wilson, 1978)). An average domain size of ∼23 nm resulted from Scherrer analysis and is consistent with the crystallite domain size obtained during full pattern fitting of the δ-UO3 PXRD data when determining lattice parameters (44 nm). The small domains (∼23–44 nm) calculated for δ-UO3 are incommensurate with the observed crystal size of this phase (Figure 2), suggesting that either significant strain or internal disorder is present.
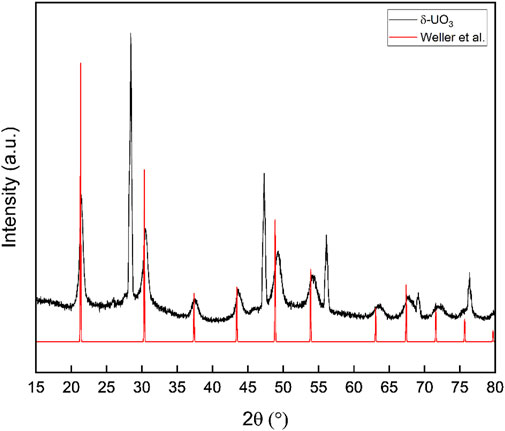
FIGURE 3. Powder X-ray diffraction data collected for δ-UO3 compared with simulated diffraction data from the structure of Weller et al. Reflections from NIST 640e line standard are visible at 28.441, 47.300, 56.120, 69.126, and 76.372°2θ. Significant broadening of Bragg peaks is observed and results of Scherrer analysis indicate small (∼23 nm) crystallite domains.
The crystallographic point group of δ-UO3 is m-3m (Oh), and DFPT predicts three optical phonon modes at 199 (T2u), 233 (T1u), and 518 (T1u) cm−1. Symmetry analysis indicates that all modes should be Raman silent, with two IR-active T1u modes (Table 1). Observed Raman spectra, however, show several notable spectral features (Figure 4, peak fit parameters in Table 2), the most salient of which are a low-energy feature located at 127 cm−1 and a vibrational mode centered at 532 cm−1. Several broad, low-intensity features are seen in the ranges of 275–325 cm−1 and 625–750 cm−1. Another low-intensity peak is observed at 890 cm−1. Significant Raman intensity is also observed below 75 cm−1, appearing to originate below the Rayleigh filter cutoff.
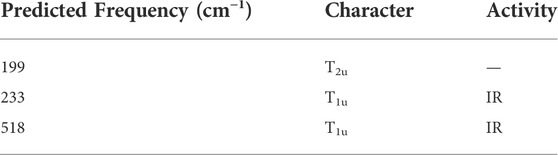
TABLE 1. Symmetry analysis for phonon modes predicted from density functional perturbation theory.
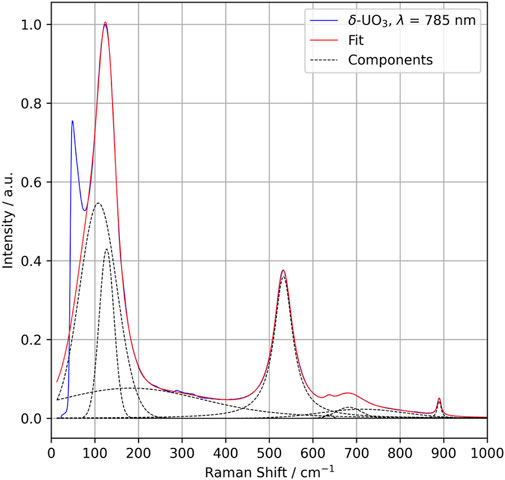
FIGURE 4. Raman spectra collected for δ-UO3 (785 nm excitation wavelength) (blue) with individual Voigt function fit components (dotted lines) and total fit (red).
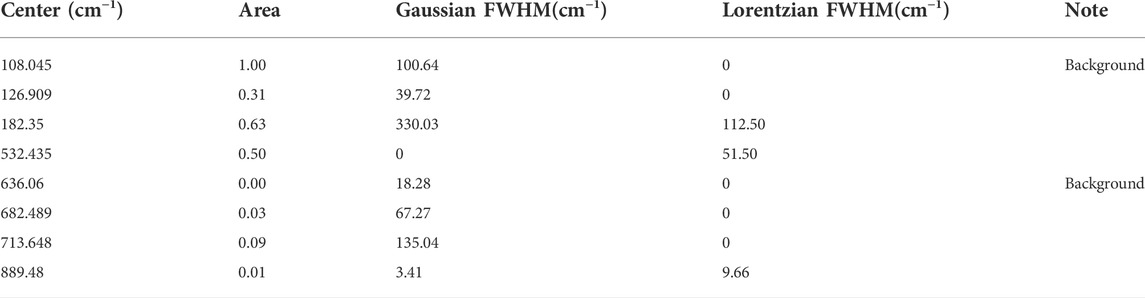
TABLE 2. Fit parameters for Raman spectra of δ-UO3. Note that 0 FWHM implies no contribution from indicated lineshape to the Voigt function.
Infrared spectra collected for δ-UO3 are shown in Figure 5, and are in good agreement with spectra provided by Allen and Holmes (Allen and Holmes, 1987), although these researchers do not provide data below 250 cm−1. We report here, for the first time, the IR spectrum in the low frequency (100–250 cm−1) range. Although it is difficult to ascertain the relative intensities of features in the IR spectra provided by Allen and Holmes, the broad absorption bands observed by these authors near 900 cm−1, 700 cm−1, and 525 cm−1 are correspondent with the present work, if shifted to slightly lower wavenumbers in our experiments. Further, the leading edge of the absorption band seen in spectra provided by Allen and Holmes is elucidated in our work to be the result of an absorption doublet at 220 and 198 cm−1, and we present an additional absorption band at 158 cm−1. IR spectra collected for δ-UO3 show few vibrational modes relative to the spectra of other UO3 phases. Nevertheless, several notable bands are observed, and appear to be correlated with data published for this phase (Allen and Holmes, 1987) and DFPT-predicted phonon modes. Absorption bands located at 158, 198, and 220 cm−1 are seen in the experimental IR spectrum and may correspond to the 233 cm−1 DFPT-predicted T1u phonon mode (Figure 6). We note that this band may also originate from activation of the mode predicted at 199 cm−1 by DFPT via local modifications in symmetry and resulting breakdown of selection rules via similar mechanisms to those discussed later for the Raman spectrum of δ-UO3. Diffuse absorption bands are also seen in the range of ∼300–450 cm−1, although the structural origins of these bands remain unclear. The vibrational mode found at 518 cm−1 in the Raman spectrum of δ-UO3 that, from the eigenvector analysis, corresponds to antisymmetric O stretching vibrations, is absent in the IR data although it should be visible according to symmetry analysis. It is possible that the doublet of diffuse absorption bands seen at ∼630 and 684 cm−1 originates from the T1u mode predicted at 518 cm−1 from DFPT. A low-intensity, broad absorption band is also observed at ∼899 cm−1 further suggesting that uranyl-type bonds may be present.
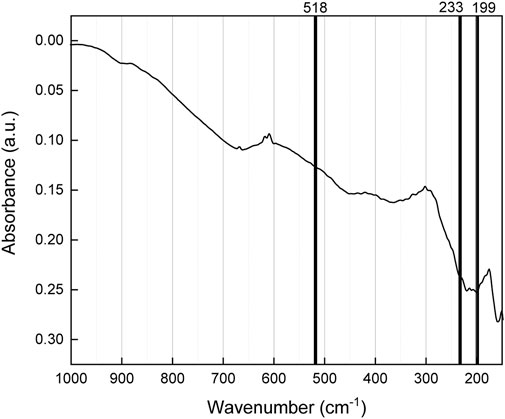
FIGURE 5. Infrared spectra collected for δ-UO3 with an overlay of DFPT-predicted phonon mode frequencies.
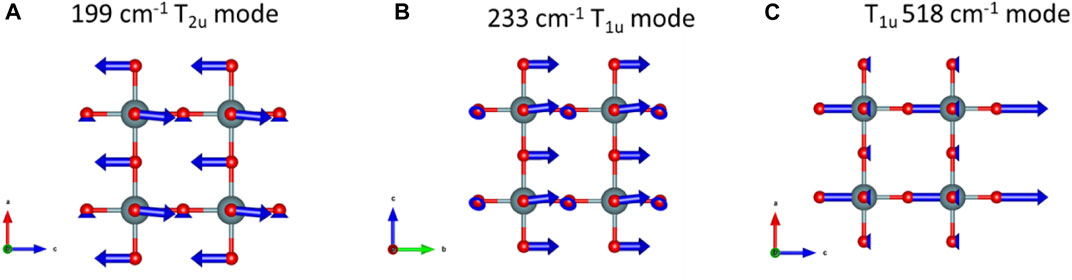
FIGURE 6. Phonon eigenvector visualizations for δ-UO3. vibrational modes predicted at (A) 199 cm−1, (B) 233 cm−1 and, (C) 518 cm−1.
During investigation of the optical vibrational spectra of β-UO3, we used DFPT and phonon eigenvector visualizations to describe the structural origins of features observed in Raman spectra (Spano et al., 2020) and we take a similar approach here (Figure 6). The T2u mode predicted at 199 cm−1 corresponds to antisymmetric O stretching vibrations along c, where O atoms are displaced into interstices (Figure 6A). Likewise, the 233 cm−1 T1u mode predicted from DFPT is attributable to O displacement along b (Figure 6B). Similarly, an additional Raman-silent T1u mode corresponding to antisymmetric stretching of O atoms along c is predicted at 518 cm−1 from DFPT (Figure 6C), which is correspondent to the experimentally observed mode at 532 cm−1. However, despite potential correlations between DFPT-predicted and experimentally observed vibrational frequencies, symmetry analysis indicates none of these modes should be Raman active. It is worth noting that the high-intensity feature observed at ∼40 cm−1 in the experimental Raman spectrum of δ-UO3 does not correlate with any DFPT-predicted phonon modes. One possible explanation for its appearance could be related to the ‘boson peak’, which is the activation of acoustic phonons that cannot propagate in amorphous materials. Although δ-UO3 is not amorphous per se, the small crystallite domain size may result in a similar physical effect (Shintani and Tanaka, 2008). Similarly, the diffuse bands located at 625–750 cm−1 and low-intensity peak at 890 cm−1 are not accounted for by DFPT predictions. The band located at 890 cm−1 may correspond to the presence of some U-O bonds with uranyl-like character, as the symmetric stretching of UO22+ axial O dominate this spectral region in other UO3 and uranium oxysalt phases (Bartlett and Cooney, 1989).
Given the symmetry analysis and DFPT results indicating that no vibrational modes should be observable in the Raman, several possible explanations for the origin of Raman activity could be operative. First, a tetragonal distortion from Pm-3m to P4/mmm with Wyckoff positions a and f, a simple expansion of one of the lattice constants, would give rise to a mechanical representation of A2u + B2u + 2Eu modes, however, none of these modes are Raman active either (Hahn et al., 1983). To explore if symmetry reduction was evident in the diffraction data, we collected additional high-angle (65–120° 2θ) PXRD data (Supplementary Figure S4) to search for evidence of peak splitting that could be indicative of a reduction in space group symmetry and conversion from a cubic to tetragonal crystal system. Powder diffraction data (Figure 3, Supplementary Figure S4) did not immediately show evidence of peak splitting, so select reflections that would correspond to a tetragonal distortion (Cullity, 1956) in the powder diffraction data were fit with both one and two Voigt peaks, and both Bayesian and Akaike information criteria were used to compare the fits and determine whether peak splitting was occurring. From these methods, peak splitting was not definitively observed, nor could it be ruled out entirely.
Second, we recognize the possibility that because Raman spectroscopy is a primarily surface-sensitive technique the observed signal could arise from the presence of a secondary Raman active phase. To investigate this possibility, we performed a depth profile analysis on a single crystal of the synthesized material (See Supplementary Figure S5). An initial spectrum was collected, followed by nine additional spectra collected in increasing depth (∼10 μm total range) relative to the crystal surface. Raman spectra collected in this way were indistinguishable from the initial dataset suggesting that the specimen is spectroscopically homogeneous.
Third, vacancy scattering could give rise to Raman activity in the cubic space group due to the local distortion of the polarizability tensor. Unfortunately, the PXRD data are not sufficient for us to determine partial occupancy of any of the lattice sites that may be evidence of vacancy contributions. We suggest additional studies, including single-crystal X-ray diffraction, to provide more insight into this possible mechanism.
Finally, we consider other activation mechanisms of symmetry-forbidden modes via structural effects. The Lorentzian lineshape (Table 2) of the 532 cm−1 mode indicates a dynamic phonon relaxation mechanism (opposed to a purely structural distortion that would give rise to a Gaussian lineshape), such as grain boundary scattering or defect scattering. For small crystallite domains, the finite length scale of coherent domains will break the long-range Pm-3m symmetry and allow Raman activation of the T1u, essentially by forming nanodomains of lower symmetry. Activation of the T1u modes predicted from DFPT could account for the Raman signal observed at 124 and 532 cm−1 for δ-UO3, although the presence of a mode at 890 cm−1, and other low intensity spectral features suggests that additional complexity exists beyond either grain boundary or defect scattering.
Despite possessing a simple crystal structure that has been investigated in numerous theoretical studies, the Raman signal we observe in synthesized samples of δ-UO3 highlights a shortcoming in the understanding of the structural details of δ-UO3. Additional measurements and theoretical studies beyond the scope of this work, including single-crystal X-ray diffraction, physical property measurements, and neutron spectroscopy are required to elucidate how underlying structural features in δ-UO3 give rise to signals observed in our optical vibrational spectroscopic investigations.
Conclusion
Following examination of the current state of the literature regarding δ-UO3, we recognized a need for a complete study of the optical vibrational spectroscopic properties of this polymorph to more completely understand the UO3 phase space. As δ-UO3 is a popular target for theory benchmarking on U(VI) species, publication of these spectra, which can be interpreted with ab initio calculations, provides a valuable experimental standard for further theory studies of this nature. Resultingly, we have synthesized δ-UO3 and performed PXRD for phase identification. We report for the first time, the Raman spectrum for δ-UO3 and expand the range of IR spectra available for this material. Using DFT and DFPT, we examine spectroscopic features of δ-UO3 through the lens of the lattice vibrations from which they may originate. The calculations suggest no Raman active modes should be present in δ-UO3. Yet, they appear. Four possible explanations for the activation of Raman signal are investigated: the presence of tetragonal lattice distortion, a secondary impurity phase, vacancy scattering, and dynamic relaxation enabled by structural complexity. Our results cannot definitively assign or eliminate any of these possibilities, rather, we lay the foundation for future studies of each of these mechanisms in more detail.
Data availability statement
The raw data supporting the conclusions of this article will be made available by the authors, without undue reservation.
Author contributions
TS: Experiment design, material synthesis, data collection and analysis, manuscript preparation and editing. AS: DFT and DFPT investigation, data analysis, manuscript editing. JN: technical and conceptual discussions, manuscript editing. AM: experimental design, data interpretation, manuscript preparation and editing.
Acknowledgments
The authors thank Alissa Moore and Tara Rose for their support. We thank Drs. Jennifer Neu, Rebecca McAuliffe, Sara Isbill, Erik Nykwest, and Zach Brubaker and two reviewers for their helpful comments and feedback on this work. A portion of this work was supported by the United States Department of Energy National Nuclear Security Administration.
Conflict of interest
The authors declare that the research was conducted in the absence of any commercial or financial relationships that could be construed as a potential conflict of interest.
Publisher’s note
All claims expressed in this article are solely those of the authors and do not necessarily represent those of their affiliated organizations, or those of the publisher, the editors and the reviewers. Any product that may be evaluated in this article, or claim that may be made by its manufacturer, is not guaranteed or endorsed by the publisher.
Supplementary material
The Supplementary Material for this article can be found online at: https://www.frontiersin.org/articles/10.3389/fnuen.2022.995292/full#supplementary-material
References
Allen, G. C., and Holmes, N. R. (1987). Surface characterisation of α-β-γ-and δ-UO3 using X-ray photoelectron spectroscopy. J. Chem. Soc. Dalton Trans. 12, 3009–3015. doi:10.1039/dt9870003009
Bagus, P. S., Nelin, C. J., and Ilton, E. S. (2013). Theoretical modeling of the uranium 4f XPS for U (VI) and U (IV) oxides. J. Chem. Phys. 139 (24), 244704. doi:10.1063/1.4846135
Balzar, D., Audebrand, N., Daymond, M., Fitch, A., Hewat, A., Langford, J., et al. (2004). Size–strain line-broadening analysis of the ceria round-robin sample. J. Appl. Crystallogr. 37 (6), 911–924. doi:10.1107/s0021889804022551
Bartlett, J. R., and Cooney, R. P. (1989). On the determination of uranium-oxygen bond lengths in dioxouranium (VI) compounds by Raman spectroscopy. J. Mol. Struct. 193, 295–300. doi:10.1016/0022-2860(89)80140-1
Brincat, N. A., Parker, S. C., Molinari, M., Allen, G. C., and Storr, M. T. (2014). Ab initio investigation of the UO3 polymorphs: Structural properties and thermodynamic stability. Inorg. Chem. 53 (23), 12253–12264. doi:10.1021/ic500791m
Casillas-Trujillo, L., Baldinozzi, G., Patel, M., Xu, H., and Sickafus, K. (2017). Comparison of bonding and charge density in δ−UO3, γ−UO3, and La6UO12. Phys. Rev. Mater. 1 (6), 065404. doi:10.1103/physrevmaterials.1.065404
Colmenero, F., Bonales, L. J., Cobos, J., and Timón, V. (2017). Density functional theory study of the thermodynamic and Raman vibrational properties of γ-UO3 polymorph. J. Phys. Chem. C 121 (27), 14507–14516. doi:10.1021/acs.jpcc.7b04389
Cornman, W. R. (1962). Preparation and characterization of the polymorphs of UO3. Aiken, SC (United States): Du Pont de Nemours (EI) & Co. Savannah River Lab.
Cullity, B. D. (1956). Elements of X-ray Diffraction. Massachusetts: Addison-Wesley Publishing Company, Reading.
Dueber, R. E. (1993). Study of uranium oxide insertion compounds. Ohio: Air Force Institute of Technology Wright-Patterson Air Force Base.
Geng, H. Y., Song, H. X., Jin, K., Xiang, S., and Wu, Q. (2011). First-principles study on oxidation effects in uranium oxides and high-pressure high-temperature behavior of point defects in uranium dioxide. Phys. Rev. B 84 (17), 174115. doi:10.1103/physrevb.84.174115
Guo, X., Wu, D., Xu, H., Burns, P. C., and Navrotsky, A. (2016). Thermodynamic studies of studtite thermal decomposition pathways via amorphous intermediates UO3, U2O7, and UO4. J. Nucl. Mater. 478, 158–163. doi:10.1016/j.jnucmat.2016.06.014
Hahn, T., Shmueli, U., and Arthur, J. W. (1983). International tables for crystallography, Dordrecht: Reidel.
He, H., Andersson, D. A., Allred, D. D., and Rector, K. D. (2013). Determination of the insulation gap of uranium oxides by spectroscopic ellipsometry and density functional theory. J. Phys. Chem. C 117 (32), 16540–16551. doi:10.1021/jp401149m
Hoekstra, H. R., and Siegel, S. (1961). The uranium-oxygen system: U3O8 UO3. J. Inorg. Nucl. Chem. 18, 154–165. doi:10.1016/0022-1902(61)80383-7
Johnson, J. A., Rawn, C. J., Spencer, B. B., Meisner, R. A., and Del Cul, G. D. (2017). Oxidation kinetics for conversion of U3O8 to ε-UO3 with NO2. J. Nucl. Mater. 490, 211–215. doi:10.1016/j.jnucmat.2017.03.048
Kresse, G., and Furthmüller, J. (1996). Efficiency of ab-initio total energy calculations for metals and semiconductors using a plane-wave basis set. Comput. Mater. Sci. 6 (1), 15–50. doi:10.1016/0927-0256(96)00008-0
Kresse, G., and Furthmüller, J. (1996). Efficient iterative schemes for ab initio total-energy calculations using a plane-wave basis set. Phys. Rev. B 54 (16), 11169–11186. doi:10.1103/physrevb.54.11169
Kresse, G., and Hafner, J. (1994). Ab initio molecular-dynamics simulation of the liquid-metal–amorphous-semiconductor transition in germanium. Phys. Rev. B 49 (20), 14251–14269. doi:10.1103/physrevb.49.14251
Kresse, G., and Joubert, D. (1999). From ultrasoft pseudopotentials to the projector augmented-wave method. Phys. Rev. B 59 (3), 1758–1775. doi:10.1103/physrevb.59.1758
Langford, J. I., and Wilson, A. (1978). Scherrer after sixty years: A survey and some new results in the determination of crystallite size. J. Appl. Crystallogr. 11 (2), 102–113. doi:10.1107/s0021889878012844
Loopstra, B. O., and Cordfunke, E. H. P. (1966). On the structure of α‐UO3. Recl. Trav. Chim. Pays. Bas. 85 (2), 135–142. doi:10.1002/recl.19660850204
Momma, K., and Izumi, F. (2011). VESTA 3 for three-dimensional visualization of crystal, volumetric and morphology data. J. Appl. Crystallogr. 44 (6), 1272–1276. doi:10.1107/s0021889811038970
Patterson, A. (1939). The Scherrer formula for X-ray particle size determination. Phys. Rev. 56 (10), 978–982. doi:10.1103/physrev.56.978
Perdew, J. P., Burke, K., and Wang, Y. (1996). Generalized gradient approximation for the exchange-correlation hole of a many-electron system. Phys. Rev. B 54 (23), 16533–16539. doi:10.1103/physrevb.54.16533
Pickard, C. J., Winkler, B., Chen, R. K., Payne, M., Lee, M., Lin, J., et al. (2000). Structural properties of lanthanide and actinide compounds within the plane wave pseudopotential approach. Phys. Rev. Lett. 85 (24), 5122–5125. doi:10.1103/physrevlett.85.5122
Sheft, I., Fried, S., and Davidson, N. (1950). Preparation of uranium trioxide. J. Am. Chem. Soc. 72 (5), 2172–2173. doi:10.1021/ja01161a082
Shintani, H., and Tanaka, H. (2008). Universal link between the boson peak and transverse phonons in glass. Nat. Mater. 7 (11), 870–877. doi:10.1038/nmat2293
Spano, T. L., Hunt, R., Kapsimalis, R. J., Niedziela, J., Shields, A. E., and Miskowiec, A. (2021). Optical vibrational spectra and proposed crystal structure of ε-UO3. J. Nucl. Mater. 559, 153386. doi:10.1016/j.jnucmat.2021.153386
Spano, T. L., Shields, A. E., Barth, B. S., Gruidl, J. D., Niedziela, J. L., Kapsimalis, R. J., et al. (2020). Computationally guided investigation of the optical spectra of pure β-UO3. Inorg. Chem. 59 (16), 11481–92. doi:10.1021/acs.inorgchem.0c01279
Sweet, L. E., Reilly, D. D., Abrecht, D. G., Buck, E. C., Meier, D. E., Su, Y., et al. “In spectroscopic studies of the several Isomers of UO3, Optics and Photonics for Counterterrorism, Crime Fighting and defence IX; and optical materials and biomaterials in Security and defence systems Technology X,” in International Society for Optics and Photonics, Bellingham, Washington, 2013 (SPIE).
Toby, B. H., and Von Dreele, R. B. (2013). GSAS-II: The Genesis of a modern open-source all purpose crystallography software package. J. Appl. Crystallogr. 46 (2), 544–549. doi:10.1107/s0021889813003531
Togo, A., and Tanaka, I. (2015). First principles phonon calculations in materials science. Scr. Mater. 108, 1–5. doi:10.1016/j.scriptamat.2015.07.021
Weller, M., Dickens, P., and Penny, D. (1988). The structure of δ-UO3. Polyhedron 7 (3), 243–244. doi:10.1016/s0277-5387(00)80559-8
Keywords: δ-UO3, UO3 polymorphs, uranium trioxide, UO3 Raman spectroscopy, UO3 synthesis
Citation: Spano TL, Shields AE, Niedziela JL and Miskowiec A (2022) Unexpected features in the optical vibrational spectra of δ-UO3. Front. Nucl. Eng. 1:995292. doi: 10.3389/fnuen.2022.995292
Received: 15 July 2022; Accepted: 18 October 2022;
Published: 31 October 2022.
Edited by:
Amy Hixon, University of Notre Dame, United StatesReviewed by:
Stefan Neumeier, Julich Research Center (HZ), GermanyShingo Tamaki, Osaka University, Japan
Copyright © 2022 Spano, Shields, Niedziela and Miskowiec. This is an open-access article distributed under the terms of the Creative Commons Attribution License (CC BY). The use, distribution or reproduction in other forums is permitted, provided the original author(s) and the copyright owner(s) are credited and that the original publication in this journal is cited, in accordance with accepted academic practice. No use, distribution or reproduction is permitted which does not comply with these terms.
*Correspondence: Tyler L. Spano, c3Bhbm90bEBvcm5sLmdvdg==