 Jarrod Lewis1,2*
 Ross Springell1*Christopher Bell1
 Rebecca Nicholls1
 Jacek Wasik1Lottie Harding1Mahima Gupta3
 Janne Pakarinen4
 Gianguido Baldinozzi5David Andersson6
 Xiaofeng Guo7
 Steven D. Conradson7*
- 1School of Physics, University of Bristol, Bristol, United Kingdom
- 2Materials Department, University of Oxford, Oxford, United Kingdom
- 3Meta Reality Labs, Sunnyvale, CA, United States
- 4VTT Technical Research Centre of Finland Ltd., Espoo, Finland
- 5SPMS CNRS, CentraleSupelec Universite Paris-Saclay, Gif-sur-Yvette, France
- 6Materials Science and Technology Division, Los Alamos National Laboratory, Los Alamos, NM, United States
- 7Department of Chemistry, Washington State University, Pullman, WA, United States
The different structures and behaviors of UO2+x observed in crystallographic and local structure measurements were examined by extended X-ray absorption fine structure (EXAFS) measurements of pristine UO2.0, p+ and He2+ irradiated UO2.0, and, at multiple temperatures, bulk U4O9 and U3O7 and thin film U4O9-δ on an epitaxial substrate. The disorder caused by irradiation is mostly limited to increased widths of the existing U–O/U pair distributions, with any new neighbor shells being minor. As has been previously reported, the disorder caused by oxidative addition to U4O9 and U3O7 is much more extensive, resulting in multisite U–O distributions and greater reduction of the U–U amplitude with different distributions in bulk and thin-film U4O9. This includes the significant spectral feature near R = 1.2 Å for all U4O9 and U3O7 samples fit with a U-oxo type moiety with a U–O distance around 1.7 Å. In addition to indicating that these anomalies only occur in mixed valence materials, this work confirms the continuous rearrangement of the U–O distributions from 10 to 250 K. Although these variations of the structure are not observed in crystallography, their prominence in the EXAFS indicates that the dynamic structure underlying these effects is an essential factor of these materials.
1 Introduction
Although research on uranium oxides is focused on their nuclear applications and resulting environmental and forensic issues, X-ray absorption spectroscopy and pump-probe measurements over the last 20 years demonstrate that the fundamental aspects of both equilibrium and photoexcited mixed valence materials are arguably even more intriguing (Conradson et al., 2004b; Conradson et al., 2005; An et al., 2011; Conradson et al., 2013; Gilbertson et al., 2014; Conradson et al., 2015; Conradson et al., 2017; Leinders et al., 2020; Kvashnina and Butorin, 2022). Crystallographic studies over the last 60 years of the putative single-phase compounds U4O9 and U3O7 have sought to determine the arrangement of the oxygen atoms within the conserved, fluorite-type uranium sublattice, but the extreme disorder has greatly complicated the search for a definitive answer. X-ray absorption fine-structure (XAFS) spectroscopy measurements have complicated these efforts by identifying aspects of the structure that not only contradict the crystallography but also highlight dynamic behaviors that question its applicability to the problem—a spectral feature indicative of a 1.7 Å U-O bond (Conradson et al., 2004a; Conradson et al., 2005) that only occurs with U(VI) and rearrangements of the U–O multisite distribution from 30 to 200 K despite the absence of a phase transition (Conradson et al., 2013). Here we present extended X-ray absorption fine structure (EXAFS) data on ion-irradiated UO2, bulk U4O9 and U3O7, and epitaxial U4O9-δ films that confirm these previous results and also show that these anomalous behaviors are limited to the mixed-valence compounds and not to disorder not associated with charge inhomogeneities. While demonstrating that these issues cannot be neglected in EXAFS studies, they only serve to augment this disparity with the conventional diffraction analyses without suggesting any path to its resolution.
Although its stable valences are limited to just IV, V, and VI (Verbist et al., 1976; Ilton and Bagus, 2011; Knope and Soderholm, 2013; Kvashnina et al., 2013), the U–O phase diagram could well be the most complicated of any binary oxide. In transition metal oxides, the polarizability of the O2- ion can cause strong electron–lattice coupling when the O 2p and the metal d states overlap. What is different about uranium is that the tension between the complex geometry of its frontier 5f orbitals and the steric constraints on the maximum number of neighbors is close enough to bond. In molecular complexes, this is manifested as the change from the radial geometries of U(IV) coordination complexes with up to ten or more first neighbors at longer distances to the highly oblate trans-dioxo complexes with their four to six equatorial ligands for the higher valences (Den Auwer et al., 2003; Knope and Soderholm, 2013).
However, the close packing of the atoms in a crystalline material also influences the local geometries and complicates the 5f stress. The problem with uranium oxides and related ternary uranates is that, in contrast to its well-defined coordination chemistry, the correlation in extended solids between valence, bond length, and geometry that defines chemical speciation is rapidly lost with increasing oxygen content (Knope and Soderholm, 2013). Instead of showing sharp peaks, the U–O pair distributions become broad and overlap, as in U2O5 with its essentially continuous U–O distances spanning the range from its 1.9 Å oxo-type bond through ∼2.5 Å (King, 2002). Identical behavior occurs in the ternary uranates (Rietveld, 1966; Dickens and Powell, 1991; Van den Berghe et al., 2002). The most extreme example is the terminal compound UO3. Although α-UO3 displays the highly oblate, trans-dioxo geometry found in molecular U(VI) complexes—with an even shorter, 1.64 Å U=O oxo bond—this distortion is diminished in the higher phases through δ-UO3 that has a rock salt structure with totally symmetric octahedral U sites (Engmann and Wolff, 1963; Debets, 1966; Greaves and Fender, 1972; Weller et al., 1988). This decoupling of the usual relationship between valence and bonding underlies the complexity of the binary uranium–oxygen system, with the O:U ratio continuous from 1.5 to 3.0 (Colmenares, 1984; Maccrone et al., 1986; Griffiths et al., 1994; Haire et al., 1994). The result is that there is no consensus even on the number of crystallographically distinct phases, which has been reported as 16 between UO1.5 to UO3 (Allen and Tempest, 1986) but also as many as 22 from just UO2 up (Allen and Holmes, 1995; Idriss, 2010).
Insofar as this diagram was developed primarily from X-ray diffraction (XRD) patterns in which the oxygen sublattice has only a minimal signature, in regions of continuous oxygen stoichiometry it is not necessarily complete or even an accurate description of the behavior of the materials as whole. Description of the microscopic mechanism for O addition in the fluorite structure that ends at U3O7 (Andersson et al., 2013) began 60 years ago (Willis, 1964; Willis, 1987; Garrido et al., 2003). The first complication is that the lattice constants of the three discrete phases—cubic UO2, cubic U4O9, and tetragonal U3O7—are within less than 1% of each other, contracting slightly between UO2 and U4O9 and then rebounding in U3O7 with its small tetragonal distortion. Exemplifying the difficulty with even the nuances of the synthesis, the differences between the reports from different labs at different times are greater than the value they find for the UO2–U4O9 contraction (Murray and Willis, 1990; Naito et al., 1990; Nowicki et al., 2000; Garrido et al., 2003; Popa and Willis, 2004; He and Shoesmith, 2010). Accounting for these experimental issues, the U sublattice that gives the large amplitude peaks in XRD is nevertheless relatively well defined. In contrast, the O disorder is so extensive that even exact solutions of their more symmetric high temperature phases have been elusive (Nowicki et al., 2000; Cooper and Willis, 2004; Garrido et al., 2006a; Garrido et al., 2006b; Desgranges et al., 2011). With increasing oxygen stoichiometry, U3O7 that terminates the fluorite structure before transformation to a layered one at U3O8 is even more problematic, starting with the ambiguity in its phase boundary composition (Andersson et al., 2013) and continuing with its variable tetragonal distortion that can change over time (Allen et al., 1987). Part of the difficulty is that the adventitious O clusters first become evident at x = 0.04 but could begin even lower. Furthermore, the variable intragrain phase separation between UO2, U4O9, and U3O7 causes substantial uncertainty in the structure determinations (Thompson et al., 2007), and, at sufficiently high temperatures, XRD shows only a single phase across the entire stoichiometry range.
These issues illustrate the departure of uranium oxides from the conventional crystallographic phase paradigm. Local structure measurements have only introduced additional complications. Extended X-ray absorption fine structure (EXAFS) spectroscopy and pair distribution function (PDF) analysis from total X-ray scattering give U–O distances that do not occur in the crystal structures. The first EXAFS measurements on UO2+x found short U–O pairs corresponding to U(VI)-oxo, or uranyl, groups, as well as substantial anharmonic U–U disorder (Conradson et al., 2004a; Conradson et al., 2005; Schofield et al., 2008). U(VI)-oxo species are not present in any of the increasingly elaborate models of UO2 oxidation (Bevan et al., 1986; Willis, 1987; Tempest et al., 1988; Murray and Willis, 1990; Nowicki et al., 2000; Garrido et al., 2003; Cooper and Willis, 2004; Geng et al., 2008; Andersson et al., 2009; Andersson et al., 2012). These groups subsequently performed neutron scattering PDF analysis (Garrido et al., 2006a; Garrido et al., 2006b) and ion channeling (Garrido et al., 2006b) measurements that found no U–O distances less than 2.15 Å. This was also true in calculations (Andersson et al., 2009; Andersson et al., 2012; Andersson et al., 2013) and confirmed by another neutron PDF measurement (Conradson et al., 2013). In fact, the highly oblate geometry of the UO22+ moiety from XAFS is incompatible with the UO2 structure, lacking a placement in the lattice that would not cause substantial strain. However, in the same report as the neutron PDF, the uranyl moiety was confirmed by X-ray PDF and again by EXAFS (Conradson et al., 2013). This incongruity was explained as originating in the sensitivity of the X-ray probes to dynamic instead of elastic structure as determined by elastic or time-of-flight neutron PDF and crystallography, a distinction that had become apparent in studies of cuprates that are also fractionally doped mixed-valence oxides (Conradson and Raistrick, 1989; Egami et al., 1991; Salkola et al., 1995; DeLeon et al., 1996; Bishop et al., 2003). However, this bias has persisted even when the feature it gives in the EXAFS spectra is clear, with it instead being interpreted as being a background artifact (Leinders et al., 2020) or simply ignored despite its omission in the fits (Gerber et al., 2021; Leinders et al., 2021; Poliakova et al., 2023).
Even more radical is the identification of temperature dependent changes in the structure in the absence of any crystallographic transformations or electronic phase transitions (Conradson et al., 2013). In terms of the magnitudes of the U–O displacements and the numbers involved, these are significantly more extreme than observed in cuprates. We here supplement our original measurements of bulk UO2, U4O9, and U3O7 at only 30, 100, and 200 K with those on ion-irradiated UO2 at 80 K and on epitaxial thin film U4O9-δ at seven temperatures from 10 K to 240 K. The absence of substantial lattice distortions in the irradiated samples shows that these are not a common factor in disorder and therefore originate in the mixed valence character of the materials. The U4O9-δ spectra not only confirm these fluctuations in UO2+x but now, with the addition of curve-fits, the calculation of metrical factors show that the bulk and film materials exhibit different patterns of U–O geometries. The effects of these dynamics on the valence and charge distribution in UO2+x are masked in these measurements by the relatively small changes in the broad, featureless U L3 XANES across this range (as also occurs with Pu: Conradson et al., 2004b); although of great interest, these are outside the scope of this report. They are, however, likely to be coupled with the anomalies found in the much more sensitive O K XAS and non-resonant inelastic X-ray scattering spectra of UO2-made mixed valence by both oxygen doping (Conradson et al., 2013) and photodoping with femtosecond laser pulses (Conradson et al., 2016; Conradson et al., 2017).
2 Materials and methods: application of EXAFS to disordered materials
The utility of EXAFS to probe the structural chemistry of disordered materials is its capability for identifying and characterizing local lattice distortions (Conradson, 1998). We define this as atoms that do not conform to the long-range ordered structure of the material, such as that determined by refinement of diffraction patterns, because they are not residing on crystallographic lattice sites. They are, however, locally ordered due to bonding considerations that cause their pairwise distances to be uniform to give narrow, sharp peaks in their pair distribution. Relative to PDF analysis of wide-angle neutron or X-ray scattering patterns, the inverse square dependence of the EXAFS amplitude cuts it off beyond the first few neighbor atom shells; in practice, it cannot be applied to light atom absorbers. It can also be handicapped by multiple scattering contributions to the spectra caused by the strong scattering of electrons. In the aperiodic structure that motivates the EXAFS measurement, the unknown angles and thermal distributions of the offsite atoms involved in the multiple scattering paths prevent their calculation. PDF analysis can also give the impression of being superior because the typical presentation of EXAFS as its Fourier transform (FT) is misleading, exacerbated when only the modulus. The broadness of the peaks is caused by the finite range of the data and is much greater than the actual resolution of the data (ΔR = π/2kmax). Nevertheless, the overlap of the peaks gives the appearance of uncertainty in the analysis. In addition, whereas the fact that EXAFS has a phase as well as an amplitude doubles the information content relative to scattering, the destructive interference distorts the FT so as to lose its resemblance to the partial pair distribution. Of course, these considerations do not affect the analysis by curve-fitting. The actual problem is the uncertainty in the pairwise amplitudes and Debye–Waller factors that will differ from the calculated ones (Ankudinov et al., 1998; Rehr et al., 2009) commonly used to fit EXAFS spectra by up to 30% because of their dependence on the chemical environments. Significant uncertainty is introduced into these numbers in the neighbor shells by the inability to accurately obtain the low k amplitude before the correlation between the numbers of atoms and the Debye–Waller factors modifies the spectra at higher energies. This is exacerbated in disordered material that exhibits non-Gaussian static as well as thermal broadening of the atom pairs.
This sensitivity, however, is also a strength. Whereas a structure based on a single EXAFS measurement may be questionable, EXAFS is arguably the best method in a series of measurements on related samples varying a selected extrinsic parameter for elucidating even small changes in chemical speciation that are coupled to a material’s properties and performance. One of the most significant advantages of EXAFS is its separation of the overall pair distribution into the partial ones of the individual absorbing elements, often enhanced by sample orientation in the polarized X-ray beam. This property of EXAFS greatly reduces or eliminates the overlap of the signals from the atom pairs and allows them to be examined separately with substantially improved precision. A change in the local structure of a particular atom pair may be difficult to discern in PDF analysis because it is the sum of all of the pairs that may overlap in the region of interest, complicating the identification and characterization of the target signal. Instead of being obscured, this same change may dominate the EXAFS of the isolated contribution of the affected neighbor to the central, absorber atom. We have, in fact, focused on these last two factors in our analyses of many systems. As a complement to tabulating curve-fit results, we have developed a methodology for directly imaging the spectral contributions of the atoms responding to the changes in, for example, composition or temperature, by separating their individual waves from the total spectrum (Conradson et al., 2014a; Conradson et al., 2014b; Batuk et al., 2015; Conradson et al., 2020). This becomes especially important when those changes include anharmonicity, which drastically reduces accuracy in determining the numbers of atoms in the neighboring shell via curve-fitting. This approach is incisive in these studies of UO2+x.
2.1 Data acquisition and analysis
All measurements were performed at the Stanford Synchrotron Radiation Lightsource with Si(220) crystals in the monochromator. Irradiated samples were measured in a liquid nitrogen reservoir cryostat using an ionization-type fluorescence detector. The irradiated layer was selected by tilting the samples to an angle shallow to the incident beam. Bulk samples were measured in transmission using an open-cycle liquid helium refrigerator. Thin film samples were mounted on the cold finger of a close-cycle helium refrigerator and measured in continuous scanning mode with three Ge detector channels to avoid interference from the diffraction peaks of the single crystal substrate. Spectra were self-calibrated from the bulk absorption edge values that had originally been assigned relative to a Zr foil converted to absorbance, the absorption edge jump normalized to unity, and the EXAFS extracted by approximating the smooth background above the near-edge region with a spline polynomial whose parameters were adjusted to minimize the amplitude of the Fourier transform modulus below R = 1.2 Å.
Curve-fits were performed from k = 3.2–12.5 Å−1 for the irradiated samples, 2.6–14.0 Å−1 for the bulk samples, and 3.3–12.5 Å−1 for the films using amplitudes and phases calculated with the Feff 9 code (Rehr et al., 2010). The distances, numbers of atoms, Debye–Waller factors, and ionization energy corrections were varied, although for many spectra, the Debye–Waller factors were fixed and a number of parameters were constrained over limited ranges, often coupled to other parameters for other shells/waves. This was essential because of the disorder and high degree of correlation between the overlapping waves of the disordered structure. Here, destructive interference could marginally improve a fit by greatly increasing the amplitudes of two waves to unphysical sizes that nevertheless cancelled each other to give only a small change in their sum that was slightly close to the experimental spectrum. This same interference also necessitated the large number of waves; fitting a feature in the spectrum often caused new, relatively large features to appear in the difference because, although deceptively simple in appearance, it had originated in either a broad, anharmonic distribution or a multipeaked distribution. The curve-fits are best interpreted not literally but rather as modeling the overall U–O distribution, especially when the distances of two shells are below or only slightly larger than the spectral resolution and exacerbated when the contribution of one of them is relatively small. This consideration motivates our preference for the more qualitative visual analysis we present.
In addition to the above aspects of disorder in this system, UO2+x presents problems specific to its EXAFS. The disorder in the U–O pairs causes rapid damping of their signals while simultaneously shifting the details of the pair distribution to higher energy, necessitating k3 weighting of the spectra. However, amplifying the high energy region of the spectrum greatly magnifies the spectral weight of neighboring U atoms because of the shift of the amplitude envelope to higher energy with increasing Z of the neighbor. This disparity in the amplitude–energy correlation of the two neighboring elements increases the uncertainty in the analysis for U–O distances beyond the limit of the nearest neighbor oxygen region at ∼3 Å.
A detailed analysis of some spectra found that this problem is exacerbated by the Ramsauer–Townsend effect (McKale et al., 1988; Hanham and Pettifer, 2001) with the high Z U that causes a phase shift around k = 3–5 Å−1 where the amplitude of the U–U wave is low, which is challenging to both calculate and curve-fit. A thorough examination of the curve-fit results revealed what may be a unique problem originating in the continuously increasing U–U wave amplitude and noise with k3 weighting. Close inspection of the U–U wave in its original k dependence showed that at the initial region of the curve-fit at k = 2.6 Å−1, where it is quite low in amplitude relative to the O waves, this spectral component was offset from zero while still exhibiting the high frequency corresponding to the 3.86 Å distance. This observation contradicts the presumption that the background calculated by the spline should cause the EXAFS to integrate to zero. However, χ(k) at low energy is not well defined and can include XANES features in addition to the EXAFS. The coupling of these to the U–O waves at low k in combination with the relatively minor U–U component could have caused this shift of the U wave baseline in the EXAFS. The large U–U amplitude at high k ensures that this error would be corrected in that region, but the U–U frequency connects it to the U–U wave so that, instead of the offset giving a low frequency feature, it affects the U–U wave below the main peak where the Ramsauer–Townsend phase shift occurs that also has this effect on χ(R) (McKale et al., 1988; Hanham and Pettifer, 2001). Coincidentally, it can be well fitted by U–O waves when their U–O distance corresponds to this same frequency.
2.2 Bulk samples
Three samples of nominal UO2.00 (Figure 1) were prepared at ITU in 2003 (Conradson et al., 2004a), at LANL in 2008 (Conradson et al., 2013), and at INL in 2012 (Pakarinen et al., 2014a; Pakarinen et al., 2014b). They were subsequently measured on different end stations at SSRL at 80–100 K using LN2 and open cycle LHe cryostats in both transmission (LANL) and fluorescence with an ionization type detector. The EXAFS of UO2.00-UO2.20 at 80 K and of UO2.0, U4O9, and U3O7 at 30, 100, and 200 K have been reported in the cited studies, with the former subjected to complete curve-fitting analysis and the latter presented only as a comparison of their χ(R) spectra supplemented by X-ray and neutron pair distribution function results. The EXAFS of the irradiated and U4O9-δ film samples have not been presented previously.
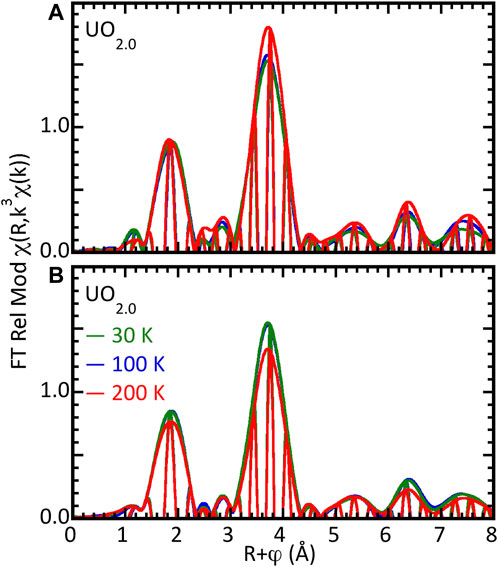
Figure 1. Reproducibility of EXAFS χ(R) spectra of nominal UO2.00 samples. (A) Three separate samples of UO2.0 at 80–100 K measured over 15 years. (B) Bulk UO2.0 sample at three temperatures.
2.3 Preparation of irradiated samples
Polycrystalline UO2.00 pellets for irradiation (Pakarinen et al., 2014a; Pakarinen et al., 2014b) were prepared by sintering powders followed by cooling in an Ar-6%H mixture to obtain an O/U ratio of 2. Purity and stoichiometry were confirmed by XRD. The pellets were sliced to 0.6 mm disks with a low-speed diamond saw in a radiological hood and polished to mirror finish prior to irradiating. A toroidal volume ion source (Torvis) coupled to a Pelletron tandem accelerator (University of Wisconsin-Madison) were used for irradiations with 2.6 MeV H+ and 3.9 MeV He2+ ions to fluences of, respectively, 1.4, 7.1, and 14.1 × 1017cm−2, corresponding to 0.01, 0.05, and 0.10 displacements per atom (dpa), and 1 and 5.0 × 1015cm−2 corresponding to 0.01 and 0.05 dpa. The sample temperature was monitored with thermocouples attached to the sample stage adjacent to the UO2 disks. The ion beam was rastered across the specimens and the beam current and specimen temperature were recorded throughout the irradiations. For the EXAFS measurements, the pellets were mounted on the cold finger of a liquid nitrogen cryostat at a shallow angle to the incident beam and measured in fluorescence mode. At this angle, the irradiated depth exceeded the X-ray penetration depth so that only the relatively homogenous displacement dose plateau was probed while surface contribution remained small, and the peak implantation region did not contribute to the measured spectra as it would have in a purely surface measurement.
2.4 Preparation of U4O9-δ film
A 0.5 micron epitaxial thin film of near-stoichiometric UO2 was grown as reported by Springell et al. (2015) and Rennie et al. (2018) by reactive DC magnetron sputtering of a depleted U target in a dedicated actinide ultra-high vacuum deposition system at the NNUF FaRMS facility at the University of Bristol, United Kingdom. The base pressure of the system was 1 × 10⁻¹¹ mbar, but during sputtering with Ar [ρ(Ar) = 7.7 × 10⁻³ mbar] a partial pressure of O2 [ρ(O2) = 2 × 10⁻⁵ mbar] was introduced such that the thin film deposited onto the substrate was of UO2. The substrate used was a 10 mm3 × 10 mm3 × 1 mm3 CaF2 single crystal substrate with a polished (100) oriented surface, sourced commercially from MTI Corp. CaF2 was chosen due to the high degree of epitaxial alignment between CaF2 and stoichiometric UO2, facilitating the formation of a single crystal thin film atop the single crystal substrate. During deposition, the substrate was heated to 500 °C to further promote single crystallinity within the film. The resulting thin film crystallinity and increase in oxygen stoichiometry from the original UO2 was confirmed ex-situ using XRD. The stoichiometry of the thin film was then tailored ex-situ by oxidative annealing at 150 °C for 30 min under a flow of 200 mbar of O2. Ratioing of XPS peaks measured on the original surface and the subsurface region that was exposed by very mild Ar+ sputtering gave a value within the uncertainty for U4O9, with the “-δ” designating the possibility of inhibited oxygen diffusion throughout the entire film at its thickness. The limiting U4O9 stoichiometry has been demonstrated in tests with higher annealing temperatures and longer times (Stubbs et al., 2017; Spurgeon et al., 2019).
3 Results
3.1 EXAFS of UO2.00
A necessary starting point for elucidating the structural chemistry of oxygen addition to UO2 by EXAFS is the baseline for the reliability of the measurements themselves. This is evident in Figure 1. Three samples of nominal UO2.00 were prepared at ITU in 2003, LANL in 2008, and INL in 2012 and were subsequently measured on different end stations at SSRL at 80–100 K using LN2 and open cycle LHe cryostats in both transmission (LANL) and fluorescence with an ionization type detector. These all exhibited identical nodes in the real components of their χ(R) spectra and relatively small differences in their amplitudes. As discussed above, due to the continuously increasing U amplitude with k3-weighting, the amplitude variation is largest for the U contribution and also increases with increasing distance as the effects of disorder that will occur even in crystallographically single-phase stoichiometric material take effect. This distance effect is, however, relatively minor. All spectra clearly show the same pattern of features at higher R that are a fingerprint for the fluorite structure. Insofar as the region from R = 2.4–3.0 Å is free from spectral features in the fluorite structure, the small R = 2.5 Å modulus peak in the spectrum of the INL sample most likely originates from an impurity. An important point with respect to the finding of oxo-type neighbors at a very short U–O distance is the small feature at R = 1.2 Å with 0.09–0.17 modulus amplitude for this k = 2.8–13.5 Å−1 transform range. For UO2.00, this is a side lobe of the O peak. Since this is at the upper limit of frequencies removed by the background subtraction with the spline polynomial, the different backgrounds affect its amplitude more than that of the O peak with its much larger amplitude. In addition, we showed previously that the real component of this side lobe does not match that from an O neighbor (Conradson et al., 2004a). In summary, the experimental measurements for these samples are highly reliable and will have minimal to negligible effects on their analysis, with further details on the curve-fit results for these samples included as Table 1.
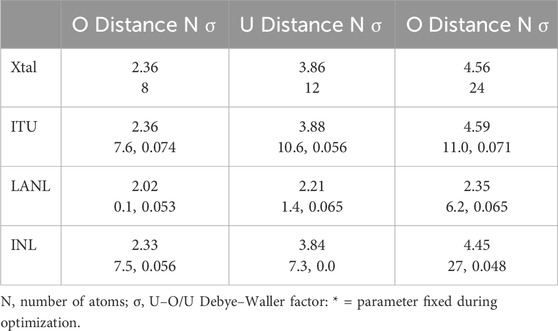
Table 1. UO2.0 curve-fit results for U–O <3 Å, U and 4.5 Å U–O.
3.2 Structural chemistry of ion irradiation
A means of inducing disorder without U oxidation and its insertion of adventitious, hyperstoichiometric O is ion irradiation. The 300–400 °C temperatures caused by heating from the ion beam are modest relative to the 800–1,500 °C of the pellet during operation. The resulting inhibition of the annealing of higher defect concentrations along the ion track near the surface could promote the formation of defect clusters (Weber, 1981; Guimbrètiere et al., 2012; Pakarinen et al., 2014b). Although the He2+ doses were most likely below the clustering threshold (Weber, 1981) and no visible signs of damage were observed with these He2+ doses, the p+ doses were sufficiently high to cause blistering of the surface and laminar fractures, despite which expansion of the lattice constants symptomatic of defect clustering did not occur. EXAFS measurements would indicate if oxygen displacements caused local composition fluctuations.
The EXAFS spectra of these UO2.0 samples irradiated with proton and helium nucleus ion beams are shown in Figure 2. The significant reductions in amplitude of the O and especially U modulus peaks indicate that the total effects on the structure and its ordering are amplified beyond the nominal numbers of displacements. Amplitude ratio analysis showed that the very similar decrease for the highest doses of both p+ and He2+ is in both the linear and exponentially damped components of the overall amplitude envelope. This contrasts with oxidation where the decrease in the U amplitude from UO2.00 to UO2.20 was purely linear with increasing O stoichiometry (Conradson et al., 2004a). The induced disorder from irradiation causes both Gaussian and anharmonic broadening. In terms of local lattice distortions from O within 3 Å of the U, some of the samples exhibit negligible to minor contributions from O with a U–O distance of 1.99–2.05 Å (Table 2), but good fits of the samples with >0.01 dpa require O shells around 2.2 and 2.35 Å, as can be seen in the figure. The 0.15 Å separation is close to the 0.125 Å resolution limit for this data range. This result in combination with the difference in amplitude implies that instead of these two shells being distinct neighbors, the U–O nearest neighbor distribution that is narrow in UO2.00 is anharmonically broadened by the strain from the displaced atoms. This would also affect the U–U distribution. Beyond these two O neighbors, complete fits of all of these spectra include an O at 2.83–2.92 Å, although this is also uniformly small. The exception is the spectrum from the lowest dose proton-irradiated sample. Although this fit includes three O shells at 3.29–3.76 Å, interference causes their sum to be quite low. Insofar as the spectrum in this region is almost identical in shape to the others, it is likely that a fit insignificantly worse than this could be obtained with a constrained fit using much smaller individual amplitudes—these neighbor shells are either not present or are much smaller than indicated by these fits. As discussed above, this spectrum serves as a caveat against using multiple, relatively large shells to model EXAFS that is much lower in amplitude than their individual contributions of the fits.
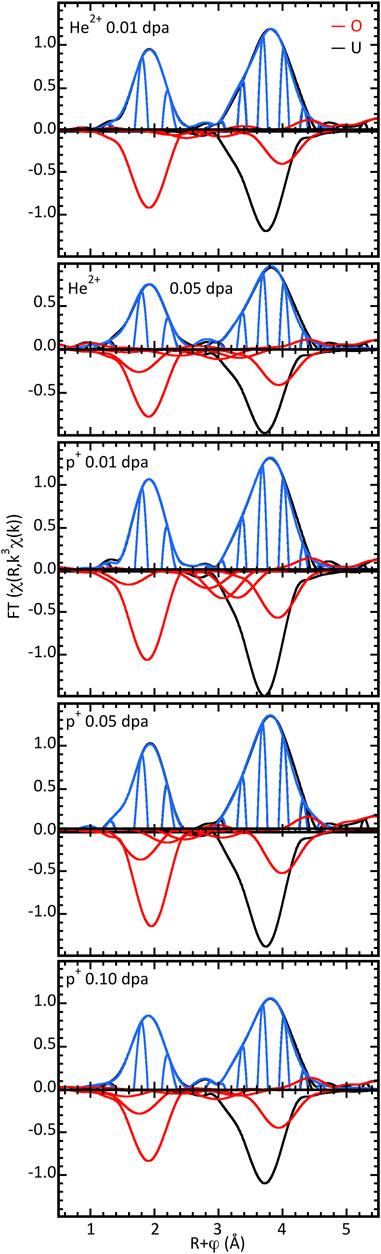
Figure 2. χ(R) spectra of irradiated nominal UO2.00. FT calculated over k = 3.2–12.5 Å−1 using a different E0 value than for the other spectra, causing the shift in the real component nodes. Top halves show data, fits, and differences, lower halves show the moduli of the individual O and U shells constituting the curve-fit.
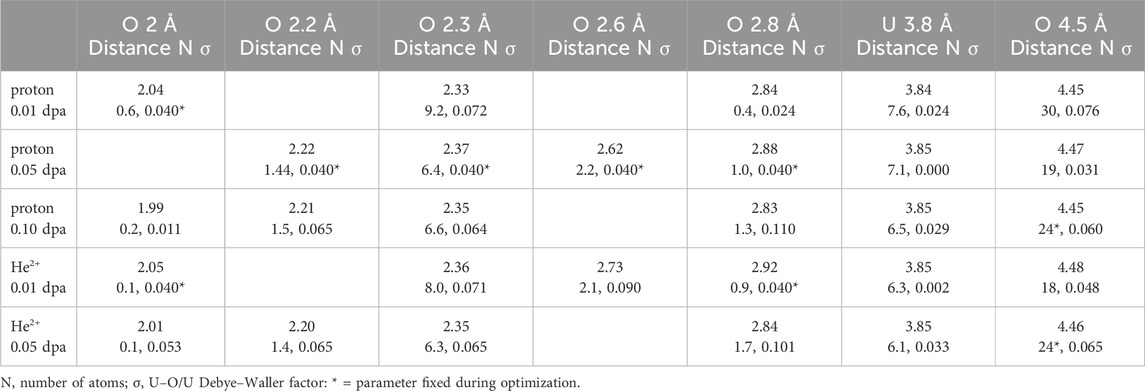
Table 2. Irradiated UO2 curve-fit results for U–O <3 Å, U and 4.5 Å U–O.
What is notable about radiation-induced disorder is, vide infra, it exhibits a different motif than oxidation. There is no indication of the very short U–O distance that is the signature for an oxo/uranyl group. Spectral features below the principal O peak are only half the amplitude of those assigned to this moiety. They are well fit by the two overlapping ones for the main peak, leaving only miniscule or no residual even when a spectrum displays a shoulder of it that continues to lower R. There is therefore no evidence that the displaced oxygen atoms aggregate into U4O9-like domains that would be offset by O-depleted ones.
3.3 Local structure and temperature dependence of bulk U4O9 and U3O7
As an extension of our earlier presentation of these spectra (Conradson et al., 2004a) we have applied the shell-separation approach (Conradson et al., 2014a; Conradson et al., 2014b; Batuk et al., 2015; Conradson et al., 2020). The first step is curve-fitting the total spectrum, followed by selecting a target neighbor shell. Its χ(k) EXAFS is isolated from the others by subtracting all other U–O and U–U waves from the original energy spectrum. Its corresponding χ(R) for visualization and comparison is obtained by Fourier transforming this residual. The curve-fits are therefore not the final results but an intermediate step in the analysis. The detrimental effects of inaccuracies in the calculated amplitudes and phases, in the use of harmonic pair distributions, and in the presumed structure are therefore minimized because the objective is to reduce their spectral contributions below that of the target neighbor shell. Having previously shown that the EXAFS of these hyperstoichiometric mixed-valence compounds change with temperature from 30 to 200 K in the absence of a phase transformation, we now identify the components of the structure in which these changes originate.
An immediate observation is that the modulus amplitudes are quite low, only half or less of those from the irradiated UO2 (Figure 3). Corroboration is provided by the original UO2.20 spectrum (Conradson et al., 2004a) that not only displays similar amplitudes but also has the same pattern of modulus peaks as the U4O9 sample at 100 K, which is closest it in terms of composition and temperature. For the U, this substantial reduction is because of the amplification of the FT modulus by the continuous increase in the amplitude of the U–U wave through the high energy end of the spectrum with k3-weighting. When the damping from the disorder causes the U–U amplitude to be flat throughout the energy spectrum, as for these spectra, the modulus amplitude is only half or even less. Greater disorder builds on this amplitude reduction of the modulus such that the latter is lower for U3O7 than U4O9 at 200 K. The amplitude from the O neighbors is low because of its splitting into a multisite distribution, evident in the several peaks and shoulders and in the subsequent destructive interference between the overlapping waves.
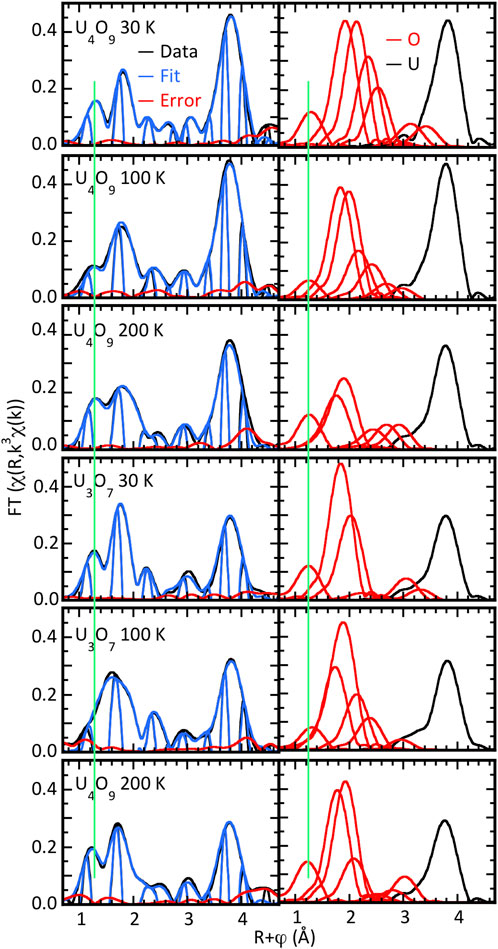
Figure 3. χ(R) spectra of UO2+x samples at indicated temperatures calculated over k = 2.6–14.0 Å−1. Left half is data, fits, and differences; right halves show the moduli of the individual O and U shells constituting the curve-fit.
The complexity of the overall O contribution is evident in all spectra. A feature of note is the peak or shoulder at R∼1.2 Å that is completely and consistently fit by an O at 1.65–1.73 Å for U3O7 and 1.68–1.69 Å- for U4O9 (highlighted by the green line in the figures). The numbers of this O atom calculated by the curve-fits are only a few tenths, but the inverse square distance dependence of the amplitude and small Debye–Waller factor result in its substantial amplitude in the spectrum despite its low abundance in the actual material. The close to exact correspondence of the amplitude and phase with a U–O wave and large error in fitting the side lobe in the UO2 spectrum with O and the insensitivity of the O fit to different background parameters meet the dual criteria of sufficiency and necessity. Additional confirmation was provided by the presence of this neighbor shell in the Fourier analysis by maximum entropy calculation (Conradson et al., 2013), which also required that the amplitude and phase in the spectrum match the U–O parameters that served as input. Although distances below ∼1.7 Å are significantly shorter than in U coordination compounds, they are longer than the 1.64 Å U-oxo distance reported for α-UO3 that therefore serves as a precedent (Greaves and Fender, 1972).
Continuing the curve-fitting of the nearest neighbor O contribution consistently identifies two overlapping shells at 2.15–2.55 Å. Inspection of Table 3 shows no discernible trend in their U–O distances that are, for U4O9, 2.31 and 2.51 at 30 K, 2.24 and 2.40 Å at 100 K, 2.19 and 2.34 Å at 200 K, and for U3O7, 2.24 and 2.43 at 30 K, 2.15 and 2.32 Å at 100 K, and 2.19 and 2.34 Å at 200 K. Although fit component amplitudes larger than the spectral features being fit often indicate overdetermination of the data, that is not the situation here as the total number of O atoms they represent remains below eight and all are smaller than the modulus peak in UO2 from its fully ordered O neighbor. Fitting the small peak at R = 2.2–2.4 Å requires a third neighbor at 2.49–2.65 Å that ranges in amplitude from negligible to almost as large as the other two. Completing that region and the next smaller peak around R = 3 Å requires additional shells through 3.5 Å. The issue of whether the metrical parameters from the curve-fits can be assigned to actual, discrete neighbor shells as in ordered systems again resides in their overlap and subsequent interference between their signals. The large numbers of neighbors occurring at 0.2–0.4 Å intervals exacerbates the uniqueness problem. The minimum in the curve-fit error is so shallow that the numbers of atoms calculated by the fits can extend over a wide range with no significant change in this metric for the quality of the fit, even when the total numbers of neighbors and the Debye–Waller factors are constrained to physically realistic values. The best interpretation is that the results represent a broad, continuous distribution across the total distance range of the curve-fits whose shape resembles the sum over the shells, often with additional broadening. Using this interpretation still assists in characterizing the structure. Two conclusions for these samples are that the only O neighbors with U–O distances less than 2.1–2.2 Å are the oxos and that the adventitious O is not inserted into discrete locations to give a locally ordered structure but define a distribution that is at least semi-continuous.
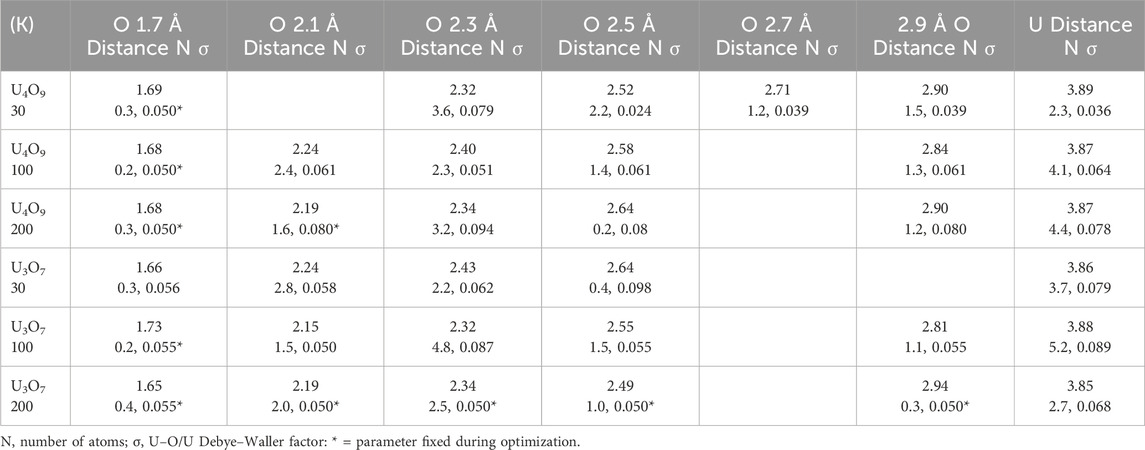
Table 3. Bulk U4O9 and U3O7 temperature dependence curve-fit results for U–O <3 Å, U and 4.5 Å U–O.
The question of whether the changes in the spectra over the 30–200 K originated in only a few U–O pairs with others being invariant or whether all of them were affected is examined by applying the shell separation method described above to the four O neighbors with U–O < 2.7–2.8 Å (Figure 4). The FT real components visualize the distances and amplitudes for each region more effectively than just the numerical parameters. The changes in the nodes caused by shifts in the U–O distances and the varying amplitudes demonstrate that the shifting of atoms throughout the continuous U–O distribution is the better scenario. O atoms are moving towards and away from the central U with no discernible correlation with temperature for both U4O9 an U3O7, and the resulting changes in amplitude modified by interference are larger than any changes in the numbers of O in those regions. The possible exception is the U-oxo pair for which the distances are relatively invariant and the amplitudes are smaller at 100 K and larger at 30 and 200 K for both compounds. The conservation of the distance is consistent with this being the strongest U–O bond and its separation from all the other U–O pairs. The behavior therefore is more like fluctuations than a transformation.
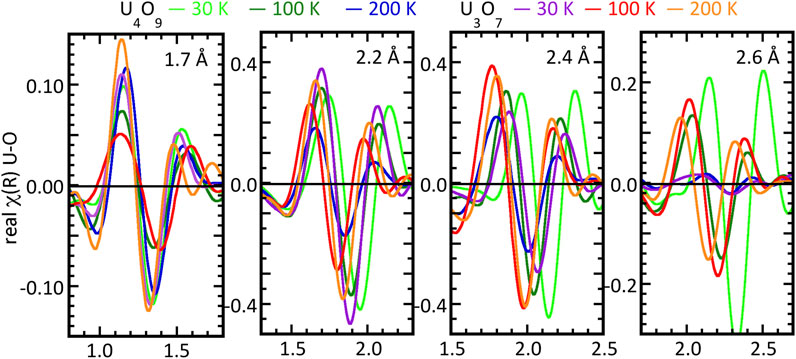
Figure 4. Temperature dependent fluctuations in the U–O geometry of bulk U4O9 as the real components of χ(R) spectra of isolated contributions of the different types of O neighbors identified in the curve-fits at 30, 100, and 200 K. The 1.7 Å panel shows these data for U4O9 and U3O7 with U–O distances (cf. Table 3) of 1.69, 1.68, 1.68, 1.66, 1.73, and 1.65 Å, the 2.2 Å panel with U-O distances of 2.32, 2.24, 2.19, 2.15, and 2.19 Å, the 2.4 Å panel with U–O distances of 2.52, 2.40, 2.34, 2.43, 2.32, and 2.34 Å and the 2.6 Å panel with U–O distances of 2.71, 2.58, 2.64, 2.64, 2.55, and 2.49 Å. The isolation process is described in the text.
3.4 Local structure and temperature dependence of an epitaxial U4O9-δ film on a CaF2 substrate
Complementing the bulk U4O9 is an epitaxial U4O9-δ film. EXAFS spectra were obtained at 10, 35, 80, 120, 160, 200, and 240 K. Beyond the two primary peaks from the nearest neighbor O and second neighbor U characteristic of the fluorite structure, the first result is that the amplitudes are much higher and the O contribution is much simpler than in the bulk materials (Figure 5). The EXAFS therefore indicates that the films are significantly more ordered, most likely because the atoms are epitaxially constrained by the substrate. The corollary to this result is that consistent with our interpretation of the bulk sample EXAFS, the pair distributions have substantial continuous character without specific well-defined atom positions and bond lengths. It is also consistent with the difficulties inherent in the crystallography of UO2+x, even regardless of the fact that instead of determining distributions with respect to the unit cell, correlated thermal motion of atom pairs gives a short-range order different than the long-range average.
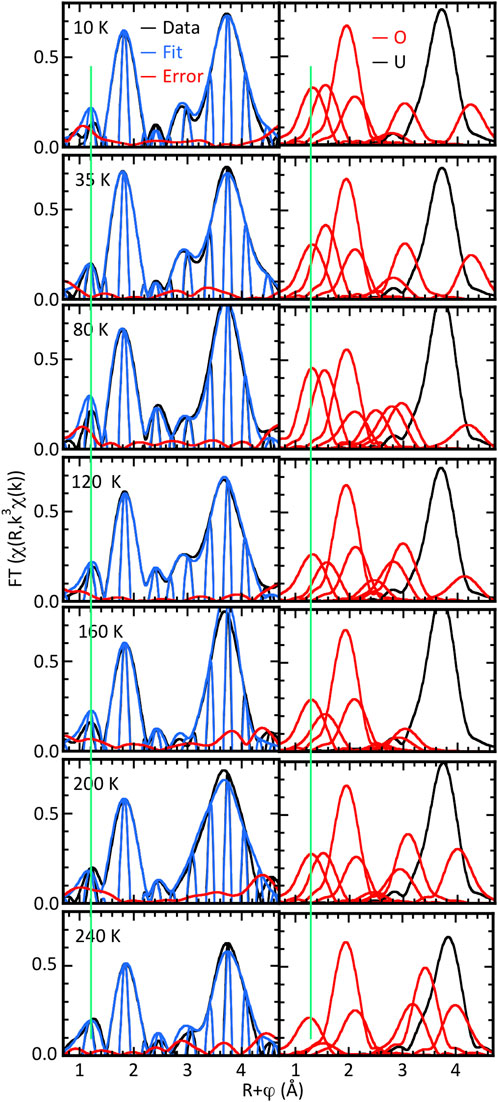
Figure 5. χ(R) spectra of U4O9-δ film sample at indicated temperatures calculated over k = 2.6–13.0 Å−1. Left half is data, fits, and differences; right halves show moduli of the individual O and U shells constituting the curve-fit.
Curve-fits of the spectra, however, show that the local structure has both similarities with and significant differences from the bulk materials (Figure 5). They also illustrate the paradox that interference within the EXAFS from disorder can cause spectra that appear simple to actually be quite complicated. As with the UO2+x spectra, a prominent peak at R = 1.2 Å is present at all temperatures, although here it is well separated from the primary oxygen feature. Insofar as the real component peak is at the same position as in the bulk sample spectra, it is well fit by an O neighbor at a somewhat longer distance, 1.70–1.75 Å, and with a larger number of atoms, ∼0.6, consistent with the larger modulus amplitudes (Table 4). The primary nearest neighbor O at R∼1.9 Å is large and narrow because, with the exception of 80 K, it has as its principal constituent a single shell at 2.35–2.37 Å. This 0.02 Å range is within the experimental error and is only a small fraction of the variation in the bond lengths of the bulk samples. Another significant difference is that complete fits of these spectra all require an O at 1.94–2.00 Å in contrast to the bulk samples, where no O were found in this region. Interference among these three overlapping neighbor shells is how the contributions of the uranyl and these primary O neighbors appear so well separated in terms of the modulus at R∼1.5 approaching 0 in χ(R). In common with the bulk samples is an O neighbor at 2.53–2.56 Å whose modulus peak is around half as high as the principal one. The total numbers of O atoms from these near neighbors are within the upper limit of 8, but the correlation between the numbers and Debye–Waller factors again causes a shallow minimum in the fits that would make tabulation of these numbers misleading by implying discrete neighbors at those locations. The qualitative depiction in the figure that shows the overlap of the neighbors provides the best interpretation of the results.

Table 4. U4O9-δ film temperature dependence curve-fit results for U–O ≤3 Å, U and 4.5 Å U–O.
Also similar to the bulk samples are O shells at longer distances that give the features above R = 2.6 Å, including the modulus structure around R = 3 Å on the side of the principal U contribution at R = 3.7 Å. Consistent with the discussion of the coupling of the Ramsauer–Townsend resonance to the background and the U–O waves, these are not only larger but much more variable. This scenario could explain the larger errors in the U–U distance in the 200 and 240 K spectra where the higher temperature results in a larger Debye–Waller factor and lower amplitude while the amplitude of the O shell fitting this region increases. It could be expected that the effects of this offset would also modify the O contribution. If, however, they simply matched the first low-frequency oscillation of the U–O wave they would combine with the number of atoms/Debye–Waller factor correlation that, in these disordered structures with overlapping shells, is non-trivial to deconvolute. We will therefore omit discussion of the results for the O neighbors at the longer distances found by the curve fits.
Examination of the spectra in Figure 5 indicates that, if the features around R = 3 Å are excluded, the O near neighbor contributions do not show significant changes with temperature as occur in the bulk material. However, subtracting the principal O at 2.36 Å gives a different result (Figure 6). Examination of the modulus and real components of these residuals shows that for 10–120 K, the three modulus peaks are in the same positions, although somewhat lower for 10 and 120 K, and the highest is shifted 0.1 Å higher at 80 K. This pattern is repeated for the real component except that the peak at R = 1.8 Å has flattened at 120 K. In contrast, the moduli for 160 K and 240 K have a different shape for R = 1.5–2 Å, and at 200 K it goes to zero at R = 1.8 Å. This departure from the low temperature pattern without establishing a separate trend is repeated in their real components.
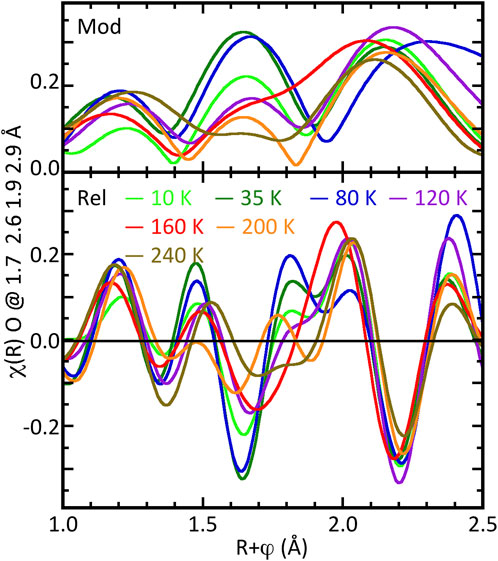
Figure 6. Temperature dependent fluctuations in the U–O geometry of thin film U4O9-δ as the real components of the χ(R) spectra of U4O9-δ film samples at indicated temperatures after removal of principal O contribution at 2.36 Å. The modulus is in the upper part, the real component in the lower.
Further assignment of these changes in the spectra with temperature to the specific neighbor shells was performed by the same method as used for the bulk samples’ isolation and direct comparison of the real components of χ(R) of the individual neighbor shells (Figure 7). This procedure also gives a result for the U4O9-δ films that is significantly different from the bulk samples. The principal O neighbor with the 2.36 Å U–O distance is essentially invariant over this entire temperature range. Corroborating the curve-fit results, the O neighbors at 1.72 and 2.55 Å also exhibit minimal changes in their distances. Insofar as the spectral features associated with these neighbors are anomalously high in the 80 K spectrum, it is unclear whether their display of, respectively, the highest and lowest amplitudes in these data indicate a shift in the structure at this temperature or are related to the noise level. The 1.72 Å feature does divide into higher and lower amplitude sets, but randomly across the three extremes. This leaves the 1.97 Å neighbor as the source of the changes observed in the total residual for 160 K and above, which is the observed result. The 10, 35, and 80 K spectra exhibit almost identical positions in their extremes, with the amplitude for 10 K being slightly lower. The 120 K spectrum begins to depart from the others with a lower amplitude and small shifts in position, as do the 160 and 200 K spectra, with the shifts going in different directions. By 240 K, the difference from the others is substantial. This behavior parallels the reduction in the amplitude of this feature with increasing temperature found by the curve fits (Figure 5). To the extent that the results in Figure 6 are larger over a greater width, there could be amplification via the interference with the other shells despite their separation that is much larger than the experimental resolution. Alternatively, and more likely, is that although the multiple shell fits appear overall complete, this particular shell with U–O ∼ 2.0 Å has an anharmonic distribution that increases beginning at ∼100 K and ultimately almost eliminates its contribution by 200 K. This scenario that does not involve displacements of the O into the other neighbor positions would be consistent with the absence of an increase in their amplitudes corresponding to the decrease in this one.
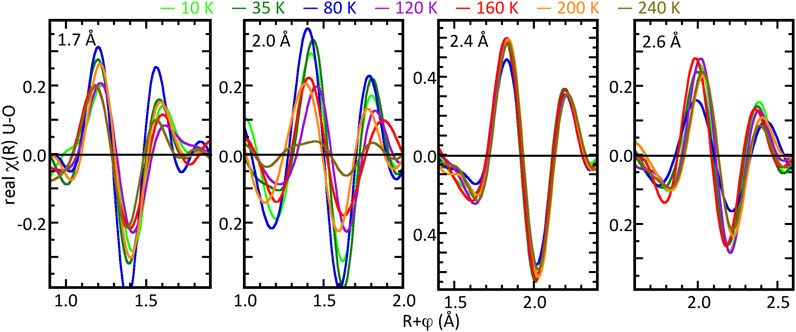
Figure 7. Temperature dependent fluctuations in the U–O geometry of thin film U4O9-δ as the real components of χ(R) spectra of isolated contributions of the different types of O neighbors identified in the curve-fits at 10, 35, 80, 120, 160, 200, and 240 K. The 1.7 Å panel shows these data for U4O9-δ with U–O distances (cf. Table 3) of 1.66–1.73 Å, the 2.0 Å panel with the U-O distances of 1.95–2.09 Å, the 2.4 Å panel with U–O distances of 2.35–2.45 Å, and the 2.6 Å panel with U–O distances of 2.85–3.03 Å. The isolation process is described in the text.
4 Discussion
EXAFS measurements on ion-irradiated UO2, bulk U4O9 and U3O7, and epitaxial U4O9-δ films show that the disorder in the stoichiometric homogeneous and hyperstoichiometric mixed valence systems are substantially different and also vary depending on the method of preparation. The O interstitials presumably formed by ion irradiation broaden the nearest neighbor U–O distribution with O density at shorter distances to make it asymmetrically weighted toward the low R side of the original peak with only minimal O neighbors displaced to longer distances. The absence of features associated with UO2+x indicates that any clustering of these interstitials terminates before they are sufficiently large to be U4O9-like, consistent with the instability of U3+ in the oxides that would form to compensate for the O vacancies. The U partial pair distributions in fluorite-structured UO2+x are much more complicated, with significant O neighbors at positions both shorter and longer than the initial 2.36 Å U–O distance and a large reduction in the U neighbor amplitude indicative of substantial anharmonic broadening. Both bulk and film materials show a broadening of the original U–O neighbor on the high R side. Bulk materials also have an overlapping neighbor at a shorter distance whereas a shorter neighbor for the films is separated from the primary one by well over the resolution limit, indicating that it is more of a discrete neighbor shell than simply part of a continuous series of displacements from the original position. There is also evidence that U4O9 has significant O density extending to distances >2.6 Å. This interpretation is muddled by the observation that U3O7 has significantly less total O density in the fits, which cannot be correct and poses the question of where the missing O atoms reside, and another complicating factor is the reduction or loss of these features in both bulk and film at higher temperatures that demonstrates they are subject to at least thermal broadening.
An important finding is that the local structure determined by EXAFS is not the same for the bulk and thin film U4O9-δ, with the latter presumably exhibiting larger amplitudes because the substrate inhibits displacements of the atoms so as to maintain a more ordered structure. Modeling based on density functional theory (DFT) has been performed to understand the structure and bonding obtained from the EXAFS measurements (Andersson et al., 2009; Andersson et al., 2012; Andersson et al., 2013). It was not possible to capture the full dynamic and multi-faceted distribution of bonds obtained by EXAFS, likely due to the static nature of the DFT methodology and the inability to explicitly include the dynamics of the internal polaron. However, the global picture emerging from the simulations is consistent with the EXAFS measurements. As an example, the simulations identify a competition between many different structural motifs in UO2+x, which in practice will result in a distribution of U–O local geometries and bond lengths. This close competition and associated shallow minima in the energy surface also means that external stimuli can alter the distribution of motifs and bonds, which is a possible explanation for the differences in the structures of bulk and epitaxial thin film U4O9-δ and the termination of O addition at the U4O9 stoichiometry in the latter.
The other major issue in the structure is the spectral feature fit with the U-oxo moiety. Both types of materials do show an O at an oxo-type distance around 1.7 Å, shorter than in coordination complexes but longer than that reported for α-UO3. Somewhat longer distances and larger numbers of this species occur in the thin films. One possibility is that this is atomic XAFS (AXAFS) (Ramaker and Koningsberger, 2010) that is coincidentally well fit by a U–O wave. Although its peak in χ(R) is farther out than the prescribed half the distance of the primary nearest neighbor, this is not necessarily a definitive criterion because the extremely short distance of the uranyl bond does overlap with at least some instances of AXAFS. More conclusive is that examination of the U–O wave in k shows that in many of the spectra, its damping is not rapid but comparable to or slower than the others—as expected for this strong bond. Another flaw in the AXAFS assignment is that the amplitude should increase with the charge on the U atom, which is not an observed trend in the bulk samples and is inconsistent with the absence of this feature in UO2. The absence of this neighbor in the EXAFS of UO2.00 and the irradiated samples demonstrate that it only occurs in the hyperstoichiometric mixed-valence oxides with their fractional increase in charge. Insofar as crystallography does not find a uranyl moiety, it has been highly controversial; since it is relevant to other highly correlated mixed valence systems that exhibit the same effects, it quite possibly originates in the dynamic structure. It is of general interest because it would be the largest deviation from the elastic, static structure that we are aware of in terms of charge transfer, displacements, and the numbers of atoms involved and complexity of its mechanism, and it is not associated with an electronic phase transition.
The combination of a charge inhomogeneity in an ionic material and its induced local lattice distortion is a Holstein polaron. This introduces dynamics into the system; polarons move through the lattice by thermally activated hopping to neighboring sites. There is, however, the possibility of a second dynamic motif. The unusual structural properties of the mixed-valence uranium oxides with non-integer O:U ratios and consequent cationic charge inhomogeneities poses the question of the extent to which it could modify the coupled charge–lattice dynamics, particularly their adherence to the Born-Oppenheimer approximation at the adiabatic limit. In metal oxides, the overlap of the O 2p and metal d states can shift a fraction of the charge to one of the oxygen atoms, modifying its covalency to produce a second metal–oxygen (M–O) bond length and a two-site distribution. In the typical situation where the metal has multiple, identical oxygen neighbors, this variation of coupled charge and displacement can exhibit internal dynamics by hopping between these degenerate sites within the original metal-centered polaron that remains at its original lattice site. This can occur by quantum tunneling, where when the intrasite tunneling is faster than intersite hopping, an internal quantum tunneling polaron (IQTP) is formed. An essential point is that IQTPs are a constituent of the dynamic structure S (q,ΔE), not the static S (q,ΔE = 0). Their signature two-site distributions have been observed in mixed valence cuprates (Conradson et al., 1990; Toby et al., 1990; Egami et al., 1991; Deleon et al., 1994; Bianconi et al., 1995; Bianconi et al., 1996; Zhang and Oyanagi, 2009; Conradson et al., 2020), bismuthates (Menushenkov et al., 2000; Menushenkov and Klementev, 2000), iron pnictides (Ivanov et al., 2016), manganites (Tyson et al., 1996), and TaS2 (Bozin et al., 2023), where they are coupled in all these materials to their emergent properties. As we have shown here, they also occur in uranium oxides, despite the absence of any known electronic phases in these highly ionic materials.
The concept of dynamic structure is intuitive in liquids (Egami and Shinohara, 2019; Egami and Shinohara, 2020), where the organized arrangement of the atoms or molecules is perturbed by their hopping between their first-second, second-third, etc. nearest neighbor shells. In a liquid, the time differential given by the Van Hove transformation of the energy difference in their inelastic structure factor gives the greatly broadened pair distribution caused by these relative motions of the atom pairs that destroys their temporal coherence as the time interval between the scattering events of the two atoms increases. The analogous displacements of the atoms of IQTPs also occur in solids, now constrained to their two sites separated by an open path in the structure. The separation between the two oxygen sites of an IQTP in a cuprate is typically under 0.25 Å—still sufficient to be coupled to charge transfer because of the modified M–O bonding. In UO2+x it is much larger, up to the 0.6 Å difference between the 1.7 Å U–O distance we find here and the original 2.36 Å of the UO2 site. It will be less if it involves one of the shorter U–O distances identified here. IQTPs are not observed in diffraction that in the absence of energy discrimination on the detector also measures S (q,t = 0) because the correlated motion that defines the two sites in the dynamic structure is in the atom pair and not with respect to the unit cell. IQTPs are therefore identified by inelastic X-ray or neutron scattering and theoretically in X-ray photon correlation spectroscopy (XPCS). However, the optimal method in metal oxides is EXAFS via its sensitivity to the instantaneous structure factor S (q,t = 0), its element separation capability that gives it precision that easily characterizes the pertinent multisite distributions and especially the ease of the experimental measurement.
The tension between radially symmetric and layered/oblate geometries that will affect mixed valence uranium oxides produces correspondingly unusual correlated physics beyond, but perhaps related to, its complicated magnetism and the importance of its high order electric and magnetic multipoles (Lander et al., 2021). The first evidence for this was seen in the local structure of a series of UO2+x determined by EXAFS (Conradson et al., 2004a). EXAFS found a multisite U–O distribution, including 1.73 Å U-O distances indicative of U(VI) oxo moieties as in α-UO3. The other significant finding was that the overall U–U amplitude decreased with increasing x because of a reduction in the number of neighbors—which is not what actually occurs because the density is unaffected—but with the Debye–Waller factor unchanged. The first result was controversial because it was in putative contradiction with neutron scattering results, both diffraction and subsequent pair distribution function analysis, and ion channeling (Garrido et al., 2006a; Garrido et al., 2006b). We reconciled this with our 2013 paper that compared XAFS, X-ray PDF, and neutron PDF (Conradson et al., 2013). The X-ray measurements corroborated each other, with both showing U–O pairs below 2 Å in U4O9 and U3O7, whereas neutron PDF agreed with that earlier, with no U–O pairs below ∼2.15 Å. However, the X-rays also showed a much broader U–U distribution in UO2+x than neutrons, and there were other differences as well—even some pairs found only with X-rays.
These results were analogous to the behavior of some of the Cu–O bonds in cuprates, which had been explained theoretically by the dynamics associated with tunneling polarons (Salkola et al., 1995; DeLeon et al., 1996; Bishop et al., 2003). Comparison with both coordination compounds and U-oxides implies that the two endpoint structures of the IQTP are completely different. That involving U(IV/V) would retain the UO2 cubic nearest neighbor structure, whereas U(VI) and the oxo distance are consistent with the oblate geometry found in U3O8 and α-UO3. As we have depicted, because of the near identity of the oxygen sites in the UO2 (111) and U3O8/α-UO3 (001) planes, the local structures are easily exchanged by moving the U and its O neighbors in opposite directions to obtain the plane and displacing the perpendicular O towards or away from the U (Conradson et al., 2015). Focusing on these dynamics to perform a detailed analysis of the structures at more temperatures in both the original and a different type of U4O9 sample and a disordered stoichiometric UO2 sample verifies the presence of the oxo-type bond in the dynamic structure of only UO2+x. It also demonstrates that it is common to the mixed valence systems even when the arrangements of their atoms in the local and dynamic structure are quite different. Finally, that it is not coupled to an electronic phase transition in UO2+x implies that it is a quantum fluctuation that is also directed by the arrangements of the atoms and their conventional vibrational modes in the structure. Having conclusively demonstrated that the U(VI)-oxo moiety exists in the dynamic structure, the next question is whether it affects other properties in addition to certain types of measurements. Recent exact diagonalization calculations have shown that IQTPs coupled through anharmonic bridges can form a novel synchronized phase that entangles its constituent particles and redistributes its excess charge beyond the original O atoms (Velasco et al., 2021; Velasco et al., 2022). The extent to which it influences chemical reactivity or the complex magnetism of UO2+x or is a basis for the complexity of the phase diagram that should now be expanded to include the sensitivity to external stress is unknown, but it provides a topic for further exploration.
Data availability statement
The raw data supporting the conclusions of this article will be made available by the authors, without undue reservation.
Author contributions
JL: conceptualization, data curation, formal analysis, funding acquisition, investigation, methodology, project administration, resources, software, supervision, validation, visualization, writing–original draft, writing–review and editing. RS: conceptualization, data curation, formal analysis, investigation, writing–review and editing, funding acquisition, methodology, project administration, resources, supervision. CB: conceptualization, methodology, project administration, supervision, writing–review and editing, validation. RN: writing–review and editing, investigation. JW: investigation, writing–review and editing. LH: investigation, writing–review and editing. MG: investigation, writing–review and editing. JP: investigation, writing–review and editing. GB: investigation, writing–review and editing, conceptualization, validation. DA: investigation, writing–review and editing, writing–original draft. XG: writing–review and editing, conceptualization, methodology, validation. SC: conceptualization, writing–review and editing, data curation, formal analysis, investigation, writing–original draft.
Funding
The authors declare that financial support was received for the research, authorship, and/or publication of this article. JL acknowledges funding from the Centre for Doctoral Training in Condensed Matter Physics (CDT-CMP), Grant No. EP/L015544/1, and the National Nuclear User Facility for Radioactive Materials Surfaces (NNUF FaRMS), Grant No. EP/V035495/1. Work at Washington State University was partially supported by the US National Science Foundation Division of Materials Research Early Concept Grants for Exploratory Research Grant 1928874. Use of the Stanford Synchrotron Radiation Lightsource, SLAC National Accelerator Laboratory, is supported by the U.S. Department of Energy, Office of Science, Office of Basic Energy Sciences, under Contract No. DE-AC02-76SF00515.
Conflict of interest
Author JP was employed by VTT Technical Research Centre of Finland Ltd.
The remaining authors declare that the research was conducted in the absence of any commercial or financial relationships that could be construed as a potential conflict of interest.
Publisher’s note
All claims expressed in this article are solely those of the authors and do not necessarily represent those of their affiliated organizations, or those of the publisher, the editors and the reviewers. Any product that may be evaluated in this article, or claim that may be made by its manufacturer, is not guaranteed or endorsed by the publisher.
Supplementary material
The Supplementary Material for this article can be found online at: https://www.frontiersin.org/articles/10.3389/fnuen.2024.1346678/full#supplementary-material
SUPPLEMENTARY FIGURE S1 | χ(k) data and fit for ion beam irradiated samples.
SUPPLEMENTARY FIGURE S2 | χ(k) data and fit for bulk U4O9 and U3O7 samples.
SUPPLEMENTARY FIGURE S3 | χ(k) data and fit for thin film U4O9 samples.
References
Allen, G. C., and Holmes, N. R. (1995). A mechanism for the UO2 to Alpha-U3O8 phase-transformation. J. Nucl. Mater 223 (3), 231–237. doi:10.1016/0022-3115(95)00025-9
Allen, G. C., and Tempest, P. A. (1986). Ordered defects in the oxides of uranium. Proc. R. Soc. Lond. Ser. A 406 (1831), 325–344. doi:10.1098/rspa.1986.0078
Allen, G. C., Tempest, P. A., and Tyler, J. W. (1987). Oxidation of crystalline UO2 studied using X-Ray photoelectron-spectroscopy and X-ray-diffraction. J. Chem. Soc. Farad T 83, 925–935. doi:10.1039/f19878300925
An, Y. Q., Taylor, A. J., Conradson, S. D., Trugman, S. A., Durakiewicz, T., and Rodriguez, G. (2011). Ultrafast hopping dynamics of 5f electrons in the Mott insulator UO2 studied by femtosecond pump-probe spectroscopy. Phys. Rev. Lett. 106 (20), 207402. doi:10.1103/physrevlett.106.207402
Andersson, D. A., Baldinozzi, G., Desgranges, L., Conradson, D. R., and Conradson, S. D. (2013). Density functional theory calculations of UO2 oxidation: evolution of UO2+x, U4O9–y, U3O7, and U3O8. Inorg. Chem. 52 (5), 2769–2778. doi:10.1021/ic400118p
Andersson, D. A., Espinosa-Faller, F. J., Uberuaga, B. P., and Conradson, S. D. (2012). Stability and migration of large oxygen clusters in UO2+x: density functional theory calculations. J. Chem. Phys. 136 (23), 234702. doi:10.1063/1.4729842
Andersson, D. A., Lezama, J., Uberuaga, B. P., Deo, C., and Conradson, S. D. (2009). Cooperativity among defect sites in AO2+x and A4O9(A=U,Np,Pu): density functional calculations. Phys. Rev. B 79 (2), 024110. doi:10.1103/physrevb.79.024110
Ankudinov, A. L., Ravel, B., Rehr, J. J., and Conradson, S. D. (1998). Real-Space multiple-scattering calculation and interpretation of X-ray-absorption near-edge structure. Phys. Rev. B 58 (12), 7565–7576. doi:10.1103/physrevb.58.7565
Batuk, O. N., Conradson, S. D., Aleksandrova, O. N., Boukhalfa, H., Burakov, B. E., Clark, D. L., et al. (2015). Multiscale speciation of U and Pu at chernobyl, hanford, los alamos, McGuire AFB, mayak, and rocky flats. Environ. Sci. Technol. 49 (11), 6474–6484. doi:10.1021/es506145b
Bevan, D. J. M., Grey, I. E., and Willis, B. T. M. (1986). The crystal-structure of beta-U4O9-y. J. Solid State Chem. 61 (1), 1–7. doi:10.1016/0022-4596(86)90002-2
Bianconi, A., Missori, M., Oyanagi, H., Yamaguchi, H., Ha, D. H., Nishiara, Y., et al. (1995). The measurement of the polaron size in the metallic phase of cuprate superconductors. Europhys. Lett. 31 (7), 411–415. doi:10.1209/0295-5075/31/7/012
Bianconi, A., Saini, N. L., Lanzara, A., Missori, M., Rossetti, T., Oyanagi, H., et al. (1996). Determination of the local lattice distortions in the CuO2 plane of La1.85Sr0.15CuO4. Phys. Rev. Lett. 76 (18), 3412–3415. doi:10.1103/PhysRevLett.76.3412
Bishop, A. R., Mihailovic, D., and de Leon, J. M. (2003). Signatures of mesoscopic Jahn-Teller polaron inhomogeneities in high-temperature superconductors. J. Phys-Condens Matter 15 (9), L169–L175. doi:10.1088/0953-8984/15/9/101
Bozin, E. S., Abeykoon, M., Conradson, S., Baldinozzi, G., Sutar, P., and Mihailovic, D. (2023). Crystallization of polarons through charge and spin ordering transitions in 1T-TaS2. Nat. Commun. 14 (1), 7055. doi:10.1038/s41467-023-42631-6
Colmenares, C. A. (1984). Oxidation mechanisms and catalytic properties of the actinides. Prog. Solid State Chem. 15 (4), 257–364. doi:10.1016/0079-6786(84)90003-7
Conradson, S. D. (1998). Application of X-ray absorption fine structure spectroscopy to materials and environmental science. Appl. Spectrosc. 52 (7), 252A–79A. doi:10.1366/0003702981944599
Conradson, S. D., Abney, K. D., Begg, B. D., Brady, E. D., Clark, D. L., den, A. C., et al. (2004b). Higher order speciation effects on plutonium L3 X-ray absorption near edge spectra. Inorg. Chem. 43 (1), 116–131. doi:10.1021/ic0346477
Conradson, S. D., Andersson, D. A., Bagus, P. S., Boland, K. S., Bradley, J. A., Byler, D. D., et al. (2016). Anomalous dispersion and band gap reduction in UO2+x and its possible coupling to the coherent polaronic quantum state. Nucl. Instrum. Methods Phys. Res. Sect. B-Beam Interact. Mater. Atoms 374, 45–50. doi:10.1016/j.nimb.2015.10.073
Conradson, S. D., Andersson, D. A., Boland, K. S., Bradley, J. A., Byler, D. D., Durakiewicz, T., et al. (2017). Closure of the Mott gap and formation of a superthermal metal in the Frohlich-type nonequilibrium polaron Bose-Einstein condensate in UO2+x. Phys. Rev. B 96 (12), 125114. doi:10.1103/physrevb.96.125114
Conradson, S. D., Begg, B. D., Clark, D. L., den Auwer, C., Ding, M., Dorhout, P. K., et al. (2005). Charge distribution and local structure and speciation in the UO2+x and PuO2+x binary oxides for x <= 0.25. J. Solid State Chem. 178 (2), 521–535. doi:10.1016/j.jssc.2004.09.029
Conradson, S. D., Bock, N., Castro, J. M., Conradson, D. R., Cox, L. E., Dmowski, W., et al. (2014a). Nanoscale heterogeneity, premartensitic nucleation, and a new plutonium structure in metastable delta fcc Pu-Ga alloys. Phys. Rev. B 89 (22), 224102. doi:10.1103/physrevb.89.224102
Conradson, S. D., Bock, N., Castro, J. M., Conradson, D. R., Cox, L. E., Dmowski, W., et al. (2014b). Intrinsic nanoscience of delta Pu-Ga alloys: local structure and speciation, collective behavior, nanoscale heterogeneity, and aging mechanisms. J. Phys. Chem. C 118 (16), 8541–8563. doi:10.1021/jp5004038
Conradson, S. D., Durakiewicz, T., Espinosa-Faller, F. J., An, Y. Q., Andersson, D. A., Bishop, A. R., et al. (2013). Possible Bose-condensate behavior in a quantum phase originating in a collective excitation in the chemically and optically doped Mott-Hubbard system UO2+x. Phys. Rev. B 88 (11), 115135. doi:10.1103/physrevb.88.115135
Conradson, S. D., Geballe, T. H., Jin, C.-Q., Cao, L.-P., Gauzzi, A., Karppinen, M., et al. (2020). Nonadiabatic coupling of the dynamical structure to the superconductivity in YSr2Cu2.75Mo0.25O7.54 and Sr2CuO3.3. Proc. Natl. Acad. Sci. U. S. A. 117 (52), 33099–33106. doi:10.1073/pnas.2018336117
Conradson, S. D., Gilbertson, S. M., Daifuku, S. L., Kehl, J. A., Durakiewicz, T., Andersson, D. A., et al. (2015). Possible demonstration of a polaronic Bose-Einstein(-Mott) condensate in UO2(+x) by ultrafast THz Spectroscopy and microwave dissipation. Sci. Rep. 5, 15278. doi:10.1038/srep15278
Conradson, S. D., Manara, D., Wastin, F., Clark, D. L., Lander, G. H., Morales, L. A., et al. (2004a). Local structure and charge distribution in the UO2-U4O9 system. Inorg. Chem. 43 (22), 6922–6935. doi:10.1021/ic049748z
Conradson, S. D., and Raistrick, I. D. (1989). The axial oxygen and superconductivity in YBa2Cu3O7. Science 243 (4896), 1340–1343. doi:10.1126/science.243.4896.1340
Conradson, S. D., Raistrick, I. D., and Bishop, A. R. (1990). Axial oxygen centered lattice instabilities and high-temperature superconductivity. Science 248 (4961), 1394–1398. doi:10.1126/science.248.4961.1394
Cooper, R. I., and Willis, B. T. M. (2004). Refinement of the structure of beta-U4O9. Acta Crystallogr. A 60, 322–325. doi:10.1107/s010876730401219x
Debets, P. C. (1966). Structure of beta-UO3. Acta Crystallogr. 21, 589–593. doi:10.1107/s0365110x66003505
DeLeon, J. M., Conradson, S. D., Tyson, T., Bishop, A. R., Salkola, M., Espinosa, F. J., et al. X-Ray absorption fine structure applied to the study of systems with lattice instabilities, L. J. Terminello, S. M. Mini, H. Ade, and D. L. Perry, editors. Applications of Synchrotron radiation techniques to materials science III. Materials research society symposium proceedings. 437: Cambridge University Press; 1996. p. 189–199. doi:10.1557/proc-437-189
Deleon, J. M., Li, G. G., Conradson, S. D., Bishop, A. R., Subramanian, M. A., and Raistrick, I. D. (1994). Planar oxygen-centered lattice instabilities in Tl-based high-temperature superconductors. Phys. C 220 (3-4), 377–382. doi:10.1016/0921-4534(94)90927-x
Den Auwer, C., Simoni, E., Conradson, S., and Madic, C. (2003). Investigating actinyl oxo cations by X-ray absorption spectroscopy. Eur. J. Inorg. Chem. 2003 (21), 3843–3859. doi:10.1002/ejic.200300093
Desgranges, L., Badinozzi, G., Simeone, D., and Fischer, H. E. (2011). Refinement of the alpha-U4O9 crystalline structure: new insight into the U4O9 → U3O8 transformation. Inorg. Chem. 50 (13), 6146–6151. doi:10.1021/ic200316b
Dickens, P. G., and Powell, A. V. (1991). Powder neutron-diffraction study of potassium uranate(V), KUO3. J. Mater Chem. 1 (1), 137–138. doi:10.1039/jm9910100137
Egami, T., and Shinohara, Y. (2019). Dynamics of water in real space and time. Mol. Phys. 117 (22), 3227–3231. doi:10.1080/00268976.2019.1649488
Egami, T., and Shinohara, Y. (2020). Correlated atomic dynamics in liquid seen in real space and time. J. Chem. Phys. 153 (18), 180902. doi:10.1063/5.0024013
Egami, T., Toby, B. H., Billinge, S. J. L., Rosenfeld, H. D., Jorgensen, J. D., Hinks, D. G., et al. (1991). Local structural anomaly near Tc observed by pulsed neutron-scattering. Phys. C 185, 867–868. doi:10.1016/0921-4534(91)91657-p
Engmann, R., and Wolff, P. M. D. (1963). Crystal structure of gamma-UO3. Acta Crystallogr. 16 (10), 993–996. doi:10.1107/s0365110x63002656
Garrido, F., Hannon, A. C., Ibberson, R. M., Nowicki, L., and Willis, B. T. M. (2006a). Neutron diffraction studies of U4O9: comparison with EXAFS results. Inorg. Chem. 45 (20), 8408–8413. doi:10.1021/ic060964c
Garrido, F., Ibberson, R. M., Nowicki, L., and Willis, B. T. M. (2003). Cuboctahedral oxygen clusters in U3O7. J. Nucl. Mater 322 (1), 87–89. doi:10.1016/s0022-3115(03)00318-0
Garrido, F., Nowicki, L., and Thome, L. (2006b). Channeling investigation of the crystalline structure of U4O9-y. Phys. Rev. B 74 (18), 184114. doi:10.1103/physrevb.74.184114
Geng, H. Y., Chen, Y., Kaneta, Y., and Kinoshita, M. (2008). Stability mechanism of cuboctahedral clusters in UO2+x: first-principles calculations. Phys. Rev. B 77 (18), 180101–180104. doi:10.1103/physrevb.77.180101
Gerber, E., Romanchuk, A. Y., Weiss, S., Bauters, S., Schacherl, B., Vitova, T., et al. (2021). Insight into the structure-property relationship of UO2 nanoparticles. Inorg. Chem. Front. 8 (4), 1102–1110. doi:10.1039/d0qi01140a
Gilbertson, S. M., Durakiewicz, T., Dakovski, G. L., Li, Y., Zhu, J.-X., Conradson, S. D., et al. (2014). Ultrafast photoemission spectroscopy of the uranium dioxide UO2 Mott insulator: evidence for a robust energy gap structure. Phys. Rev. Lett. 112 (8), 087402. doi:10.1103/physrevlett.112.087402
Greaves, C., and Fender, B. E. F. (1972). Structure of alpha-UO3 by neutron and electron-diffraction. Acta Crystallogr. B 28 (DEC15), 3609–3614. doi:10.1107/s056774087200843x
Griffiths, T. R., Hubbard, V. S. A., and Davies, M. J. (1994). Electron-transfer reactions in nonstoichiometric ceria and urania. Inorg. Chim. Acta 225 (1-2), 305–317. doi:10.1016/0020-1693(94)04062-1
Guimbrètiere, G., Desgranges, L., Canizarès, A., Carlot, G., Caraballo, R., Jégou, C., et al. (2012). Determination of in-depth damaged profile by Raman line scan in a pre-cut He2+ irradiated UO2. Appl. Phys. Lett. 100 (25). doi:10.1063/1.4729588
Haire, R. G., and Eyring, L. (1994). “Comparison of the binary oxides,” in Handbook on the physics and chemistry of the rare earths. Editors K. A. Gschneidner, L. Eyring, G. R. Choppin, and G. H. Lander (New York: Elsevier Science, B. V.), 413–505.
Hanham, M. L., and Pettifer, R. F. (2001). Generalized Ramsauer-Townsend effect in extended x-ray-absorption fine structure. Phys. Rev. B 64 (18), 180101. doi:10.1103/physrevb.64.180101
He, H. M., and Shoesmith, D. (2010). Raman spectroscopic studies of defect structures and phase transition in hyper-stoichiometric UO2+x. Phys. Chem. Chem. Phys. 12 (28), 8108–8117. doi:10.1039/b925495a
Idriss, H. (2010). Surface reactions of uranium oxide powder, thin films and single crystals. Surf. Sci. Rep. 65 (3), 67–109. doi:10.1016/j.surfrep.2010.01.001
Ilton, E. S., and Bagus, P. S. (2011). XPS determination of uranium oxidation states. Surf. Interface Analysis 43 (13), 1549–1560. doi:10.1002/sia.3836
Ivanov, V. G., Ivanov, A. A., Menushenkov, A. P., Joseph, B., and Bianconi, A. (2016). Fe-as bond fluctuations in a double-well potential in LaFeAsO. J. Supercond. Nov. Magn. 29 (12), 3035–3039. doi:10.1007/s10948-016-3831-5
King, R. B. (2002). Some aspects of structure and bonding in binary and ternary uranium(VI) oxides. Chem. Mater 14 (9), 3628–3635. doi:10.1021/cm020258j
Knope, K. E., and Soderholm, L. (2013). Solution and solid-state structural chemistry of actinide hydrates and their hydrolysis and condensation products. Chem. Rev. 113 (2), 944–994. doi:10.1021/cr300212f
Kvashnina, K. O., and Butorin, S. M. (2022). High-energy resolution X-ray spectroscopy at actinide M4,5 and ligand K edges: what we know, what we want to know, and what we can know. Chem. Commun. 58 (3), 327–342. doi:10.1039/d1cc04851a
Kvashnina, K. O., Butorin, S. M., Martin, P., and Glatzel, P. (2013). Chemical state of complex uranium oxides. Phys. Rev. Lett. 111 (25), 253002. doi:10.1103/physrevlett.111.253002
Lander, G. H., Sundermann, M., Springell, R., Walters, A. C., Nag, A., Garcia-Fernandez, M., et al. (2021). Resonant inelastic x-ray spectroscopy on UO2 as a test case for actinide materials. J. Phys-Condens Matter 33 (6), 06LT01. doi:10.1088/1361-648x/abc4d2
Leinders, G., Baldinozzi, G., Ritter, C., Saniz, R., Arts, I., Lamoen, D., et al. (2021). Charge localization and magnetic correlations in the refined structure of U3O7. Inorg. Chem. 60 (14), 10550–10564. doi:10.1021/acs.inorgchem.1c01212
Leinders, G., Bes, R., Kvashnina, K. O., and Verwerft, M. (2020). Local structure in U(IV) and U(V) environments: the case of U3O7. Inorg. Chem. 59 (7), 4576–4587. doi:10.1021/acs.inorgchem.9b03702
Maccrone, R. K., Sankaran, S., Shatynski, S. R., and Colmenares, C. A. (1986). Complex defects in the oxidation of uranium. Metall. Trans. A 17 (6), 911–914. doi:10.1007/bf02661256
McKale, A. G., Veal, B. W., Paulikas, A. P., Chan, S. K., and Knapp, G. S. (1988). Generalized ramsauer-townsend effect in extended x-ray-absorption fine-structure. Phys. Rev. B 38 (15), 10919–10921. doi:10.1103/physrevb.38.10919
Menushenkov, A. P., and Klementev, K. V. (2000). Extended x-ray absorption fine-structure indication of a double-well potential for oxygen vibration in Ba1-xKxBiO3. J. Phys-Condens Matter 12 (16), 3767–3786. doi:10.1088/0953-8984/12/16/303
Menushenkov, A. P., Klementev, K. V., Konarev, P. V., Meshkov, A. A., Benazeth, S., and Purans, J. (2000). The double-well oscillating potential of oxygen atoms in perovskite system Ba(K)BiO3: EXAFS-analysis results. Nucl. Instrum. Meth A 448 (1-2), 340–344. doi:10.1016/s0168-9002(99)00709-3
Murray, A. D., and Willis, B. T. M. (1990). A neutron-diffraction study of anion clusters in nonstoichiometric uranium-dioxide. J. Solid State Chem. 84 (1), 52–57. doi:10.1016/0022-4596(90)90183-x
Naito, K., Tsuji, T., and Matsui, T. (1990). Defect chemistry of uranium-oxides. J. Radioanal. Nucl. Chem-Artic 143 (1), 221–240. doi:10.1007/bf02117564
Nowicki, L., Garrido, F., Turos, A., and Thome, L. (2000). Polytypic arrangements of cuboctahedral oxygen clusters in U3O7. J. Phys. Chem. Solids 61 (11), 1789–1804. doi:10.1016/s0022-3697(00)00057-3
Pakarinen, J., He, L., Gupta, M., Gan, J., Nelson, A., El-Azab, A., et al. (2014b). 2.6 MeV proton irradiation effects on the surface integrity of depleted UO2. Nucl. Instrum. Methods Phys. Res. Sect. B-Beam Interact. Mater. Atoms 319, 100–106. doi:10.1016/j.nimb.2013.11.014
Pakarinen, J., Khafizov, M., He, L. F., Wetteland, C., Gan, J., Nelson, A. T., et al. (2014a). Microstructure changes and thermal conductivity reduction in UO2 following 3.9 MeV He2+ ion irradiation. J. Nucl. Mater. 454 (1-3), 283–289. doi:10.1016/j.jnucmat.2014.07.053
Poliakova, T., Krot, A., Trigub, A., Nevolin, I., Averin, A., Yapaskurt, V., et al. (2023). Uranium oxides structural transformation in human body liquids. Sci. Rep. 13 (1), 4088. doi:10.1038/s41598-023-31059-z
Popa, N. C., and Willis, B. T. M. (2004). U4O9: atoms in general sites giving the hkl extinctions of special sites. Acta Crystallogr. A 60, 318–321. doi:10.1107/s0108767304012188
Ramaker, D. E., and Koningsberger, D. C. (2010). The atomic AXAFS and Δμ XANES techniques as applied to heterogeneous catalysis and electrocatalysis. Phys. Chem. Chem. Phys. 12 (21), 5514–5534. doi:10.1039/b927120c
Rehr, J. J., Kas, J. J., Prange, M. P., Sorini, A. P., Takimoto, Y., and Vila, F. (2009). Ab initio theory and calculations of X-ray spectra. C R. Phys. 10 (6), 548–559. doi:10.1016/j.crhy.2008.08.004
Rehr, J. J., Kas, J. J., Vila, F. D., Prange, M. P., and Jorissen, K. (2010). Parameter-free calculations of X-ray spectra with FEFF9. Phys. Chem. Chem. Phys. 12 (21), 5503–5513. doi:10.1039/b926434e
Rennie, S., Bright, E. L., Sutcliffe, J. E., Darnbrough, J. E., Burrows, R., Rawle, J., et al. (2018). The role of crystal orientation in the dissolution of UO2 thin films. Corros. Sci. 145, 162–169. doi:10.1016/j.corsci.2018.09.012
Rietveld, H. M. (1966). Crystal structure of some alkaline earth metal uranates of type M3UO6. Acta Crystallogr. 20, 508–513. doi:10.1107/s0365110x66001154
Salkola, M. I., Bishop, A. R., Trugman, S. A., and Deleon, J. M. (1995). Correlation-function analysis of nonlinear and nonadiabatic systems - polaron tunneling. Phys. Rev. B 51 (14), 8878–8891. doi:10.1103/physrevb.51.8878
Schofield, E., Mehta, A., Webb, S., Ulrich, K. U., Giammar, D. E., Sharp, J. O., et al. (2008). Molecular- and nano-scale structure and reactivity of biogenic uranium(IV) oxide. Geochim. Cosmochim. Acta 72 (12), A838–A.
Springell, R., Rennie, S., Costelle, L., Darnbrough, J., Stitt, C. A., Cocklin, E., et al. (2015). Water corrosion of spent nuclear fuel: radiolysis driven dissolution at the UO2/water interface. Faraday Discuss. 180, 301–311. doi:10.1039/c4fd00254g
Spurgeon, S. R., Sassi, M., Ophus, C., Stubbs, J. E., Ilton, E. S., and Buck, E. C. (2019). Nanoscale oxygen defect gradients in UO2+x surfaces. Proc. Natl. Acad. Sci. U. S. A. 116 (35), 17181–17186. doi:10.1073/pnas.1905056116
Stubbs, J. E., Biwer, C. K., Chaka, A. M., Ilton, E. S., Du, Y., Bargar, J. R., et al. (2017). Oxidative corrosion of the UO2 (001) surface by nonclassical diffusion. Langmuir 33 (46), 13189–13196. doi:10.1021/acs.langmuir.7b02800
Tempest, P. A., Tucker, P. M., and Tyler, J. W. (1988). Oxidation of UO2 fuel pellets in air at 503 and 543 K studied using X-ray photoelectron-spectroscopy and X-ray-diffraction. J. Nucl. Mater 151 (3), 269–274. doi:10.1016/0022-3115(88)90019-0
Thompson, W. T., Lewis, B. J., Corcoran, E. C., Kaye, M. H., White, S. J., Akbari, F., et al. (2007). Thermodynamic treatment of uranium dioxide based nuclear fuel. Int. J. Mater Res. 98 (10), 1004–1011. doi:10.3139/146.101556
Toby, B. H., Egami, T., Jorgensen, J. D., and Subramanian, M. A. (1990). Observation of a local structural-change at Tc for Tl2Ba2CaCu2O8 by pulsed neutron-diffraction. Phys. Rev. Lett. 64 (20), 2414–2417. doi:10.1103/physrevlett.64.2414
Tyson, T. A., deLeon, J. M., Conradson, S. D., Bishop, A. R., Neumeier, J. J., Roder, H., et al. (1996). Evidence for a local lattice distortion in Ca-doped LaMnO3. Phys. Rev. B 53 (21), 13985–13988. doi:10.1103/physrevb.53.13985
Van den Berghe, S., Verwerft, M., Laval, J. P., Gaudreau, B., Allen, P. G., and Van Wyngarden, A. (2002). The local uranium environment in cesium uranates: a combined XPS, XAS, XRD, and neutron diffraction analysis. J. Solid State Chem. 166 (2), 320–329. doi:10.1006/jssc.2002.9594
Velasco, V., Neto, M. B. S., Perali, A., Wimberger, S., Bishop, A. R., and Conradson, S. D. (2022). Kuramoto synchronization of quantum tunneling polarons for describing the dynamic structure in cuprate superconductors. Phys. Rev. B 105 (17), 174305. doi:10.1103/physrevb.105.174305
Velasco, V., Neto, M. S. B., Perali, A., Wimberger, S., Bishop, A. R., and Conradson, S. D. (2021). Evolution of charge-lattice dynamics across the kuramoto synchronization phase diagram of quantum tunneling polarons in cuprate superconductors. Condens. Matter 6 (4), 52. doi:10.3390/condmat6040052
Verbist, J. J., Riga, J., Tenret-Noel, C., Pireaux, J. J., d'Ursel, G., Caudano, R., et al. (1976). Bonding and valence in uranium compounds with oxygen: a study by X-ray photoelectron spectroscopy and electron paramagnetic resonance. International Conference on Plutonium and Other Actinides; 1975; Baden Baden. Germany. Amsterdam: North Holland Publ. Co.
Weber, W. J. (1981). Ingrowth of lattice-defects in alpha irradiated UO2 single-crystals. J. Nucl. Mater 98 (1-2), 206–215. doi:10.1016/0022-3115(81)90400-1
Weller, M. T., Dickens, P. G., and Penny, D. J. (1988). The Structure of delta-UO3. Polyhedron 7 (3), 243–244. doi:10.1016/s0277-5387(00)80559-8
Willis, B. T. M. (1964). Structures of UO2, UO2+x and U4O9 by neutron diffraction. Solid State Comm. 2 (1), 431–439. doi:10.1051/jphys:01964002505043100
Willis, B. T. M. (1987). Crystallographic studies of anion-excess uranium-oxides. J. Chem. Soc. Faraday Trans. 83, 1073–1081. doi:10.1039/f29878301073
Keywords: UO2+x, disorder, EXAFS, local structure, radiation effects, epitaxial films, dynamic structure, internal tunneling polarons
Citation: Lewis J, Springell R, Bell C, Nicholls R, Wasik J, Harding L, Gupta M, Pakarinen J, Baldinozzi G, Andersson D, Guo X and Conradson SD (2024) Charge-lattice coupling and the dynamic structure of the U–O distribution in UO2+x. Front. Nucl. Eng. 3:1346678. doi: 10.3389/fnuen.2024.1346678
Received: 29 November 2023; Accepted: 18 June 2024;
Published: 17 July 2024.
Edited by:
Xiao-Ying Yu, Pacific Northwest National Laboratory (DOE), United StatesReviewed by:
Jeffrey Fortner, Oak Ridge National Laboratory (DOE), United StatesKe Yuan, Oak Ridge National Laboratory (DOE), United States
Copyright © 2024 Lewis, Springell, Bell, Nicholls, Wasik, Harding, Gupta, Pakarinen, Baldinozzi, Andersson, Guo and Conradson. This is an open-access article distributed under the terms of the Creative Commons Attribution License (CC BY). The use, distribution or reproduction in other forums is permitted, provided the original author(s) and the copyright owner(s) are credited and that the original publication in this journal is cited, in accordance with accepted academic practice. No use, distribution or reproduction is permitted which does not comply with these terms.
*Correspondence: Steven D. Conradson, c3QzdjNuLmMwbnJhZHMwbkBpY2xvdWQuY29t; Jarrod Lewis, amFycm9kLmxld2lzQG1hdGVyaWFscy5veC5hYy51aw==; Ross Springell, cGhyc3NAYnJpc3RvbC5hYy51aw==