 Lorenzo Chierici
 Alessio Rossi
- 1 Copenhagen Atomics, Copenhagen, Denmark
- 2 Paul Scherrer Institute, Villigen, Switzerland
The molten salt experiment (MSE) is a 30-day 1 MW (thermal) molten salt criticality experiment designed by Copenhagen Atomics that will be conducted at the Paul Scherrer Institute (PSI) Swiss research center. A detailed analysis of the radioactive inventory available during the operation and after shutdown has been carried out for future estimates of potential source term release in case of undesired accidents using the Monte Carlo transport and depletion code OpenMC. To benchmark the radioactive inventory obtained through the OpenMC burn-up calculation (version 0.15.2), code-to-code comparison with the Serpent Monte Carlo and depletion code (v2.2.1), as well as with Serpent coupled to the EQL0D depletion module developed at PSI, were performed. All of the utilized codes support neutron transport on CAD-based geometries and allow continuous material reprocessing during depletion. This feature is essential for modeling the MSE concept, where gaseous fission products are continuously extracted from the circulating fuel salt. For the present verification study, three models of increasing geometric and physical detail were developed: (1) a nested hollow sphere model in constructive solid geometry (CSG), with the scope of aligning basic settings beyond geometry; (2) a geometrically simplified CAD model of the Copenhagen Atomics Onion Core, mainly utilized for testing the integration of CAD models within the above depletion codes; (3) the same simplified CAD model but with the implementation of reactor fluid flows from the inner active core to the outer inactive region, mainly to account for the effect of out-of-core decay. The results were compared to benchmark the original OpenMC model. Particular attention was given to the end-of-cycle (EOC) isotopic inventory, with detailed comparisons for key radionuclides and total radiotoxicity.
1 Introduction
The Copenhagen Atomics (CA) Molten Salt Experiment (MSE) is a molten salt test reactor currently under development by CA in collaboration with the Paul Scherrer Institute (PSI), which will host the experiment on its premises. The MSE is designed as a low-burnup test, planned to operate for 1 month at 1 MW of thermal power. This limited operational scope enables the project to pursue a low-hazard license, helping to accelerate and reduce uncertainties in the regulatory approval process.
Despite its low power and short duration, a comprehensive safety assessment is still required. This includes a detailed accident analysis to estimate the potential source term in the event of severe accidents that could lead to radiological releases to the public.
To accurately estimate the source term, a combination of computational tools is required: primarily a depletion code to calculate the radionuclide inventory and a dispersion code to model the environmental release and transport of radioactive materials.
In this context, OpenMC (Romano and Forget, 2013) is a Monte Carlo neutron transport code developed at the Massachusetts Institute of Technology (MIT) that includes an integrated burnup solver for coupled depletion simulations. Starting with version 0.15.2, OpenMC’s depletion solver was extended to support continuous material reprocessing, enabling the modeling of online operations such as fission product removal and fuel salt refueling. These features are essential for simulating the MSE, where volatile fission products are continuously extracted from the fuel salt and directed towards an off-gas system (OGS). The extension was implemented by incorporating additional terms into the Bateman equations to account for material inflow and outflow during depletion.
Similar capabilities have also been introduced in other codes. Serpent implemented continuous reprocessing support, starting from version 2.1 (Aufiero et al., 2013). EQL0D, developed at PSI (Hombourger et al., 2020), is a Matlab-based wrapper for Serpent, written with the primary goal of predicting the evolution of the fuel composition in molten salt reactors during burn-up. It includes advanced routines for online material transfers not only based on user-defined transfer rates but also on conservation quantities, reactivity control, and salt oxidation-reduction potential control. The SCALE code system has introduced a new MSR-specific depletion module, TRITON-MSR (Lo et al., 2022), while ad hoc depletion solvers like ADDER (Anderson et al., 2022) and SaltProc (Rykhlevskii et al., 2019) have been developed specifically for MSR applications. These tools can be coupled with Monte Carlo transport codes to perform comprehensive simulations of MSR fuel cycles, including detailed fuel reprocessing schemes.
The present article presents a detailed description of the methodologies adopted by three different depletion codes—OpenMC, Serpent, and EQL0D—to model molten salt reactors (MSRs). A validation case study is introduced, consisting of three sequential models of increasing complexity, each exploring different aspects of core geometry and reprocessing behavior.
The first model uses a constructive solid geometry (CSG) simplified representation of the CA Onion Core, with a single reprocessing scheme applied to volatile fission products. It is proposed in order to not source any geometry-related discrepancies and at the same time to be representative of the actual reactor design. This model is proposed to fine-tune the basic settings of the transport and depletion codes being considered.
The second model introduces a more realistic CAD-based geometry of the Onion Core, allowing for a deeper investigation of potential discrepancies between Monte Carlo transport solvers, particularly due to the differences in how OpenMC and Serpent handle CAD geometry conversion, despite using the same depletion settings.
The third and most advanced model builds upon the CAD geometry and incorporates more detailed reprocessing schemes, providing a comprehensive test of the depletion solvers’ capabilities in simulating realistic MSR fuel cycle behavior.
2 Methodology
Molten salt fluid-fueled reactors are associated with a variety of reprocessing schemes designed to efficiently manage both fuel and waste materials. These schemes are defined by the techniques used to remove fission products and recover fissile material, and they play a critical role in shaping the fuel cycle of a given reactor design. In typical MSR operation, elements that do not form stable compounds are generally easier to remove. Their behavior and removal mechanisms have been extensively studied, particularly building on the operational experience of the Molten Salt Reactor Experiment (MSRE) conducted at Oak Ridge National Laboratory (ORNL) in the 1960s. For instance, noble gases tend to bubble out of the molten salt and diffuse toward void regions or into off-gas systems, while noble metals often plate out onto metallic surfaces within the fuel circuit.
To mathematically represent the removal of individual nuclides, the process can be modeled using an exponential decay law, analogous to radioactive decay. In this analogy, the removal is governed by an artificial decay constant, here defined as the transfer rate coefficient
To accurately simulate the continuous removal or feeding of materials during reactor operation, this transfer rate term must be incorporated into the Bateman equation. The standard Bateman equation accounts only for nuclear reactions and radioactive decay, and by adding the transfer rate term, can be written as:
where
2.1 Transfer rates in OpenMC
The transfer rate coefficient
Alternatively, if nuclides belonging to one material get transferred to or from another, the two materials become coupled as well as their burnup matrices. The term
The burnup and transfer matrices are then assembled to form a block matrix
with
With this implementation, the cyclic transfer of materials between the in-core, neutron irradiated regions, and the out-of-core, decay only regions, within a single calculation step, as a function of the fluid flow rate, can emulate the material circulation, characteristic of MSR fluid loops.
2.2 Transfer rates in Serpent
An extended version of Serpent capable of removing and feeding materials during depletion was firstly implemented for the extensive modeling of MSRs (Aufiero et al., 2013). While features such as criticality control are unavailable in the version used in this benchmark (v2.1.1), among the selectable Serpent material reprocessing modes, the transfer through an artificial decay constant is selectable and obeys Equation 1 (Leppänen et al., 2025).
While extensive documentation on the implementation of material transfers is not available, several tests were performed to understand that transfer loops as described in Equation 2 are not supported; that is, the code cannot propagate material changes in cyclic transfers as OpenMC. The code is designed to process transfers of materials only in linear chains (as the direct transfer in Equation 3) and therefore limits the use of artificial decay to simultaneously transfer materials from in-core active regions to out-core inactive regions and vice versa.
2.3 Transfer rates in EQL0D
EQL0D (Hombourger et al., 2020) is a Matlab-based wrapper for Serpent2 developed at PSI with the primary goal predicting the evolution of the materials composition in MSRs during burn-up. Several different refueling and reprocessing stream options are available, including continuous or batch-wise addition or the removal of selected isotopes, as well as the transfer of isotopes from one material to another (as fission gases from the fuel into an off-gas system). Conservation modes, criticality control, and molten salt reduction-oxidation control are also available. Among the EQL0D material reprocessing modes, the transfer through an artificial decay constant is selectable.
The implementation of material transfer through artificial decay is implemented similarly as in OpenMC, with the difference that in OpenMC the Bateman system is solved for the number of atoms
while the A matrices remain untouched.
While in OpenMC the artificial decay constant integrates both the processing time of the material and the nuclide transfer efficiency
3 Onion core model description
The core of the CA Onion consists of several concentric spherical channels that circulate fuel and blanket molten salts from bottom to top, along with a heavy water moderator separated into two distinct regions. Figure 1 shows a cross-section of a representative, though simplified, CAD model of the actual Onion core. This model serves as the reference geometry for the reactor simulations presented in this study. The constructive solid geometry (CSG) model serves as the first simplified step in the benchmark process. It consists of a series of hollow concentric spheres, with the sole exception of the innermost region (the inner heavy water moderator), which is modeled as a solid sphere. This configuration mirrors the dimensions of the more detailed CAD geometry (Figure 2), but it does not constitute an exact replica; therefore, differences in the transport solver results are expected. The CAD model of the CA Onion Core was designed using the CAE tool OnShape. To enable particle transport simulations on CAD-based geometries, the approach used with OpenMC involves converting the CAD model into a discretized STL (stereolithography) surface mesh, where geometries are represented by a list of tiny triangles that build up to 3D shapes, using the open-source meshing tool CAD-to-OpenMC (Knudsen and Chierici, 2025) in conjunction with the DAGMC toolkit (Wilson et al., 2010), which allows for direct particle tracking on tessellated surfaces. The output is an h5m file, that can be input directly into OpenMC through the native support for DAGMC geometries. The meshing algorithm used in CAD-to-OpenMC is stl2, which uses the underlying library OpenCASCADE and is able to handle coincident surfaces. The meshing parameters used are the following.

Figure 1. Cross-section front view of simplified Onion Core CAD design.

Figure 2. Onion Core CSG model based on CAD design.
On the other hand, to import CAD geometries of solids in Serpent, the solid 1 card can be used, where unstructured meshes defining the domain’s geometry can be imported. Similarly, the CAD files need to be converted into STL meshes. In the STL-based methodology, the cell search routine loops over the STL solids with adaptive search cell and defines the location’s material with ray-tracking-based methods (Leppänen, 2022).
Altogether, the refinement of the STL geometry and the settings for the adaptive search geometry are parameters that potentially impact the transport calculation. Whenever performing code-to-code benchmarks, it is therefore relevant to compare the methods used to implement the CAD geometries and fine-tune the impacting input files and parameters. The STL meshing parameters are the following.
The adaptive cell search parameters are: MESH_SPLIT: splitting criterion for the adaptive search mesh (maximum number of geometry cells in search mesh cell), set to 10; MESH_DIM: number of levels in the adaptive search mesh, set to 4; SZ1: size of the search mesh at level 1, set to 4; SZ2: Size of the search mesh at level 2, set to 3; SZ3: size of the search mesh at level 3, set to 2.
The fuel salt used is an eutectic mixture of LiF-

Table 1. Main reactor core parameters.
3.1 Transport and depletion settings
Properly aligning nuclear data for coupled neutronics-depletion comparisons across different codes can be challenging, requiring a detailed understanding of the underlying computational procedures and the differences in implementation between codes. The guidelines provided in Romano et al. (2021) have been instrumental in verifying the necessary configuration settings. Below, the main parameters influencing the outcome of the comparison are briefly discussed.
3.1.1 Cross section data
The workflow for the construction of the neutron cross-section (XS) data used in the transport model consisted in utilizing all the available data in the ENDF/B-VIII.0 library and complementing them with missing nuclides sourced from JEFF-3.3. This combined library, developed at PSI, includes a total of 631 tabulated nuclides 1 . All material temperatures are approximated to available incident neutron temperatures of 900K and 300K to not rely on different temperature treatment methods used by the different transport codes.
3.1.2 Transport solver
The neutron transport simulation was set up using 200 batches, 20 of which were inactive and
3.1.3 Depletion settings
The evaluation method for the burnup matrix exponentials is the incomplete partial fraction (IPF) CRAM for OpenMC and partial fraction decomposition (PFD) CRAM for Serpent, both of order 16 (Pusa, 2011; Pusa and Leppänen, 2010; Pusa, 2016). These two methods are similar and are expected to give very similar results. The time integrator scheme used for the comparison is a predictor integrator.
3.1.4 Power normalization
Reaction rate normalization is calculated, assuming constant total power and total heating in the system obtained from Serpent constant fission heating values 2 , to ensure that identical Q values are used between the different codes.
3.1.5 Branching ratios
Capture branching ratios are taken to be identical to the default constant spectrum-averaged branching ratios used in Serpent, calculated from energy-dependent branching ratios in the JEFF-3.1 activation file from a PWR flux spectrum 3 .
3.1.6 Decay and fission product yield data
Data for decay and fission product yields (FPYs) from ENDF/B-VIII.0 are used. Energy dependence of FPY is treated differently, depending on the code used. Serpent uses a linear interpolation for non-tabulated energies to calculate an effective FPY. OpenMC adopts a method similar to that of Serpent in which the average energy of fission events is tallied. An effective fission product yield (FPY) is then computed by linearly interpolating between tabulated FPY data using this average energy, commonly referred to as the “average fission yield method”. These two implementations should be similar but not fully equivalent and might give rise to small discrepancies.
3.1.7 Transmutation reactions
The OpenMC and Serpent transport solvers compute reaction rates by explicitly tallying quantities like
3.1.8 Depletion settings
The MSE is depleted to 30MWd using a single depletion step. Wall materials are not set as depletable.
4 Models
4.1 Model 1
In the first benchmark using the CSG geometry, no distinction is made between in- and ex-core regions—the defined material volumes represent the total ones in system. A single transfer rate coefficient is applied to the fuel salt to simulate the continuous removal of noble gases, specifically xenon (Xe) and krypton (Kr), from the fuel region and transfer to the off-gas system (OGS), which is not defined geometrically as not being part of the in-core active geometry. This setup allows a focused comparison of the reprocessing implementation across different depletion codes. The removal is characterized by the following transfer rate coefficient:
—where:
This results in a transfer rate coefficient of
4.1.1 Implementation in different codes
transfer_rate feature through the Python API. A continuous transfer rate coefficient of integrator object as such:
integrator.add_transfer_rate(fuel,
[’Xe’,’Kr’],
0.006,
transfer_rate_units=’1/s’,
destination_material=ogs)
where fuel and ogs are materials defined in the OpenMC model.xml input file.
•Serpent: the transfer is implemented using three nested cards with hierarchic dependency. Firstly in mflow (mass flow), the isotopes to be transferred as well as their associated time constants are implemented. Then, in the rep (reprocessor) card, source and destination materials are pointed, as well as the transfer mode. Here, 1 corresponds to continuous transfer associated with artificial decay. Finally, the dep pro card includes the present stream into the depletion calculation. The settings following dep pro are conventional burnup settings.
mflow gasRem % mass flow block
Xe 0.006
Kr 0.006
rep offgas % reprocessor block
rc fuel ogs gasRem 1
dep pro offgas % Depletion block
•EQL0D: in EQL0D, Matlab classes are defined for the identification of materials to be depleted and for the associated reprocessing streams. In the Matlab part of the EQL0D input file, an instance of the reprocessing stream class is created while running the input; it contains all of the required information to create material flows.
In Rep(n), n is the n-th reprocessing stream, “Rep1” is the user-given reprocessor’s name, “fuel” and “ogs” are source and destination materials, “volatiles” is the vector of isotopes to be transferred (which can be set by ZAI identifier for single isotopes or atomic number for the transfer of all isotopes of a certain element), “eff” is an additional factor for scaling the performance of material transfers (1 for all isotopes, if left empty), 0.006 is the removal time constant, and “cont” identifies the material transfer mode—in this case, continuous transfer associated with artificial decay.
volatiles=[36, 54];
eff=[];
REP(n)=Rep(’Rep1’, ’fuel’, ’ogs’, volatiles, eff, 0.006, ’cont’);
4.2 Model 2
Aside from the geometry, the material definitions and simulation settings are identical to those used in Model 1. The purpose of this benchmark is to verify that, despite using different methods to perform Monte Carlo transport calculations on CAD geometries, the results remain consistent among the different codes.
4.3 Model 3
The final benchmark adds to the CAD geometry of Model 2 more detailed reprocessing schemes to simulate a more realistic case with transfer for all depletable inventories from the in- to ex-core regions and more accurate removal rates for noble gasses directly from the ex-core fuel region. Ex-core regions are not implemented in the geometry. A summary of the transfer coefficients adopted can be found in Table 2, where a total of seven interconnected transfer rates are defined.

Table 2. Main parameters used to calculate transfer rate coefficients in the CAD model with external zones.
As mentioned in Section 2, cyclic material transfers cannot be modeled within one single depletion step in Serpent. In this section, only OpenMC and EQL0D are therefore compared.
Moreover, as the decay transfer model is probabilistic, it can be physically interpreted as representing the statistical residence time distribution of fluid packets in a well-mixed or continuously stirred system and not a plug flow system. Therefore, it would properly represent the reactor flows only in the case in which the reactor fluids would constantly and homogeneously mix. However, as the fluid’s residence time is substantially shorter than the duration of the whole depletion step, the implementation of this model is still valid for capturing and testing the validity of the depletion calculation results in the case in which part of the reactor fluids are allowed to freely decay in an out-of-core region and to test the numerical behavior of the depletion steps once the burn-up matrices are substantially extended to mimic material transfers.
4.3.1 Implementation in different codes
integrator.add_transfer_rate(fuel_in_core,
all_elements,
0.01221,
destination_material=fuel_out_core)
integrator.add_transfer_rate(fuel_out_core,
all_elements,
0.01180,
destination_material=fuel_in_core)
Where fuel_in_core and fuel_out_core are materials defined in the OpenMC materials.xml and all_elements is a list containing all circulating elements.
• EQL0D: also in EQL0D, the circulation between the in- and out-core regions is modeled by defining two transfer processes for the entire inventory. For the fuel salt, this is defined as follows:
all_isotopes = 1:111;
REP(n)=Rep(“fuel_in_out,” “fuel_in,” “fuel_out,” all_isotopes, [], 0.01221, “cont”);
REP(n+1)=Rep(“fuel_out_in,” “fuel_out,” “fuel_in,” all_isotopes, [], 0.01180, “cont”);
Here “fuel_in” and “fuel_out” are the in- and ex-core fuel inventories, while all_isotopes is the vector including all the atomic numbers, implying that all the material isotopes are to be transferred.
5 Results
To enable a meaningful comparison of the source term and radiological impact for later analyses, the end-of-cycle (EOC) inventories are filtered to exclude radionuclides with negligible contributions. Specifically, those lacking corresponding dose conversion coefficients for radiotoxicity estimation are excluded from the comparison. The dose coefficients are taken from the EAF (European Activation File) - 2010 Neutron-Induced Cross Section Library (Sublet et al., 2010), used as a default for ingestion and inhalation radio-toxicity for Serpent versions prior to v2.1.30. For the isotopes with dose conversion coefficients tabulated in the ICRP Publication 119 ICR (2012) and used in Serpent versions after (and including) v2.1.30, the values from the EAF were overwritten. This was done to combine an extensive tabulation of dose conversion coefficients to cover volatile fission products such as krypton and xenon (from the EAF) as well as selecting recent coefficient when possible 4 .
5.1 Neutronics comparison
The effective multiplication factors were obtained from all transport models and compared, resulting in a difference at beginning-of-cycle (BOC) of approximately 20 pcm for both cases and within statistical uncertainty (Table 3).

Table 3.
5.2 Model 1: CSG benchmark
Approximately 20 g of fission products and 10 g of synthetic actinides, such as plutonium in the fuel salt and 233U in the blanket salt, were generated in the fuel salt after 30 days of irradiation at 1 MW(th). Table 4a presents the total masses, activities, and radiotoxicities at end-of-cycle (EOC) in the fuel salt, comparing results across the different codes. Relative differences of Serpent and EQL0D with respect to OpenMC are also reported for both fission products and synthetic actinides. The results demonstrate excellent agreement: total mass differences remain below 0.004

Table 4. Model 1: mass, activity, and radiotoxicity values from OpenMC, Serpent, and EQL0D simulations for fission products and synthetic actinides in fuel and blanket salts. Relative differences are computed with respect to OpenMC.

Table 5. Model 1: mass, activity, and radiotoxicity values from OpenMC, Serpent, and EQL0D simulations for fission products and synthetic actinides in OGS and moderator. Relative differences are computed with respect to OpenMC.
Finally, OpenMC slightly underestimates tritium production in the heavy water moderator, with a difference of 0.23
Most differences in comparing nuclide concentrations in OpenMC with Serpent and EQL0D are below 0.1

Figure 3. Model 1: nuclide concentration relative differences between OpenMC and Serpent, and OpenMC and EQL0D, for the most abundant and radiologically relevant nuclides in (a) fuel salt, (b) blanket salt, and (c) off-gas system (OGS).
In the blanket salt, fission products from bred 233U appear to be systematically lower than predicted by OpenMC by approximately 0.25
Although not shown, tritium production in OpenMC is lower, estimated by about 0.25
where each arrow denotes a
5.3 Model 2: CAD benchmark
The results for the fuel salt, OGS, and heavy water closely match those from the CSG model, with the same conclusions applicable. Total masses and activity in fuel salt fall all under 0.006

Table 6. Model 2: mass, activity, and radiotoxicity values from OpenMC, Serpent, and EQL0D simulations for fission products and synthetic actinides in fuel and blanket salts. Relative differences are computed with respect to OpenMC.

Table 7. Model 2: mass, activity, and radiotoxicity values from OpenMC, Serpent, and EQL0D simulations for fission products and synthetic actinides in OGS and moderator. Relative differences are computed with respect to OpenMC.
Despite the excellent agreement observed, as shown in Figure 4, the systematic discrepancy in the blanket salt fission products is reversed, with OpenMC exhibiting a slight over-prediction relative to Serpent by approximately 0.2
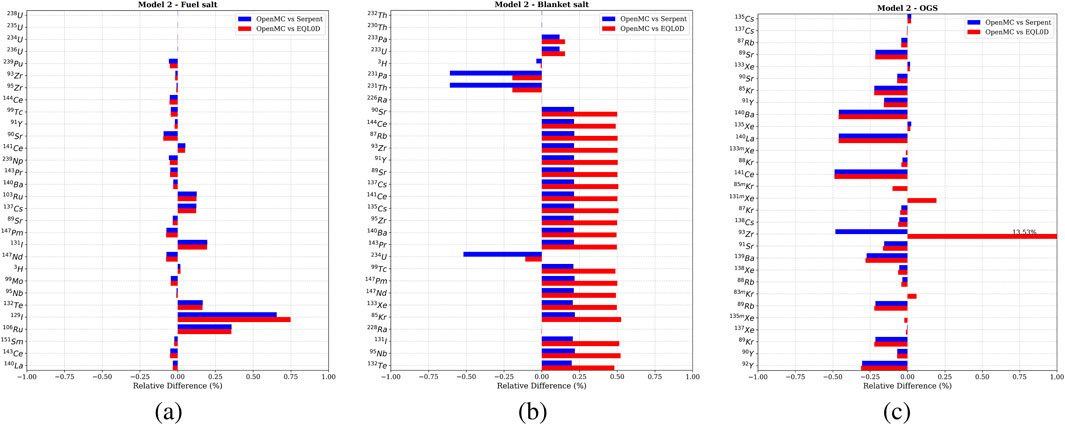
Figure 4. Model 2: nuclide concentration relative differences between OpenMC and Serpent, and OpenMC and EQL0D, for the most abundant and radiologically relevant nuclides in (a) fuel salt, (b) blanket salt, and (c) off-gas system (OGS).
5.4 Model 3: CAD with external zones benchmark
With the circulation of the inventory between in-core and out-core and the corresponding increase in the burnup block matrix size, more discrepancies arise due to numerical errors. Nevertheless, the overall agreement between OpenMC and EQL0D remains satisfactory. In the fuel salt, the total mass and activity of fission products and actinides differ by less than 0.7

Table 8. Model 3: mass, activity, and radiotoxicity values from OpenMC and EQL0D simulations for fission products and synthetic actinides in fuel and blanket salts. Relative differences are computed with respect to OpenMC.
In the OGS, total mass and activity differences are under 0.6

Table 9. Model 3: mass, activity, and radiotoxicity values from OpenMC and EQL0D simulations for fission products and synthetic actinides in OGS and moderator. Relative differences are computed with respect to OpenMC.
When examining nuclide concentrations differences in Figure 5, the discrepancies are more pronounced than earlier cases. This is primarily due to the increased size of the burn-up block matrix (with seven interconnected transfers) and potential numerical instabilities. Nevertheless, the majority of fission product and actinide concentrations in the fuel salt and OGS remain within 1

Figure 5. Model 3: nuclide concentration relative differences between OpenMC and EQL0D for the most abundant and radiologically relevant nuclides in (a) fuel salt, (b) blanket salt, and (c) off-gas system (OGS).
Comparing the inventories with those from Model 2, it is noteworthy that the effect of circulation between in- and ex-core regions, along with the removal of fission products from the ex-core to the OGS, introduce a non-negligible difference in the fuel salt fission products, where more fission products are contained in Model 3. The same holds for the OGS system inventory, where less fission gases are present in Model 3. However, the joint contribution of fuel salt and OGS fission products inventories match the joint ones of Model 2. This is because in Model 3, the rate of fission gas extraction is based on the processing time of only the external part of the fuel salt, and the gases have been extracted from there only. Since only krypton and xenon are extracted, whenever these are generated in the in-core fuel salt through fission, a considerable amount of time is being allowed to the in-core fission products to decay before being pumped to the out-core region and, finally, to the OGS. The fast-decaying isotopes of xenon and krypton therefore have time to be transformed into different elements through radioactive decay while being in the in-core and out-core regions before having the chance of extraction. These isotopes are not ultimately extracted to the OGS as they are no longer krypton and xenon isotopes, causing the fuel to present a higher and the OGS a lower mass of fission products, respectively.
6 Conclusion and future work
To accurately evaluate the MSE inventory and radiotoxicity at the end of the test, a comparative analysis was performed using three different depletion codes. In particular, a new Transfer Rates methodology was implemented in the OpenMC Monte Carlo transport code, similar to the approach used in Serpent and EQL0D. This feature enables the simulation of continuous fission product removal in molten salt reactors and supports the modeling of material circulation between different reactor regions. To assess the accuracy of the new depletion capability, three benchmark cases of increasing complexity were developed, incorporating progressively more advanced geometries and transfer rate features. The alignment of cross sections and nuclear data was meticulously verified by the authors, although minor inconsistencies or residual errors may still be present. The first two benchmark cases demonstrate very good agreement, with final radiotoxicity values for all inventories agreeing within 0.7
Several simplifying assumptions were made to facilitate the comparison. In future research, a more comprehensive evaluation should include the impact of temperature interpolation in cross sections, the implementation of more advanced depletion integration algorithms, and comparisons across different nuclear data libraries.
Data availability statement
The original contributions presented in the study are included in the article/Supplementary Material; further inquiries can be directed to the corresponding author.
Author contributions
LC: Conceptualization, Data curation, Formal Analysis, Methodology, Resources, Software, Validation, Visualization, Writing – original draft, Writing – review and editing. AR: Conceptualization, Data curation, Formal Analysis, Methodology, Resources, Software, Validation, Visualization, Writing – review and editing.
Funding
The authors declare that financial support was received for the research and/or publication of this article. This research was supported by a strategic partnership between Copenhagen Atomics A/S and The Paul Scherrer Institute. The funder had the following involvement in the study: provision of salary support for one author, collaboration with the institute employing the second author, and participation in the decision to publish. Alessio Rossi’s doctoral education is being sponsored by the Swiss National Science Foundation (SNSF).
Conflict of interest
Author LC was employed by Copenhagen Atomics.
The remaining author declares that the research was conducted in the absence of any commercial or financial relationships that could be construed as a potential conflict of interest.
Generative AI statement
The authors declare that no Generative AI was used in the creation of this manuscript.
Any alternative text (alt text) provided alongside figures in this article has been generated by Frontiers with the support of artificial intelligence and reasonable efforts have been made to ensure accuracy, including review by the authors wherever possible. If you identify any issues, please contact us.
Publisher’s note
All claims expressed in this article are solely those of the authors and do not necessarily represent those of their affiliated organizations, or those of the publisher, the editors and the reviewers. Any product that may be evaluated in this article, or claim that may be made by its manufacturer, is not guaranteed or endorsed by the publisher.
Supplementary material
The Supplementary Material for this article can be found online at: https://www.frontiersin.org/articles/10.3389/fnuen.2025.1677436/full#supplementary-material
Footnotes
1 The list of additional nuclides from JEFF-3.3 is provided in the attached datasets.
2 https://github.com/openmc-dev/data/blob/master/depletion/serpent_fissq.json
3 http://serpent.vtt.fi/mediawiki/index.php/Default_isomeric_branching_ratios
1 The full list of ingestion and inhalation coefficients used in the analysis is attached in the dataset.
References
Anderson, K., Mascolino, V., and Nelson, A. G. (2022). User guide to the advanced dimensional depletion for engineering of reactors (ADDER) software (V.1.01). Tech. Rep. Argonne Natl. Lab. Anl. Argonne, IL (United States). doi:10.2172/1866062
Aufiero, M., Cammi, A., Fiorina, C., Leppänen, J., Luzzi, L., and Ricotti, M. (2013). An extended version of the serpent-2 code to investigate fuel burn-up and core material evolution of the molten salt fast reactor. J. Nucl. Mater. 441, 473–486. doi:10.1016/j.jnucmat.2013.06.026
Hombourger, B., Křepel, J., and Pautz, A. (2020). The eql0d fuel cycle procedure and its application to the transition to equilibrium of selected molten salt reactor designs. Ann. Nucl. Energy 144, 107504. doi:10.1016/j.anucene.2020.107504
ICRP (2012). Compendium of dose coefficients based on ICRP publication 60. Tech. Rep. ICRP publication 119, international commission on radiological protection (ICRP). Ann. ICRP 41 (Suppl. l). doi:10.1016/j.icrp.2013.05.003
Knudsen, E. B., and Chierici, L. (2025). CAD_to_OpenMC: from CAD design to particle transport. J. Open Source Softw. 10, 7710. doi:10.21105/joss.07710
Leppänen, J. (2022). Methodology, applications and performance of the cad-based geometry type in the serpent 2 monte carlo code. Ann. Nucl. Energy 176, 109259. doi:10.1016/j.anucene.2022.109259
Leppänen, J., Valtavirta, V., Rintala, A., and Tuominen, R. (2025). Status of serpent monte carlo code in 2024. EPJ Nucl. Sci. Technol. 11, 3. doi:10.1051/epjn/2024031
Lo, A., Bostelmann, F., Hartanto, D., Betzler, B. R., and Wieselquist, W. A. (2022). Application of scale to molten salt fueled reactor physics in support of severe accident analyses. doi:10.2172/1897864
Pusa, M. (2011). Rational approximations to the matrix exponential in burnup calculations. Nucl. Sci. Eng. 169, 155–167. doi:10.13182/NSE10-81
Pusa, M. (2016). Higher-order chebyshev rational approximation method and application to burnup equations. Nucl. Sci. Eng. 182, 297–318. doi:10.13182/NSE15-26
Pusa, M., and Leppänen, J. (2010). Computing the matrix exponential in burnup calculations. Nucl. Sci. Eng. 164, 140–150. doi:10.13182/NSE09-14
Romano, P. K., and Forget, B. (2013). The OpenMC monte carlo particle transport code. Ann. Nucl. Energy 51, 274–281. doi:10.1016/j.anucene.2012.06.040
Romano, P. K., Josey, C. J., Johnson, A. E., and Liang, J. (2021). Depletion capabilities in the OpenMC monte carlo particle transport code. Ann. Nucl. Energy 152, 107989. doi:10.1016/j.anucene.2020.107989
Rykhlevskii, A., Bae, J. W., and Huff, K. D. (2019). Modeling and simulation of online reprocessing in the thorium-fueled molten salt breeder reactor. Ann. Nucl. Energy 128, 366–379. doi:10.1016/j.anucene.2019.01.030
Sublet, J.-C., Packer, L. W., Kopecky, J., Forrest, R. A., Koning, A. J., and Rochman, D. A. (2010). The european activation file: EAF-2010 neutron-induced cross section library. Tech. Rep. CCFE-R (10) 05, EURATOM/CCFE Fusion Assoc. Culham Sci. Centre, Abingdon, Oxfs. OX14 3DB, U. K. Available online at: https://fispact.ukaea.uk.
Keywords: Monte Carlo neutron transport, burnup calculations, molten salt reactor, OpenMC, Serpent, EQL0D, CAD, CSG
Citation: Chierici L and Rossi A (2025) Multi-step verification of the Copenhagen atomics molten salt experiment radioactive inventory at the Paul Scherrer Institute using OpenMC, Serpent, and EQL0D. Front. Nucl. Eng. 4:1677436. doi: 10.3389/fnuen.2025.1677436
Received: 31 July 2025; Accepted: 27 October 2025;
Published: 08 December 2025.
Edited by:
Mauricio Tano, Idaho National Laboratory (DOE), United StatesReviewed by:
Ondrej Chvala, The University of Texas at Austin, United StatesRitsuo Yoshioka, International Thorium Molten-Salt Forum, Japan
Copyright © 2025 Chierici and Rossi. This is an open-access article distributed under the terms of the Creative Commons Attribution License (CC BY). The use, distribution or reproduction in other forums is permitted, provided the original author(s) and the copyright owner(s) are credited and that the original publication in this journal is cited, in accordance with accepted academic practice. No use, distribution or reproduction is permitted which does not comply with these terms.
*Correspondence: Lorenzo Chierici , bG9yZW56by5jaGllcmljaUBjb3BlbmhhZ2VuYXRvbWljcy5jb20=