 Kangqian Lin1†Jianjiang Shao1†Yuting Cao2†Lijun Lu2Peng Lei2Xiaohong Chen2Mengwei Tong2Yaping Lu2
 Yizhong Yan1*Lei Zhang3*Xin Pan2,4*
 Weixia Nong2,4*
- 1Department of Preventive Medicine, School of Medicine, Shihezi University, Shihezi, Xinjiang, China
- 2Department of Hematology, The First Affiliated Hospital of Shihezi University, Shihezi, Xinjiang, China
- 3Clinical Laboratory, The First Affiliated Hospital of Shihezi University, Shihezi, Xinjiang, China
- 4National Hematology Clinical Research Center Xinjiang Production and Construction Corps Branch Center, Shihezi, Xinjiang, China
Objectives: The aims of this study were to explore the incidence characteristics and trend prediction of lymphoma from 2005 to 2035, and to provide data basis for the prevention and control of lymphoma in China.
Method: The data on lymphoma incidence in China from 2005 to 2017 were obtained from the Chinese Cancer Registry Annual Report. The Joinpoint regression model was used to calculate annual percentage change (APC) and average annual percentage change (AAPC) to reflect time trends. Age–period–cohort models were conducted to estimate age, period, and cohort effects on the lymphoma incidence. A Bayesian age–period–cohort model was used to predict lymphoma incidence trends from 2018 to 2035.
Results: From 2005 to 2017, the incidence of lymphoma was 6.26/100,000, and the age-standardized incidence rate (ASIR) was 4.11/100,000, with an AAPC of 1.4% [95% confidence interval (CI): 0.3%, 2.5%]. The ASIR was higher in men and urban areas than in women and rural areas, respectively. The age effect showed that the incidence risk of lymphoma increased with age. In the period effect, the incidence risk of lymphoma in rural areas decreased first and then increased with 2010 as the cutoff point. The overall risk of lymphoma incidence was higher in the cohort before the 1970–1974 birth cohort than in the cohort after. From 2018 to 2035, the lymphoma incidence in men, women, and urban areas will show an upward trend.
Conclusion: From 2005 to 2017, the incidence of lymphoma showed an increasing trend, and was different in regions, genders, and age groups in China. It will show an upward trend from 2018 to 2035. These results are helpful for the formulation and adjustment of lymphoma prevention, control, and management strategies, and have important reference significance for the treatment of lymphoma in China.
Introduction
Since the 20th century, the disease spectrum has changed in most countries around the world. The source of disease burden has shifted from infectious diseases to chronic non-communicable diseases (NCDs), such as cardiovascular diseases and cancers, which have become the primary diseases affecting human health and life. According to the World Health Organization (WHO), NCDs kill an estimated 41 million people every year, equivalent to 74% of all deaths worldwide (1). Among NCDs, cancer ranks second in the number of deaths after cardiovascular diseases, accounting for 22.7% of all NCD deaths (1). According to the latest report of WHO’s International Agency for Research on Cancer, by 2020, there will be an estimated 19.3 million new cancer cases and nearly 10 million cancer deaths worldwide (2). Cancer has become one of the main causes of human incidence and death worldwide (3, 4).
Among the many types, lymphoma is one of the relatively common cancers. Lymphoma is a cancer that originates in hematopoietic and lymphoid tissues. According to the Global Cancer Report 2020, there were 627,400 (3.2%) new cases of lymphoma worldwide in 2020, an increase of 85.98% compared with 2000; the number of global lymphoma deaths in 2020 was 283,200 (2.8%), an increase of 47.8% from 2000 (2, 5). In 2020, there were approximately 101,400 new cases of lymphoma in China, accounting for 16.16% of the global lymphoma incidence; approximately 47,000 people died of lymphoma in China, accounting for 16.60% of the global lymphoma deaths (6). Lymphoma is still a health hazard and a public health problem that cannot be ignored.
Analyzing trends and predictions of lymphoma incidence could provide key clues to guide future epidemiological studies. This study collected national, gender, and region-specific lymphoma incidence data from the Chinese Cancer Registry Annual Report. The Joinpoint regression model was used to reflect the trend in lymphoma incidence from 2005 to 2017, and the age–period–cohort model was used to analyze the impact of age, period, and cohort effects on the risk of lymphoma. Using the Bayesian age–period–cohort (BAPC) model to predict the incidence trend of lymphoma from 2018 to 2035 could provide a reference for the adjustment of the prevention and control policy of lymphoma in the future, important basic data for the control of lymphoma in China, and a scientific basis for the treatment of lymphoma.
Materials and methods
Data sources
The data on the incidence and age-standardized incidence rate (ASIR) of lymphoma in China from 2005 to 2017 (7) came from the “Chinese Cancer Registry Annual Report, 2008–2020” (8–20). Lymphoma cases were identified according to the International Classification of Diseases (ICD-10/C81–85, C88, C90, C96); non-Hodgkin’s lymphoma, Hodgkin’s lymphoma, malignant immunoproliferative diseases, and malignant plasma cell neoplasms are included (21). The raw data were collected from the cancer registries of 31 provinces (autonomous regions and municipalities) and Xinjiang Production and Construction Corps, which is the only source of nationwide cancer data, and its coverage is still evolving and expanding, and is currently based on a sample of 10%–35% of the national population. In addition, the data are reviewed, evaluated, and organized for analysis in accordance with the Guidelines for Tumor Registration in China and the requirements of the International Association of Cancer Registries/International Agency for Research on Cancer (IARC). The registry procedure and things like coding practice are consistent across different areas and throughout the study period. The data quality evaluation used the indicators of the percentage of morphological verification of diagnosis, percentage of death certificate only, and the mortality/incidence ratios to evaluate the quality of data reporting (22). The average proportion of the indicators from 2005 to 2017 were 67.83, 2.11, and 0.62, respectively. The data quality of this database is high, and all the indicators are in line with the evaluation standard, which can truly reflect the cancer prevalence, and the data are reliable.
Statistical analysis
Joinpoint regression model
The Joinpoint regression model was used to calculate the annual percentage change (APC), average annual percentage change (AAPC), and their 95% confidence interval (CI) to conduct trend analysis on the incidence of lymphoma. The detailed introduction has been described in our group’s previous study (23).
Age–period–cohort model
The age–period–cohort model was conducted to analyze the age, period, and cohort effects on lymphoma incidence. The detailed introduction has been described in our group’s previous study (23).
Bayesian age–period–cohort model
The BAPC model is based on the age–period–cohort model, which describes trends in disease by considering the effects of age, period, and cohort on the incidence. Using the age–period–cohort model, future incidence can be predicted. However, owing to the linear relationship between age, period, and cohort factors in the model, parameter estimation is difficult, so a Bayesian model is added. According to the Bayesian formula, the prior information of unknown parameters can be combined with the sample information to obtain the posterior information, and then the unknown parameters can be inferred according to the posterior information. The commonly used Integrated Nested Laplace Approximation (INLA) algorithm for model estimation directly approximates the posterior marginal distribution, avoiding mixing and convergence problems (24, 25). INLA operates as a precise framework within the Bayesian statistical approach, utilizing a blend of analytical methods and numerical integration techniques to obtain highly precise deterministic estimates for the posterior distributions of interest. A significant advantage of employing INLA is its rapid computational efficiency, which is particularly beneficial when dealing with expansive and intricate models. Additionally, INLA, as a deterministic procedure, is not prone to the issues of sluggish convergence and inadequate mixing that can plague other algorithms (26). The expression is:
where k is the precision parameter; Q is the second difference penalty term; and αi(i=1, …, I) is the age effect.
Population forecasts were derived from the World Population Prospects 2022 (27), the 27th version of the official population estimates and forecasts developed by the United Nations. Among them, in order to evaluate the performance of the BAPC model in predicting the incidence rates of lymphoma in China (i.e., according to gender and region) and the accuracy of the prediction, a retrospective prediction of the 2005–2017 data was performed by the BAPC model. The actual observations and the prediction result values were compared to each other with the three indexes of the mean absolute error, mean absolute percentage error, and the fitting accuracy (equal to 1 − mean absolute percentage error), which were used to evaluate the effectiveness of the forecasts; a fitting accuracy of 80% or more was considered good (28, 29).
Joinpoint regression analysis was performed using the Joinpoint Regression Program 5.0.2 software. In addition, with the Joinpoint Regression Program 5.0.2 software update, the model utilizes the Weighted Bayesian Information Criterion for the number, location, and p-value of the turning points. With the increased processing speed provided by the Weighted Bayesian Information Criterion approach, Joinpoint now allows a default setting of six or seven maximum number of Joinpoints, depending on the number of data points. The age–period–cohort model was conducted using the online web page analysis tool (30). BAPC and INLA packages of R 4.3.1 software were used to create a BAPC model. p < 0.05 was regarded as a statistically significant difference.
Results
The incidence and changing trends of lymphoma in China from 2005 to 2017
From 2005 to 2017, a total of 153,280 new cases of lymphoma were reported in Chinese cancer registration areas, including 88,902 men (58.0%) and 64,378 women (42.0%), with 98,807 cases (64.5%) in urban areas and 54,473 cases (35.5%) in rural areas. The incidence rate was 6.26/100,000 (men 7.17/100,000, women 5.33/100,000; urban 7.46/100,000, rural 4.85/100,000), and the ASIR was 4.11/100,000 (men 4.84/100,000, women 3.40/100,000; urban 4.69/100,000, rural 3.08/100,000). The incidence and ASIR were higher in men and urban areas (Table 1).
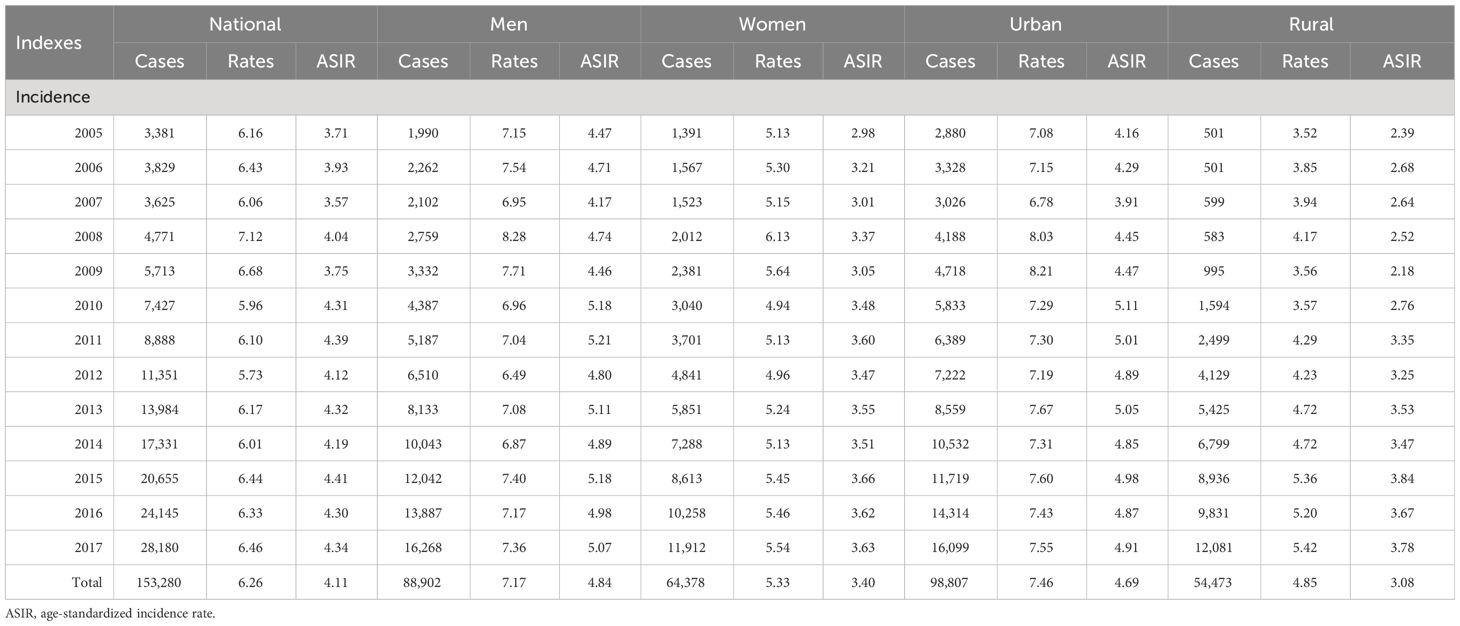
Table 1 Incidence of lymphoma in Chinese cancer registration areas from 2005 to 2017 (/100,000).
From 2005 to 2017, the ASIR of lymphoma in China increased from 3.71/100,000 in 2005 to 4.34/100,000 in 2017, AAPC = 1.4% (95% CI: 0.3%, 2.5%). For men, the ASIR of lymphoma increased from 4.47/100,000 in 2005 to 5.07/100,000 in 2017, AAPC = 1.2% (95% CI: 0.1%, 2.2%). For women, the ASIR increased from 2.98/100,000 in 2005 to 3.63/100,000 in 2017, AAPC = 1.6% (95% CI: 0.6%, 2.6%). By region, the ASIR of urban lymphoma increased from 4.16/100,000 in 2005 to 4.91/100,000 in 2017, AAPC = 1.7% (95% CI: 0.7%, 2.7%), of which, from 2005 to 2011, the APC was 3.7% (95% CI: 2.2%, 9.9%) and −0.4% (95% CI: −5.3%, 1.1%) in 2011–2017. For rural areas, it increased from 2.39/100,000 in 2005 to 3.78/100,000 in 2017, AAPC = 4.4% (95% CI: 2.8%, 6.3%). The growth rate of the ASIR of lymphoma in rural areas was 2.59 times that of urban areas, but it was lower than that in urban areas (Tables 1, 2; Figure 1).
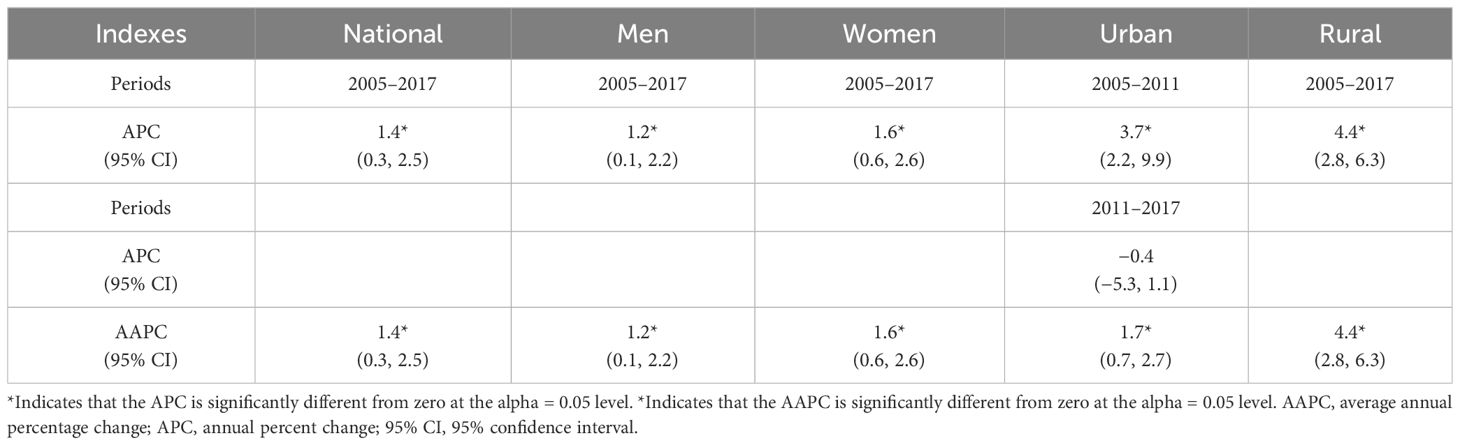
Table 2 Trends in lymphoma incidence in China from 2005 to 2017 (%).
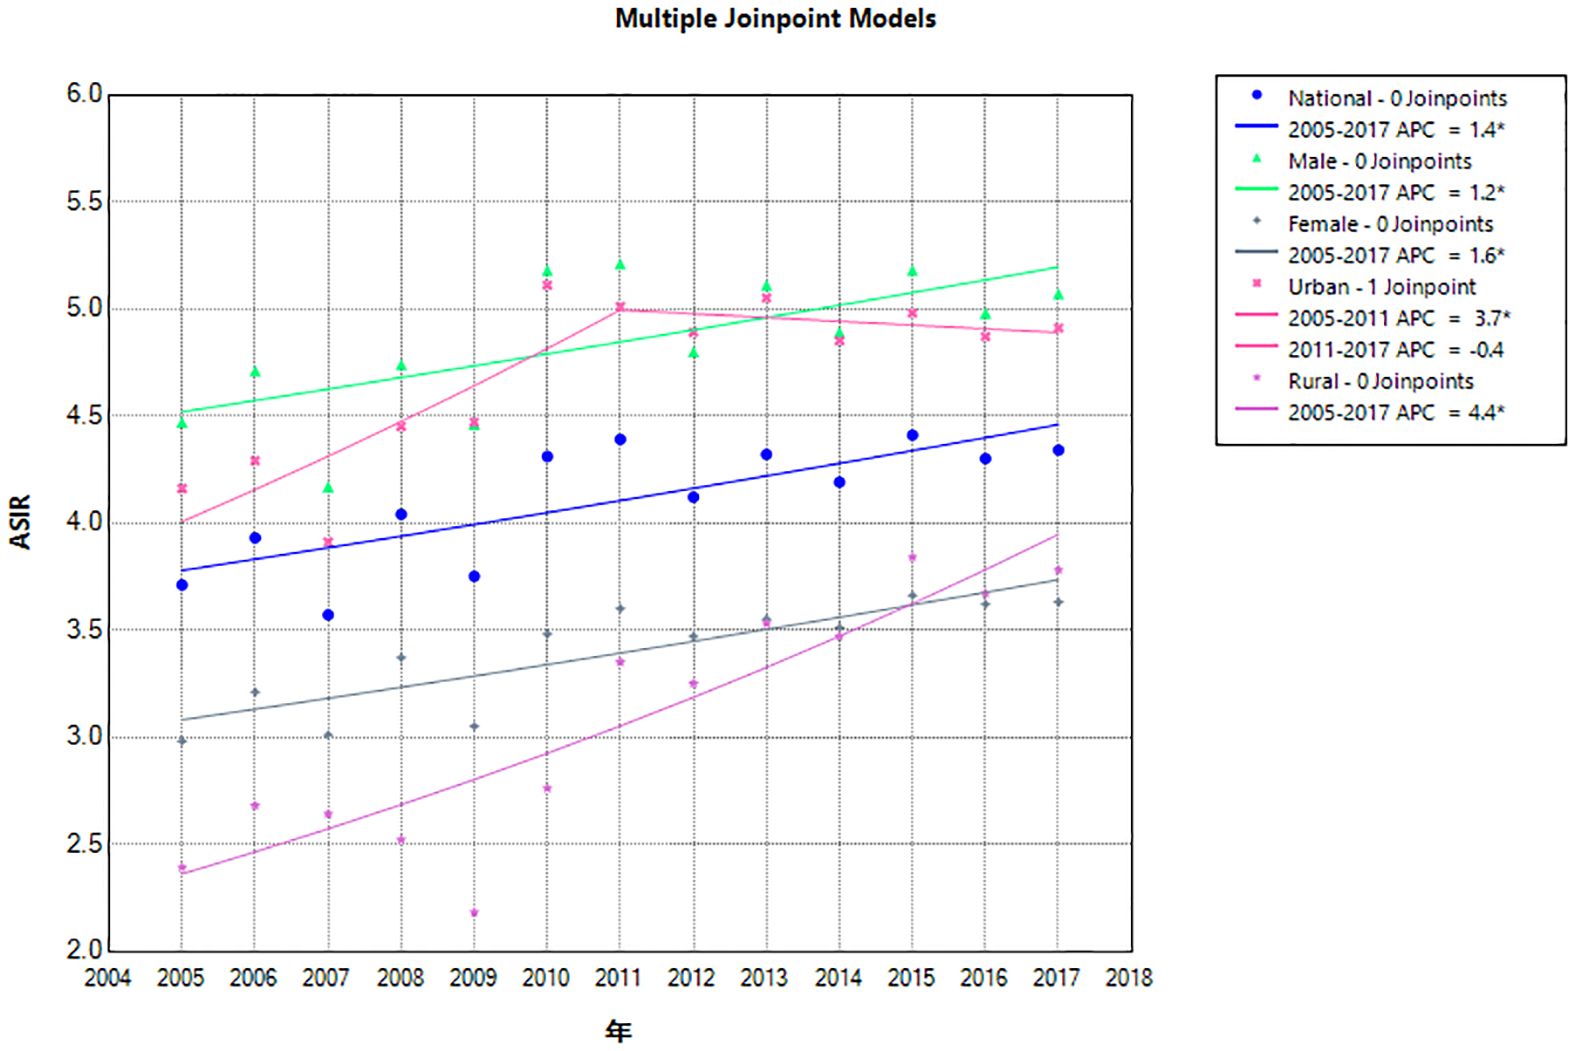
Figure 1 Joinpoint regression of lymphoma incidence in China from 2005 to 2017. APC, annual percentage change; ASIR, age-standardized incidence rate.
Age–period–cohort model analysis
The age effect of lymphoma incidence risk was consistent across the country, different genders, and different regions. Among people aged 0–45 years, the risk of lymphoma slowly increased with age. In people aged 45–75 years, the risk of lymphoma increased with age. After the age of 75 years, it gradually decreased.
In terms of the period effect, the risk of lymphoma in the national level, in men, and in urban areas gradually decreased over time, while the lymphoma risk in women and rural areas decreased and then increased from 2010 as the cutoff point. The overall risk of lymphoma incidence was higher in the cohort before the 1970–1974 birth cohort than in the cohort after. The cohort effect trends for lymphoma risk in men, women, and urban areas were generally consistent nationally but reversed in rural areas. The cohort effect of the cohort group born after 1970–1974 was higher than that of the previous cohort group. The overall trend was increasing (Figures 2, 3).
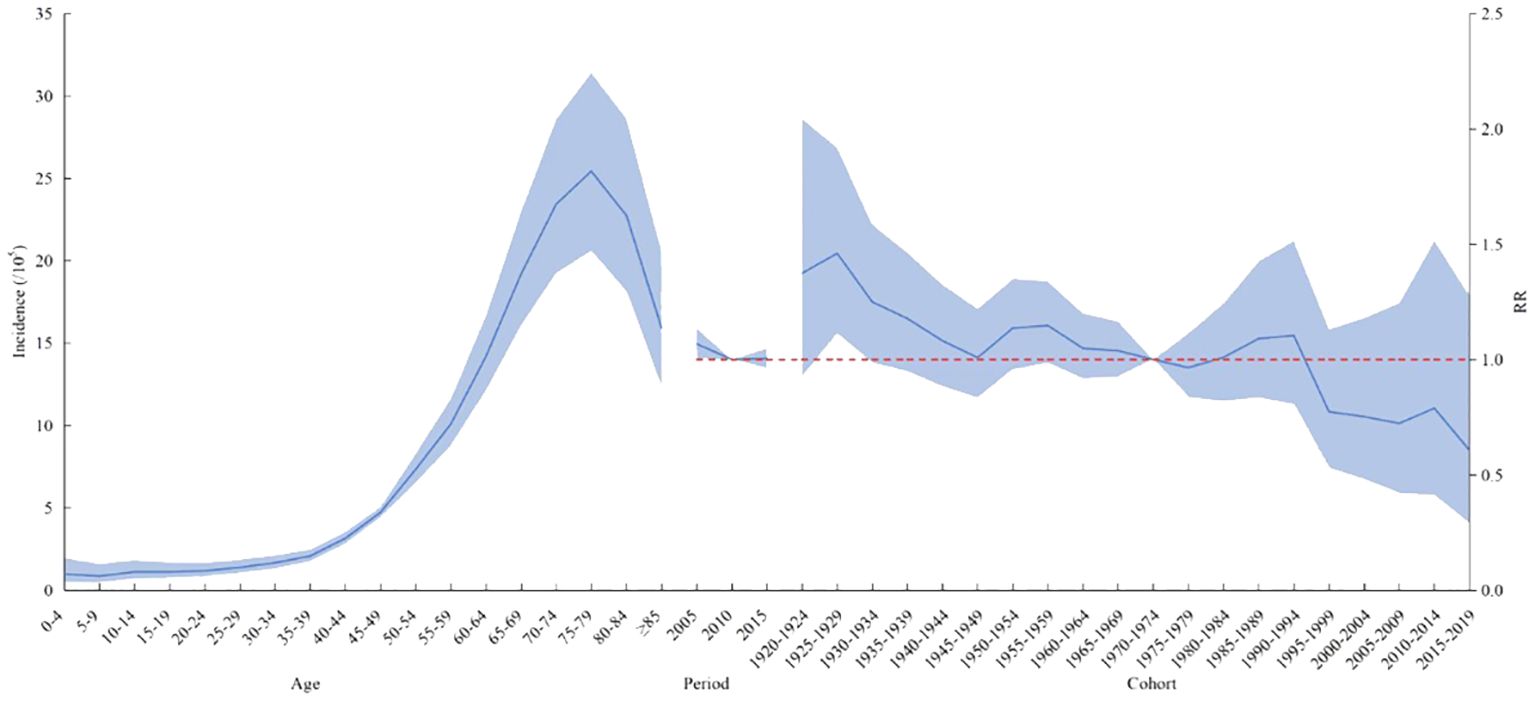
Figure 2 Age–period–cohort analysis of the incidence of lymphoma in China from 2005 to 2017. RR, risk ratio. The blue portion indicates the 95% confidence intervals, and the shaded bands represent the intervals in an increment or decrement of 10%.
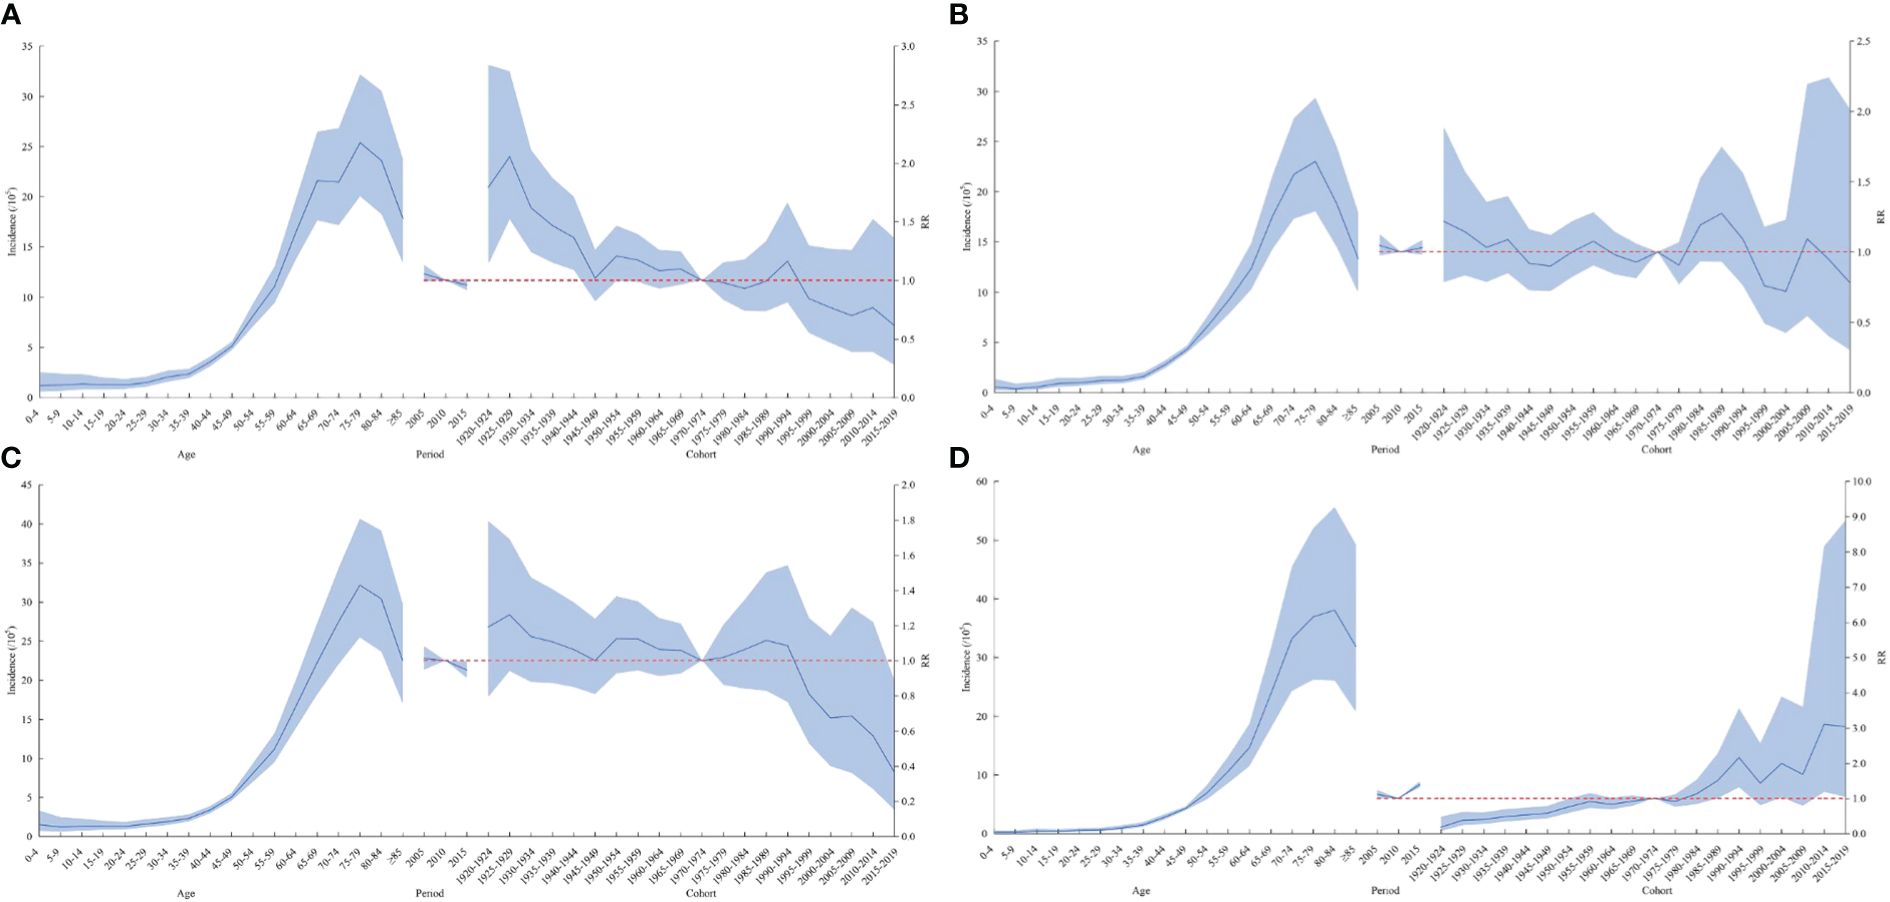
Figure 3 Age–cohort analysis of lymphoma incidence rates among men (A), women (B), urban (C), and rural areas (D) in China from 2005 to 2017. RR, risk ratio. The blue portion indicates the 95% confidence intervals, and the shaded bands represent the intervals in an increment or decrement of 10%.
The Wald chi-square test results of Local Drift showed a decreasing trend in the risk of lymphoma incidence in the national level, in women, and in urban areas, but the difference was not statistically significant. The risk of lymphoma incidence in men showed a decreasing trend, while the risk of lymphoma incidence in rural areas showed an increasing trend, with a statistically significant difference. The results of Local Drift showed a trend of cohort effect on the risk of incidence in the whole nation, in different genders, and in different regions, with a statistically significant difference (Table 3; Figure 4).
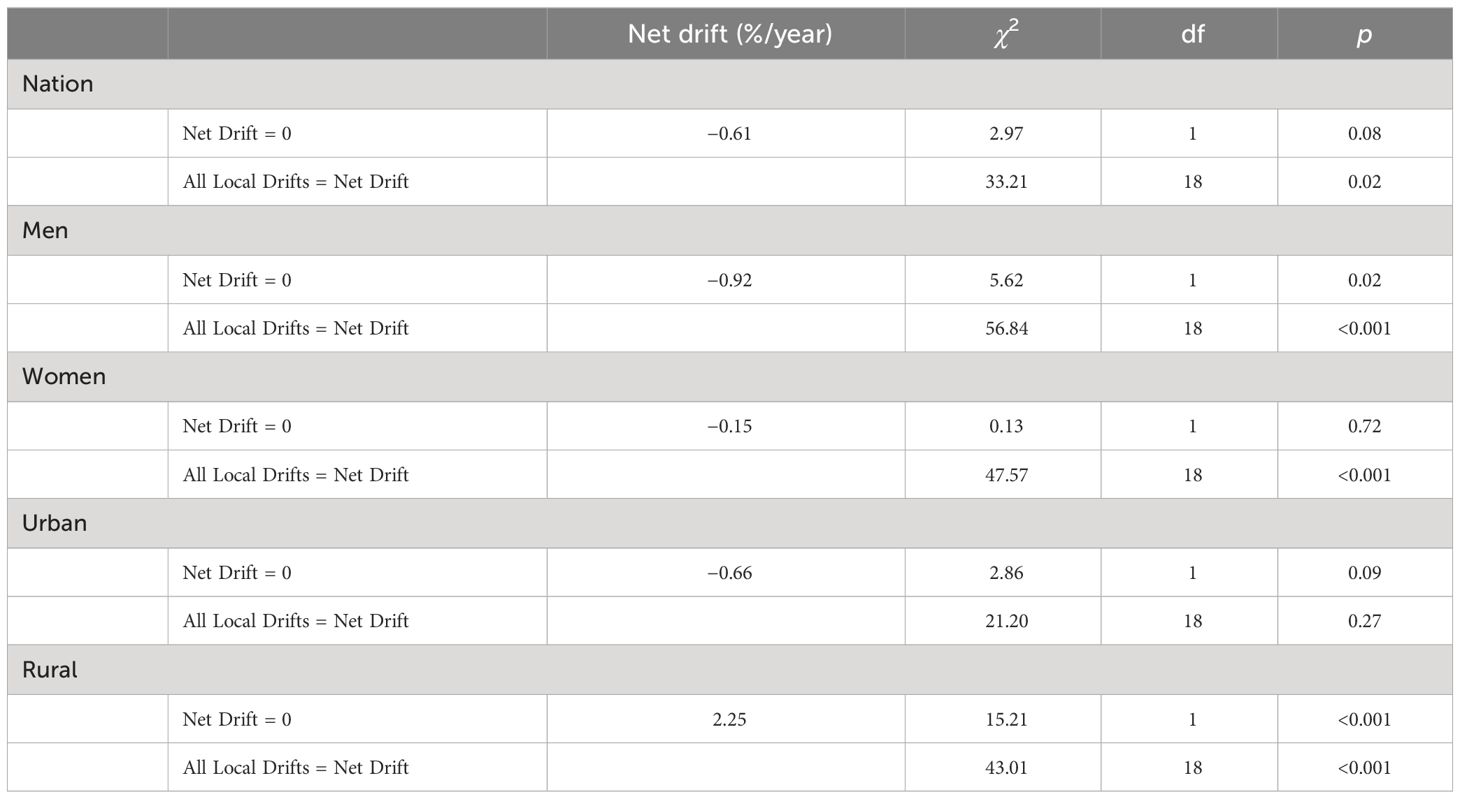
Table 3 The net drift and test results of the age–period cohort analysis of lymphoma incidence.
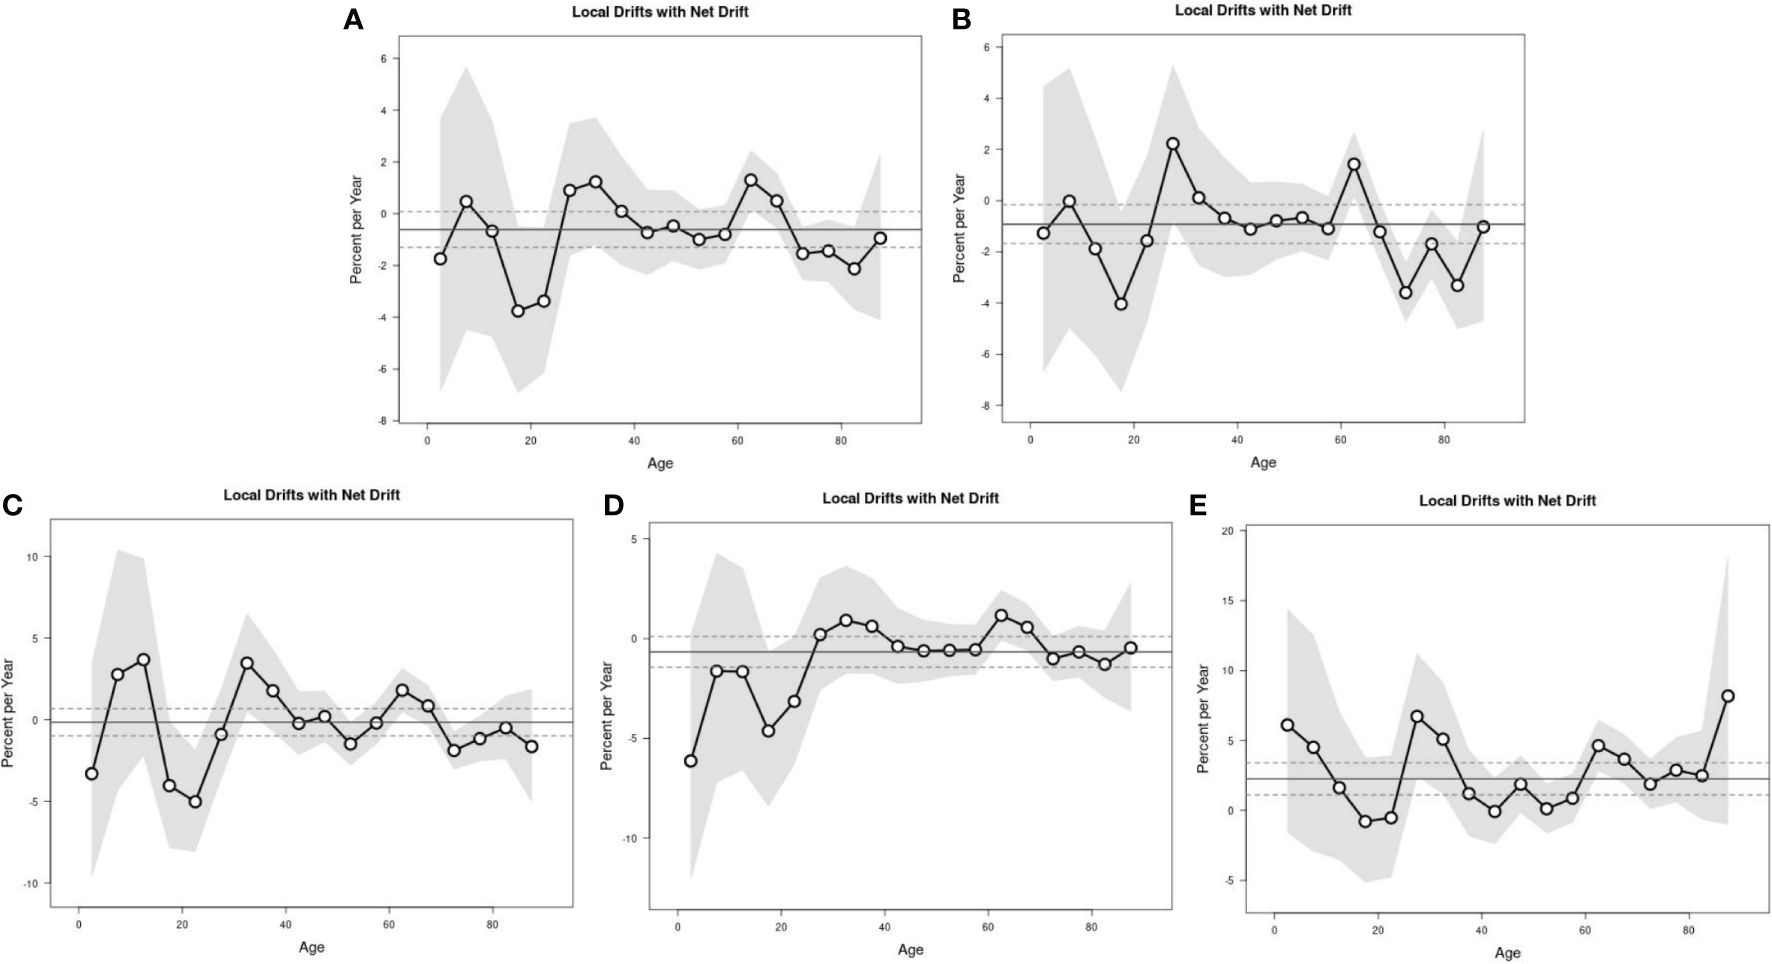
Figure 4 The local drifts with net drift of lymphoma incidence. Nation (A), men (B), women (C), urban (D), and rural areas (E).
Prediction of lymphoma incidence in China
From the fitting results of lymphoma incidence, the fitting accuracy of the BAPC model was 82.05% for the entire nation, 81.82% for men, 82.18% for women, 82.54% for urban areas, and 81.42% for rural areas (Table 4). It can be seen that in predicting the incidence of leukemia, the fitting accuracy of the BAPC model was above 81%, and the predictive performance of the model was considered good, and it captured the main trends of the data with a certain degree of accuracy.
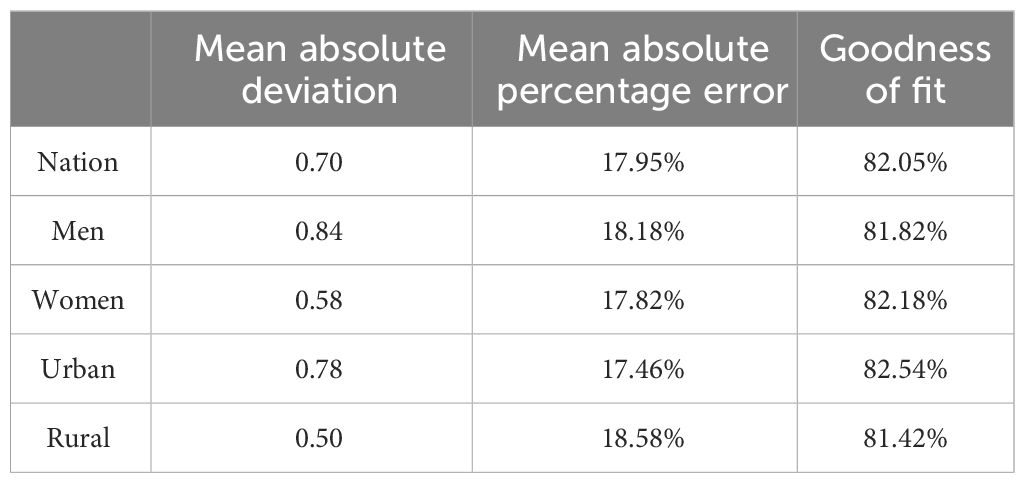
Table 4 Results of lymphoma model prediction efficacy in China.
The BAPC model predicted that the ASIR of lymphoma in China will continue to rise from 2018 to 2035. The incidence rate of lymphoma in 2018, 2020, 2025, 2030, and 2035 will be 4.73/100,000 (95% CI: 4.69, 4.76), 4.84/100,000 (95% CI: 4.80, 4.88), 5.11/100,000 (95% CI: 5.07, 5.15), 5.35/100,000 (95% CI: 5.31, 5.38), and 5.57/100,000 (95% CI: 4.69,4.76), respectively. The changing trend of lymphoma incidence in men and urban areas was similar to that in the whole country, while that in women and rural areas was relatively flat. It is predicted that the lymphoma incidence in men will still be higher than that in women in the future. The incidence in men and women will increase from 5.48/100,000 (95% CI: 5.42, 5.53) and 3.94/100,000 (95% CI: 3.90, 3.99) in 2018 to 6.38/100,000 (95% CI: 6.32, 6.44) and 4.09/100,000 (95% CI: 4.04, 4.14) in 2035, respectively. The incidence in urban and rural areas will increase from 5.32/100,000 (95% CI: 5.27, 5.37) and 4.12/100,000 (95% CI: 4.07, 4.17) in 2018 to 5.72/100,000 (95% CI: 5.67, 5.78) and 5.77/100,000 (95% CI: 5.72, 5.83) in 2035, respectively (Table 5; Figures 5, 6).
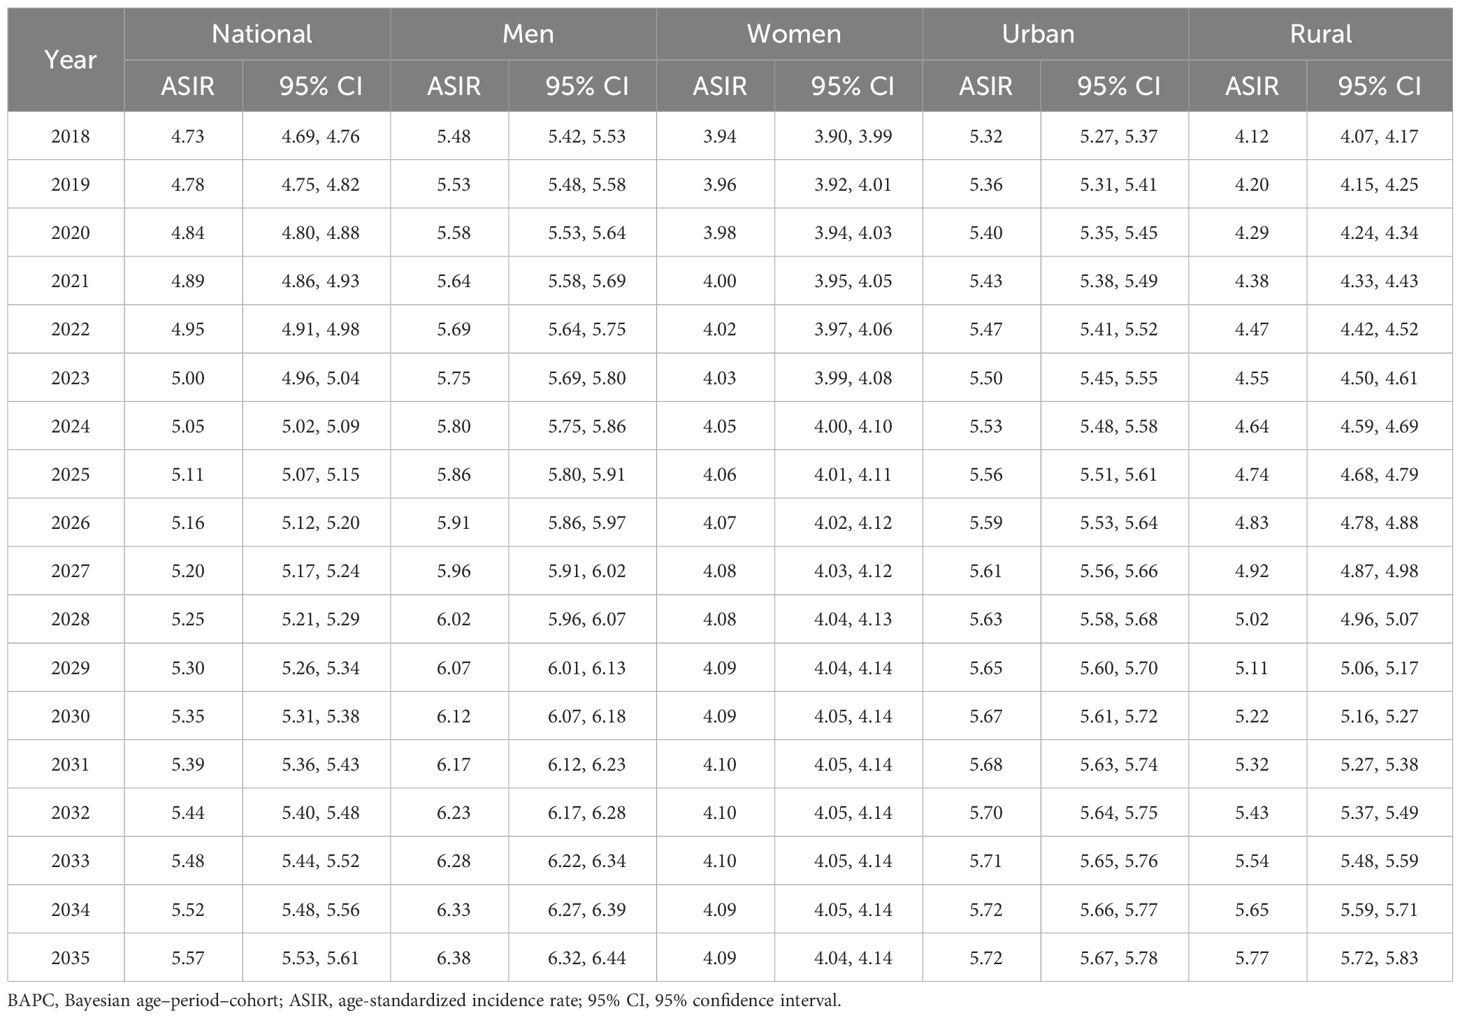
Table 5 BAPC model predicts the incidence of lymphoma in China from 2018 to 2035 (/100,000).
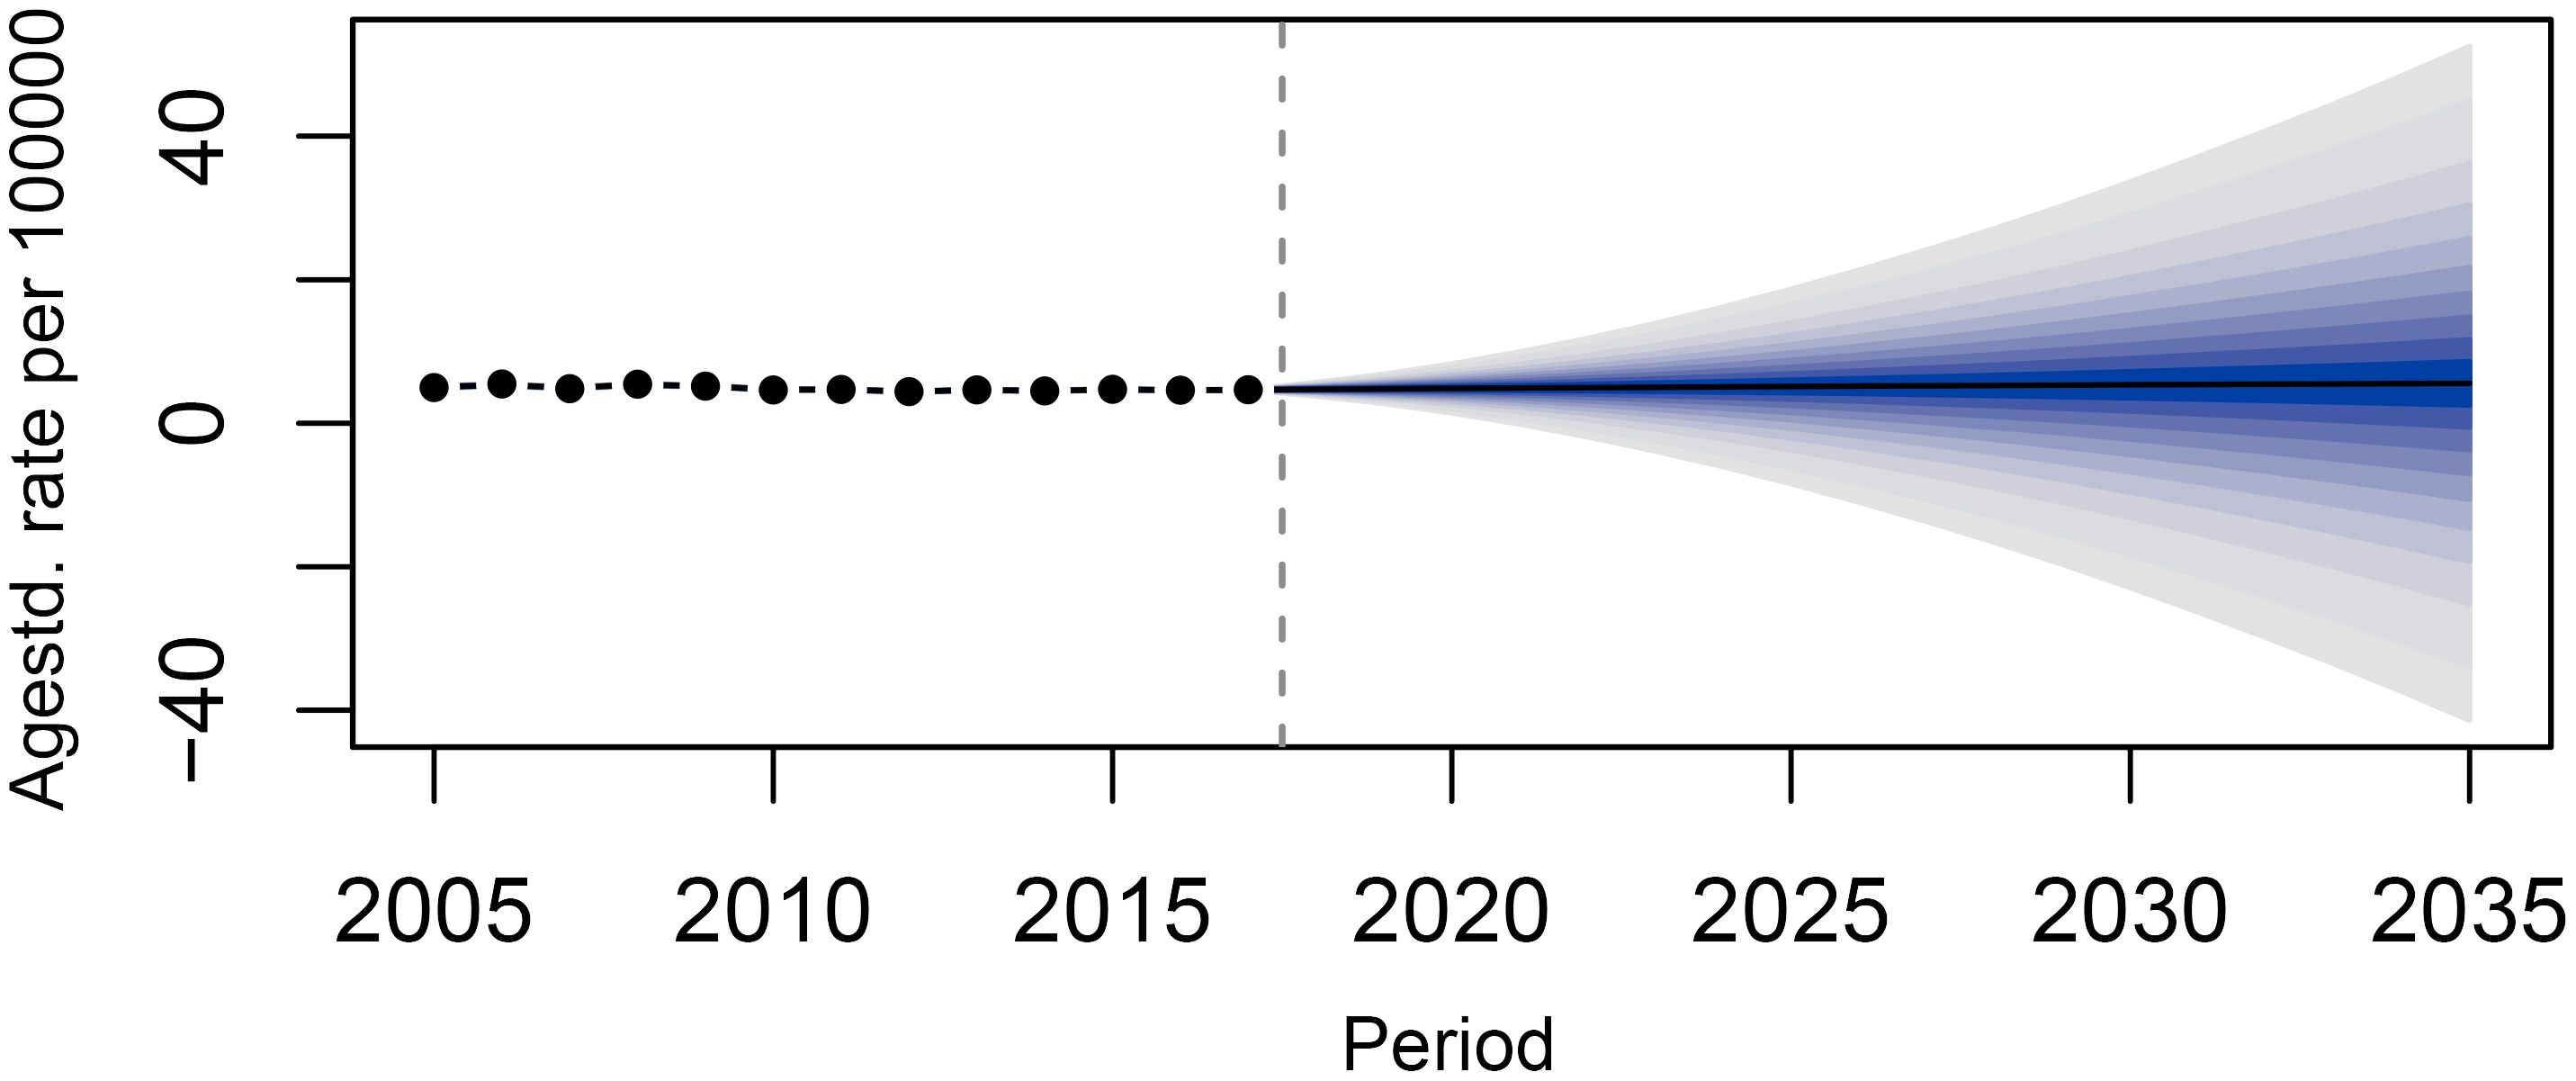
Figure 5 Prediction of the incidence rate of lymphoma in China from 2018 to 2035.
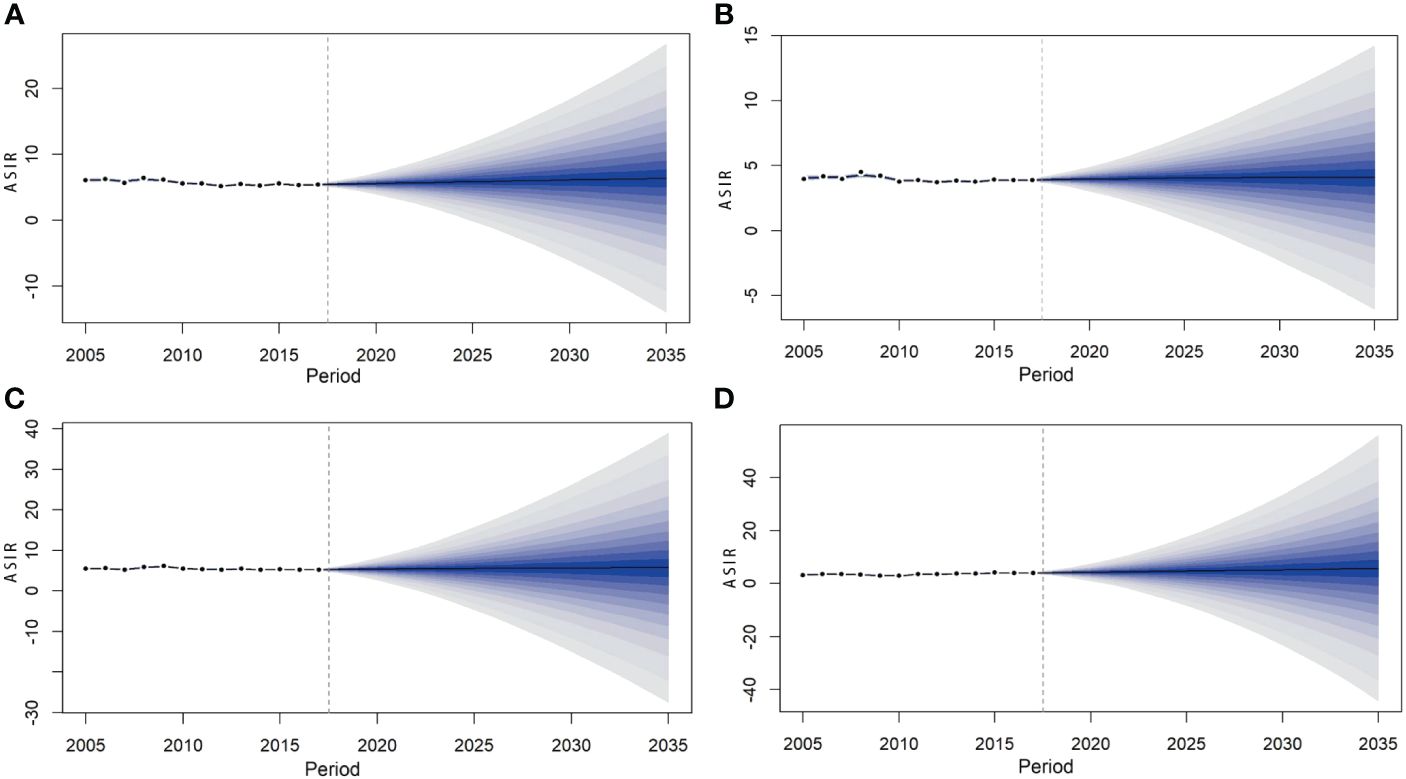
Figure 6 Prediction of lymphoma incidence among men (A), women (B), urban (C), and rural areas (D) in China from 2018 to 2035.
Discussion
By analyzing the epidemic characteristics, age–period–cohort effect, and prediction of lymphoma from 2005 to 2035, this study found that the ASIR of men was higher than that of women, and the ASIR of rural areas was lower than that of urban areas, but the AAPC of rural areas was much higher, and the growth rate was faster. The age effect on the incidence of lymphoma all showed that the risk increased with age. In the period effect, the incidence of lymphoma in rural areas decreased first and then increased with 2010 as the cutoff point. The overall risk of lymphoma incidence was higher in the cohort before the 1970–1974 birth cohort than in the cohort after. It is predicted that from 2018 to 2035, the incidence rate of lymphoma in China, in men and women, and in urban areas will show an upward trend.
The occurrence of lymphoma is the result of multiple factors, including genetic factors, gene mutations, immune regulation imbalance, and inflammatory response (31, 32). These mechanisms lead to abnormal proliferation and differentiation of lymphocytes, eventually forming lymphoma. Some viruses, bacterial infections, and long-term exposure to certain chemicals, radiation, or harmful substances in the environment may also increase the risk of lymphoma. As previous studies have shown, infections such as Epstein–Barr virus and human immunodeficiency virus are associated with an increased incidence of lymphoma (33, 34); Helicobacter pylori infection is associated with gastric mucosa-related lymphoid tissue lymphoma (35).
The incidence of lymphoma was on the rise from 2005 to 2017, consistent with the results of previous studies. The increased incidence of lymphoma may be attributed to improved diagnosis and an increase in associated risk factors (36). The main principle of the fourth edition of Hematopoietic Lymphoid Tissue Tumor Classification published by WHO in 2008 (37) is to classify lymphomas into precursor cell lymphomas and mature cell lymphomas according to the cell origin, morphology, immunophenotype, genetics, and clinical characteristics of the cancer. The 2016 update of the WHO Classification of Hematopoietic and Lymphoid Tissue Tumors builds on the 2008 version by adding molecular genetic criteria (38) to make the diagnosis of lymphoma more accurate and specific (39). Moreover, this phenomenon can be partly attributed to population growth and aging. Lymphoma is very common in middle-aged and elderly people. According to a report by China’s National Bureau of Statistics, the country’s population increased from 129,533 million in 2000 to 1,412.12 million in 2020, while the proportion of people aged 65 and above increased from 6.96% to 13.50%. The aging process is significantly accelerated (7, 40). This reminds us of the need to further investigate the relationship between lymphoma and changes in population size and age composition in the future.
The occurrence of lymphoma varies by sex. The results of a study investigating the global burden of hematological malignancies from 1990 to 2019 have revealed significant gender differences in the incidence of lymphoma (41). A study in the United States showed that the incidence of lymphoma was approximately 50% higher in men than in women in 2016 (42). In an observational study of lymphoma and myeloma mortality in China from 2004 to 2017, Zhu et al. (43) also found that the mortality rate for men was almost twice that for women. In this study, the ASIR was higher in men than in women. This trend may be attributed to differences in hormonal and genetic factors between men and women, as well as differences in infections, environmental exposures, and lifestyle factors that may increase the risk of malignant blood diseases in men (36, 44). Studies have shown that smoking is one of the major risk factors for cancer in China, second only to chronic infections, accounting for 22.6% of cancer deaths (45). According to the Chinese Center for Disease Control and Prevention’s adult tobacco survey report, the current smoking rate in China is 52.1% for men and 2.7% for women (46). The fact that smoking rates are much higher among men than women may be an important contributing factor (47). Although China has made some progress in recent years, stronger tobacco control policies are still needed. Studies showed that if China strictly implements the policies recommended by the WHO Framework Convention on Tobacco Control, more than 10 million deaths are expected to be avoided by 2050 (48). Taxes and smoke-free policies are two effective interventions. Therefore, national legislation should be developed and improved as soon as possible to ban smoking in public places, include smoking cessation drugs in health insurance, and increase tobacco taxes (a 10% increase in the price of tobacco can reduce tobacco consumption in high-income countries) (49, 50).
The results of this study showed that ASIR was higher in urban areas than in rural areas, but the increase in rural areas was 2.59 times that in urban areas. This is similar to previous findings (43, 51). One possible reason is the imbalance between urban and rural development, as well as the uneven level of diagnosis, accessibility, and equity of health services. Diagnosis levels and access to health services are relatively high in urban areas, and lymphoma detection rates are higher than in rural areas. The incidence of lymphoma was increasing at a faster rate in rural areas than in urban areas, which may be related to improved access to medical services in rural areas (such as increased patient visits, improved diagnosis and detection rates), expansion and refinement of cancer registries, and other factors. For example, access to medical services in rural areas continues to improve, and in 2009, China launched a major healthcare reform to provide equal access to basic medical services for all citizens. Since then, government spending on healthcare has increased fourfold (52). From 2008 to 2014, health resources and access in rural areas increased by approximately 50% (53). In 2008, the central government provided financial support to launch a national cancer registration project, and the coverage and number of people are constantly expanding. By 2014, there were 449 cancer registries nationwide, covering approximately 25% of the country’s population. The implementation of the Measures for the Administration of Cancer Registration in 2015 has improved the cancer registration statistical system (14, 54). These factors may lead to increased incidence.
The incidence of lymphoma in China, different genders, and different regions showed an increasing trend. The reasons for this may be the aging of the population, environmental factors, and increased social support (e.g., increased prevalence of early diagnosis and treatment programs for cancer), which further increase the detection rate of cancer and raise the incidence rate of the cancer. For example, with the aging trend of the global population intensifying, the incidence of lymphoma is relatively high in the elderly population. By 2035, the elderly population is projected to increase, which could lead to an increase in the incidence of lymphoma. By 2035, environmental pollution is likely to increase due to continued industrialization and urbanization, including air, water, and soil pollution, which may increase the risk of lymphoma.
In this study, the BAPC method was used for prediction because of its wide acceptance in public health research and its utility for analyzing long-term trends and making future projections. The BAPC model uses INLA, and its main advantage is that it directly approximates the posterior marginal distributions without the need for convergence diagnostics. The parameter estimation is performed using the BAPC package, which not only eliminates the need for complicated coding processes and convergence checking, but also provides the flexibility to choose the parameter of standardized incidence or standardized mortality, and the a priori probability distribution as needed (55, 56). Studies have shown that the BAPC model has a higher accuracy in predicting cancer burden than other models and is able to obtain more reasonable and robust results, especially in short- and medium-term prediction years. Therefore, the BAPC model was selected for predictive analysis in this study (57, 58).
There are some limitations to this study. The lymphoma data were all from the 2008–2020 “Chinese Cancer Registry Annual Report”. The original data came from the National Cancer Registry instead of random sampling, so the representativeness and extrapolation results of the whole population are lacking. This study also has limitations in terms of timeliness. The latest cancer registration data are generally delayed by 3 years. Subtypes of lymphoma were not examined in this study due to insufficient available information. Without a breakdown to specific subtypes, the analysis could not reveal epidemiological details of specific subtypes of lymphoma, such as trends and differences in incidence rates for specific subtypes. However, this study provided a macroscopic view of the overall incidence and mortality of lymphomas, which helps to understand the epidemiological characteristics of lymphomas as an overall category in a specific region or population. Such macro-analysis may still be of great value for public health planning and resource allocation. The BAPC model, although widely used in predicting disease burden, has limitations, mainly including linear assumptions about age, period, and cohort effects, and failure to directly incorporate changes in risk factors and covariates. For example, the BAPC model is unable to take into account the effects of population aging, policies, genetics, and the environment, and therefore has a negative impact on the accuracy and reliability of quantitative forecasts. We are currently collecting and organizing relevant spatial data, and future studies may further explore these factors with a view to improving the accuracy of the predictions.
In summary, this study conducted trend analysis, age–period–cohort analysis, and prediction based on lymphoma data and found that the incidence of lymphoma increased from 2005 to 2017, and the risk was related to the region, gender, and age, and the incidence of lymphoma was predicted to decline slowly by 2035. The annual incidence of lymphoma showed a slow downward trend. This reminds us that we still need to pay attention to the prevention and treatment of lymphoma. The results of this study provide information on the disease burden of lymphoma, which will help formulate policies for lymphoma prevention, control, and management strategies, and have important reference significance for lymphoma prevention and treatment in China.
Data availability statement
The original contributions presented in the study are publicly available. This data can be found here: Chinese Cancer Registry Annual Report, 2008-2020.
Author contributions
KL: Conceptualization, Formal analysis, Methodology, Software, Writing – original draft, Writing – review & editing. JS: Conceptualization, Formal analysis, Methodology, Software, Writing – original draft, Writing – review & editing. YC: Conceptualization, Formal analysis, Methodology, Software, Writing – original draft, Writing – review & editing. LL: Formal analysis, Methodology, Software, Writing – review & editing. PL: Formal analysis, Methodology, Software, Writing – review & editing. XC: Formal analysis, Methodology, Software, Writing – review & editing. MT: Formal analysis, Methodology, Software, Writing – review & editing. YL: Formal analysis, Methodology, Software, Writing – review & editing. YY: Conceptualization, Formal analysis, Funding acquisition, Methodology, Project administration, Software, Supervision, Writing – original draft, Writing – review & editing. LZ: Conceptualization, Formal analysis, Funding acquisition, Methodology, Project administration, Resources, Software, Supervision, Writing – original draft, Writing – review & editing. XP: Conceptualization, Formal analysis, Funding acquisition, Methodology, Project administration, Resources, Software, Supervision, Writing – original draft, Writing – review & editing. WN: Project administration, Resources, Software, Supervision, Writing – original draft, Writing – review & editing, Conceptualization, Formal analysis, Funding acquisition, Methodology.
Funding
The author(s) declare financial support was received for the research, authorship, and/or publication of this article. This work was supported by the National Hematology Clinical Research Center Xinjiang Production and Construction Corps Branch Center (2021CA002), the National Hematology Clinical Research Center Xinjiang Production and Construction Corps Branch Center (S2022EB517), and the Correlation between CD5 expression and tumor-associated macrophage immunosuppression and disease prognosis in diffuse large B-cell lymphoma (2022ZD087).
Acknowledgments
The authors would like to thank all participants who participated in the study.
Conflict of interest
The authors declare that the research was conducted in the absence of any commercial or financial relationships that could be construed as a potential conflict of interest.
Publisher’s note
All claims expressed in this article are solely those of the authors and do not necessarily represent those of their affiliated organizations, or those of the publisher, the editors and the reviewers. Any product that may be evaluated in this article, or claim that may be made by its manufacturer, is not guaranteed or endorsed by the publisher.
References
1. World Health Organization. Noncommunicable diseases (2022). Available online at: https://www.who.int/news-room/fact-sheets/detail/noncommunicable-diseases (Accessed August 6, 2023).
2. Sung H, Ferlay J, Siegel RL, Laversanne M, Soerjomataram I, Jemal A, et al. Global cancer statistics 2020: globocan estimates of incidence and mortality worldwide for 36 cancers in 185 countries. CA Cancer J Clin. (2021) 71:209–49. doi: 10.3322/caac.21660
3. Yantao T, Wenzhe K. New progress in research on global cancer incidence. China Med. (2021) 16:1446–7.
4. World Health Organization. Global health estimates: leading causes of death(2020). Available online at: https://www.who.int/data/gho/data/themes/mortality-and-global-health-estimates/ghe-leading-causes-of-death (Accessed 2023/3/10).
5. Parkin DM. Global cancer statistics in the year 2000. Lancet Oncol. (2001) 2:533–43. doi: 10.1016/S1470–2045(01)00486–7
6. Zongchao L, Zhexuan L, Yang Z, Tong Z, Jingying Z, Weicheng Y, et al. Interpretation on the report of global cancer statistics 2020. J Multidiscip Cancer Manage (Electronic Version). (2021) 7:1–14. doi: 10.12151/JMCM.2021.02-01
7. National Bureau Of Statistics China. Bulletin of key data of the fifth national population census, 2000(2001). Available online at: https://www.gov.cn/gongbao/content/2001/ content_60740.htm (Accessed 2023/8/7).
8. Jie H, Wenqiang W. Chinese cancer registry annual report 2020. People's Medical Publishing House, Beijing (2021) p. 184–237.
9. Jie H, Wenqiang W. Chinese cancer registry annual report 2019. People's Medical Publishing House, Beijing (2020) p. 184–237.
10. Jie H. Chinese cancer registry annual report 2018. People's Medical Publishing House, Beijing (2019) p. 184–237.
11. Jie H, Wanqing C. Chinese cancer registry annual report 2017. People's Medical Publishing House, Beijing (2018) p. 184–237.
12. Jie H, Wanqing C. Chinese cancer registry annual report 2016. Tsinghua University Press, Beijing (2017) p. 184–237.
13. Jie H, Wanqing C. Chinese cancer registry annual report 2015. Tsinghua University Press, Beijing (2016) p. 184–237.
14. Jie H, Wanqing C. Chinese cancer registry annual report 2014. Tsinghua University Press, Beijing (2015) p. 184–237.
15. Jie H, Wanqing C. Chinese cancer registry annual report 2013. Tsinghua University Press, Beijing (2014) p. 184–237.
16. Jie H, Wanqing C. Chinese cancer registry annual report 2012. Tsinghua University Press, Beijing (2013) p. 184–237.
17. Jie H, Ping Z, Wanqing C. Chinese cancer registry annual report 2011. Military Medical Science Press (2012) p. 184–237.
18. Zhao P, Wanqing C. Chinese cancer registry annual report 2010. Military Medical Science Press (2011) p. 184–237.
19. Zhao P, Wanqing C. Chinese cancer registry annual report 2009. Military Medical Science Press (2010) p. 184–237.
20. Zhao P, Wanqing C. Chinese cancer registry annual report 2008. Military Medical Science Press (2009) p. 184–237.
21. Outland B, Newman MM, William MJ. Health policy basics: implementation of the international classification of disease, 10th revision. Ann Intern Med. (2015) 163:554–6. doi: 10.7326/M15–1933
22. Wanqing C, Zhiheng L, Huishan C, Minrong W. Current status and development of tumor registry in China. Chin J Front Med Sci (Electronic Version). (2016) 8:1–06.
23. Lin K, Jia H, Cao M, Xu T, Chen Z, Song X, et al. Epidemiological characteristics of leukemia in China, 2005–2017: a log-linear regression and age-period-cohort analysis. BMC Public Health. (2023) 23:1647. doi: 10.1186/s12889–023-16226–1
24. Xu QQ, Yan YF, Chen H, Dong WL, Han LY, Liu S. Predictions of achievement of sustainable development goal to reduce age-standardized mortality rate of four major non-communicable diseases by 2030 in China. Zhonghua Liu Xing Bing Xue Za Zhi. (2022) 43:878–84. doi: 10.3760/cma.j.cn112338–20211028–00830
25. Rongshou Z, Wanqing C. An introduction to age-period-cohort prediction models based on bayesian methods. Chin J Prev Med. (2012) 46:648–50.
26. Martins TG, Simpson D, et al. Bayesian computing with inla: New features. Comput Stat Data an. (2013) 67:68–83. doi: 10.1016/j.csda.2013.04.014
27. UN. World Population Prospects - Population Division - United Nations. World Population Prospects - Population Division - United Nations (2022).
28. Jiang. h-J. Research on adaptive portfolio prediction based on model selection rules. (2014) Donghua University, Shanghai. p. 135.
29. Cao. B. Study on trend analysis and prediction of Malignant tumor disease burden in Wuwei. Lanzhou University, Lanzhou (2018). p. 60.
30. Rosenberg PS, Check DP, Anderson WF. A web tool for age-period-cohort analysis of cancer incidence and mortality rates. Cancer Epidemiol Biomarkers Prev. (2014). 23:2296–302. doi: 10.1158/1055-9965.EPI-14-0300
31. Seifert M, Scholtysik R, Kuppers R. Origin and pathogenesis of b cell lymphomas. Methods Mol Biol. (2013) 971:1–25. doi: 10.1007/978–1-62703–269-8_1
32. Kuppers R. Mechanisms of b-cell lymphoma pathogenesis. Nat Rev Cancer. (2005) 5:251–62. doi: 10.1038/nrc1589
33. Carbone A, Cesarman E, Spina M, Gloghini A, Schulz TF. Hiv-associated lymphomas and gamma-herpesviruses. Blood. (2009) 113:1213–24. doi: 10.1182/blood-2008–09-180315
34. De Martel C, Ferlay J, Franceschi S, Vignat J, Bray F, Forman D, et al. Global burden of cancers attributable to infections in 2008: a review and synthetic analysis. Lancet Oncol. (2012) 13:607–15. doi: 10.1016/S1470–2045(12)70137–7
35. Guidoboni M, Ferreri AJ, Ponzoni M, Doglioni C, Dolcetti R. Infectious agents in mucosa-associated lymphoid tissue-type lymphomas: pathogenic role and therapeutic perspectives. Clin Lymphoma Myeloma. (2006) 6:289–300. doi: 10.3816/CLM.2006.n.003
36. Zhang N, Wu J, Wang Q, Liang Y, Li X, Chen G, et al. Global burden of hematologic Malignancies and evolution patterns over the past 30 years. Blood Cancer J. (2023) 13:82. doi: 10.1038/s41408–023-00853–3
37. Swerdlow SH, Campo E, Harris NL, Jaffe ES, Pileri SA, Stein HJT. Who classification of tumors of haematopoietic and lymphoid tissue. 4th ed. Lyon: IARC Press (2008).
38. Swerdlow SH, Campo E, Pileri SA, Harris NL, Stein H, Siebert R, et al. The 2016 revision of the world health organization classification of lymphoid neoplasms. Blood. (2016) 127:2375–90. doi: 10.1182/blood-2016–01-643569
39. Ying H, Yuankai S. A ten-year review of lymphoma diagnosis and treatment. J Pract Oncol. (2017) 32:483–93.
40. National Bureau Of Statistics China. Seventh national census bulletin(2021). Available online at: https://www.gov.cn/guoqing/2021–05/13/content_5606149.htm (Accessed 2023/8/ 1).
41. Zhang N, Wu J, Wang Q, Liang Y, Li X, Chen G, et al. Global burden of hematologic Malignancies and evolution patterns over the past 30 years. Blood Cancer J. (2023) 13:82. doi: 10.1038/s41408–023-00853–3
42. Teras LR, Desantis CE, Cerhan JR, Morton LM, Jemal A, Flowers CR. 2016 us lymphoid Malignancy statistics by world health organization subtypes. CA Cancer J Clin. (2016) 66:443–59. doi: 10.3322/caac.21357
43. Liu W, Liu J, Song Y, Wang X, Zhou M, Wang L, et al. Mortality of lymphoma and myeloma in China, 2004–2017: an observational study. J Hematol Oncol. (2019) 12:22. doi: 10.1186/s13045–019-0706–9
44. Karalexi MA, Dessypris N, Ma X, Spector LG, Marcotte E, Clavel J, et al. Age-, sex- and disease subtype-related foetal growth differentials in childhood acute myeloid leukaemia risk: a childhood leukemia international consortium analysis. Eur J Cancer. (2020) 130:1–11. doi: 10.1016/j.ejca.2020.01.018
45. Wang JB, Jiang Y, Liang H, Wei WQ, Qiao YL, Boffetta P, et al. Attributable causes of cancer in China. Ann Oncol. (2012) 23:2983–9. doi: 10.1093/annonc/mds139
46. National Health Commission of China. China smoking hazard health report 2020(2021). Available online at: https://www.gov.cn/xinwen/2021–05/30/content_5613994.htm (Accessed 2023/8/25).
47. Zhang H, Xin H, Li X, Li H, Li M, Lu W, et al. A dose-response relationship of smoking with tuberculosis infection: a cross-sectional study among 21008 rural residents in China. PloS One. (2017) 12:e175183. doi: 10.1371/journal.pone.0175183
48. Levy D, Rodriguez-Buno RL, Hu TW, Moran AE. The potential effects of tobacco control in China: projections from the China simsmoke simulation model. BMJ. (2014) 348:g1134. doi: 10.1136/bmj.g1134
49. World Health Organization. Tobacco(2023). Available online at: https://www.who.int/news-room/ fact-sheets/detail/tobacco (Accessed 2023/6/25).
50. Qingqing X, Yongfu Y, Shihwei L. The gap between mpower measures and the implementation of tobacco control interventions in China from 2010 to 2022: a delphi study. Chin J Prev Med. (2023) 24:168–73.
51. Liu W, Liu J, Song Y, Wang X, Mi L, Cai C, et al. Burden of lymphoma in China, 1990–2019: an analysis of the global burden of diseases, injuries, and risk factors study 2019. Aging (Albany NY). (2022) 14:3175–90. doi: 10.18632/aging.204006
52. Yip W, Fu H, Chen AT, Zhai T, Jian W, Xu R, et al. 10 years of health-care reform in China: progress and gaps in universal health coverage. (2019). doi: 10.1016/S0140-6736(19)32136-1
53. Song S, Yuan B, Zhang L, Cheng G, Zhu W, Hou Z, et al. Increased inequalities in health resource and access to health care in rural China. Int J Environ Res Public Health. (2018) 16. doi: 10.3390/ijerph16010049
54. Bureau of Disease Control and Prevention. Interpretation of the tumour registry regulations(2015). Available online at: http://www.nhc.gov.cn/jkj/s5879/201 502/ f5d9e7669b784324bae73af7a6cb2209.shtml (Accessed 2023/8/7).
55. BRAY I. Application of Markov chain Monte Carlo methods to projecting cancer incidence and mortality. J R Stat Soc Ser C: Appl Statistics. (2002) 51:151–64. doi: 10.1111/1467–9876.00260
56. Kupper LL, Janis JM, Salama IA, Yoshizawa CN, Greenberg BG, Winsborough HH. Age-period-cohort analysis: an illustration of the problems in assessing interaction in one observation per cell data. Commun Stat Theory Methods. (1983) 12:201–17. doi: 10.1080/03610928308828640
57. Du Z, Chen W, Xia Q, Shi O, Chen Q. Trends and projections of kidney cancer incidence at the global and national levels, 1990–2030: a Bayesian age-period-cohort modeling study. biomark Res. (2020) 8:16. doi: 10.1186/s40364-020-00195-3
Keywords: lymphoma, incidence, joinpoint regression model, age-period-cohort model, Bayesian age-period-cohort model
Citation: Lin K, Shao J, Cao Y, Lu L, Lei P, Chen X, Tong M, Lu Y, Yan Y, Zhang L, Pan X and Nong W (2024) The trend of lymphoma incidence in China from 2005 to 2017 and lymphoma incidence trend prediction from 2018 to 2035: a log-linear regression and Bayesian age-period-cohort analysis. Front. Oncol. 14:1297405. doi: 10.3389/fonc.2024.1297405
Received: 20 September 2023; Accepted: 29 April 2024;
Published: 29 May 2024.
Edited by:
Jennie L. Williams, Stony Brook University, United StatesReviewed by:
Peng Yin, Chinese Center for Disease Control and Prevention, ChinaPhilip Rosenberg, National Cancer Institute (NIH), United States
Subhas Das, Oklahoma State University, United States
Copyright © 2024 Lin, Shao, Cao, Lu, Lei, Chen, Tong, Lu, Yan, Zhang, Pan and Nong. This is an open-access article distributed under the terms of the Creative Commons Attribution License (CC BY). The use, distribution or reproduction in other forums is permitted, provided the original author(s) and the copyright owner(s) are credited and that the original publication in this journal is cited, in accordance with accepted academic practice. No use, distribution or reproduction is permitted which does not comply with these terms.
*Correspondence: Yizhong Yan, erniu19880215@sina.com; Lei Zhang, 2446514472@qq.com; Xin Pan, 646194390@qq.com; Weixia Nong, nwx_good@126.com
†These authors have contributed equally to this work