 Mariam Ali Alnuaimi
 Mamoun Awad
- Department of Computer Science and Software Engineering, United Arab Emirates University, Al-Ain, United Arab Emirates
Introduction: Virtual reality (VR) offers an immersive learning environment with the potential to revolutionize how students engage with complex topics and interact during classes. Great care must be taken when designing and developing VR applications. In this paper, we present a usability study of our proposed educational VR application designed for the digital design and computer organization lab. The VR-lab is meant to support the traditional lab that is taught in college first year.
Methods: To assess the VR application, we conducted a usability study with a wide range of students from different colleges, evaluating their performance on tasks within the VR environment and collecting their feedback on the application’s design, functionality, and ease of usage. By analyzing quantitative data (task completion rates and time spent) and qualitative feedback (surveys and observations), in this study, we identified potential usability issues and recommended improvements to enhance the learning experience within the VR application.
Result: The usability study showed that the majority of students found that the VR application immersive, engaging, and viewed their experience as helpful to better understand complex concepts. With confidence level of 95%, the VR application had significant improvement on students’ learnability, memorability, and the average task completion time.
Discussion: Additionally, in the study, we found that careful design and technology must be used selectively due to population variation in terms of technology knowledge level, health factor, and readiness.
1 Introduction
The fields of engineering and computer science education are constantly seeking innovative methods to engage students and deepen their understanding of complex concepts. Traditional laboratory environments, although valuable, can sometimes lack the ability to fully immerse students in the subject matter. In many cases, engineering and computer science students spend between 50 and 100 h a week on their course work, including lectures, labs, assignment, and projects. Typically, most of the physical time is spent in the lab room because projects and assignments are conducted there. Studies showed that students suffer from frustration, fatigue, and tiredness due to hardware failure and/or advanced concept confusion (Gawron, 2014). Virtual reality (VR) can provide an immersive, competitive, and fun experience during lab classes, which can be considered an effective solution to lab limitations. In addition, the use of VR in engineering pedagogy has been adopted widely (Oje et al., 2023), and it has been shown that VR-based laboratories are very supportive and effective in engineering; however, it cannot replace the traditional in-person laboratory experience (Kollöffel and De Jong, 2013). This is due to the nature of the labs in engineering, which requires dealing with wires, connections, leaderboard, etc. Furthermore, VR provides effective accessibility to lab virtual resources because in many cases, small glitches and hardware failure might delay the student and cause frustration waiting for lab assistant help. VR can overcome such limitations because VR application will be available all the time with supportive and relevant virtual resources. Moreover, there is an additional cost for VR sensory equipment; however, prices are getting affordable for both students and institutions.
On the one hand, VR in education has several advantages that include inclusiveness, visual quality, interactivity, cost-effectiveness, and safety. On the other hand, VR users can suffer from psychic risk and cyber-sickness. In addition, VR technology is complex and has a high cost (Al-Ansi et al., 2023; Kurbatova et al., 2022). Moreover, VR applications require thorough usability testing to guarantee the best user experience and satisfaction (Dias et al., 2007; Huang and Lee, 2022). Therefore, VR applications must be designed and developed with great care, and it must be thoroughly validated and tested. Usability testing can detect any usability issues in the early stages; evaluate immersion and presence; identify interaction issues such as voice commands, gaze, and gestures; and reduce motion sickness and discomfort.
Unfortunately, the teaching methods in engineering and computer science are still traditional, and little attempts have been proposed seriously on using VR environments on a large scale. In addition, many VR applications that were developed for research studies are simple, limited, and lacking usability testing. We believe that there remains a dearth of research developing complex VR applications that comprise different educational features, as well as integrating usability studies in those applications. In this paper, we attempt to transform a digital design lab into VR environment to explore the usability, suitability, and learning experience of students. Specifically, we investigate the usability of a VR application specially designed for a digital design and computer organization lab. By creating an interactive and immersive learning environment, VR applications can revolutionize how students engage with lab topics. To assess this potential, we developed a VR application to educate students on digital design and computer architecture circuits. We conducted a usability study with student volunteers. The study evaluated user performance on assigned tasks within the VR environment and gathered their feedback on the application’s design, functionality, and overall ease of usage.
Using standard evaluation metrics and through a comprehensive analysis of both quantitative data and qualitative feedback and observations, in this study, we aim to achieve two key objectives. First, we aim to identify any usability issues that may hinder student learning within the VR application. Second, through these findings, we will recommend specific design changes and improvements, ultimately enhancing the educational value and user experience of the digital design and computer organization virtual lab application. The main contributions of this work are summarized as follows.
1. We developed a VR application to support student experience in the digital design and computer organization course.
2. We conducted surveys and a usability study to compare between a learner’s task performance and perceptions with a VR environment vs. traditional learning environment.
3. We investigated and analyzed the usability study results and suggested solutions for the issues found while using the VR application.
4. We augmented and measured the use of gamification aspects to the VR application to test the effect of gamification on students’ engagement.
The remainder of this paper is organized as follows: Section 2 summarizes related and relevant research work. Section 3 presents the research methodology, including the research questions, VR prototype, and usability metrics used in this paper. Section 4 elaborates on the usability study experiments and data analysis. In Section 5, we discuss our usability study findings. Section 6 and 7 highlight the limitations for this study and the ethical considerations. Finally, in Section 8, we draw our conclusions and discuss future work.
2 Literature review
VR is a powerful tool that is widely used in games, simulation, and most importantly in training and education. The literature is very rich in research on different dimensions in VR learning. In this section, we present a broad comprehensive review on VR learning. First, we present various research work/reviews in VR in education; second, we elaborate on the core effective factors that govern VR learning and assessment; and finally, we highlight relevant VR research work on usability studies.
2.1 VR in education
The use and integration of VR in education has several benefits and has proven to be very effective in enhancing collaborative learning (Jochecová et al., 2022; Alnagrat et al., 2022) and improving students’ comprehension (Akcayir and Akcayir, 2017; Wee et al., 2022). In addition, VR provides excellent immersive and engaging learning experience (Marougkas et al., 2023). Furthermore, in high-risk environments with complex machinery or hazardous materials, VR creates a secure and regulated learning environment for students (Al Awadhi et al., 2018). For example, in medical training (Li et al., 2025; Birrenbach et al., 2024), disaster preparedness (Jung, 2022), and safety and cost-effective training (Scorgie et al., 2024), trainees can repeatedly practice hazardous experiments or emergency procedures without real-world risks. Moreover, VR can drive cost down (Tarng et al., 2019) because we substitute hardware with a virtual environment that can be accessed by many students simultaneously and allows for repeated sessions (Farra et al., 2019; Veras et al., 2020). In addition, VR has been proven to enrich students’ comprehension of different engineering subjects due to its ability to connect theoretical complicated concepts with practical visualized and animated applications (Freina and Ott, 2015). As such, students acquire potent technical skills and gain soft skills and confidence while facing future challenges after graduation. In addition, VR features accessibility and inclusivity in which remote students or students with disabilities can enjoy access to the lab environment or field experiences (Deriba et al., 2024; Norwine et al., 2025; Hernández-de-Menéndez et al., 2019). Finally, learners can get real-time feedback and instant assessment and guidance (Eaves et al., 2011; Shi and Xu, 2024). Soliman et al. (2021) surveyed different research studies in engineering education and presented evidence that VR is an excellent tool to improve students’ performance and experience. Similarly, di Lanzo et al. (2020), Huang and Roscoe (2021), and Feisel and Rosa (2005) reaffirmed the increasing popularity and impact of VR in education. However, they found that more extensive exploration in engineering education needs to be conducted with clear evaluation metrics in realistic VR scenarios. (Kollöffel and De Jong, 2013) found that VR-based laboratories can provide alternative laboratory experiences in engineering without automatically replacing the traditional in-person laboratory experience. One clear support of VR platforms in education is that hands-on activities and the acquisition of procedural skills can be rendered and repeated in VR Learning Environment based training systems (Marougkas et al., 2023).
On the other hand, VR technology has the risk of causing health issues. For example, goggles, headset, and tracking sensors have been shown to cause users to suffer from psychic risk, eye strain, cyber-sickness, or disorientation (Chandra et al., 2019; Lynch et al., 2017). Additionally, VR might have a high initial cost and requires expensive software and hardware maintenance (Farra et al., 2019; Veras et al., 2020). Moreover, VR can pose technical barriers for some users due to usability challenges. For example, users might face Internet accessibility problems such as network latency issues, bandwidth limitation, and connectivity disruptions (Deriba et al., 2024). Furthermore, the development of VR applications requires substantial resources and real-life sensory experience, which dictates thorough usability testing to guarantee the best user experience and satisfaction (Dias et al., 2007; Huang and Lee, 2022; Marougkas et al., 2023). Finally, it has been shown that VR can negatively affect learners’ isolation, communication skills, and social interaction (Ironsi, 2023). Nonetheless, with the rapid advancement of VR technology, the integration of VR in the academic education system becomes just a matter of time (Freina and Ott, 2015).
2.2 The effective factors in VR learning
The use of VR in learning is governed and assessed using different factors that include realism, contextual relevance, context, coherence, immersion, and presence (Jung and Lindeman, 2021). In the following, we will explore the current research on the key factors of effective VR-based learning.
Many research workers consider VR as another kind of fiction and argue that it should be conceived of as an experience rather than a technique, and such an experience might gain more from increased emotional relevance than from higher realistic resolutions (Hoorn et al., 2003). As such, we should focus on human aspects, activities, and features in the VR system that transform user experience to reality. The transfer of the user experience from the design of VR interactive systems to the real world is a key success factor (Chisalita et al., 2003).
Realism is the degree to which the VR system can mimic the real world, and it is an important factor in VR learning. Newman et al. (2022) conducted two studies to examine how the realism of environmental presentations impact affective responses and participant perceptions. They found that the level of realism acquired with VR does impact affective responses and perceptions. In addition, most of the studies reported that higher realism has a positive impact on user experience (Gonçalves et al., 2022).
Presence and immersion are two core factors in VR learning. Presence refers to the qualia of existing in a real place. Immersion, according to Slater (Slater and Wilbur et al., 1997), refers to the technology giving an inclusive and extensive surrounding and vivid experience to users such that the user loses awareness of the fact that she is actually in an artificial world. Katernyak and Loboda (2016) studied the cognitive presence and the effect of immersion in a virtual learning environment. They considered each learning task as an event where participants might have enjoyed memorable experience. They conducted cognitive experiments to find the percentage of students who get immersed in a memorable experience when involved in different e-learning activities. In their cognitive experiment, 328 students participated in an e-course on project management. The participants were challenged with a quiz on remembering and understanding, and a task on understanding and application in an interactive context. Results of the survey and interview uncovered that 41% of the e-course participants had the feeling of arousal and “drive” (awakening and excitement), whereas 23% of the participants felt freedom, joy, sense of satisfaction, and influx of new ideas. The authors concluded that the success of e-courses is defined by the following factors: objective of the e-course, monitoring the progress of the learning process, the social presence, and cognitive presence that encourages collaboration, creativity, and idea generation. Selzer et al. (2019) studied the relationship between virtual presence and the learning outcome arising from a VR educational experience. In their experiment, 42 participants were randomly assigned to one of three experimental groups: desktop computer, low-end VR configuration, and high-end VR configuration. In their results, they reported a lower learning outcome in the less immersive configuration (i.e., desktop) and a similar learning outcome in both low-end and high-end VR systems. They argued that even though low-end VR systems are less immersive and produce a lower level of virtual presence than high-end VR systems, the results support the use of low-end VR systems for educative applications.
The abovementioned core factors correlate in their effect on VR learning. In their review on the correlation among coherence, realism, illusion, and immersion in VR, Jung and Lindeman (2021) proposed two new models for representing the correlation among coherence, immersion, and illusion. The first model has three orthogonal axes representing coherence, immersion, and illusion. The axes describe the subjective feelings that arise when a user lives VR experiences. They found that each factor can be treated as independent dimension but that they might partially influence each other as they intersect. In order to measure lower-level components, they proposed the second model. They hypothesized that increased realism has positive impact on deep presence, including co-presence and social presence. The study did not include or conduct any experiment to validate their two models. Romli and Yaakob (2017) attempted to identify features and effective factors that may contribute to the learning environment in desktop VR design. The authors applied content analysis that integrates meta-analysis to achieve their goal. They proposed a framework that comprises instructional element, interaction, navigation, and fidelity. The authors claimed that their model can empower the cooperation and understanding in all areas of learning, including VR environment; however, no validation or testing was conducted on the framework.
VR environment and tools enhance students’ engagement and interactivity in visualization learning. Lu et al. (2018) developed a 3D visualization tool for engineering students. They conducted a cognitive experiment on 20 undergraduate students. Their results showed that VR application is very effective on users’ exploratory and analytical activities. Their statistical analysis indicated a significant improvement in both the post-experiment test scores and the engagement level, which was measured via a user engagement questionnaire and participants’ comments. In another similar experimental study on interactivity levels in VR learning environments (Zhang et al., 2019), the authors found an insignificant difference in students’ learning using pre- and post-tests; however, the questionnaire and interview data suggested that interactivity in the experience significantly affects students’ engagement and focus in learning.
In this paper, we measure the engagement and interactivity of the students in a VR-lab on computer architecture for computer science and computer engineering students. We use survey and interviews to assess students’ experience and investigate the effect of usability study on VR development in education. In addition, we explore the effect of a VR-lab on engineering education and engagement to decide and recommend future decisions on the integration of a virtual lab in the curricula.
2.3 Usability testing in VR learning
Usability testing in VR applications plays a crucial role in gathering data needed to ensure the effectiveness of the application and identification of the application issues. Usability testing is used to measure the VR application’s learnability, efficiency, memorability, errors, and satisfaction, which allows the developer to get direct feedback from the user (Kamińska et al., 2022). There are two types of usability tests: formative and summative user testing. The formative test is used earlier in the testing process. It aims to identify interface design problems and provide solutions. Observation testing of the quality of the application is conducted during the formative test on a small group of users (Hartson et al., 2001). The summative test is used to evaluate the efficacy of the final application design. Typically, it is conducted after the launch of the application and on a larger group of users. The aim is to collect large amounts of data to measure the performance of the users in using the application (Kamińska et al., 2022).
With the rapid development and accessibility of VR applications in different areas, the need for objective data-driven usability testing is becoming an important venue of research that needs to be explored because traditional methods of testing are both time consuming and resource consuming, and in many cases, they induce highly subjective results. Kamińska et al. (2022) explored the venue of automation of usability testing of VR applications. They considered objective features such as HMD built-in head and hands tracking, EEG sensor, video recording, and other measurable parameters in addition to automated analysis of subjective data provided in questionnaires. They conducted experiments on 14 volunteers who tried a VR application with relatively easy tasks that did not generate stress for the users. In addition to recording the participants’ signals, the observer also recorded the participants’ behavior during the experiments and collected post-experiment feedback. The analysis of the results showed a promising conclusion that automated usability testing of VR applications is potentially achievable.
In a recent usability study on VR environment, Huang and Lee (2022) showed that there are three major usability factors in 3D modeling learning in VR work: interactive quality, dynamic compatibility, and flow effects. Zilles Borba et al. (2020) demonstrated in a control experiment study that the application of systematic usability methods during cyber system interactions is very effective. Their results showed how the usability standard of ISO 9241-11 can be used for a set of efficiency, efficacy, and satisfaction measures. They also analyzed the level of presence in the immersive virtual environment and issues related to cyber-sickness.
Chandra et al. (2019) showed that in a VR environment, immersion must be considered in usability testing rather than traditional human–computer interaction (HCI) methods which are not entirely applicable. There are three types of immersion: full immersion, semi-immersion, and no immersion. VR systems that are fully immersive use head-mounted displays (VR headsets) such as Oculus Quest or HTC VIVE combined with haptic devices. A semi-immersive VR environment consists of large displays in which the content of the VR application is projected for the user to look at. This could limit the interactions between the user and the environment. A non-immersive VR system is when the VR environment is displayed on a computer monitor (Chandra et al., 2019). Additionally, the authors found that when conducting usability testing on the VR environment, we should also consider other issues such as health and safety. For example, immersive VR requires the user to be fully involved, and when the VR equipment is not used correctly by the users, it may lead to discomfort and damage. Some of the health and safety considerations include eye strain because of the HMD displays, claustrophobia, injury or trauma due to unprepared testing environments or sudden movement, and cyber-sickness, which is the equivalent of motion sickness. The user must be warned about health concerns before starting the test. Brade et al. (2017) compared between the virtual field environment and the real field environment in terms of presence and usability. Specifically, they compared mobile navigation task of users in a virtual and real-world field environment. The test included approximately 60 participants. Through this test, the study found that the usability and the user experience ratings are correlated with presence in VR. This suggests that well-designed virtual environments can potentially replace real environments for user experience studies when a high presence is achieved. Lucas (2018) developed a VR environment to investigate the potential of VR to improve a student’s understanding of construction assemblies. The study uses a head-mounted display and an X-box controller for the student to experience this VR environment. To test the simulation, the study used pre- and post-survey techniques in which the test sample was divided into two groups: (a) prior video game use, in which the students are given images and traditional lecture material to study the course material, and then they take the survey, and (b) prior HMD-VR use, in which the students were given a pre-survey on the same lecture material, and then they were given the chance to use the VR environment. After the VR experience, users were given a post-survey and asked about usability and comfort. The study concluded that the students who used VR had a slight increase in understanding the materials. According to Wolfartsberger (2019), a VR environment allows users to feel like they are inside the design, potentially leading to a more comprehensive understanding of its form and function. Additionally, VR could facilitate easier interaction with the model, allowing the users to manipulate it and identify potential problems more effectively. Moreover, the study suggests that VR design reviews might lead to fewer missed design flaws than traditional methods. The immersive environment could foster better communication and collaboration among reviewers due to a shared understanding of the design in a 3D space.
de França et al. (2018) argued that the design and development of VR applications that suit all kind of users pose a serious challenge. Therefore, it is necessary to investigate the usability of these technologies as well as the ergonomic constraints and risks inherent in both the physical devices and the characteristics of the virtual environment adopted by the user. The authors proposed to observe both verbal and nonverbal behaviors. As such, the ergonomist might need to provide specialized equipment for the recording/monitoring of such behaviors. Ultimately, the results will provide support for any ergonomic improvement including system redesign. Chen et al. (2013) proposed a modified group usability testing to minimize data loss and to collect more significant critical data with lesser time, cost, and effort. They developed a non-immersive VR environment and conducted an experiment on a sample of 36 participants to compare the group usability testing vs. the modified one. Typically, group usability testing involves many-to-many participants executing tasks simultaneously, with one-to-many observers interacting with the participants to generate abundant useful data in a short period of time (Downey, 2007). In the proposed modified approach, observers record their observations and participants briefly note down any usability issues encountered during the testing session. In addition, the observers request the participants to actively verbalize the noted usability issues or problems. In their experiments, tasks in four levels and different comparison criteria were measured. The results indicate that the modified group usability testing is more effective and efficient than the original approach as it can collect more critical and significant data with lesser time, cost, and effort consumption.
The work presented in this paper is similar to the work proposed by Chandra et al. (2019), Brade et al. (2017), and Lucas (2018) as they discuss the importance of usability testing and promote VR integration in different environments. However, our work focuses on the use of VR in the context of education and how it can improve students’ understanding in a scientific topic. In addition, we accentuate the use of gamification and immersion in VR. We argue that adding gamification aspects such as levels, hints, score, lives, and leaderboard can improve engagement and user experience.
3 Research methodology
The research methodology in this study employs the mixed-methods approach, combining quantitative and qualitative data collection techniques to gain a comprehensive understanding of usability attributes and user experience within the digital design and computer organization lab VR application. Additionally, we use surveys to gather user feedback, comments, preferences, and experiences.
Figure 1 presents our research methodology, which includes defining research questions and goals, developing and implementing VR prototype, designing usability quantitative metrics, developing surveys, and finally collecting data and analyzing the usability of the VR system. The following sections present each step and provide elaborate explanations.
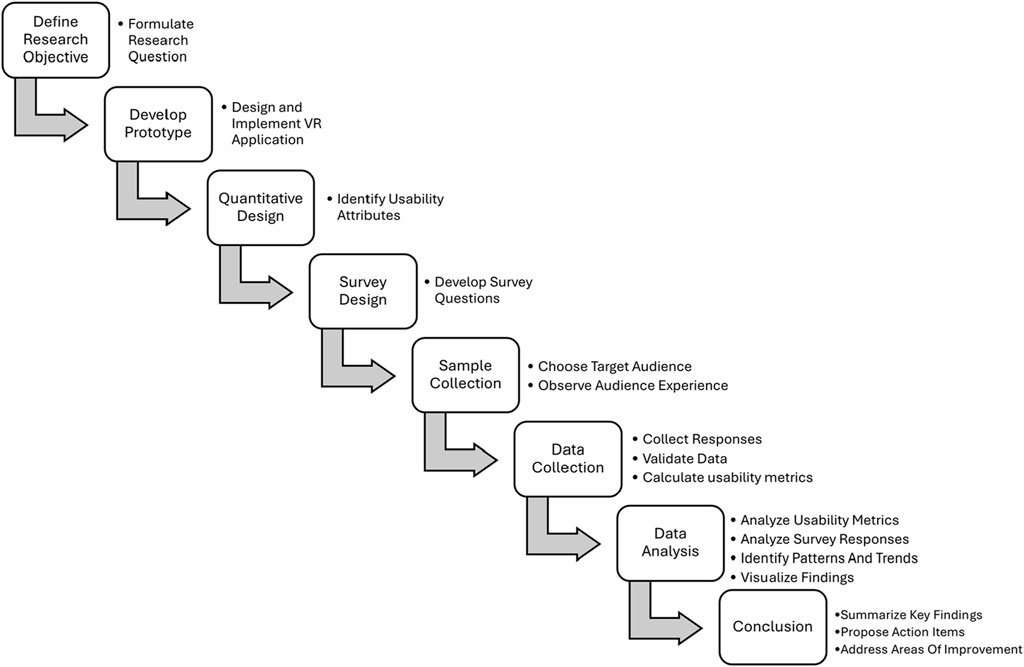
Figure 1. Research methodology steps.
3.1 Research questions
In this study, we aim to identify the extent to which our VR application of digital design and computer organization lab can be used effectively and efficiently by a specified audience and achieve the goal of replacing the physical environment, which is composed of a breadboard, wires, and circuits. We also aim to identify any design issues in the VR application and find solutions to these issues. Based on that, we define our research questions as follows.
• Which tasks do the users struggle with and take longer time than others?
• How long does it take users, on average, to complete different tasks within the VR environment?
• What types of errors do users encounter while performing tasks in the VR environment (e.g., navigation errors and data entry errors)?
• How satisfied are the users with the overall usability and functionality of the VR application?
• Do users find the VR gamified environment engaging and helpful for learning the presented concepts?
3.2 Prototype development
Digital design and computer organization (CENG205) is a core undergraduate course in the College of IT at the UAE (United Arab Emirates) University. The course introduces students to the basic concepts of digital systems, digital logic gates, truth tables, and combinational and sequential logic circuits. The course is equipped with hands-on labs that bridge the gap between theory and practice. In this section, we present the specifications of the VR application of digital design and computer organization lab. The VR application simulates the physical lab of CENG205 and includes hands-on activities of the five essential logic gates, namely, AND, OR, NOT, NAND, and XOR. Additionally, it includes two complicated level gates: 1-bit comparator and half adder. This VR environment will enable us to observe students’ progress in learning logic gates. Moreover, the VR application supports gamification techniques to enhance students’ engagement. The main purpose of the prototype is to allow students to learn and conduct the experiments independently.
Figure 2 presents the use-case diagram of our VR application. The use case diagram is a UML standard to model functional requirements. The VR prototype provides different functions to the actors/users, such as login/register, viewing lab materials, conducting lab experiments in different levels, showing scores, and redoing lab experiments.
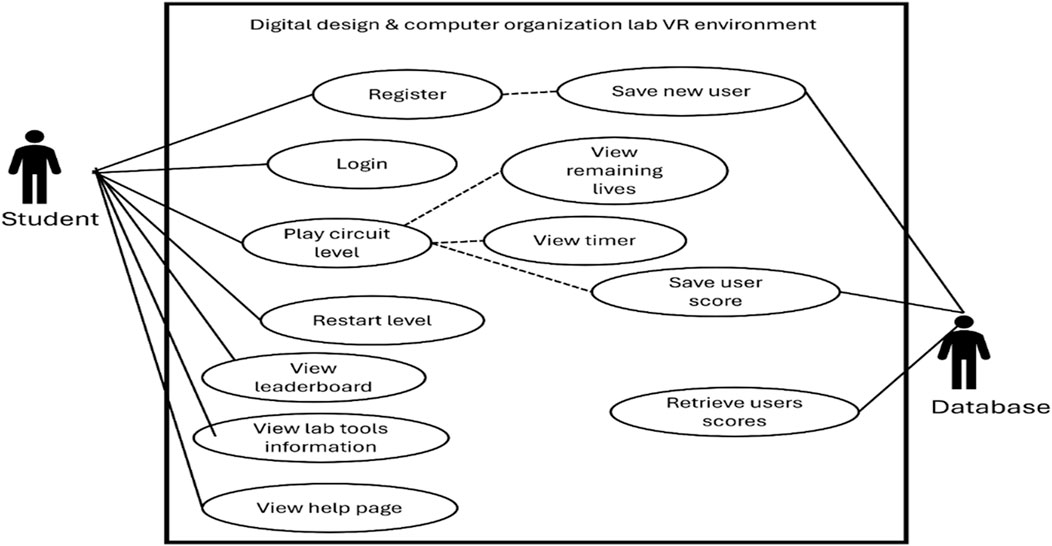
Figure 2. Use-case diagram of the VR application.
Figure 3 summarizes the task workflow of different features and screens that the student encounters while navigating in the application. The application is designed to help the student easily navigate and conduct labs to gain knowledge. It is equipped with the ROBO gadget that provides written and audio assistance to students to guarantee full-scale benefits.
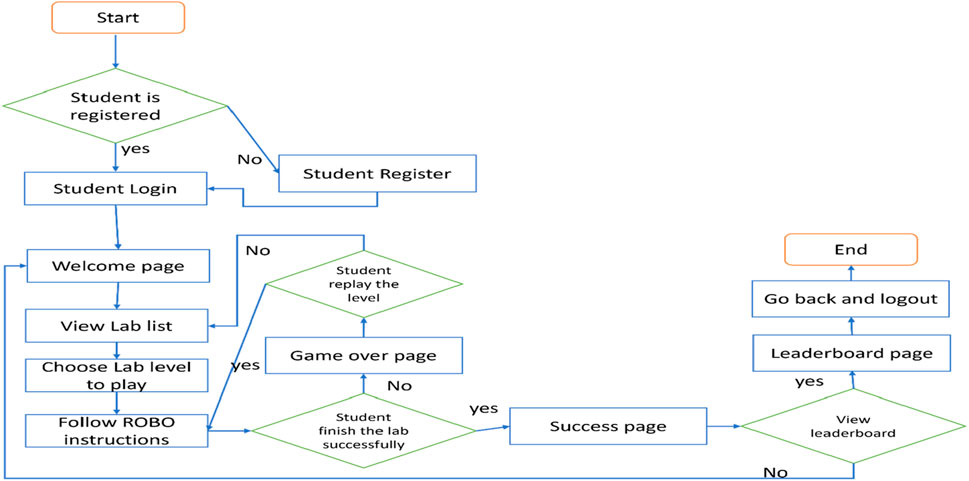
Figure 3. VR application task workflow.
In the following, we briefly present the main functions and screens of our gamified VR educational application. More details on software requirement specifications (SRS), use-case specifications, and UI can be found on GitHub (GitHub, 2024).
Figure 4 presents the physical lab environment. Typically, the lab has chairs and desks (A) and physical leaderboards and wires/gates (B). The lab instructor distributes the lab exercise to the students with a preset goal, steps, drawing, and hints (see Figure 5). The students spend 1 h per lab to wire the gates on the breadboard. The lab instructor provides help, hints, and troubleshooting. As we can see, the time, space, and resources are limited/restricted in the lab, which might result in frustration and lack of understanding.
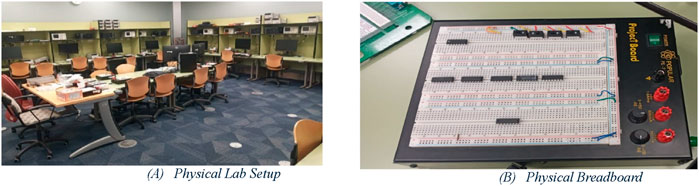
Figure 4. Physical lab setup and environment: (A) physical lab setup and (B) physical breadboard.
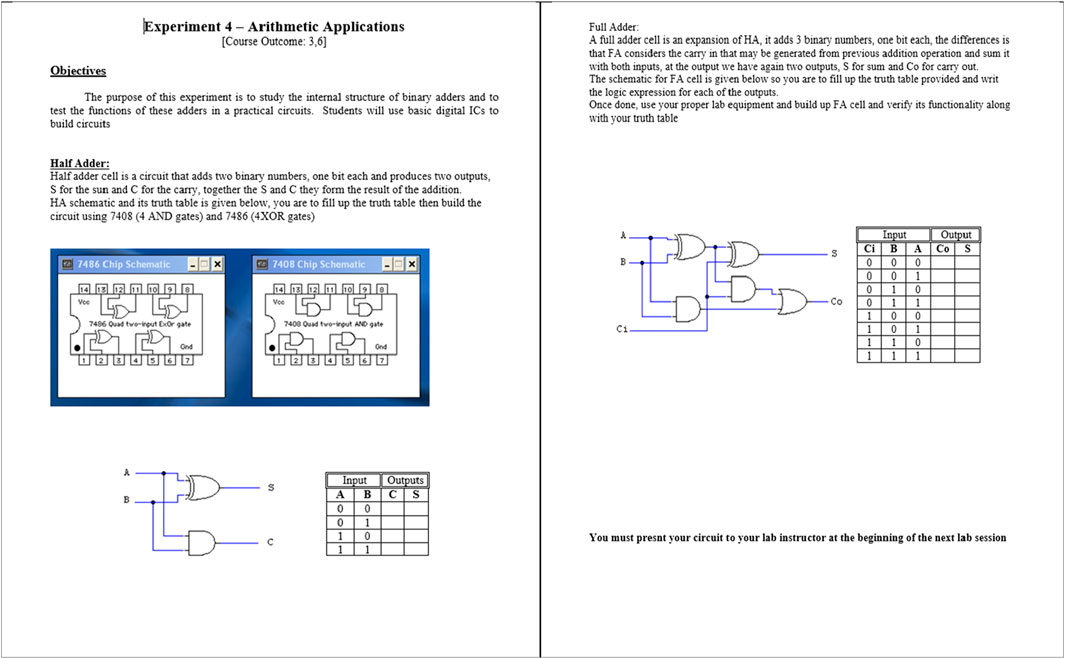
Figure 5. Sample lab text.
In comparison with the physical lab setup and hands-on activities, we will present the VR-lab in the following figures. Figure 6 shows the main landing page, which includes application title, login, and register options. The user can login or register through dedicated screens (see Figure 7), so that the application can keep track of students’ scores and progress. Figure 8 presents the available educational labs that the students can view, start/learn, or stop.
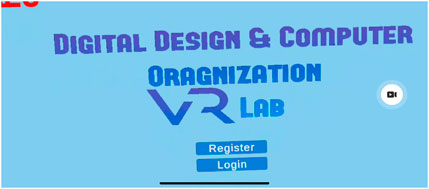
Figure 6. Landing page (main menu): the player chooses the Login or Register option.
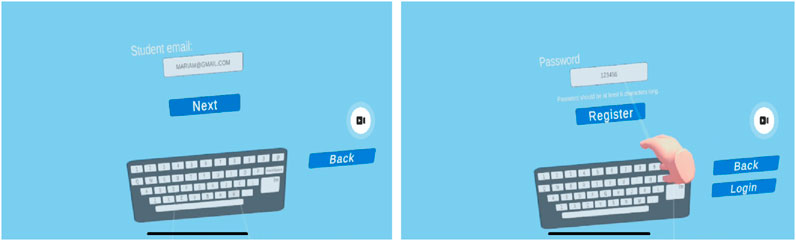
Figure 7. Register page: the player is entering her email and password.
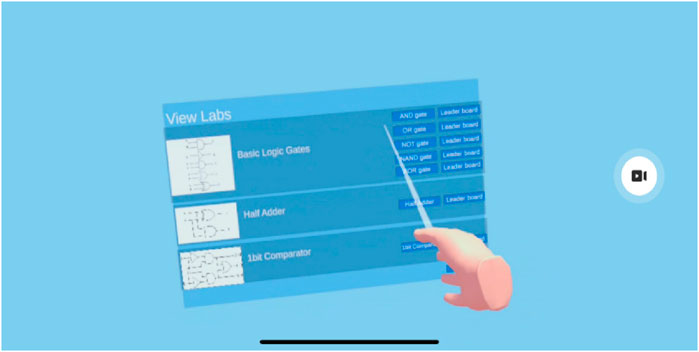
Figure 8. Lab list page, where the student can choose lab to learn.
The student can conduct the lab by following the steps recited by a virtual robot. The lab page includes a virtual robot (ROBO) companion that guides the student through the lab with voiced instructions, Figure 9, and written instructions and hints on the breadboard, Figure 10. While conducting the lab, students will be able to use the controllers as hands to carry objects and place them in highlighted areas, as guided by the ROBO. After completing the lab successfully, the student gains 3 hearts. In case the student skipped some steps and/or did not follow the instructions correctly three consecutive times then she will be redirected to the game-over page. On the right corner of their vision, students will see a timer that starts as soon as the lab starts. The timer will record each student’s time score and save them on the leaderboard. Figure 11 presents a basic lab in which the student attempts a 1-bit comparator. Notice that the student gets sufficient help and hints to complete the lab. In addition, the student can opt to exit and leave the lab.
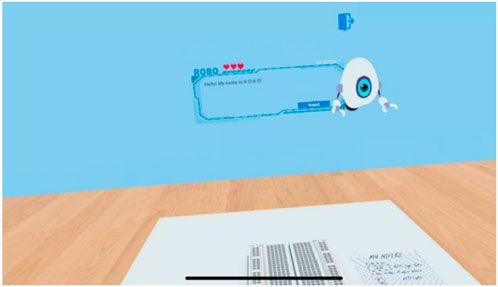
Figure 9. ROBO is giving instructions to the student.
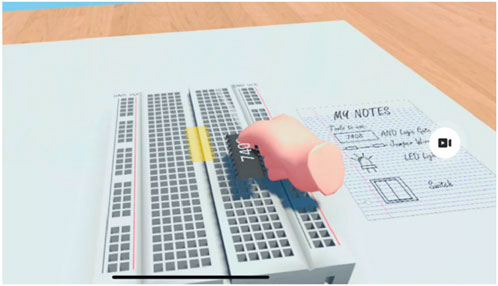
Figure 10. Hints are shown on the breadboard.
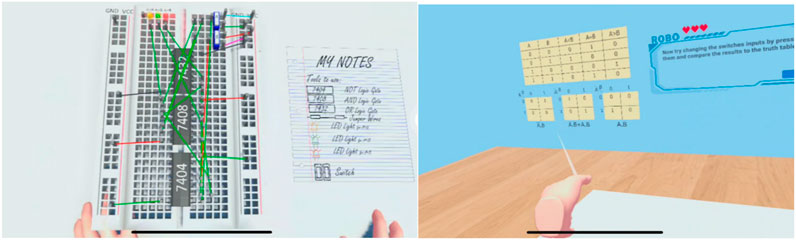
Figure 11. Conducting lab level; 1-bit comparator with truth table and K-maps hints.
The student can check her score and progress through the leaderboard page (Figure 12). Each student’s detail is displayed on the leaderboard, showing her score and the total time spent to complete the lab; that is, the less time the student spends on the labs, the higher her placement is. The student can get more documentation and help to read and learn through the help page (see Figure 13). Notice that the VR-lab environment provides online help, documentation, hints, and unlimited resources. In addition, the student has no time or space limitations and can access the resources and repeat the lab many times.
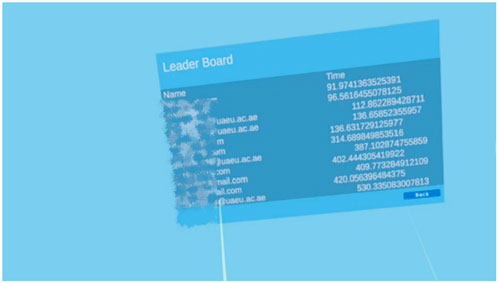
Figure 12. Leaderboard page; note that students’ emails and names were disguised.
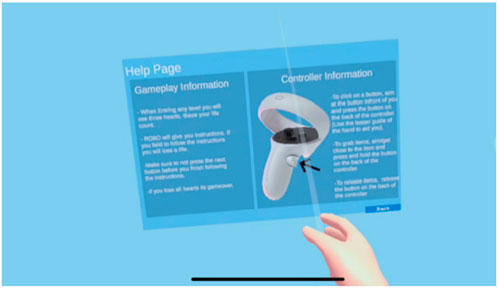
Figure 13. Help page on the controller.
We have incorporated the following gamification mechanisms in the application: levels, score, lives/hearts, hints, and leaderboard. We used informative sprite/icon to serve as an alert or an encouraging indicator to the user.
In terms of hardware and software requirements, the VR prototype has the following hardware requirements:
• Oculus Quest 2 standalone VR headset
• Processor: Intel i5-4590/AMD Ryzen 5 1500X or greater
• Graphics card: Nvidia RTX 20 Series/AMD Radeon RX 6000 Series
• Memory: 8 GB+ RAM
• Operating system: Windows 10, Windows 11
• USB: ports 1× USB port
The following is the list of the software tools, IDEs, and libraries used in developing the VR prototype.
• Unity 2021.3.18f1
• Visual Studio 2019
• Firebase Realtime Database
• Libraries and APIs used: 1XRI Interaction ToolKit and RestClient
• Meta developer account
3.3 Usability evaluation metrics
Usability metrics measure the system or interface’s efficiency, effectiveness, satisfaction, and user-friendliness. They provide invaluable tools to objectively assess and enhance the user experience of a given application, identify areas of improvement, and validate design decisions including the value of user experience (UX) initiative of the stakeholders. In this paper, we integrated both qualitative and quantitative metrics to assess our application. Table 1 presents the usability metrics we used to assess the user’s experience when interacting with the VR environment. These metrics will provide objective data to support the observation and help us identify design decisions and areas of improvement.
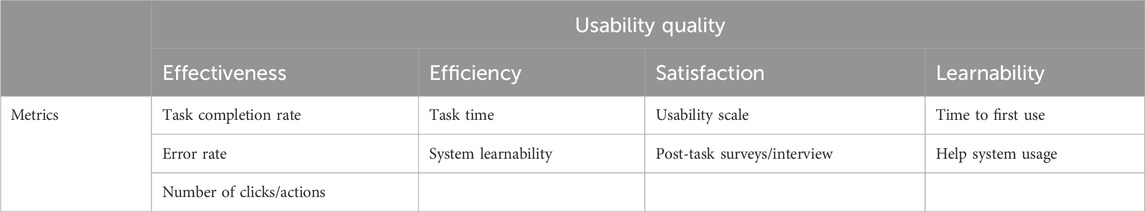
Table 1. Usability metrics used in this work.
Effectiveness: this measures how easy it is for the user to complete a task. This includes the following metrics.
• Task completion rate: this measures the percentage of the users who successfully completed a given task. This way, we determine the ratio of tasks completed by task time (Sampaio and Barbosa, 2016).
• Error rate: this tracks how often the users make mistakes while performing tasks.
• Number of clicks/actions: this measures the minimum number of steps needed to complete a task.
Efficiency: this measures how quickly the user accomplishes a task. This includes the following metrics.
• Task time: this measures the average time it takes the users to complete a given task. Less time can indicate efficiency, but we should consider if speed compromises accuracy.
• System learnability: this measures how easily the users can learn to use the software and perform basic tasks.
Satisfaction: this measures how happy/satisfied the users are with their experience of accomplishing the task. This includes the following metrics.
• Usability scale: we developed a survey to measure the system usability based on 19 questions (see Table 2). In addition, the survey had additional essay questions for feedback and comments. We deviated from the standard system usability scale (SUS) because we needed to emphasize more on the user interface specifics, gamification techniques, and feedback. Nonetheless, our scale includes many of the criteria in SUS.
• Post-task surveys: qualitative feedback was gathered about users’ experiences, including likes, dislikes, and frustrations.
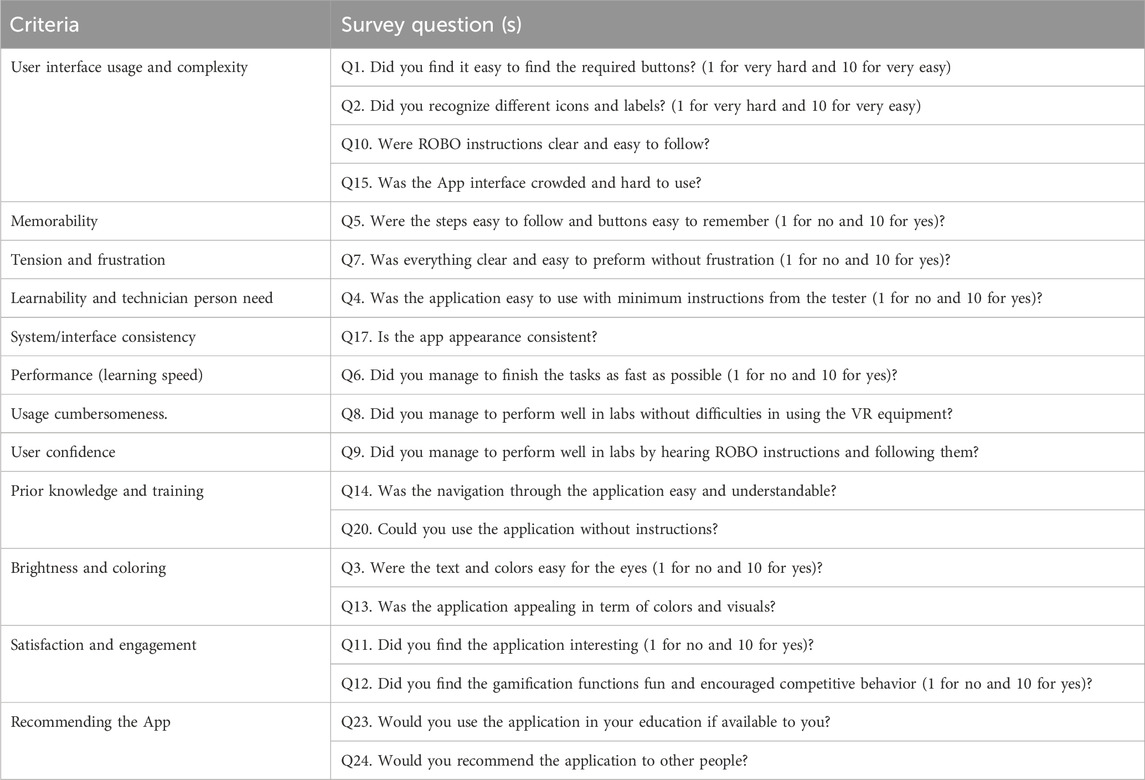
Table 2. Usability scale criteria and survey questions.
Learnability: this measures how easy it is to complete basic tasks the first time they are encountered. It includes the following metrics.
• Time to first use metric: this measures how long it takes the users to complete a basic task on their first interaction with the software.
• Help system usage metric: this measures how often the users rely on the help system to complete tasks.
3.4 Data sample and collection
Our target population is university students specialized in information technology, science, and engineering from various levels. For choosing the sample size, the following were considered:
1. The margin of error (E) is the degree of error that can be allowed. In this paper, we considered 5% margin of error.
2. The confidence level (Z) is the level of surety that the results represent the population. We considered 90% confidence level.
3. The population size (N) is the total number of individuals from which the sample is drawn. Our population size is the course section size in the UAE University, which is approximately 25 students.
4. Response distribution (P) is the expected spread of results from the participants. It is the degree to which we except the results to be skewed. Our response distribution is 50%.
The recommended sample size, S′, is 23 students, which is calculated by Equation 1 (sample size for infinite population), Equation 2 (adjusted sample size for finite population), and using the values: Z = 1.65 (for 90% confidence), P = 0.5, E = 0.05, and N = 25 (Raosoft Inc, 2004).
Note that using a sample of 23 students can increase feasibility by being cost-effective, time-efficient, and provide logistical ease, where it is easier to manage and oversee a smaller group of participants with limited personnel or equipment. It can also enhance the control and the focus by allowing in-depth exploration (closer observation and richer data collection), tailored interventions, and a controlled environment. This way, we can test the feasibility and effectiveness of the application before investing in larger studies, help refine the research questions and hypotheses for further experimentation, and allow one to identify unexpected patterns (Field, 2009; Cohen et al., 2002).
For data collection methods, three primary data collection methods were utilized in this study:
1. Observation test: participants were individually assigned a set of tasks to complete within the VR environment. Research worker observed participants’ actions and recorded task completion rates, time spent on each task, any difficulties encountered, and any user comments. These data provide objective measures of user performance and efficiency.
2. Semi-structured interview: following the observation test, each participant engaged in a one-on-one interview with a research worker. The interview utilized a predefined set of open-ended questions designed to elicit detailed feedback on the VR application’s design, functionality, and perceived ease of use. These qualitative data provide insights into user perceptions, thoughts, and suggestions for improvement (see Section 4).
3. Post-test survey: upon completing the interview, participants were asked to fill out a short, anonymous survey. The survey employed a combination of Likert scale questions (e.g., strongly disagree to strongly agree) and open-ended prompts to gather further feedback on user satisfaction, usability issues, and suggestions for the VR application’s development. These data allow for quantification of user sentiment and complement the qualitative insights from the interview. The survey questions included some of the SUS questions and other feedback questions. Table 2 presents the different usability criteria and the survey questions. Note that we have asked several questions regarding the user interface (UI) complexity and easiness because we want to identify different specifics of the UI. In addition, we asked questions about the tension, colors and brightness, learnability, UI consistency, and satisfaction and engagement.
4. The survey questions included some of the SUS questions and other feedback questions. Table 2 presents the different usability criteria and the survey questions. Note that we have asked several questions regarding the user interface (UI) complexity and easiness because we want to identify different specifics of the UI. In addition, we asked questions about the tension, colors and brightness, learnability, UI consistency, and satisfaction and engagement.
The observation test, interview questions, and responses are public and can be accessed on GitHub (GitHub, 2024).
For the usability scale score, we performed the following steps to calculate the score for each participant.
1. For each positively-oriented question score, we subtracted one from the participant’s answer. The answers will range from zero to nine.
2. We subtracted the user responses from 10 for each negatively oriented question.
3. We summed up the adjusted score. Given the fact that we have twelve criteria, the total will range from 0 to 108.
4. We multiplied the total score by 100/108 to obtain the score out of 100.
Finally, to calculate the overall usability score, we averaged the scores in step 4 over all the responses. Notably, some of the usability criteria include more than one question. For that, we applied the same steps and averaged the score in the questions of that criterion. For example, for UI usage and complexity criterion, we averaged the responses in Q1, Q2, Q10, and Q15.
4 Experiments and data analysis
In this section, we present and analyze the results of the observation test and the survey that we conducted during this work. First, we present the observation test results; second, we elaborate on the student survey; and finally, we view the results of the one-to-one interviews.
4.1 Observation test
The usability test was conducted on 22 UAE university students from different colleges and backgrounds. The experiments spanned over 2 days for 8 h each. The experiment flow is as follows. First, a summary of the application idea and functionality was presented to the students for 3 min. Second, a brief explanation of the tasks (see Table 3), to be performed by the participants was given. Third, the observer helped participants to get familiar with VR headsets and showed them how to use the grips. In addition, the participants were warned about the motion sickness that the VR headset might cause, and they were instructed to inform the observer to stop the experiment in case they felt motion sickness. Finally, we collected feedback and reviews through surveys and interviews. At the end of the experiment, the observers requested the student to fill in a form, and they conducted an interview. It is worth mentioning that the VR experiment’s maximum time was 30 min for each student and 10 min for the feedback. The average time to complete the maximum number of tasks of the experiment for each student was 18 min. In the following section, we will elaborate on the data analysis for each usability metric listed in Table 1. The technical tasks and the brief description of each are shown in Table 3.
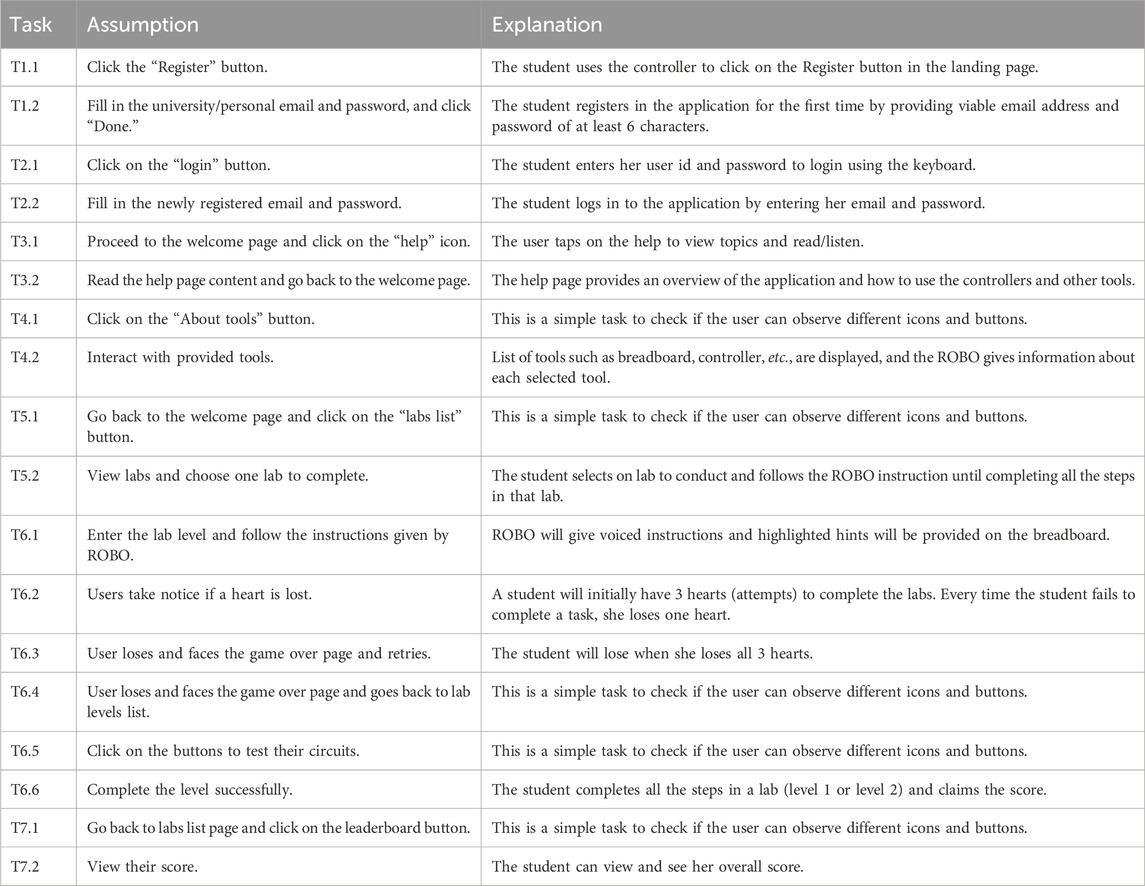
Table 3. List of tasks.
Figure 14 presents the task completion rate. The x-axis of the figure represents the task as described in Table 3, and the y-axis represents the percentage of students who completed that task. We can observe that all students managed to register, log in, and at least play one level of the lab. We can also see that task T6.2 is skewed. Recall that task T6.2 is relatively difficult because the student would have to move wires and gates and connect them to the breadboard. The majority of students have at least lost one heart (attempt) while trying the level for the first time. However, 39% of students completed all the steps in task T6.2 in the first attempt. This brings us to our next consideration: facing the game-over page and retrying or leaving to lab list. A total of 90.09% of the students did not lose all their game hearts and managed to finish the level without facing the game-over page.
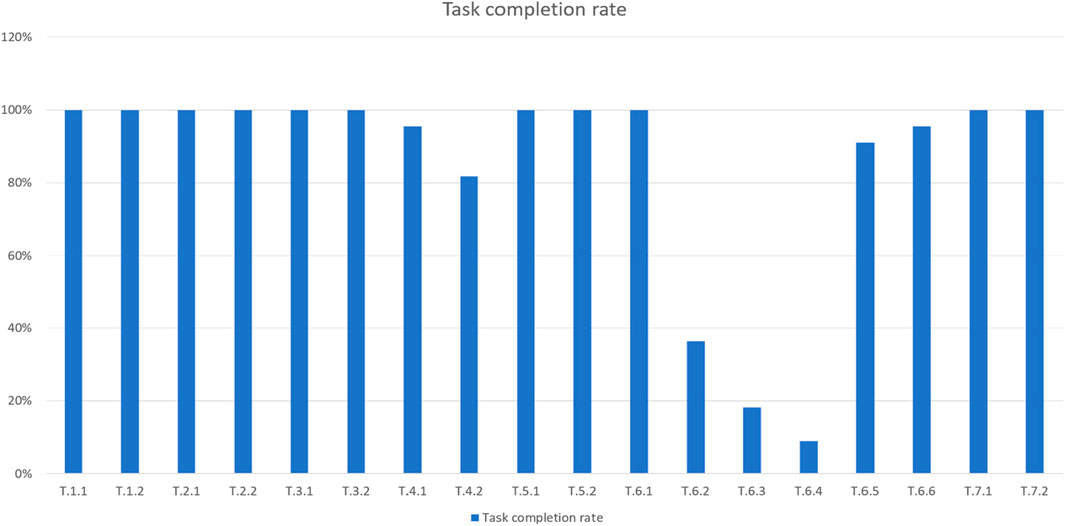
Figure 14. Task completion rate.
Although the error rate during lab levels was extremely low, 31.81% of students struggled with entering their emails and passwords during registration and login. These students either wrote their email incorrectly or forgot their newly registered account password (see Figure 15). The average time for the students to complete the whole list of tasks in Table 2 was 20 min. The task that had the longest average time was registering and logging in, with an average time of 8 min. Table 4 compares between the real lab completion time vs. the VR-lab average completion lab for the two-level tasks. The table also presents the standard deviation and the p-value for each task. The VR-lab takes less time for different reasons but mainly because of the role of ROBO, which assists students with online step-by-step instructions of how to complete the lab. In addition, the logistics and setup in the physical lab take more time, especially if there is only one lab assistant/instructor available for the students. Furthermore, the hardware/wire malfunction can be frustrating and enlarge the lab duration.
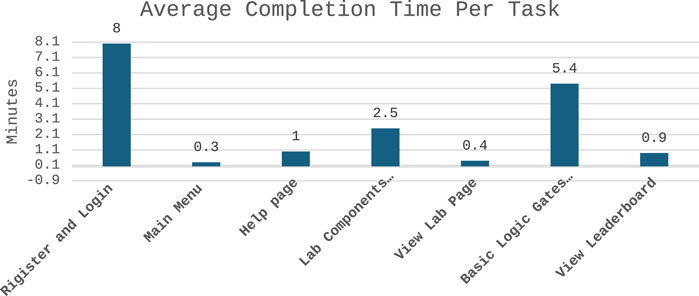
Figure 15. Average completion time per task.
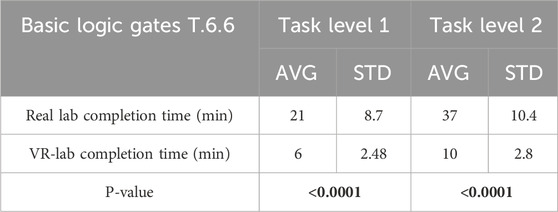
Table 4. Average real lab completion vs. VR-lab completion (t-test).
While observing the students, we received the following students’ comments:
1. The keyboard to log in and register needs to be closer to the user so they can interact with it more smoothly.
2. Approximately 2% of the students are nearsighted, which caused some images to appear unclear for them during the lab activities. One student suggested positioning the images on the VR table instead of next to the ROBO speech bubble, so they could work on the circuit while viewing the image and listening to ROBO without needing to look up.
3. A total of 9% of the students did not notice when a heart was lost and suggested adding an alarm sound to make students aware of that.
4. A total of 18% of the students showed competitiveness and played the same level multiple times to get a higher score.
5. A total of 22.7% of students showed interest and wanted to play multiple different levels.
6. All wires have the same color and should be made brighter or differentiated by color.
4.2 Student survey and usability scale
In this section, we will look at the usability survey that we have conducted, analyze the results, and suggest improvements to the VR application. Questions in the survey were scored on a 10-point Likert scale ranging from 1 (very hard) to 10 (very easy). Additionally, we had open-ended questions for the students to provide us with their feedback and comments. In the following figures, we elaborate on the main survey questions, presenting the survey question, responses, average, standard deviation, and p-value. Note that the percentages of responses in the below figures are rounded. In addition, for calculating the p-value, we used one sample test analysis with hypothetical mean of 70%.
Figure 16 presents the responses of the students in the survey when asked on the ease-of-usage of the VR application. The x-axis represents the response (1–10, where 1 is very hard and 10 is very easy), and the y-axis represents number of responses for questions Q1–Q3. The mean, standard deviation, and the p-value of the responses are as follows: (mean = 8.31, STD = 2.19, and p-value = 0.0089 < 0.05), (mean = 9.0, STD = 1.78, hypothetical mean = 7, and p-value <0.0001) and (mean = 8.18, STD = 2.28, hypothetical mean = 7, and p-value = 0.0212) for Q1, Q2, and Q3, respectively. The figure shows that approximately 73% of the students found the application extremely easy to find and navigate, and the text, colors, and icons were recognizable. However, 27% of the participants found it a little inconvenient and gave a less than 8 score out of 10. After analyzing students’ comments/feedback, we found that such difficulty was related to the fact that the keyboard buttons were very far and hard to reach. We addressed this feedback by placing the keyboard closer to the student and rotating it on the x-axis slightly so that it is more comfortable to use. Additionally, we placed the next button closer to the table so that students can click on it as soon as they finish adding the components to the breadboard.
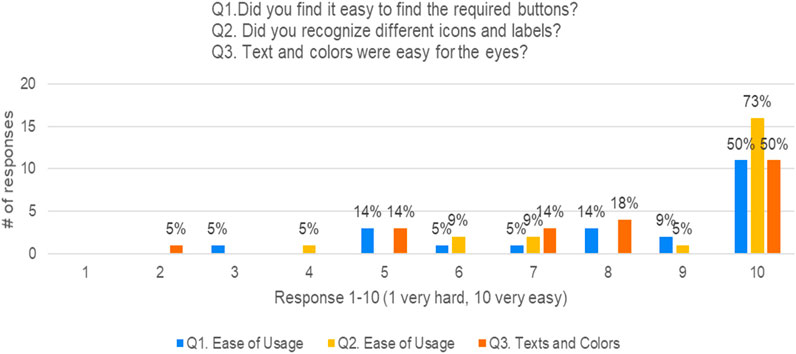
Figure 16. Responses of Q1 and Q2 (ease-of-usage) and Q3 on texts and colors.
Figure 17 presents responses on the learnability, memorability, and performance of the VR application. The figure shows that 86% of the students replied that the application is easy to learn, whereas 90% of the students stated that it is easy to remember tasks and steps. The main complaint of the remaining 15% of the respondents was the inability to see dark-colored wires. Therefore, we adjusted the colors of the wires to be brighter. In terms of the performance during conducting the labs, 81% of the students finished the tasks smoothly without requesting any help. The main issue of performance lagging of the remaining 19% of the students was logging and registering to the application, which can be mitigated by enabling other biometric methods of login such as face or fingerprint recognition. The mean, standard deviation, and the p-value of the responses are as follows: (mean = 9, STD = 1.57, and p-value<0.0001), (mean = 9.22, STD = 2.06, and p-value<0.0001), and (mean = 8.54, STD = 2.26, and p-value = 0.0035) for Q4, Q5, and Q6, respectively.
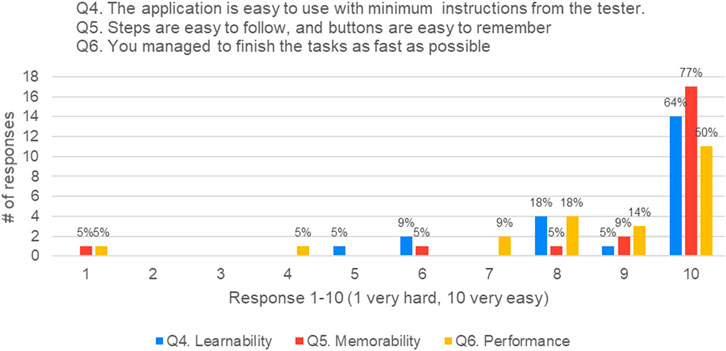
Figure 17. Responses of Q4 (learnability), Q5 (memorability), and Q6 (performance).
Figure 18 presents the responses of participants in terms of tension/frustration, usage of VR equipment, and ROBO instructions. We can see that 77% of the students did not feel any tension or frustration, whereas 33% of the students stated that they needed more practice to get a better experience with the VR controls and equipment. We obtained similar results regarding the use of the VR headset and equipment in the application. In addition, 90% of the students managed to complete lab levels with only ROBO instructions. The mean, standard deviation, and the p-value of the responses are as follows: (mean = 8.5, STD = 2.57, and p-value = 0.0105), (mean = 8.72, STD = 2.33, and p-value = 0.0018), and (mean = 9.31, STD = 2.0, and p-value <0.0001) for Q7, Q8, and Q9, respectively. Generally, 92% of the students thought that the hints and voiced instructions of ROBO were very helpful and easy to follow. Additionally, Figure 19 shows that 95% of the students are satisfied with the application and the gamification elements.
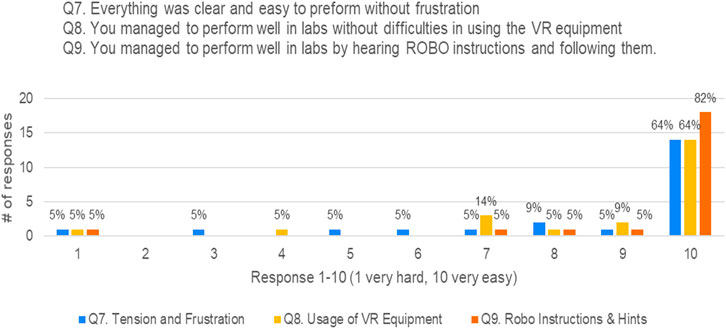
Figure 18. Responses of Q7 (tension and frustration), Q8 (usage of VR equipment), and Q9 (ROBO instructions and hints).
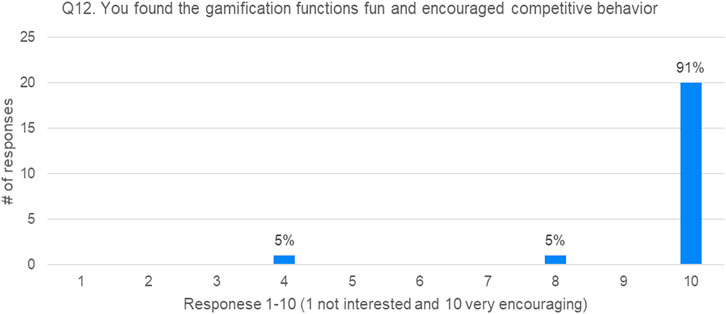
Figure 19. Satisfaction: students’ interest and the effect of gamification (mean = 9.63, STD = 1.32, hypothetical mean = 7, and p-value < 0.0001).
Table 5 summarizes the survey results and presents the average and standard deviation for the 12 usability criteria. The overall usability scale we obtained is 84%, which indicates that the system’s usability is excellent.
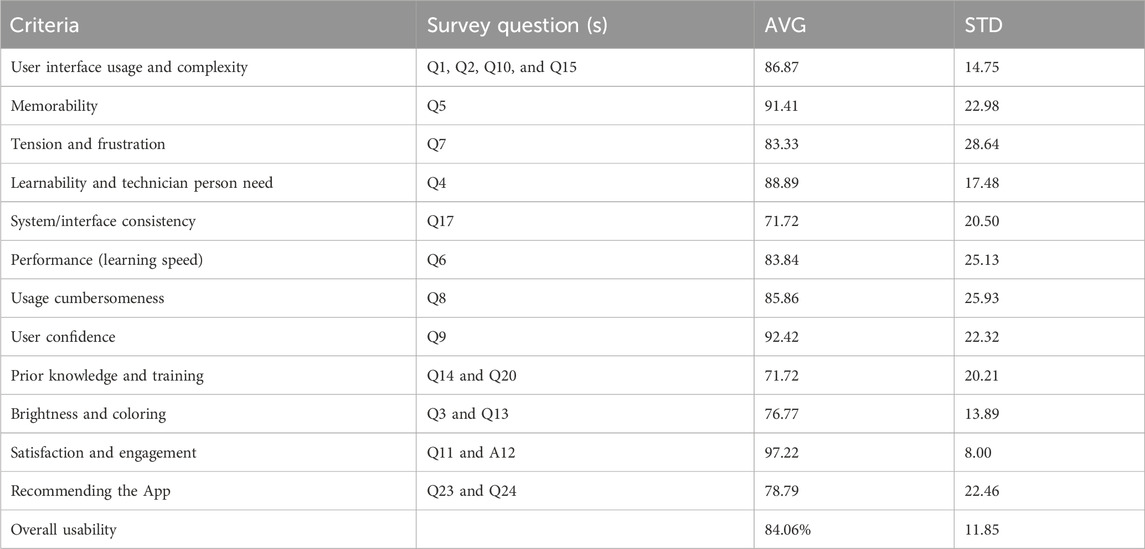
Table 5. Usability survey questions results (average and standard deviation).
4.3 One-to-one student interview
In addition to the survey, we conducted one-to-one interviews with the students. In the following, we highlight the main issues and remarks from the students.
• A total of 90% of the students thought that the VR application was not crowded, easy to use, close to the real lab, simple, clear, and well organized.
• A total of 95% of the students thought that the application’s appearance was consistent and not confusing.
• A total of 86.4% of the students thought that they could use the application without instructions.
Additionally, we received the following remarks/feedback from the students when asked about the fun points that enhanced their user experience in the application:
o “Putting all the chips and wires together.”
o “Starting the circuit,” after completing the lab.
o “To get the result that I was expecting from the lab.”
o “I liked experimenting with the wires and doing the labs, and I loved the leaderboard.”
o “The limited hearts made me think twice about the placement, so I don’t lose, and it’s fun to compete with your colleagues in the leaderboard.”
o “The physical board with wires and other components.”
o “Switching the LED ON and OFF”
o “The part where it showed me that I was wrong in some of the applications, and I was very satisfied when it worked.”
o “Leaderboard time and hearts.”
o “Performing the task was easy and well-guided for someone who is playing for the first time.”
o “The way we can interact to build the circuit with instructions.”
o Introduce “change language” option and have Arabic/English languages.
5 Discussion
The usability study of the digital design and computer organization lab VR application yielded valuable insights into user experience within the immersive VR environment. In this section, we will analyse the data and discuss the key findings and their implications for improving the VR application’s effectiveness.
Generally, the data analyzed in the previous section showed that the majority of students highly appreciated the user experience with the application. The usability test identified several areas for improvement in the application. Therefore, we provided an updated version of the application with additional fixes and features. For instance, users reported issues differentiating wire colors. After the update, wires’ colors become brighter and visible/distinguishable. Another issue was overlapping voice lines in the lab components page and the ability to choose two tools at the same time, which led to confusion, and some users thought that some of the text size was too small. All the mentioned issues of the lab components page were fixed and updated. Another issue was viewing the 1-bit comparator leaderboard, which would sometimes not load. This issue was fixed as well. Furthermore, the following list shows other general updates:
• Added soundtrack (BGM, heart lost sound effect, and game-over sound effect).
• New hint added to the levels: “my notes paper” contains lab tools used.
• Changed the placement of logic gates diagrams in levels to be on the table to make it easier for the student to follow instructions.
• New hint added to levels: add VCC and GND text on the board.
• Fixed register/login issues such as requesting only the university id instead of their full email.
In terms of engineering education, the study found the following:
• Learnability: the VR-lab was easy to learn with minimum interaction (mean = 9, STD = 1.57, hypothetical mean = 7, and p-value < 0.0001).
• Memorability: the VR application makes significant improvement for students to easily remember steps (mean = 9.22, STD = 2.06, hypothetical mean = 7, and p-value < 0.0001).
• The VR-lab enabled the students to finish tasks quickly (mean = 8.54, STD = 2.26, hypothetical mean = 7, and p-value = 0.0035).
• The VR-lab reduced the task completion time; hence, it reduced the amount of tension and frustration that might result in hardware failure and lack of resources and guidance (mean = 8.5, STD = 2.57, hypothetical mean = 7, and p-value = 0.0105).
Compared to the traditional setting of the lab, the above findings provide great motivation to integrate the VR-lab in the course. In addition, the feedback of the students showed that such VR-labs contributed positively to their education and engagement during the lab.
Finally, during this work, we found that the use of VR application in education necessitates conducting thorough usability testing before deployment. The usability test is a paramount to identify weaknesses and bugs in the application. We found that gamification is very effective in education to encourage continuation, competitive behavior, satisfaction, and great user experience.
6 Limitations of the study
In this paper, we investigated the students’ preferences in VR application to learn digital design course labs. We analyzed the survey results on the student’s experience with the VR environment and their acceptance of the technology. Students from different colleges applied for the experiment; however, the sample size of 22 students may not be generalizable to the entire population of the digital design and computer organization lab course. In addition, the study focused on the digital design and computer organization lab VR environment, limiting the findings to only this educational course rather than other courses that can be implemented in VR. Additionally, there was a shortage of resources; we had only one VR headset to test with, and thus, the experiment was time-consuming. Future research with larger and more diverse participant groups and studies conducted in actual classrooms could provide more comprehensive insights.
7 Ethical considerations
The surveys in this work were conducted according to the guidelines of the Institutional Review Board (or Ethics Committee) of the United Arab Emirates University (protocol code ERSC_2022_2029 and date of approval 23/02/2023); a copy of the ethical form can be found at (GitHub, 2024). Informed consent was obtained from all subjects involved in the study. Prior to starting the survey and the experiment, the authors explained to the students the procedure and the usage of the application. The purpose of the study was not explained in advance so as not to influence students’ responses. Students were instructed that they can discontinue participation or decline to respond to any of the questions in the survey. All students provided spoken informed consent.
8 Conclusion
In this usability study, we discussed the user experience of the digital design and computer organization lab VR application. By employing a mixed-methods approach with observation tests, interviews, and surveys, the study yielded valuable insights into user performance and perceptions.
Overall, user feedback indicated positive perceptions of the VR application’s ability to gamify the digital design and computer organization lab experience. Participants found the VR immersive environment engaging, competitive, and helpful for understanding the material. However, some users reported usability challenges such as color themes, keyboard usage, registration, visibility, and cyber-sickness. In this study, we also emphasize the importance of iterative design and user testing throughout the development process of VR applications in education.
The usability study has shown that VR-lab contributed positively on the students’ engagement and interest in the lab materials. In addition, the VR-lab can lower the level of frustration and tension during the lab. Therefore, we recommend integrating the VR-lab in the course to support students’ learning and to make such complex engineering concepts fun to learn. However, the use of physical breadboard and wires will continue due to college and course requirements.
For future research, we plan to deploy the VR application in a live course and investigate the impact of gamification and VR on the academic level of students and the learning outcomes achievement of the course. We also plan to study the impact of VR-lab on variety of advanced physical tasks and the impact on task completion time.
Data availability statement
The original contributions presented in the study are publicly available. This data can be found here: GitHub, 2024.
Author contributions
MAA: Data curation, Formal Analysis, Methodology, Project administration, Supervision, Validation, Visualization, Conceptualization, Funding acquisition, Investigation, Resources, Software, and Writing – original draft. MA: Data curation, Formal Analysis, Methodology, Project administration, Supervision, Validation, Visualization, and Writing – review and editing.
Funding
The author(s) declare that no financial support was received for the research and/or publication of this article.
Conflict of interest
The authors declare that the research was conducted in the absence of any commercial or financial relationships that could be construed as a potential conflict of interest.
Generative AI statement
The author(s) declare that no Generative AI was used in the creation of this manuscript.
Publisher’s note
All claims expressed in this article are solely those of the authors and do not necessarily represent those of their affiliated organizations, or those of the publisher, the editors and the reviewers. Any product that may be evaluated in this article, or claim that may be made by its manufacturer, is not guaranteed or endorsed by the publisher.
References
Akcayir, M., and Akcayir, G. (2017). Advantages and challenges of virtual reality in education. Int. J. Virtual Real. Educ. 6 (2), 1–12. doi:10.1016/j.edurev.2016.11.002
Al-Ansi, A. M., Jaboob, M., and Garad, A. (2023). Analyzing augmented reality (AR) and virtual reality (VR) recent development in education. Soc. Sci. and Humanit. Open 8 (1), 100532. doi:10.1016/j.ssaho.2023.100532
Al Awadhi, S., Al Habib, N., Al-Murad, D., Al deei, F., Al Houti, M., Beyrouthy, T., et al. (2018). Interactive virtual reality educational application. Adv. Sci. Technol. Eng. Syst. J. 3 (3), 72–82. doi:10.25046/aj030409
Alnagrat, A. J. A., Ismail, R. C., and Idrus, S. Z. S. (2022). The opportunities and challenges in virtual reality for virtual laboratories. Innovative Teach. Learn. J. 6 (2), 73–89. doi:10.11113/itlj.v6.91
Birrenbach, T., Stuber, R., Müller, C. E., Sutter, P. M., Hautz, W. E., Exadaktylos, A. K., et al. (2024). Virtual reality simulation to enhance advanced trauma life support trainings–a randomized controlled trial. BMC Med. Educ. 24 (1), 666. doi:10.1186/s12909-024-05645-2
Brade, J., Lorenz, M., Busch, M., Hammer, N., Tscheligi, M., and Klimant, P. (2017). Being there again – presence in real and virtual environments and its relation to usability and user experience using a mobile navigation task. Int. J. Human-computer Stud. 101, 76–87. doi:10.1016/j.ijhcs.2017.01.004
Chandra, A. N. R., El Jamiy, F., and Reza, H. (2019). “A review on usability and performance evaluate on in virtual reality systems,” in Proceedings of the 2019 international conference on computational science and computational intelligence (CSCI). Las Vegas, NV, USA, 1107–1114.
Chen, C. J., Lau, S. Y., Chuah, K. M., and Teh, C. S. (2013). Group usability testing of virtual reality-based learning environments: a modified approach. Procedia-Social Behav. Sci. 97, 691–699. doi:10.1016/j.sbspro.2013.10.289
Chisalita, C., Puerta-Melguizo, M. C., and Van der Veer, G. C. (2003). Designing complex systems in industrial reality: a study of the Dutch approach. Accept. Eur. ICT Certif. Stand. Promot. by CEPIS Counc. Eur. Prof. Inf. Soc. 46–52. Available online at: https://citeseerx.ist.psu.edu/document?repid=rep1&type=pdf&doi=e4090d5f5e5b87ab6a2dc1d88fb22c5e0c20f025.
Cohen, L., Manion, L., and Morrison, K. (2002). Research methods in education 5th Ed., London: Routledge. doi:10.4324/9780203224342
de França, A. C. P., Pereira Neto, J., and Soares, M. M. (2018). “Methods and procedures to usability testing in virtual reality systems,” in Advances in ergonomics in design: proceedings of the AHFE 2017 international conference on ergonomics in design, July 17− 21, 2017, Los Angeles, California, The Westin Bonaventure Hotel, (Springer International Publishing), 45–51.
Deriba, F. G., Saqr, M., and Tukiainen, M. (2024). Assessment of accessibility in virtual laboratories: a systematic review. Front. Educ. 9, 1351711. doi:10.3389/feduc.2024.1351711
Dias, P., Pimentel, A., Ferreira, C., Huussen, F. v., Baggerman, J. W., der Horst, P. v., et al. (2007). “Usability in virtual and augmented environments: a qualitative and quantitative study,” in Stereoscopic displays and virtual reality systems XIVSystems XIV. Vol. 6490. San Jose, CA: SPIE, 64901I. doi:10.1117/12.703878
di Lanzo, J. A., Valentine, A., Sohel, F., Yapp, A. Y., Muparadzi, K. C., and Abdelmalek, M. (2020). A review of the uses of virtual reality in engineering education. Comput. Appl. Eng. Educ. 28 (3), 748–763. doi:10.1002/cae.22243
Downey, L. L. (2007). Group usability testing: evolution in usability techniques. J. Usability Stud. 2 (3), 133–144. doi:10.5555/2835547.2835550
Eaves, D. L., Breslin, G., Van Schaik, P., Robinson, E., and Spears, I. R. (2011). The short-term effects of real-time virtual reality feedback on motor learning in dance. Presence Teleoperators Virtual Environ. 20 (1), 62–77. doi:10.1162/pres_a_00035
Farra, S. L., Gneuhs, M., Hodgson, E., Kawosa, B., Miller, E. T., Simon, A., et al. (2019). Comparative cost of virtual reality training and live exercises for training hospital workers for evacuation. CIN Comput. Inf. Nurs. 37 (9), 446–454. doi:10.1097/cin.0000000000000540
Feisel, L. D., and Rosa, A. J. (2005). The role of the laboratory in undergraduate engineering education. J. Eng. Educ. 94 (1), 121–130. doi:10.1002/j.2168-9830.2005.tb00833.x
Field, A. P. (2009). Discovering statistics using SPSS. 3rd ed. SAGE Publications Ltd. (Chapter 5 discusses sample size considerations and trade-offs). Thousand Oaks CA: Sage Publications.
Freina, L., and Ott, M. (2015). A literature review on immersive virtual reality in education: state of the art and perspectives. Int. Sci. Conf. elearning Softw. Educ. 1 (133), 10–1007. doi:10.12753/2066-026X-15-020
Gawron, V. J. (2014). Review of the effects of fatigue on performance of laboratory tasks. Int. J. Hum. Factors Ergonomics 3 (1), 86–103. doi:10.1504/ijhfe.2014.062551
GitHub (2024). GitHub Link to supportive Documents and article resources. Available online at: https://github.com/MariamA-A/Digital-Design-Computer-Organization-VR-Lab (Accessed May 24, 2024)
Gonçalves, G., Coelho, H., Monteiro, P., Melo, M., and Bessa, M. (2022). Systematic review of comparative studies of the impact of realism in immersive virtual experiences. ACM Comput. Surv. 55 (6), 1–36. doi:10.1145/3533377
Hartson, H. R., Andre, T. S., and Williges, R. C. (2001). Criteria for evaluating usability evaluation methods. Int. J. Hum. Comput. Interact. 13, 373–410. doi:10.1207/S15327590IJHC1304_03
Hernández-de-Menéndez, M., Vallejo Guevara, A., and Morales-Menendez, R. (2019). Virtual reality laboratories: a review of experiences. Int. J. Interact. Des. Manuf. (IJIDeM) 13, 947–966. doi:10.1007/s12008-019-00558-7
Hoorn, J. F., Konijn, E. A., and Van der Veer, G. C. (2003). Virtual reality: do not augment realism, augment relevance. Human-Computer Interact. Overcoming Barriers 4 (1), 18–26. Available online at: https://citeseerx.ist.psu.edu/document?repid=rep1&type=pdf&doi=e4090d5f5e5b87ab6a2dc1d88fb22c5e0c20f025.
Huang, H., and Lee, C. F. (2022). Factors affecting usability of 3D model learning in a virtual reality environment. Interact. Learn. Environ. 30 (5), 848–861. doi:10.1080/10494820.2019.1691605
Huang, W., and Roscoe, R. D. (2021). Head-mounted display-based virtual reality systems in engineering education: a review of recent research. Comput. Appl. Eng. Educ. 29 (5), 1420–1435. doi:10.1002/cae.22393
Ironsi, C. S. (2023). Investigating the use of virtual reality to improve speaking skills: insights from students and teachers. Smart Learn. Environ. 10 (1), 53. doi:10.1186/s40561-023-00272-8
Jochecová, K., Černý, M., Stachoň, Z., Švedová, H., Káčová, N., Chmelík, J., et al. (2022). Geography education in a collaborative virtual environment: a qualitative study on geography teachers. ISPRS Int. J. Geo-Inf. 11, 180. doi:10.3390/ijgi11030180
Jung, S., and Lindeman, R. W. (2021). Perspective: does realism improve presence in VR? suggesting a model and metric for VR experience evaluation. Front. Virtual Real. 2, 693327. doi:10.3389/frvir.2021.693327
Jung, Y. (2022). Virtual reality simulation for disaster preparedness training in hospitals: integrated review. J. Med. Internet Res. 24 (1), e30600. doi:10.2196/30600
Kamińska, D., Zwoliński, G., and Laska-Leśniewicz, A. (2022). Usability testing of virtual reality applications—the pilot study. Sensors 22 (4), 1342. doi:10.3390/s22041342
Katernyak, I., and Loboda, V. (2016). Cognitive presence and effect of immersion in virtual learning environment. Univers. J. Educ. Res. 4 (11), 2568–2573. doi:10.13189/ujer.2016.041109
Kollöffel, B., and De Jong, T. (2013). Conceptual understanding of electrical circuits in secondary vocational engineering education: combining traditional instruction with inquiry learning in a virtual lab. J. Eng. Educ. 102 (3), 375–393. doi:10.1002/jee.20022
Kurbatova, S. M., Yu Aisner, L., and Krasnousov, S. D. (2022). Virtual technologies in the educational space: pros and cons. In Proceedings of the 1st International Scientific Forum on Sustainable Development of Socio-economic Systems. SCITEPRESS - Science and Technology Publications, Lda. 536–542. doi:10.5220/0010671500003223
Li, Z., Wang, W., and Huang, Z. Z. (2025). Virtual reality for emergency medicine training on traffic accident injury treatment: a randomized controlled trial. Front. Virtual Real. 6, 1518016. doi:10.3389/frvir.2025.1518016
Lu, F., Yu, D., Liang, H. N., Chen, W., Papangelis, K., and Ali, N. M. (2018). “Evaluating engagement level and analytical support of interactive visualizations in virtual reality environments,” in 2018 IEEE international symposium on mixed and augmented reality (ISMAR) Munich, Germany: (IEEE), 143–152. doi:10.1109/ISMAR.2018.00050
Lucas, J. D. (2018). Immersive VR in the construction classroom to increase student understanding of sequence, assembly, and space of wood frame construction. J. Inf. Technol. Constr. 23, 179–194. Available online at: https://www.itcon.org/paper/2018/9.
Lynch, T., and Ghergulescu, I. (2017). Review of virtual labs as the emerging technologies for teaching STEM subjects. INTED2017 Proc., 6082–6091. doi:10.21125/inted.2017.1422
Marougkas, A., Troussas, C., Krouska, A., and Sgouropoulou, C. (2023). Virtual reality in education: a review of learning theories, approaches and methodologies for the last decade. Electronics 12 (13), 2832. doi:10.3390/electronics12132832
Newman, M. A. R. K., Gatersleben, B., Wyles, K. J., and Ratcliffe, E. (2022). The use of virtual reality in environment experiences and the importance of realism. J. Environ. Psychol. 79, 101733. doi:10.1016/j.jenvp.2021.101733
Norwine, L., Bouck, E., Reiley, S., Long, H. M., Jakubow, L., and Nuse, J. (2025). Using non-immersive virtual reality to teach life skills to students with disabilities in rural schools. Rural. Spec. Educ. Q. 44 (1), 26–38. (Original work published 2025). doi:10.1177/87568705241305640
Oje, A. V., Hunsu, N. J., and May, D. (2023). Virtual reality assisted engineering education: a multimedia learning perspective. Comput. and Educ. X Real. 3, 100033. doi:10.1016/j.cexr.2023.100033
Raosoft Inc (2004). RaoSoft® sample size calculator. Available online at: http://www.raosoft.com/samplesize.html (Accessed February 06, 2024).
Romli, R., and Yaakob, A. R. (2017). The theoretical model of designing desktopVR in learning environment. Adv. Sci. Lett. 23 (5), 4211–4214. doi:10.1166/asl.2017.8309
Sampaio, A. M., and Barbosa, J. G. (2016). Energy-efficient and SLA-based resource management in cloud data centers. Adv. Comput., 103–159. doi:10.1016/bs.adcom.2015.11.002
Scorgie, D., Feng, Z., Paes, D., Parisi, F., Yiu, T. W., and Lovreglio, R. (2024). Virtual reality for safety training: a systematic literature review and meta-analysis. Saf. Sci. 171, 106372. doi:10.1016/j.ssci.2023.106372
Selzer, M. N., Gazcon, N. F., and Larrea, M. L. (2019). Effects of virtual presence and learning outcome using low-end virtual reality systems. Displays 59, 9–15. doi:10.1016/j.displa.2019.04.002
Shi, L., and Xu, C. (2024). Virtual reality technologies to provide performance feedback for motor and imagery training. Educ. Inf. Technol. 29, 23781–23799. doi:10.1007/s10639-024-12791-z
Slater, M., and Wilbur, S. (1997). A framework for immersive virtual environments (FIVE): speculations on the role of presence in virtual environments. Presence Teleoperators and Virtual Environ. 6 (6), 603–616. doi:10.1162/pres.1997.6.6.603
Soliman, M., Pesyridis, A., Dalaymani-Zad, D., Gronfula, M., and Kourmpetis, M. (2021). The application of virtual reality in engineering education. Appl. Sci. 11 (6), 2879. doi:10.3390/app11062879
Tarng, W., Chen, C. J., Lee, C. Y., Lin, C. M., and Lin, Y. J. (2019). Application of virtual reality for learning the material properties of shape memory alloys. Appl. Sci. 9 (3), 580. doi:10.3390/app9030580
Veras, M., Stewart, J., Deonandan, R., Tatmatsu-Rocha, J. C., Higgins, J., Poissant, L., et al. (2020). Cost analysis of a home-based virtual reality rehabilitation to improve upper limb function in stroke survivors. Glob. J. Health Sci. 12 (2), 98–105. doi:10.5539/gjhs.v12n2p98
Wee, C., Yap, K. M., and Lim, W. N. (2022). iprogvr: design of a virtual reality environment to improve introductory programming learning. IEEE Access 10, 100054–100078. doi:10.1109/access.2022.3204392
Wolfartsberger, J. (2019). Analyzing the potential of Virtual Reality for engineering design review. Autom. Constr. 104, 27–37. doi:10.1016/j.autcon.2019.03.018
Zhang, L., Bowman, D. A., and Jones, C. N. (2019). “Exploring effects of interactivity on learning with interactive storytelling in immersive virtual reality,” in 2019 11th international conference on virtual worlds and games for serious applications (VS-games) (IEEE), 1–8.
Keywords: virtual reality (VR), digital design and computer organization, usability, analysis, education
Citation: Alnuaimi MA and Awad M (2025) VR environment of digital design laboratory: a usability study. Front. Virtual Real. 6:1566680. doi: 10.3389/frvir.2025.1566680
Received: 25 January 2025; Accepted: 27 May 2025;
Published: 18 July 2025.
Edited by:
Myunghwan Yun, Seoul National University, Republic of KoreaReviewed by:
Yong Min Kim, Dongduk Women’s University, Republic of KoreaVítor J. Sá, School of Health, Polytechnic Institute of porto, Portugal
Copyright © 2025 Alnuaimi and Awad. This is an open-access article distributed under the terms of the Creative Commons Attribution License (CC BY). The use, distribution or reproduction in other forums is permitted, provided the original author(s) and the copyright owner(s) are credited and that the original publication in this journal is cited, in accordance with accepted academic practice. No use, distribution or reproduction is permitted which does not comply with these terms.
*Correspondence: Mamoun Awad, bWFtb3VuLmF3YWRAdWFldS5hYy5hZQ==
†ORCID: Mamoun Awad, orcid.org/0000-0001-7424-4129; Mariam Ali Alnuaimi, orcid.org/0009-0002-3689-6884