 Jiating Zhu
 Basilis Zikopoulos
 Arash Yazdanbakhsh
- 1Program in Brain, Behavior & Cognition, Department of Psychological and Brain Sciences, Boston University, Boston, MA, United States
- 2Human Systems Neuroscience Laboratory, Department of Health Sciences, Boston University, Boston, MA, United States
- 3Department of Anatomy & Neurobiology, Boston University School of Medicine, Boston, MA, United States
- 4Center for Systems Neuroscience, Boston University, Boston, MA, United States
- 5Graduate Program for Neuroscience, Boston University, Boston, MA, United States
- 6Computational Neuroscience and Vision Laboratory, Department of Psychological and Brain Sciences, Boston University, Boston, MA, United States
Introduction: The strength of certain visual illusions, including contrast-contrast and apparent motion, is weakened in individuals with schizophrenia. Such phenomena have been interpreted as the impaired integration of inhibitory and excitatory neural responses, and impaired top–down feedback mechanisms.
Methods: To investigate whether and how these factors influence the perceived contrast-contrast and apparent motion illusions in individuals with schizophrenia, we propose a two-layer network, with top-down feedback from layer 2 to layer 1 that can model visual receptive fields (RFs) and their inhibitory and excitatory subfields.
Results: Our neural model suggests that illusion perception changes in individuals with schizophrenia can be influenced by altered top-down mechanisms and the organization of the on-center off-surround receptive fields. Alteration of the RF inhibitory surround and/or the excitatory center can replicate the difference of illusion precepts between individuals with schizophrenia within certain clinical states and normal controls. The results show that the simulated top-down feedback modulation enlarges the difference of the model illusion representations, replicating the difference between the two groups.
Discussion: We propose that the heterogeneity of visual and in general sensory processing in certain clinical states of schizophrenia can be largely explained by the degree of top-down feedback reduction, emphasizing the critical role of top-down feedback in illusion perception, and to a lesser extent on the imbalance of excitation/inhibition. Our neural model provides a mechanistic explanation for the modulated visual percepts of contrast-contrast and apparent motion in schizophrenia with findings that can explain a broad range of visual perceptual observations in previous studies. The two-layer motif of the current model provides a general framework that can be tailored to investigate subcortico-cortical (such as thalamocortical) and cortico-cortical networks, bridging neurobiological changes in schizophrenia and perceptual processing.
1. Introduction
Individuals with schizophrenia at certain clinical states are less susceptible to some visual illusions, such as the contrast–contrast and apparent motion illusions (1–4). Lower susceptibility to these illusions could be due to abnormalities in low level integration mechanisms that synthesize inhibitory and excitatory responses of local neurons within primary visual cortex (V1), but also to atypical high-level processes, including reduced top-down influence in perception (5–8). However, it is not clear how these factors mechanistically influence the perception of illusions. Development of a neural model, which includes inhibitory and excitatory subfields of receptors, and top-down feedback can provide a platform to characterize functional neural responses based on the visual illusion context, and therefore, can address the challenge of characterizing the impact of each of these three factors on the perception of certain illusions. Besides schizophrenia, changes of susceptibility for certain illusions have been considered to investigate neural processing in other disorders, such as autism spectrum disorder (ASD) (9), where neural modeling has been a useful approach to connect underlying neural mechanisms with neurophysiological and perceptual outcomes (10, 11).
It has been shown that people with chronic paranoid schizophrenia are less susceptible to the contrast-contrast illusion (12), in which a patch surrounded by a high-contrast background is perceived to have lower contrast than in isolation (13). It was suggested that this illusion is influenced by contextual surround suppression inhibition (14). Using a similar approach, Barch et al. (15) found that the magnitude of the group difference effect size (control vs. schizophrenia) was significant but smaller compared with that reported in the Dakin study. Further analysis suggested that the two studies involved different patient populations; Barch et al. (15) recruited highly functioning, asymptomatic outpatients and outpatients with impaired attentional mechanisms whereas, Dakin et al. (12) used inpatients with paranoid schizophrenia, likely more severely affected by the disorder. Therefore, some variation in reported findings despite using similar visual illusion could stem from the heterogeneity of symptoms and their severity in patients with schizophrenia, likely reflected in visual perception differences.
Similarly, individuals with schizophrenia have been shown to be less susceptible to apparent motion illusion, in which a pair of separated and alternatively flashing stimuli is perceived as one single moving object (16), likely due to top-down expectations (17). Moreover, neurophysiological evidence supports the role of reduced top–down modulation in decreased susceptibility to hollow-mask illusion in schizophrenia (18–20). Based on these findings, it was proposed that the formation of priors (expectations) may affect the top-down process and that the weakened top-down modulation in individuals with schizophrenia can be due to abnormal priors. In another study, Kaliuzhna et al. (21), used a different set of visual illusions, and found no evidence for altered formation of priors in schizophrenia. Therefore, tasking patients in experiments with different visual stimuli can lead to variations in reported findings much like the heterogeneity of symptoms and their severity in patients with schizophrenia. In this regard, even subtle stimuli differences can generate performance variability. For example, Choung et al. (22) have shown that the same groups of normal observers and patients with schizophrenia have variable performance in flanker crowding of vernier stimulus depending on the flankers configuration and stimuli duration.
Given the above broad range of findings, based on variable, often incongruent evidence, a question that needs to be addressed is whether contextual modulation can be a critical factor in reduced illusion susceptibility in schizophrenia. Similarly, what is the role of the top-down feedback in early vision in schizophrenia? We used computational modeling to address these questions by developing a two-layer neural model that can simulate contextual modulation and top-down feedback, in order to probe certain visual illusion representations in individuals with schizophrenia compared with healthy controls. The two-layer neural model we constructed includes both lateral connectivity and top-down feedback, and therefore supports the investigation of contextual functional interactions. We demonstrate the usefulness of the two-layer neural model in investigating visual processes using two visual illusions, one static (contrast-contrast), and the other dynamic (apparent motion). By considering the model representations of both static and dynamic visual illusions, we can probe the functional interactions between bottom up, top down, and lateral network connectivity patterns.
2. Materials and methods
2.1. Model circuit
We developed a two-layer neural model that provides a motif to investigate functional interactions between two hierarchically interconnected brain regions such as thalamic lateral geniculate nucleus (LGN) and primary visual cortex (V1), higher and lower visual cortices, and higher order association and primary cortical areas (Figure 1A). In this study, we primarily focus on modeling the visual processing of LGN and V1. However, the emergent properties of the two-layer motif are also applicable to other pairs of interconnected lower and higher visual areas. We can also consider the motif as a unit for feedforward-feedback organization in cortico-cortical or cortico-subcortical communications.
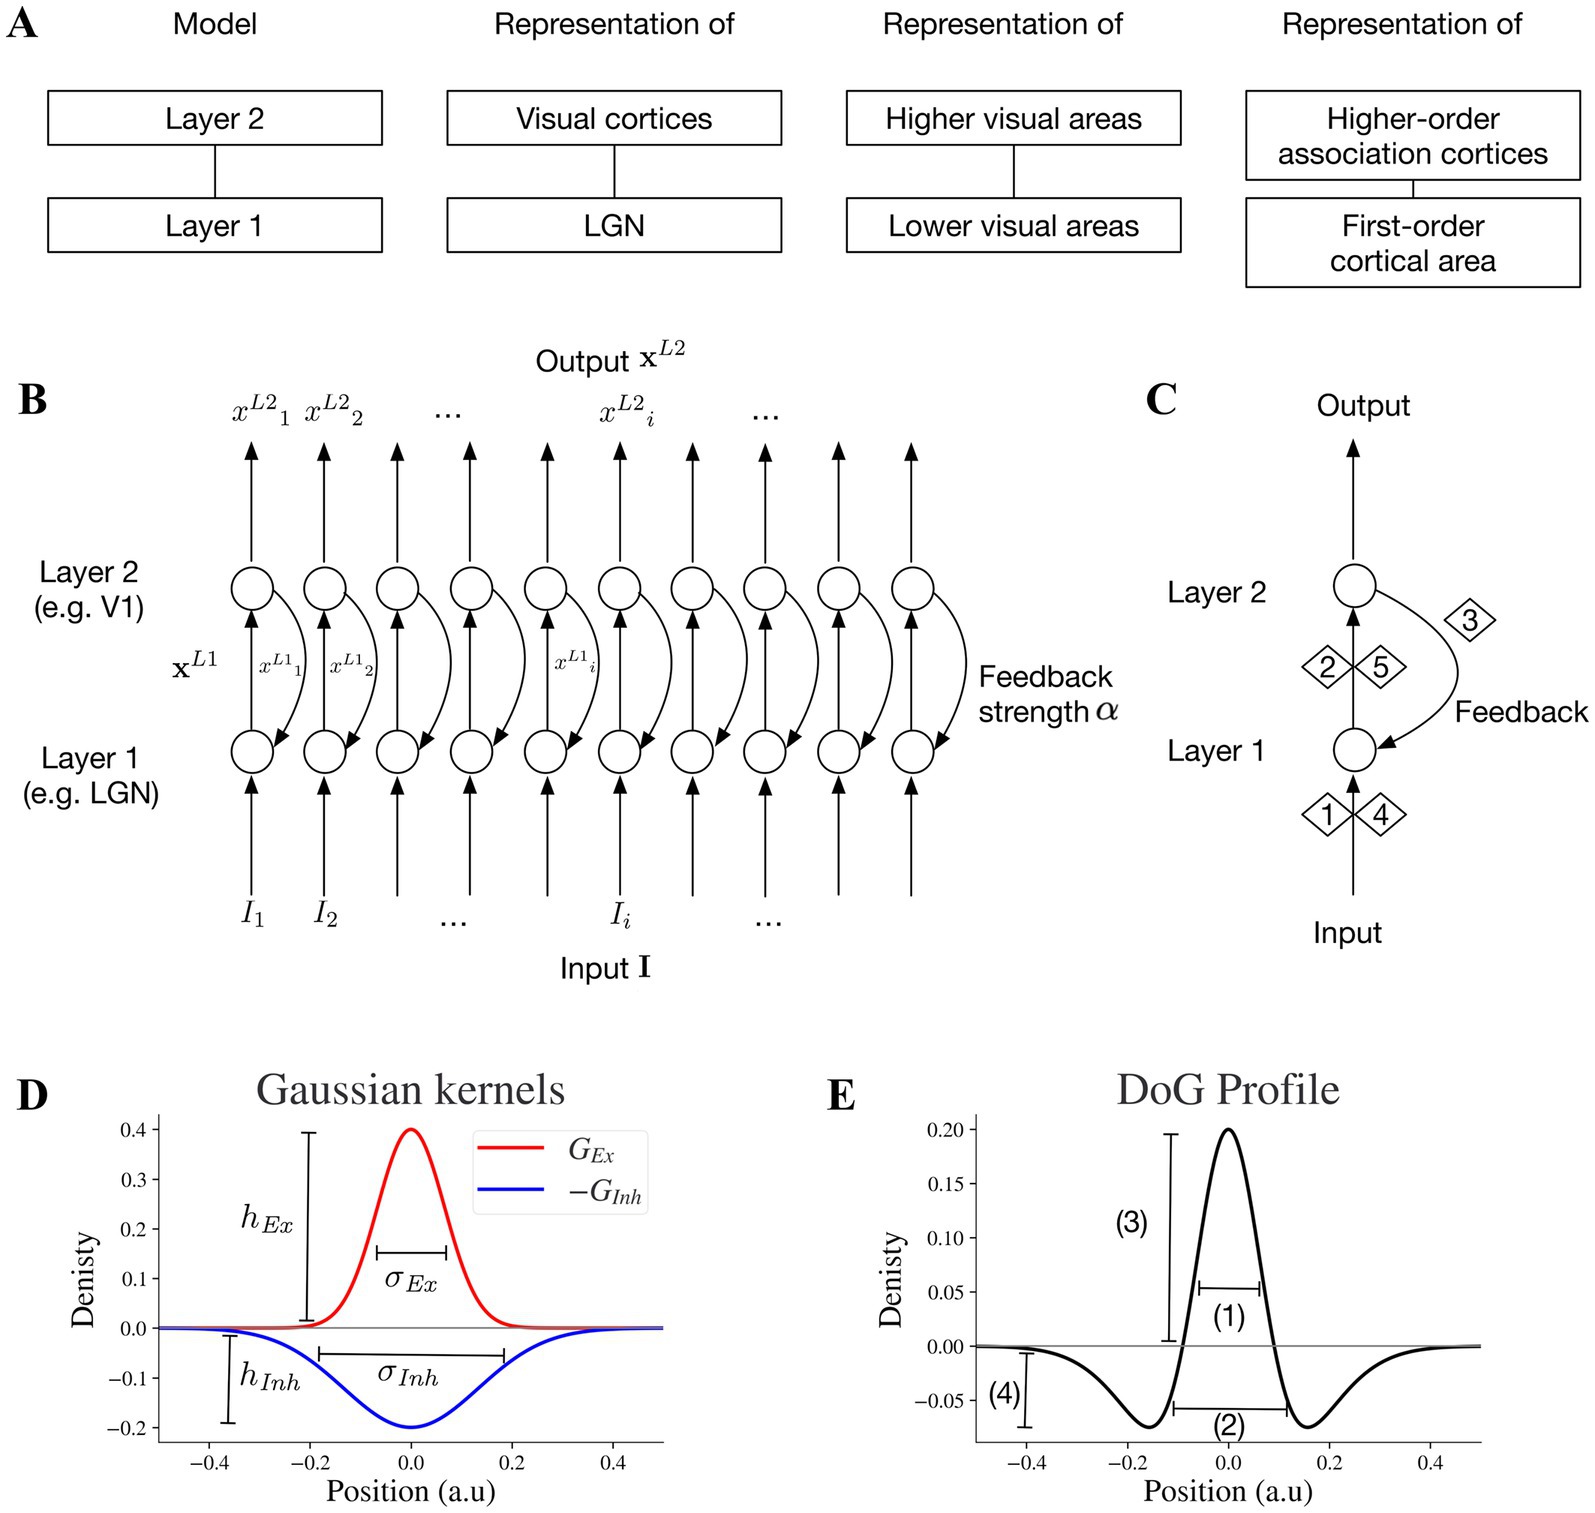
Figure 1. Key specifications and circuitry of the two-layer model. (A) The two-layer model can be considered a general motif applicable to pairs of interconnected subcortical or lower-cortical and higher-order cortical areas. (B) Two-layer network model: the full array of the two-layer network with feedforward and feedback mechanisms. (C) Stages 1,2,4 and 5 are feedforward and stage 3 is feedback. Stage 1 is exposing neurons at layer 1 to input I which generates a feedforward output. In stage 2, the output xL1 of layer 1 is the input for layer 2. Stage 4 is the next round of stage 1 with the presence of feedback signal to layer 1, and stage 5 is the next round of stage 2 within the feedforward feedback loop. (D) An excitatory kernel GEx and an inhibitory kernel GInh. The widths of excitatory and inhibitory subfields depend on their sigma values σEx and σInh, and the amplitudes of excitatory and inhibitory kernels are hEx and hInh, respectively. (E) Excitatory and inhibitory subfields of model neurons. The baseline positions on the x-axis will be converted to different pixel ranges in simulated visual illusions accordingly. Baseline DoG profile which reflects the spatial spread of the excitatory and inhibitory subfields of the simulated receptive field. The excitatory and inhibitory subfields are modeled by excitatory and inhibitory Gaussian kernels (GEx, GInh) respectively. 1 reflects the width of excitatory on-center, 2 negative off-surround, 3 peak of on-center, and 4 trough of off-surround.
The two-layer motif of our neural model is illustrated in Figure 1B. The output of the neurons in layer 2 is the result of 5 stages (Figure 1C). In stage 1, layer 1 receives the stimulus input and generates its output, which in turn forwards to layer 2 in stage 2. In stage 3, layer 2 feeds back to layer 1. Stage 4 is similar to the feedforward process as stage 1 but takes both the stimulus and the feedback information from stage 3 as the input. Stage 5 is similar to stage 2 and the whole process continues within a feedforward-feedback loop.
For each layer, the dynamics of neural activities x over time t is formulated within a shunting equation:
in which x is the 1D array (vector) of neural activities, A is the decay rate, B is the upper limit of x, C is lower limit of x, and I is the input array and implemented as a vector (similar to x). The symbol ° denotes element-wise product and the symbol ⊛ denotes convolution. Here the convolution takes weighted sum of the input neighborhoods based on the excitatory and inhibitory receptive subfields as inputs to the model neuron array.
G Ex and G Inh are discretized excitatory and inhibitory Gaussian kernels serving as the excitatory and inhibitory receptive field subfields (i.e., G Ex = G(hEx,σEx)/B, G Inh = G(hInh,σInh)/C, where G(h,σ) is a vector that discretizes a Gaussian kernel g(k;h,σ)). A Gaussian kernel is formulated as:
where k is the position, h represents the amplitude of the peak, and σ represents the width of the kernel. The peak amplitude (h) and the width of the kernel (σ) can be adjusted independently. The excitatory subfield GEx is formulated as:
where hEx is the peak amplitude of the excitatory kernel and σEx is the excitatory sigma (Figure 1D).
Similarly, the inhibitory subfield is formulated as.
where hInh is the peak amplitude of the inhibitory kernel and σInh is the inhibitory sigma (Figure 1D).
The Gaussian kernel.
is on the basis of a probability density function φ(k; 0,σ) of a normal PDF with mean 0 and standard deviation σ:
Equation 5 enables keeping the peak amplitude (h) fixed when changing the width of the kernel (σ) and vice versa (5, 23).
Modifying the shape of Difference of Gaussian (DoG) for receptive fields (see section 2.2) by independent adjustment of hEx, hInh, σEx and σInh is possible with the above formulation (Eqs 3,4) and implemented throughout the Results section.
In layer 2, neural activities array is xL2 with input array from xL1, where xL1 is the output of layer 1 and xL2 is the output of layer 2. The feedforward computation for stage 2/5 (Figure 1C) follows:
After one round of feedforward-feedback loop, the input to layer 1 is I + αxL2, where I is the stimulus (i.e., illusion) input, and the parameter α indicates the connection strength from layer 2 to layer 1 or feedback strength. Larger α indicates larger feedback, while smaller α indicates less feedback. At the start of the first sweep of feedforward signals before feedback signal emergence, xL2 = 0 at stage 1 without feedback from layer 2. On the other hand, at stage 4 and beyond, when the response from layer 2 is not zero anymore and feeds backs to layer 1, the layer 1 equation is:
Model parameters are listed in Table 1. Parameter α in Eq. 8 determines the feedback strength from model layer 2 to 1. For model excitatory and inhibitory subfields of receptive fields, parameters hEx and hInh determine peak values of GEx and GInh, and σEx and σInh determine the widths of GEx and G Inh , respectively, (Figure 1D). We investigate how the changes of these parameters affect the model representation of contrast-contrast and AM illusions.
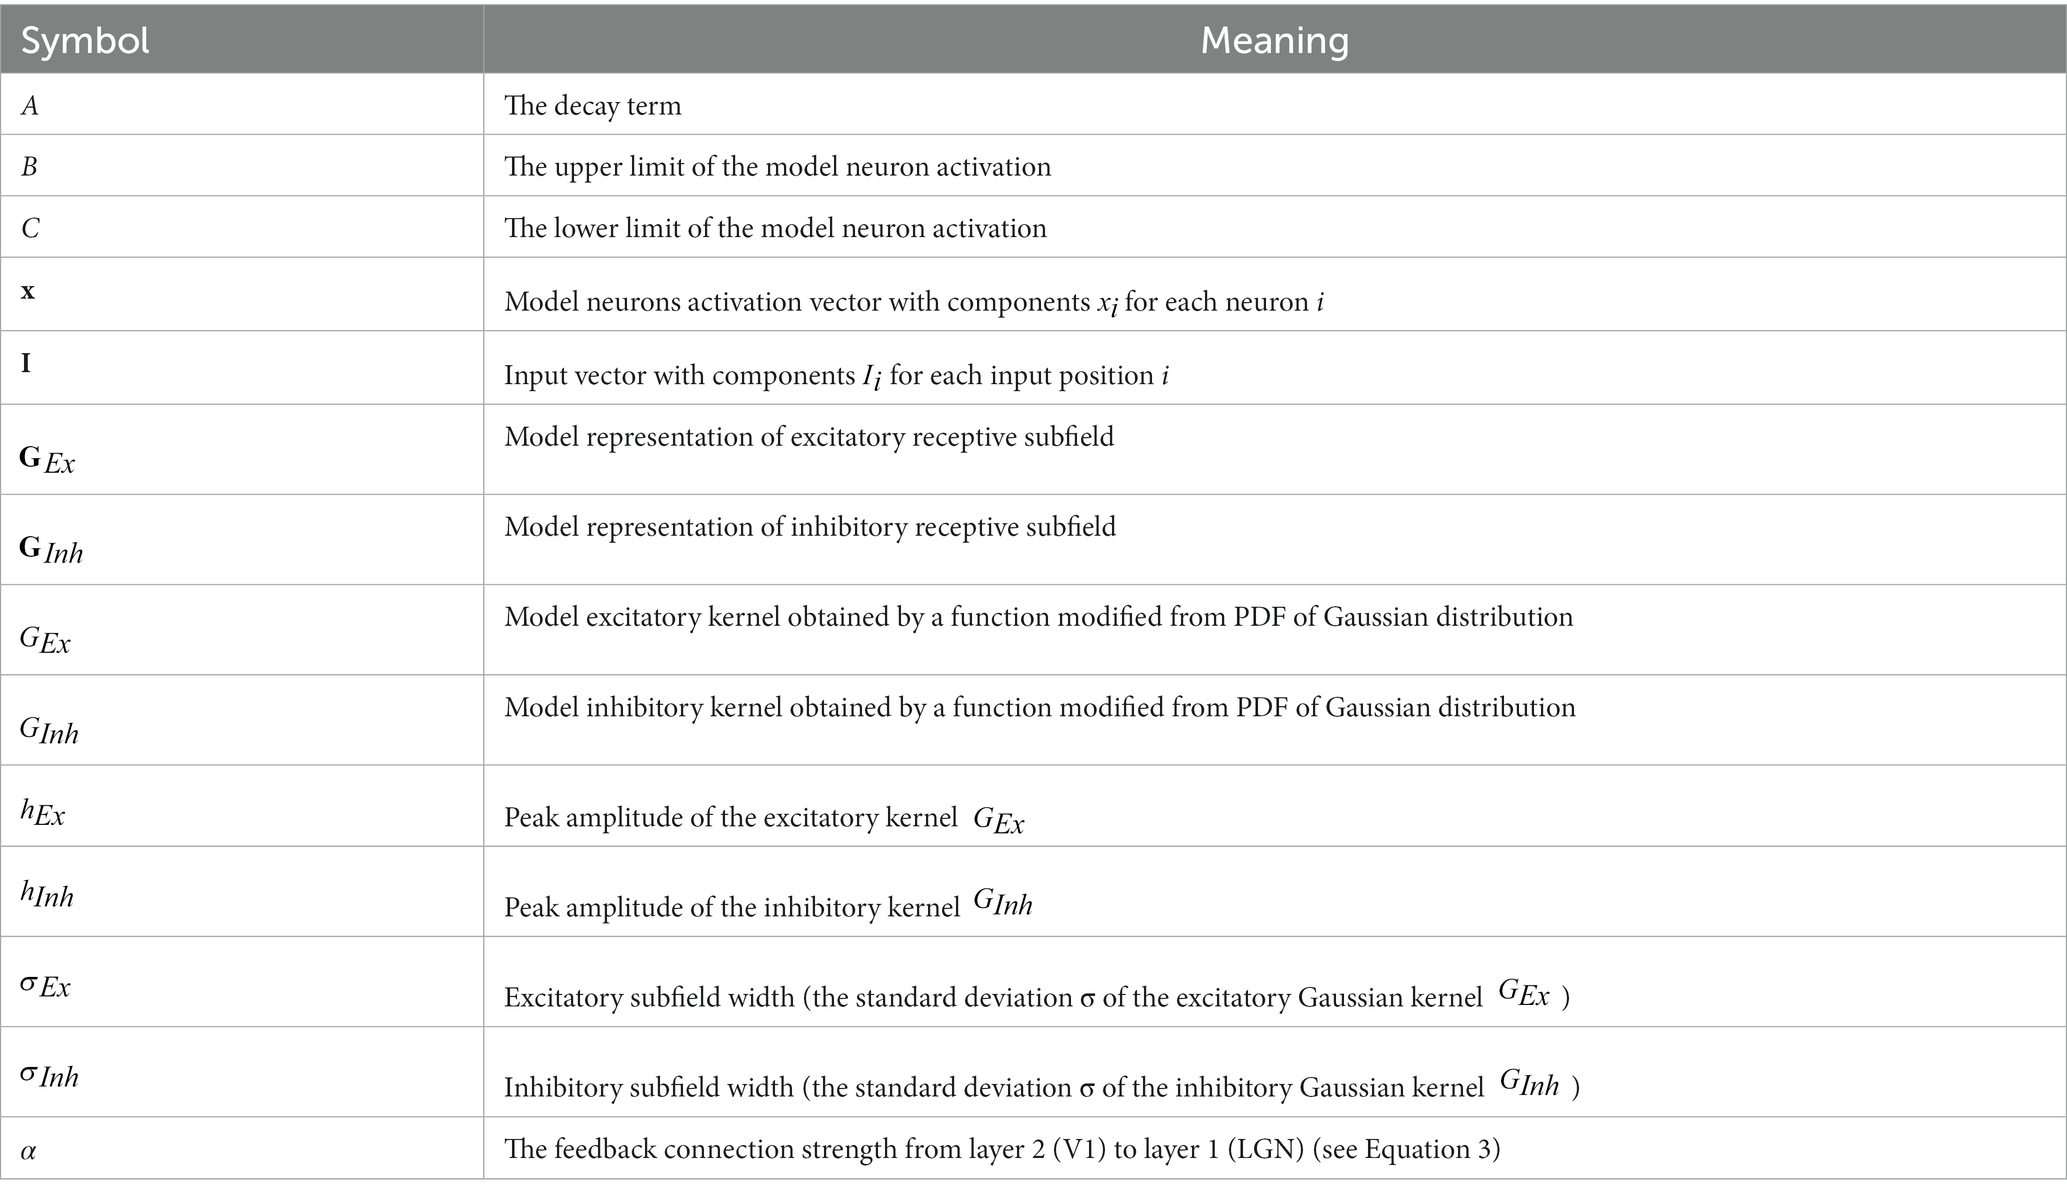
Table 1. Abbreviations of symbols used in equations.
2.2. Receptive field
In early stage of visual processing, lateral geniculate nucleus (LGN) neurons respond antagonistically to light in the center and the surround of their receptive fields. Neurons in primary visual cortex (V1) also have oriented on–off center-surround properties (24). Thus, the receptive field of LGN and primary visual cortex (V1) neurons can be approximated by difference of Gaussian (DoG) kernels in neural models (4, 5, 23, 25, 26).
The DoG can be obtained by subtracting a Gaussian with a larger standard deviation from a Gaussian with a smaller standard deviation. The Gaussian with smaller standard deviation, as an excitatory kernel GEx, can approximate the on-center of the receptive field (excitatory subfield), whereas the Gaussian with larger standard deviation, as an inhibitory kernel GInh, can approximate the off-surround of the receptive field (inhibitory subfield).
The widths of the positive on center and negative off surround and the peak and trough amplitudes of the DoG profile in Figure 1E depend on the excitatory and inhibitory kernels GEx and GInh in Figure 1D.
2.3. Simulating contrast-contrast illusion input for the neural model
The input to the neural model is in one dimension and presented as the vector I. The model neural response to such one-dimensional input can be characterized by vector x. Index i indicates the position of each neuron: the model takes the input stimulus with intensity Ii at the position i and generates the output response xi of the neuron i.
In order to investigate our model response to the contrast-contrast stimulus (Figure 2A), we simulated it as an input with a sinusoidal light/dark-gray pattern shown in top of the Figure 2B, the center of which had lower amplitude than the surround. The simulated 1D input of the contrast-contrast stimulus was a 1D slice from the contrast-contrast stimulus shown in Figure 2A; its central part had lower contrast than the surround. Although the physical contrast of the inner ringed patch was 40% in Figure 2A, the surround suppression made it appear less than 40% (12). However, individuals with schizophrenia, depending on the clinical state, are less susceptible to the illusion and have more accurate performance than healthy controls for perceiving the actual contrast of the surrounded patch.
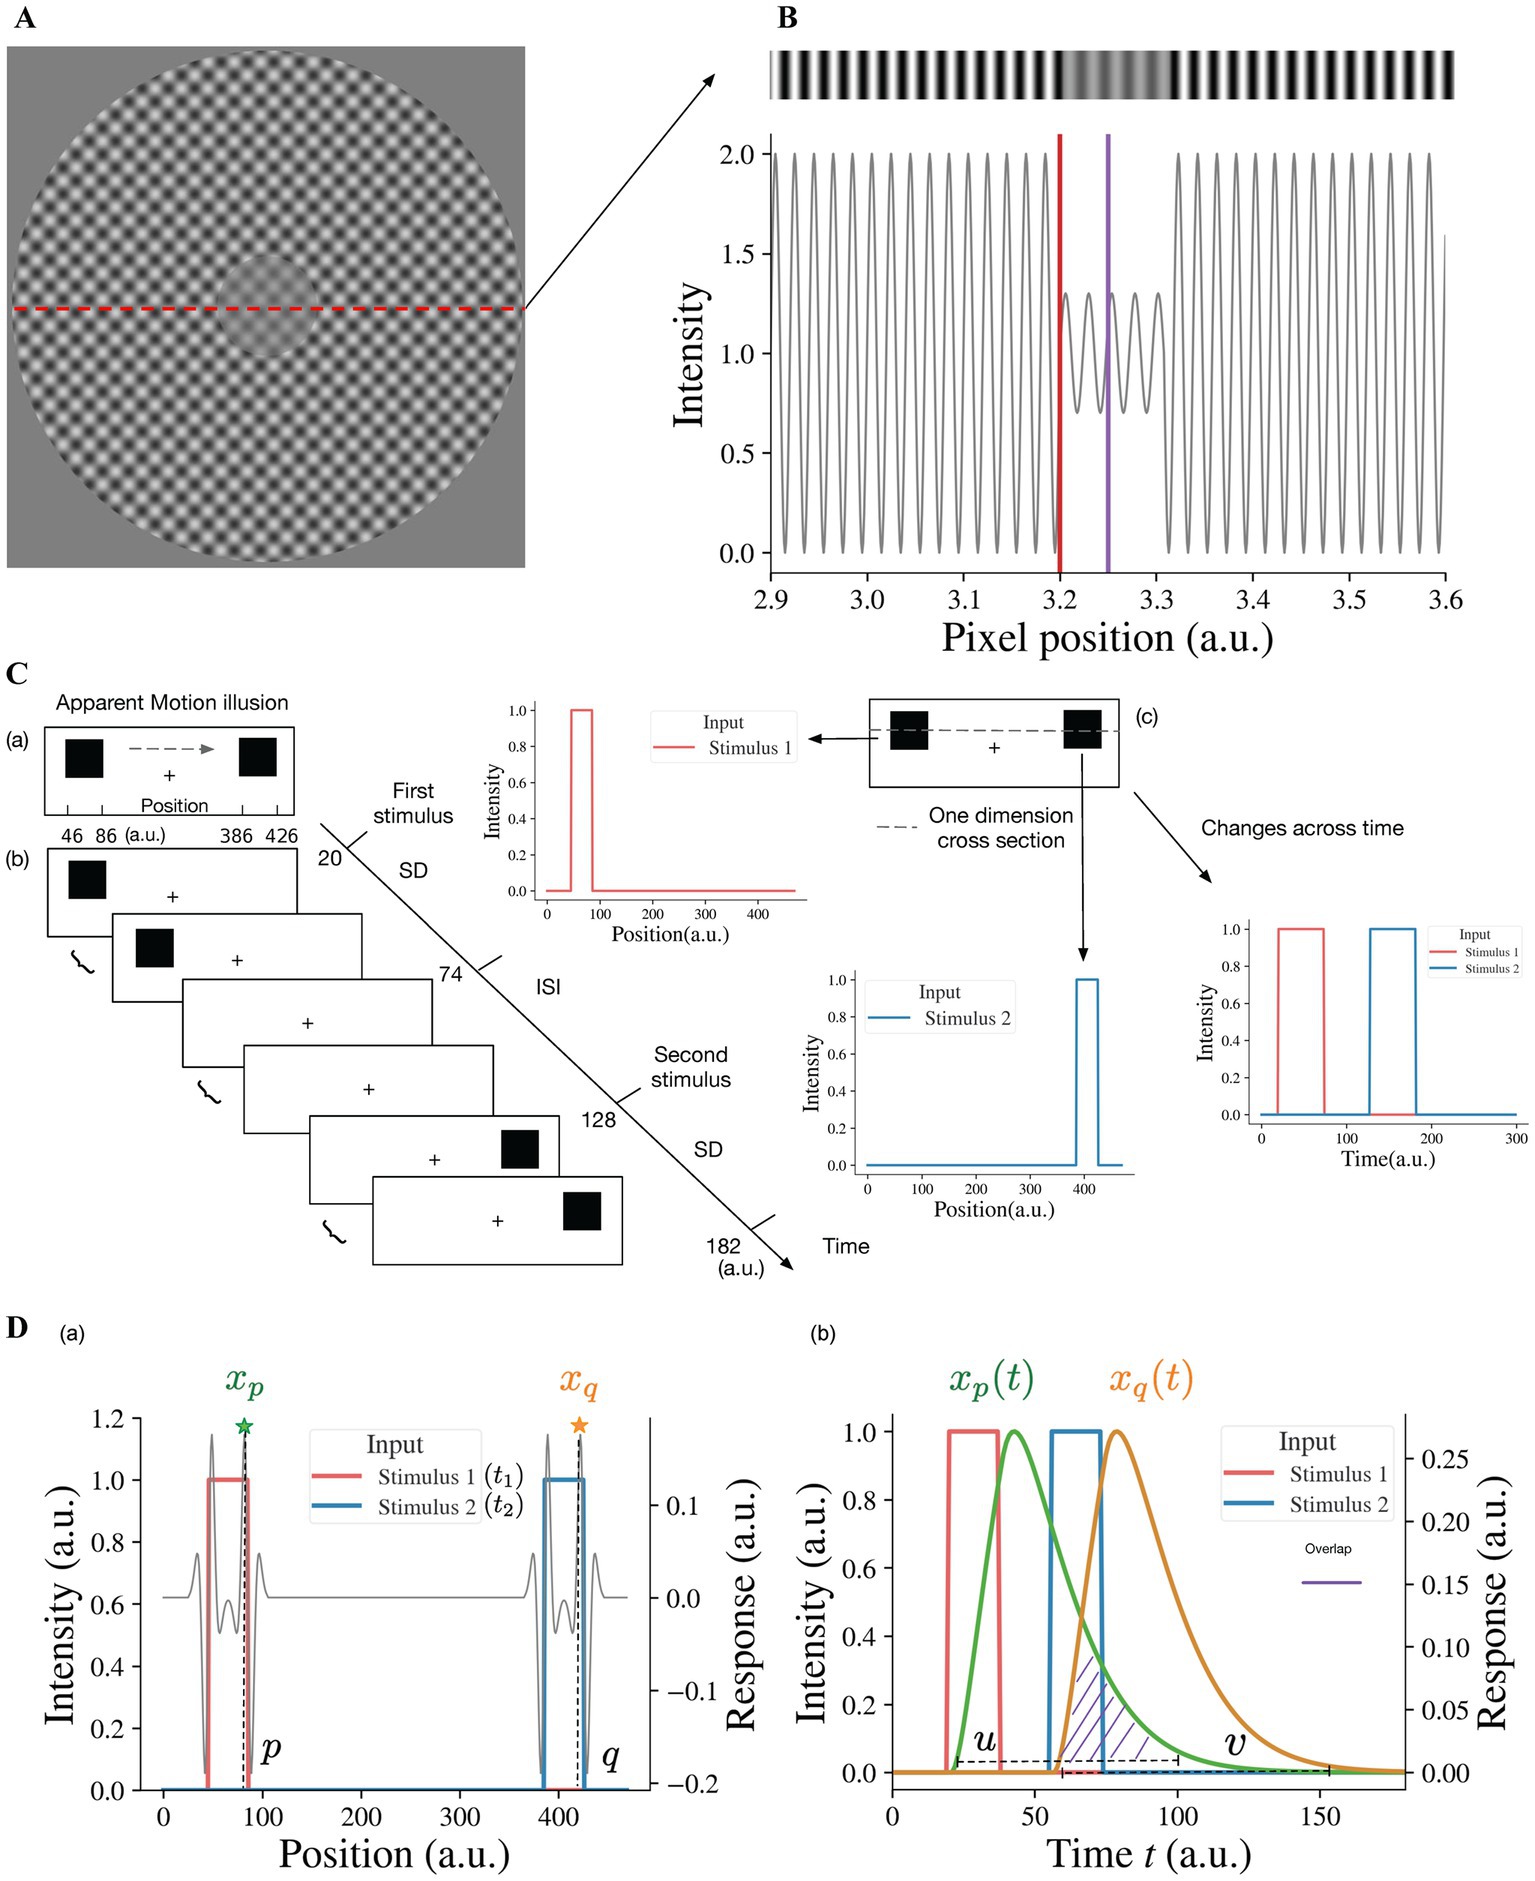
Figure 2. Illusion stimuli as inputs for the model. (A) Sinewave modulation-based contrast-contrast illusion. (B) We take a 1-dimensional (1D) slice from the image in (A) to simulate the input of the model as a 1D gray-scale image shown as a stripe on the top, which shows the visual appearance of the simulated stimulus having lower contrast of light–dark grays at the center, surrounded with higher contrast of light–dark grays. The plot under the gray-scale image is the simulated 1D input of the contrast-contrast stimulus for the neural model and shows the luminance modulation in the form of input intensity modulation across space. The red vertical line is at the left edge of low contrast patch at the middle of the stimulus and the purple vertical line is at the center of the low contrast patch. To avoid the edge effect around the boundaries of the simulated input, padding is applied. Here, the left boundary of this simulated input is located at position 2,900 (a.u.). (C) Apparent motion illusion stimulus as an input for the model. (a) Apparent motion (AM) is an illusion of movement created when two adjacent lights flash on and off in succession. (b) Spatial and temporal specification of the apparent motion input to the model. The inter stimulus interval (ISI) has the same duration as the stimulus duration (SD) of the first and the second stimuli. (c) For our model, we consider one dimensional cross-section of the AM stimulus. The first and second stimuli are both spatially and temporally separate, i.e., the first and second offset inputs (lights) flash alternatively (see the panels to the right cued by arrows). (D) The neural model response to the apparent motion stimulus and the model illusion representation quantification by the temporal overlap between the responses to the alternating flashes. (a) The superposition of model response profile to two stimuli, i.e., the spatial profile of the model response to the first stimulus at time t1, superimposed on the spatial profile of the response to the second stimulus at time t2 (t2 > t1, t2–t1 = ISI + SD). xp denotes the response at position p, which is the largest of responses near the right edge of the first stimulus, so does xq at position q of the second stimulus. (b) The changes of responses xp and xq over time. u is any time point in the time range during which the response xp > 0. v is any time point in the time range during which the response xq > 0. When u is bigger than v, there is overlap (purple shaded area) between the two response curves. We consider the overlap between the response curve xp(t) and the response curve xq(t), which is the simultaneous occurrence of the two responses, as the continuity representation, i.e., apparent motion, by the model. To quantify the overlap, we consider the response curves xp(t) and xq(t) as two probability density functions after normalizing their surfaces to 1 (see Equation 9).
2.4. Model representation of contrast-contrast illusion
To estimate how the surround suppresses the inner contrast, we take the difference between the response to the surround and the response to the center area. A lager value of this difference means a stronger suppression from the surround. Specifically, the illusion representation of the model can be estimated quantitatively as the center-surround response difference, r = s1 − s2, s1 being the maximum value of xiL2 in the surround region (i.e., to the left of red line, I < 3,200 (a.u.)), in Figure 2B and s2 being the maximum value of the simulated responses xjL2 to the center area (i.e., around the purple line, 3,200 < j < 3,300 (a.u.)), in Figure 2B. A larger r indicates stronger illusion representation by the model and vice versa.
2.5. Simulating apparent motion illusion input for the neural model
Apparent motion (AM) is an illusion of movement perception when two or more adjacent lights flash on and off successively appearing as back and forth continuous motion between the two (or more) locations.
Multiple studies have shown that apparent motion is reduced in individuals with schizophrenia (16, 27). They tend to report less illusory motion than healthy controls under the same experiment setting.
Consistent with apparent motion stimulus, our simulated input to the model for apparent motion consists of two spatially separated stimuli Figure 2C(a). After the first stimulus appearance duration (Stimulus Duration (SD), Figure 2C(b)) the first stimulus disappears, and during interstimulus interval (ISI) there is no visual stimulus. Then the second stimulus appears for the same SD duration. The SDs for the first and second stimuli and ISI are the same. For instance, Figure 2C(b) shows that the first stimulus appears between 20 time-step (dt) and 74 time-step, and the second stimulus appears 54 time-steps after. The presentation duration for both stimuli is also 54 time-steps. The spatiotemporal input to the neural model is a vector I(t), whose element Ii(t) represents the value of input at position i at time t. The neural model response to the spatiotemporal input I(t) is a vector xL2(t), where element xiL2(t) is the response of neuron i in layer 2 at time t. The model takes the first stimulus Iζ(t1) at the position i = ζ at time instance t = t1 (i.e., first light flash at position ζ) and the second stimulus Iξ(t2) at the position i = ξ at time instance t = t2 with t2 − t1 = b, and generates the output response xiL2(t) of each neuron i at each time instance t; ξ–ζ is the distance between the two stimuli and b is SD + ISI, i.e., the time interval between the onsets of the two stimuli or stimulus onset asynchrony (SOA). For example, ξ–ζ = 340 and ζ is any value between 46 and 86 in Figure 2C(a), and b = 108 and t1 is any value between 20 and 74 in Figure 2C(b).
2.6. Model representation of apparent motion illusion perception
When the two alternating flashes are presented, the maximum responses are to the edges (Figure 2D(a)). The peak response to the right edge (at position p near 86 in Figure 2D(a) of the first stimulus is denoted as xp). The change of the peak response xp with time is denoted as xp(t) (see the green curve in Figure 2D(b)). Similarly, the change of the peak response xq (at position q near 426 in Figure 2D(a)) to the right edge of the second stimulus is denoted as xq(t). The overlap between the two responses is a representation of the continuity of model neural activities between alternating flashes, i.e., the model represents apparent motion (see the purple dashed area in Figure 2D(b)). The magnitude of overlap can be used as a quantitative measure of model representation of apparent motion.
To calculate the degree of overlap, we consider xp(t) and xq(t) as probability density functions (PDFs) after normalizing their surfaces to 1. Values u and v in Figure 2D(b) of the random variables U and V have xp(u)/c1 and xq(v)/c2 as their PDFs, where c1 and c2, used for normalization ( , ) are regarded as modeled representations of the first and second stimuli. The model representation of cross-flashes continuity is the overlap between xp(u) and xq(v), i.e., u > v (shaded area in Figure 2D(b)), which can be determined quantitively by the probability P(U > V), the probability of simultaneous occurrence of the responses to the first and second stimuli. This model representation, denoted by Φ, for AM illusion perception can be calculated with the convolution of the two probability density functions:
where ⊛ is again the convolution operation, which is defined as the integral of the product of the two functions after one is reversed and shifted (28). xp(u) is the neuron activity at the time instance t = u for the first stimulus at the position i = p, and xq(v) is the neuron activity at the time instance t = v for the second stimulus at the position i = q.
3. Results
By conducting a thorough parameter search, we investigated the impact of excitation/inhibition width and amplitude ratio changes as well as top-down feedback on the model representation of contrast-contrast and AM illusions. By comparing the existing perceptual data of individuals with schizophrenia with model representations of contrast-contrast and AM illusions, we estimated the range of excitation/inhibition imbalance and the changes of feedback level in the model that can replicate the visual percepts in schizophrenia. Therefore, the key parameter searches we considered were the feedback strength between two model layers and DoG parameters, which were widths and peak amplitudes of excitatory and inhibitory subfields.
When we changed the feedback strength, we kept the DoG profile ratios at the baseline shown in Figure 3, in which σEx/σInh = 1/2, and hEx/hInh = 2. When we changed the DoG parameters, we kept the feedback α at 0.3 and only changed the excitatory and inhibitory subfields in the model V1 (layer 2) by scaling the parameters from the baseline, while the receptive fields in model LGN (layer 1) remained unchanged. In AM simulation, the duration of each stimulus (SDs) was 75, 54, 41, 33, 24, 18, 15, 11, 9, and 6 (in time-steps, each time-step representing 4.44 ms), equivalent to presentation frequencies of 0.75, 1.04, 1.34, 1.7, 2.34, 3.12, 3.75, 4.69, 6.25, or 9.37 Hz, respectively (in a 4 × SD cycle). The selected frequencies are consistent with those in Sanders et al. (16). For the parameter search space tested below the model neural representation of contrast-contrast illusion is “r,” whereas “Φ” stands for the model neural representation of AM illusion.
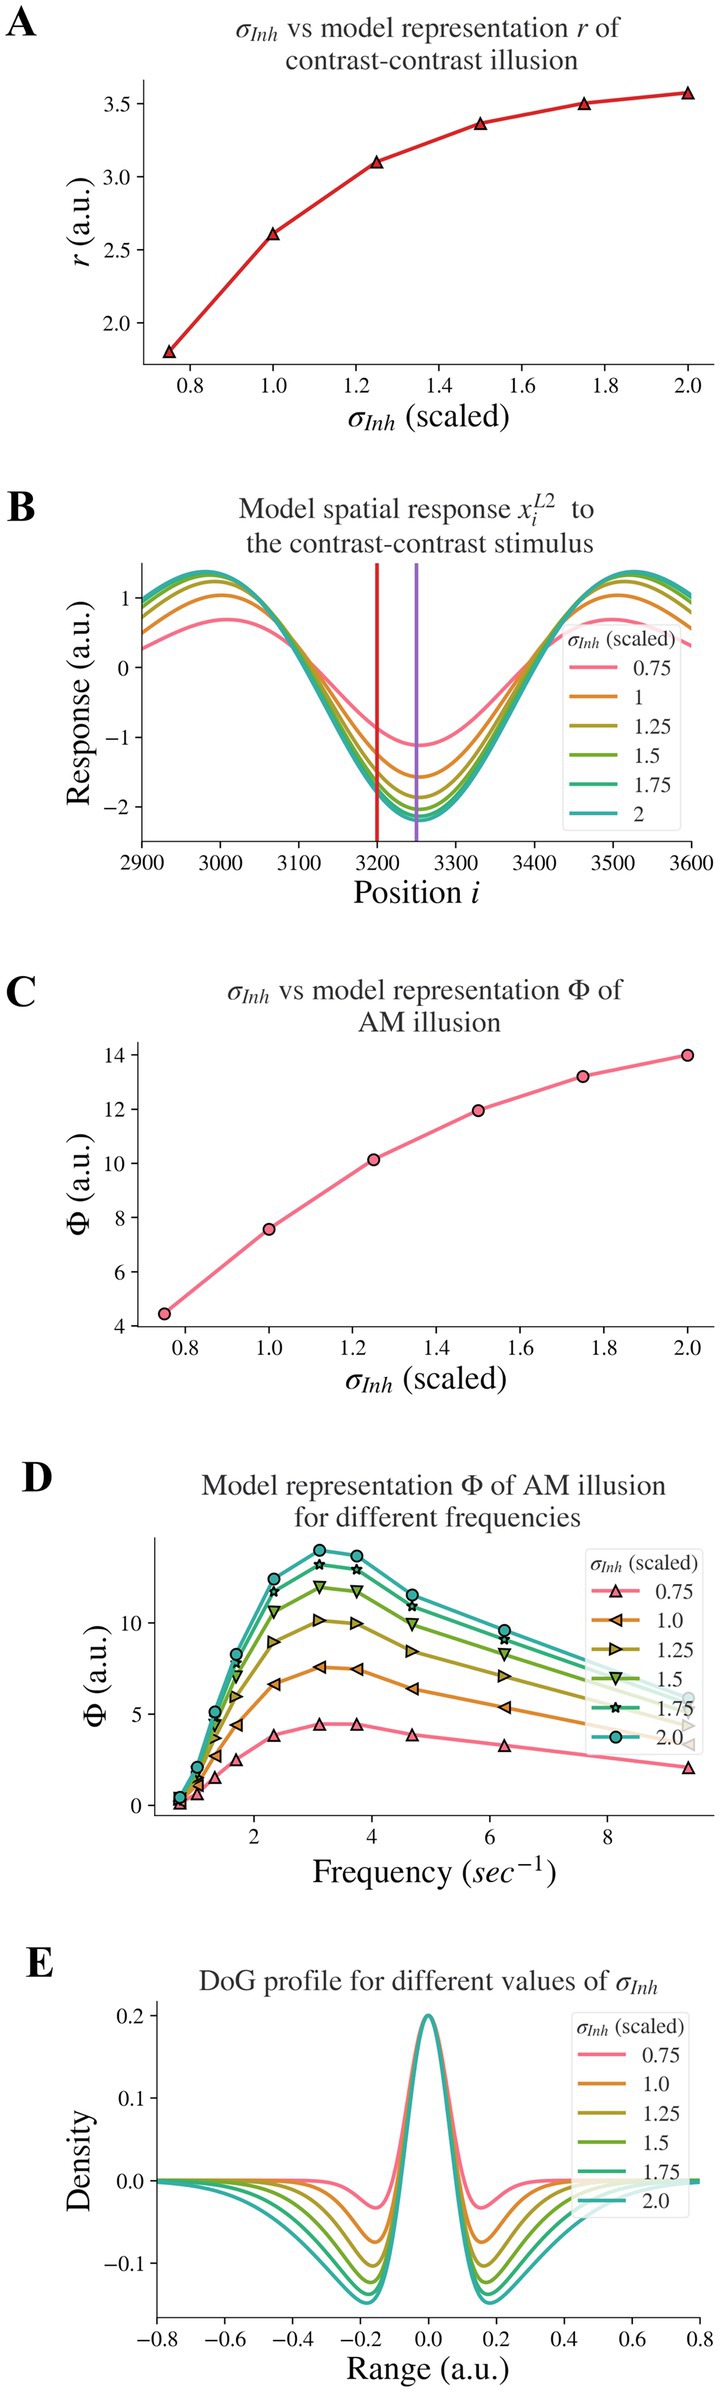
Figure 3. Model response following changes in σInh. The feedback α is fixed. (A) The neural representation for contrast-contrast illusion. (B) The model response profile to the contrast-contrast illusion stimulus for different σInh. The red vertical line is at the left edge of the lower contrast patch and the purple vertical line is at the center of the stimulus. (C) The model representation for AM against σInh. (D) The model representation of AM for different frequencies of flashing stimuli, each curve for different σInh. (E) The changes of the DoG profile with the changes of the inhibitory subfield (σInh) used here.
3.1. Changes to the inhibitory subfield width led to changes in representation of illusions
Reduced lateral inhibition within V1 in individuals with schizophrenia (7) is supported by findings of reduced GABA concentration in the visual cortex (29, 30). This is in line with reports of reduced inhibition in prefrontal cortices of individuals with schizophrenia (31). Dakin et al. (12) found reduced ‘contrast–contrast’ illusion in individuals with schizophrenia. We investigated whether reduced lateral inhibition caused reduced contrast-contrast illusion. Our results showed that it did: Decreasing the width σInh of the inhibitory subfield in our model led to a reduction of the model representation of contrast-contrast illusion.
We decreased the inhibitory width σInh systematically to model the reduction of the lateral inhibition. Figure 3A shows the representation (r) of contrast-contrast illusion for a range of σInh values; the scaled value of σInh = 1 is the same value used for the baseline σInh of the DoG profile (see Figure 1E). Each of the x-axis scaled values in Figure 3A is the ratio of a σInh value to the baseline value of σInh, showing the key finding that the model representation r of contrast-contrast illusion decreased as the inhibitory width σInh decreased. Each value of the model representation r in Figure 3A is the difference between the peak and trough response profile in Figure 3B. Figure 3B shows the model response profile xiL2 to the contrast-contrast stimulus at each position i under systematic change of σInh. The response profiles with the largest, least, and baseline values of σInh are shown in green, pink, and orange, respectively. Each data point in Figure 3A represents the value of r calculated from the corresponding model response profile in Figure 3B, to illustrate the impact of lateral inhibition (σInh) on the model representation (r) of contrast-contrast illusion.
Sanders et al. (16) showed that individuals with schizophrenia have impaired AM illusion. Here, we also investigated whether reduced lateral inhibition could lead to reduced AM illusion, and we found that decreasing the inhibitory width σInh in the model also led to reduction of model representation of AM illusion. Figure 3C shows the model representation (Φ, see Eq. 9) of AM illusion for different values of the inhibitory width σInh: The model representation Φ of AM illusion decreased as the inhibitory width σInh became smaller. Each value of Φ in Figure 3C is the peak value of its corresponding frequency profile in Figure 3D. Figure 3D shows the model representation Φ of AM illusion for different frequencies of the AM stimulus, with each plot for a different value of the inhibitory width σInh. Each plot reached its peak (i.e., the simulated peak representation of AM illusion) around the same frequency (3.12 Hz). This frequency is consistent with the AM frequency in visual experiments yielding peak AM perception (16). With a narrower inhibitory subfield (smaller σInh), the peak drifts to a lower value of the model representation of AM illusion. All the peak values in Figure 3D are plotted in Figure 3C, which shows the peak representation of AM illusion against the inhibitory width σInh.
Moreover, decreasing the inhibitory width σInh in our model led to a decrease of the inhibitory subfield (or lateral inhibition). Figure 3E shows the change of the DoG profile under systematic change of σInh. The width of the negative surround shrank as the value of σInh decreased. The pink DoG profile with a smaller σInh showed a narrower inhibition surround than the green DoG profile with a bigger σInh. Furthermore, the trough amplitude of the DoG profile decreased as the inhibitory width σInh decreased. These changes are consistent with Anderson et al. (5), where researchers used fMRI and population receptive field (pRF) mapping methods to infer properties of visually responsive neurons in individuals with schizophrenia and found that the inhibitory sigma in V1 is significantly smaller in individuals with schizophrenia than in healthy controls. The inter-trough width becomes smaller compared to the DoG profile of V1 in healthy controls (see Figure 4 in Anderson et al. (5)). Our results above support the idea that impaired lateral inhibition in V1 would cause reduced contrast-contrast and AM illusions.
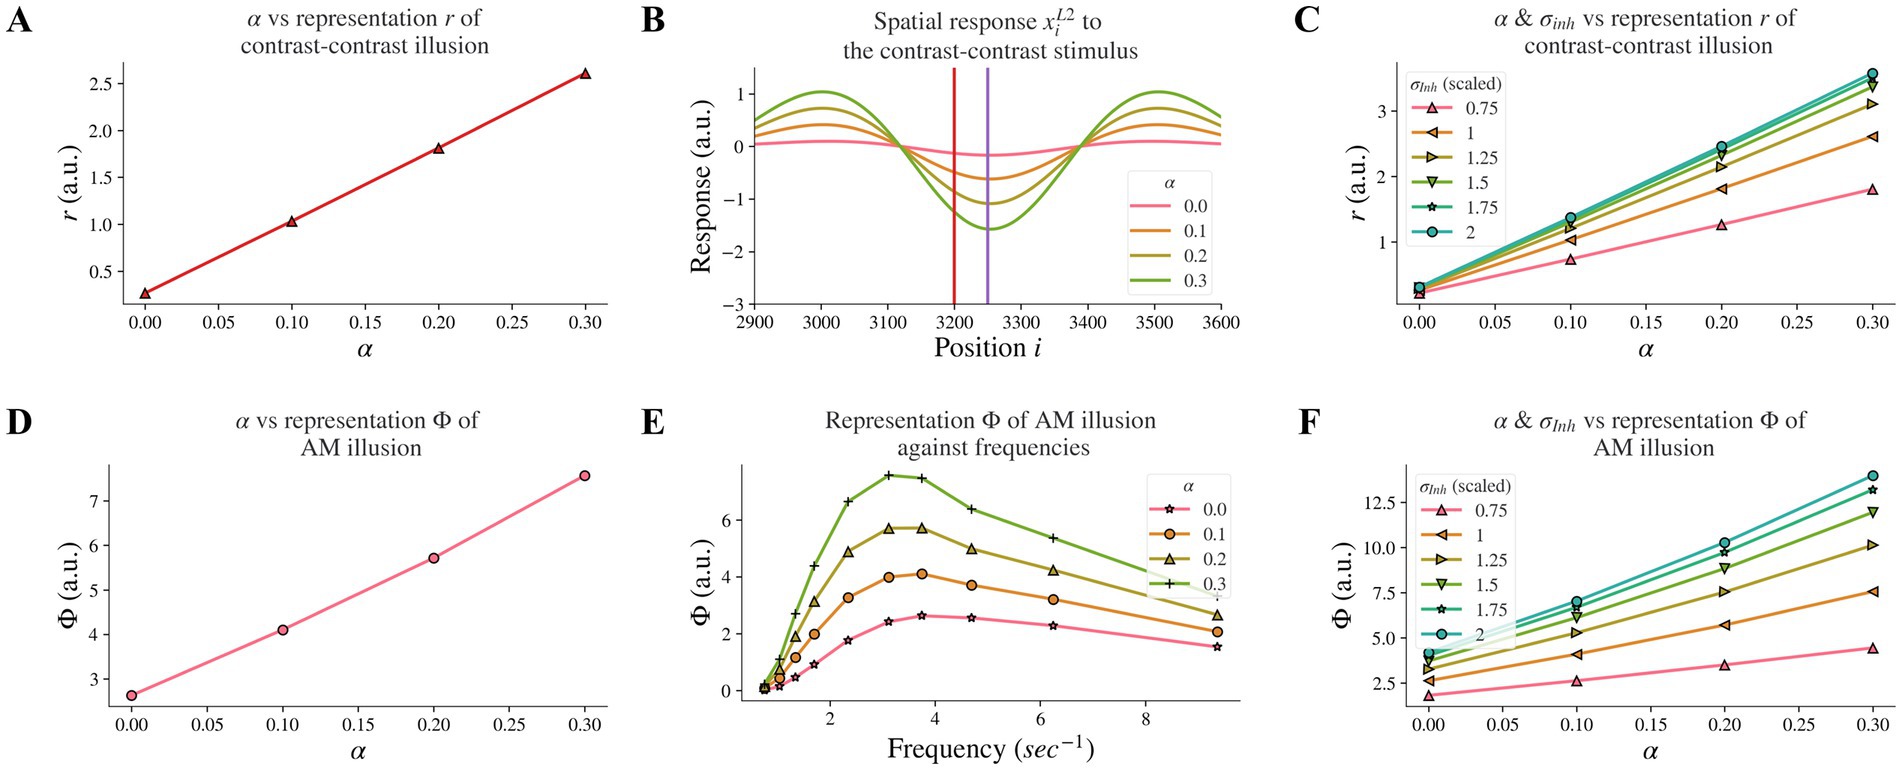
Figure 4. Model responses after changes in feedback strength α and combined effects following concurrent changes in σInh. (A) The neural representation for contrast-contrast illusion for different α. (B) The model response profile to the contrast-contrast illusion stimulus for different α. The red vertical line is at the left edge of the lower contrast patch and the purple vertical line is at the center of the stimulus. (C) Combined effects of concurrent changes: The model representation for contrast-contrast illusion for different combinations of feedback strength α and the width of the inhibitory subfield σInh. (D) The model representation of AM for different feedback α. (E) The model representations of AM for different combinations of frequencies of two appearing stimuli and α. (F) Combined effects of concurrent changes: The model representation of AM for combinations of α and σInh.
3.2. Weaker feedback strength, led to reduced illusion representation
Individuals with schizophrenia exhibit impaired top-down feedback in visual processing (6, 32). In our model, we simulated top-down information flow by controlling the connectivity strength between layers and investigated whether reduced top-down feedback led to reduced contrast-contrast illusion. Our computational model revealed that decreasing the strength α of the top-down feedback from layer 2 to layer 1 led to a reduction of model representation of contrast-contrast illusion. Figure 4A shows the model representation r of contrast-contrast illusion for different values of the top-down feedback strength α; each data point represents the value r from its corresponding plot in Figure 4B, indicating the key finding that the model representation r decreased as the value of α decreased. Figure 4B shows the model response profile xiL2 to the contrast-contrast stimulus at each position i for different α values.
We also investigated whether reduced top-down feedback could influence the contrast-contrast illusion representation in a similar or different manner compared to the reduction of the inhibitory subfield width. Our comparison of concurrent changes in feedback and inhibitory width subfield revealed characteristic differences. The model representation r of contrast-contrast illusion was also reduced as the feedback strength α and the width σInh of the inhibitory subfield decreased simultaneously (Figure 4C). It can be observed that the slopes in cool colors (e.g., green) were closer to each other than slopes in warm colors (e.g., pink and orange). This shows that the increment of the model representation r became smaller as σInh increased, while the model representation r increased linearly as the feedback α increased.
Moreover, reduced top-down feedback led to reduced AM illusion. In Figure 4D, we can see the model representation Φ of AM illusion for different values of α. Figure 4D presents the peak value of each curve in Figure 4E, where each curve with a different value of α shows the model representation Φ of AM illusion for different frequencies. The model representation Φ of AM illusion went up and down with different frequencies in a way that is consistent with the perceptual data in Sanders et al. (16). The peak was lower with a smaller V1 feedback strength α and it occurred around the frequency at 3.12 Hz in both our results and the perceptual data. Similar to the results we obtained after decreasing the σInh, reducing feedback strength α could also replicate the perceptual results in Sanders et al. (16).
When changing the feedback strength α and the inhibitory width σInh simultaneously, the model representation of AM illusion had similar trends as that of contrast-contrast illusion. Figure 4F shows that σInh had a non-linear influence on the model representation Φ while α had a linear influence.
All the above results suggest that the disrupted top-down feedback from model layer 2 to layer 1 is also a factor that could underlie the weaker perception of the contrast-contrast and AM illusions in individuals with schizophrenia, but with a different magnitude of impact compared to the disruption in the width of the inhibitory subfield.
3.3. Changes in the width of the excitatory subfield had variable impact on illusion representation
Changes in excitation, in particular increases in activity of excitatory neurons, have been associated with schizophrenia. Increases in activity of excitatory neurons in schizophrenia can come about due to decreased excitatory drive on fast-spiking cortical inhibitory interneurons (33), or an overactive dopaminergic system (8, 34, 35). However, there is little evidence showing how changes in excitatory drive through decreased inhibition or excess dopamine can influence visual receptive fields. To test the hypothesis that an enlarged excitatory subfield could reflect changes in excitation, we investigated whether increasing the excitatory subfield width would reduce contrast-contrast illusion. We found that this was dependent on whether the excitatory subfield width was large or small.
By increasing the width σEx of the excitatory subfield in the range of larger values (here 0.75–1.5) in the model, we observed a reduction of the model representation r of contrast-contrast illusion (see the right panel in Figure 5A). Figure 5B shows the model response profile xiL2 to the contrast-contrast stimulus at each position i under systematic change of the σEx in the range of larger values. However, an opposite trend was observed when the excitatory width σEx was in the range of smaller values (0.25–0.75). Increasing the smaller σEx increased the model representation r of contrast-contrast illusion (see the left panel in Figure 5A).
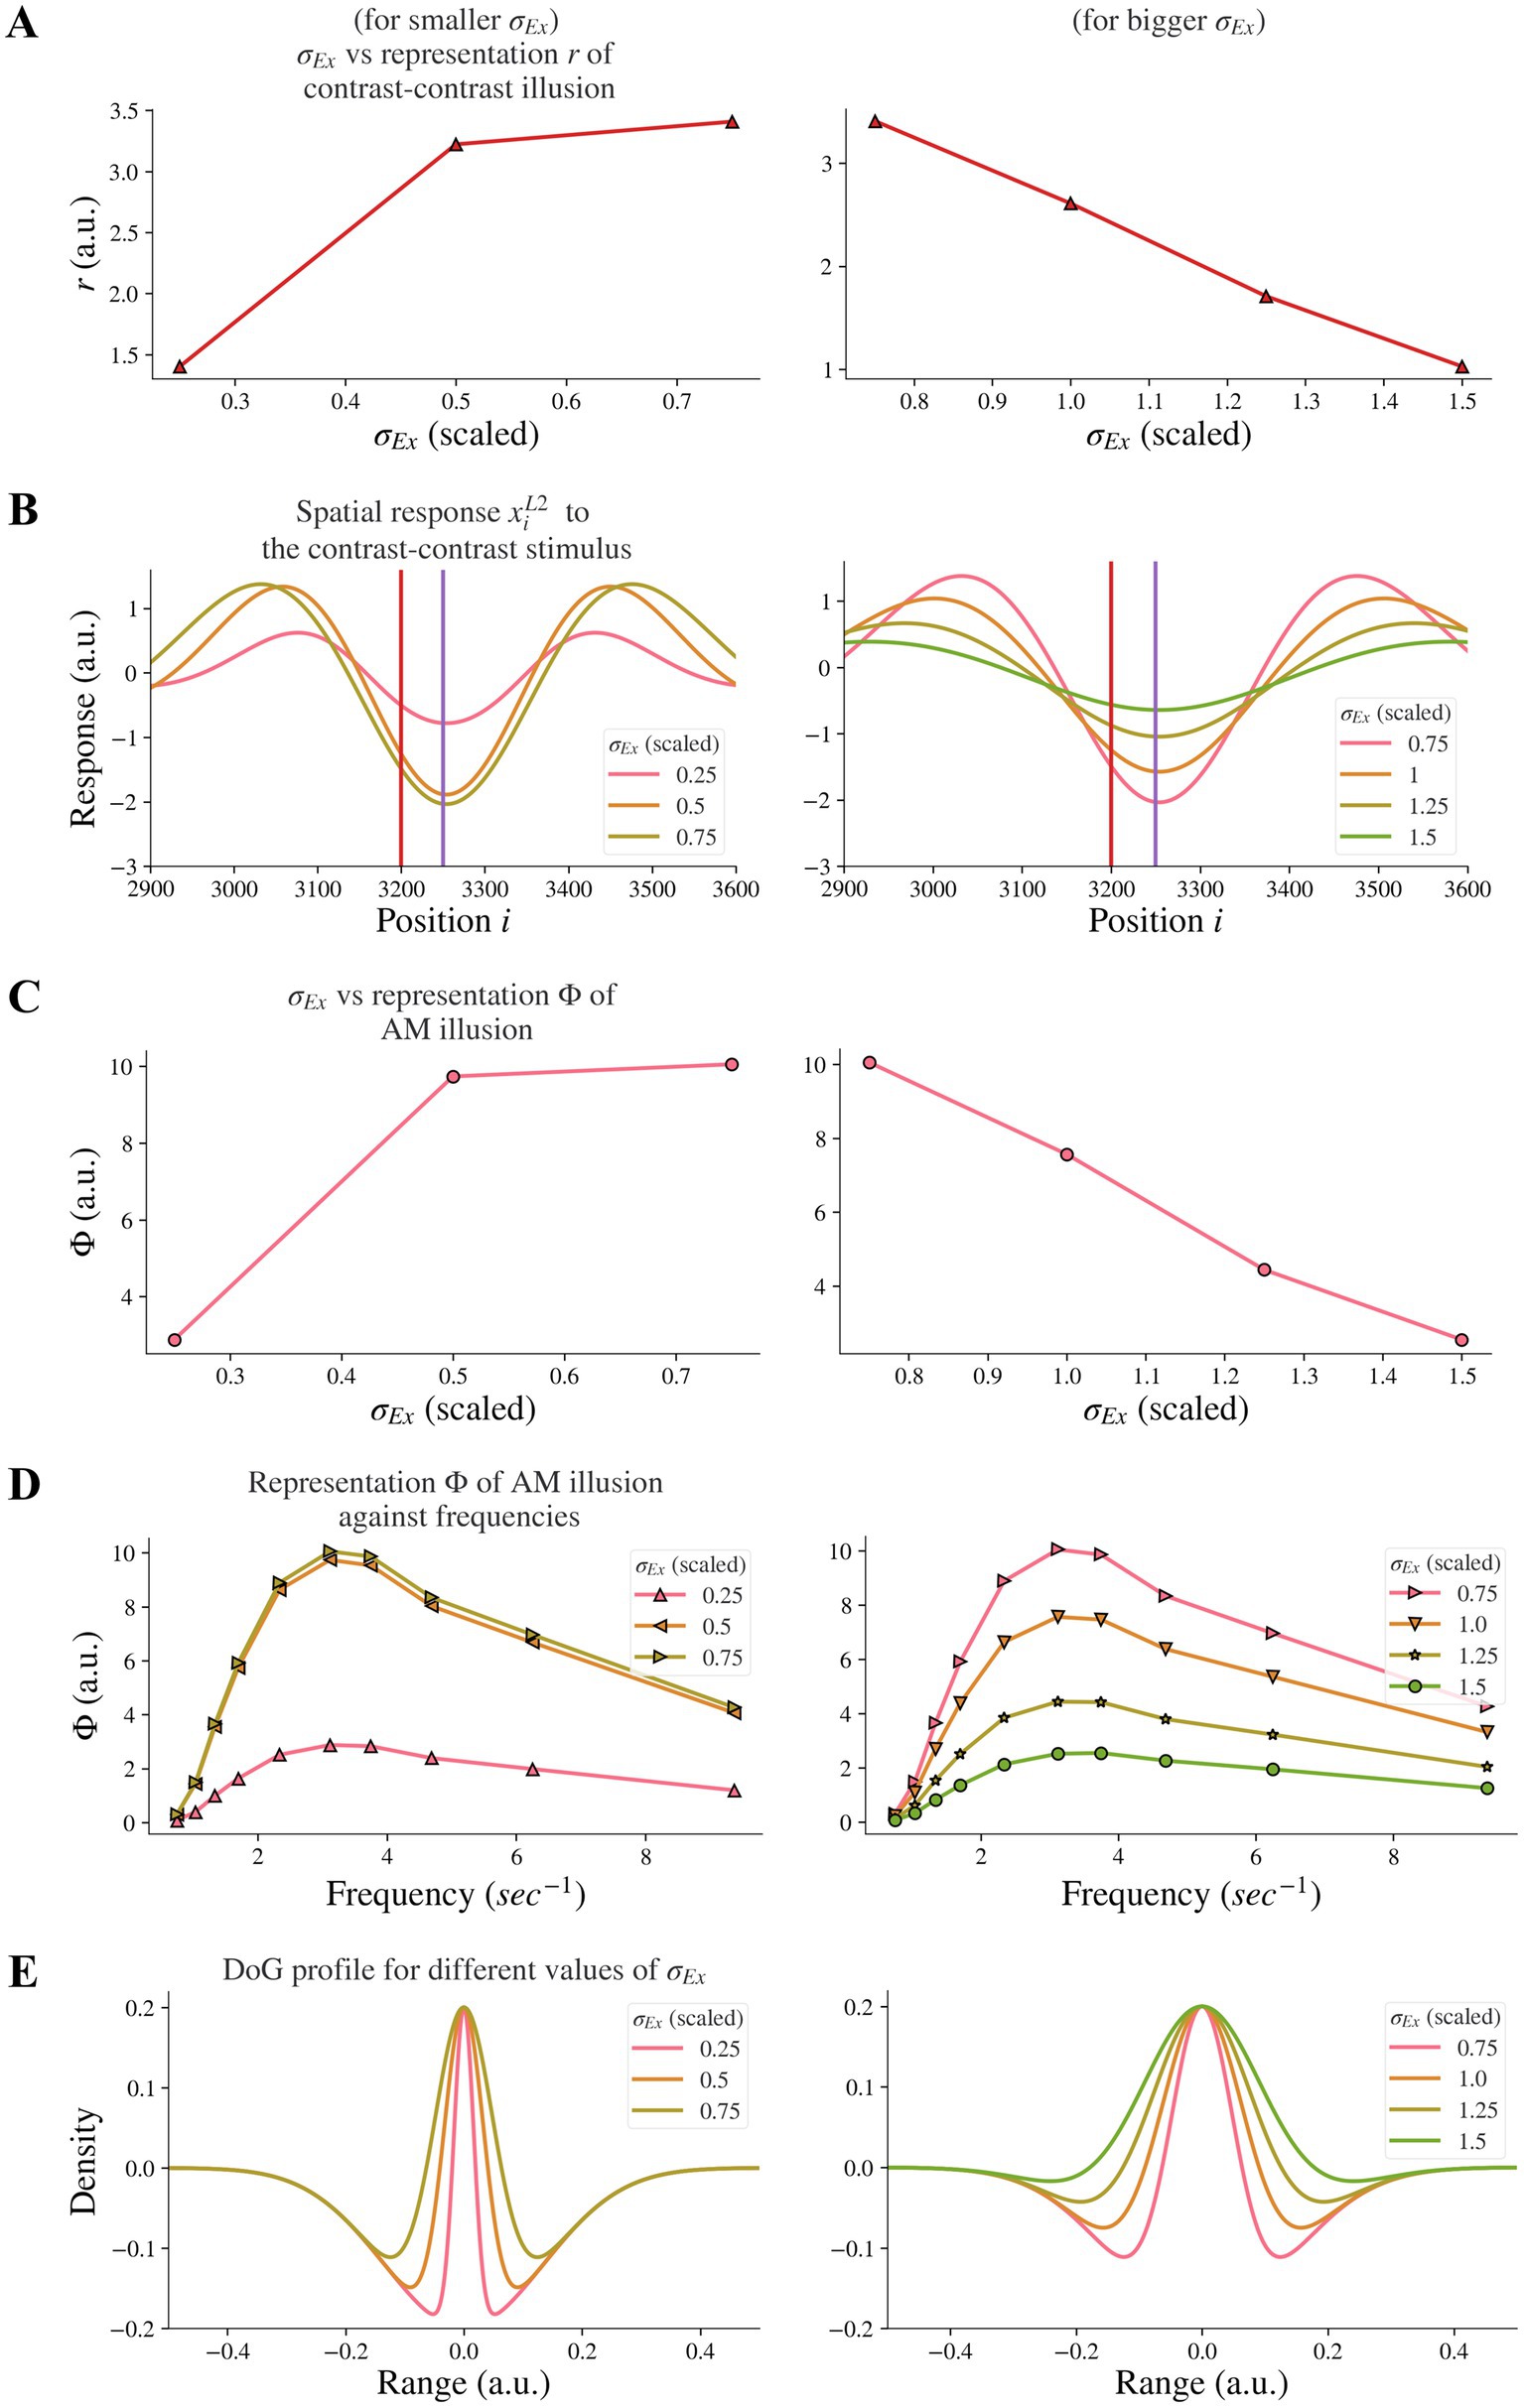
Figure 5. Model representations of illusions for different excitatory width σEx. Results for smaller σEx and bigger σEx are on the left and right panels, respectively. (A) The neural representation for contrast-contrast illusion perception. (B) The model response profile for the contrast-contrast illusion. The red vertical is at the left edge of the lower contrast patch and the purple vertical line is at the center of the stimulus. (C) The model representation for AM illusion against each σEx. (D) The model representation for AM illusion against different combinations of σEx and frequencies of the two flashing stimuli. (E) The changes of the DoG profile with the changes of the excitatory subfield σEx.
Similarly, we investigated whether increasing the excitatory subfield width would reduce AM illusion. The results for the AM illusion were consistent with the contrast-contrast illusion: changes varied depending on whether the excitatory subfield width values were within a low or high range.
By increasing the excitatory width σEx in the range of larger values (0.75–1.5) in the model, we observed a reduction of the model representation Φ of AM illusion (see the right panel in Figure 5C). On the contrary, increasing the excitatory width σEx in the range of lower values (0.25–0.75) increased the model representation Φ of AM illusion (see the left panel in Figure 5C). Figure 5C presents the peak value of each curve in Figure 5D. The range of scaled σEx applied here kept the DoG profile in an on-center off-surround shape (Figure 5E).
Our results suggest that the model base for healthy controls might be at the scaled value of the excitatory width σEx around 0.75, and that individuals with schizophrenia with decreased excitatory drive on fast-spiking interneurons or overactive dopaminergic system could be modeled by scaled value of σEx greater than 0.75. Furthermore, such nonmonotonic changes of illusion representation when the excitatory width σEx increased indicate that the excitatory width σEx may not be the dominant factor that caused the resistance to the illusions in individuals with schizophrenia.
3.4. Changes in the amplitude of the inhibitory or excitatory subfields did not affect illusion representation
We additionally investigated whether reducing the amplitude hInh of the inhibitory subfield, as an alternative approach to model the reduction of the inhibitory subfield, could have the same effect as reducing the width σInh of the inhibitory subfield. Our results showed that reducing the amplitude hInh of the inhibitory subfield had an opposite influence on the model representation of illusions compared to the reduction of the width of the inhibitory subfield. We found that reducing the inhibitory amplitude hInh did not reduce the model representation r of contrast-contrast illusion (see Figure 6A). Instead, Figure 6A shows that the model representation r of contrast-contrast illusion increased as the value of hInh decreased. Each data point in Figure 6A represents the value of r calculated from its corresponding r value of each curve in Figure 6B. Similarly, we found that reducing the inhibitory amplitude hInh did not reduce the model representation Φ of AM illusion. Figure 6C shows that the model representation Φ of AM illusion increased as the value of hInh decreased. All the peak values in Figure 6D are plotted in Figure 6C. Figure 6E shows that the on-center area of the DoG profile became larger as the inhibitory amplitude hInh decreased.
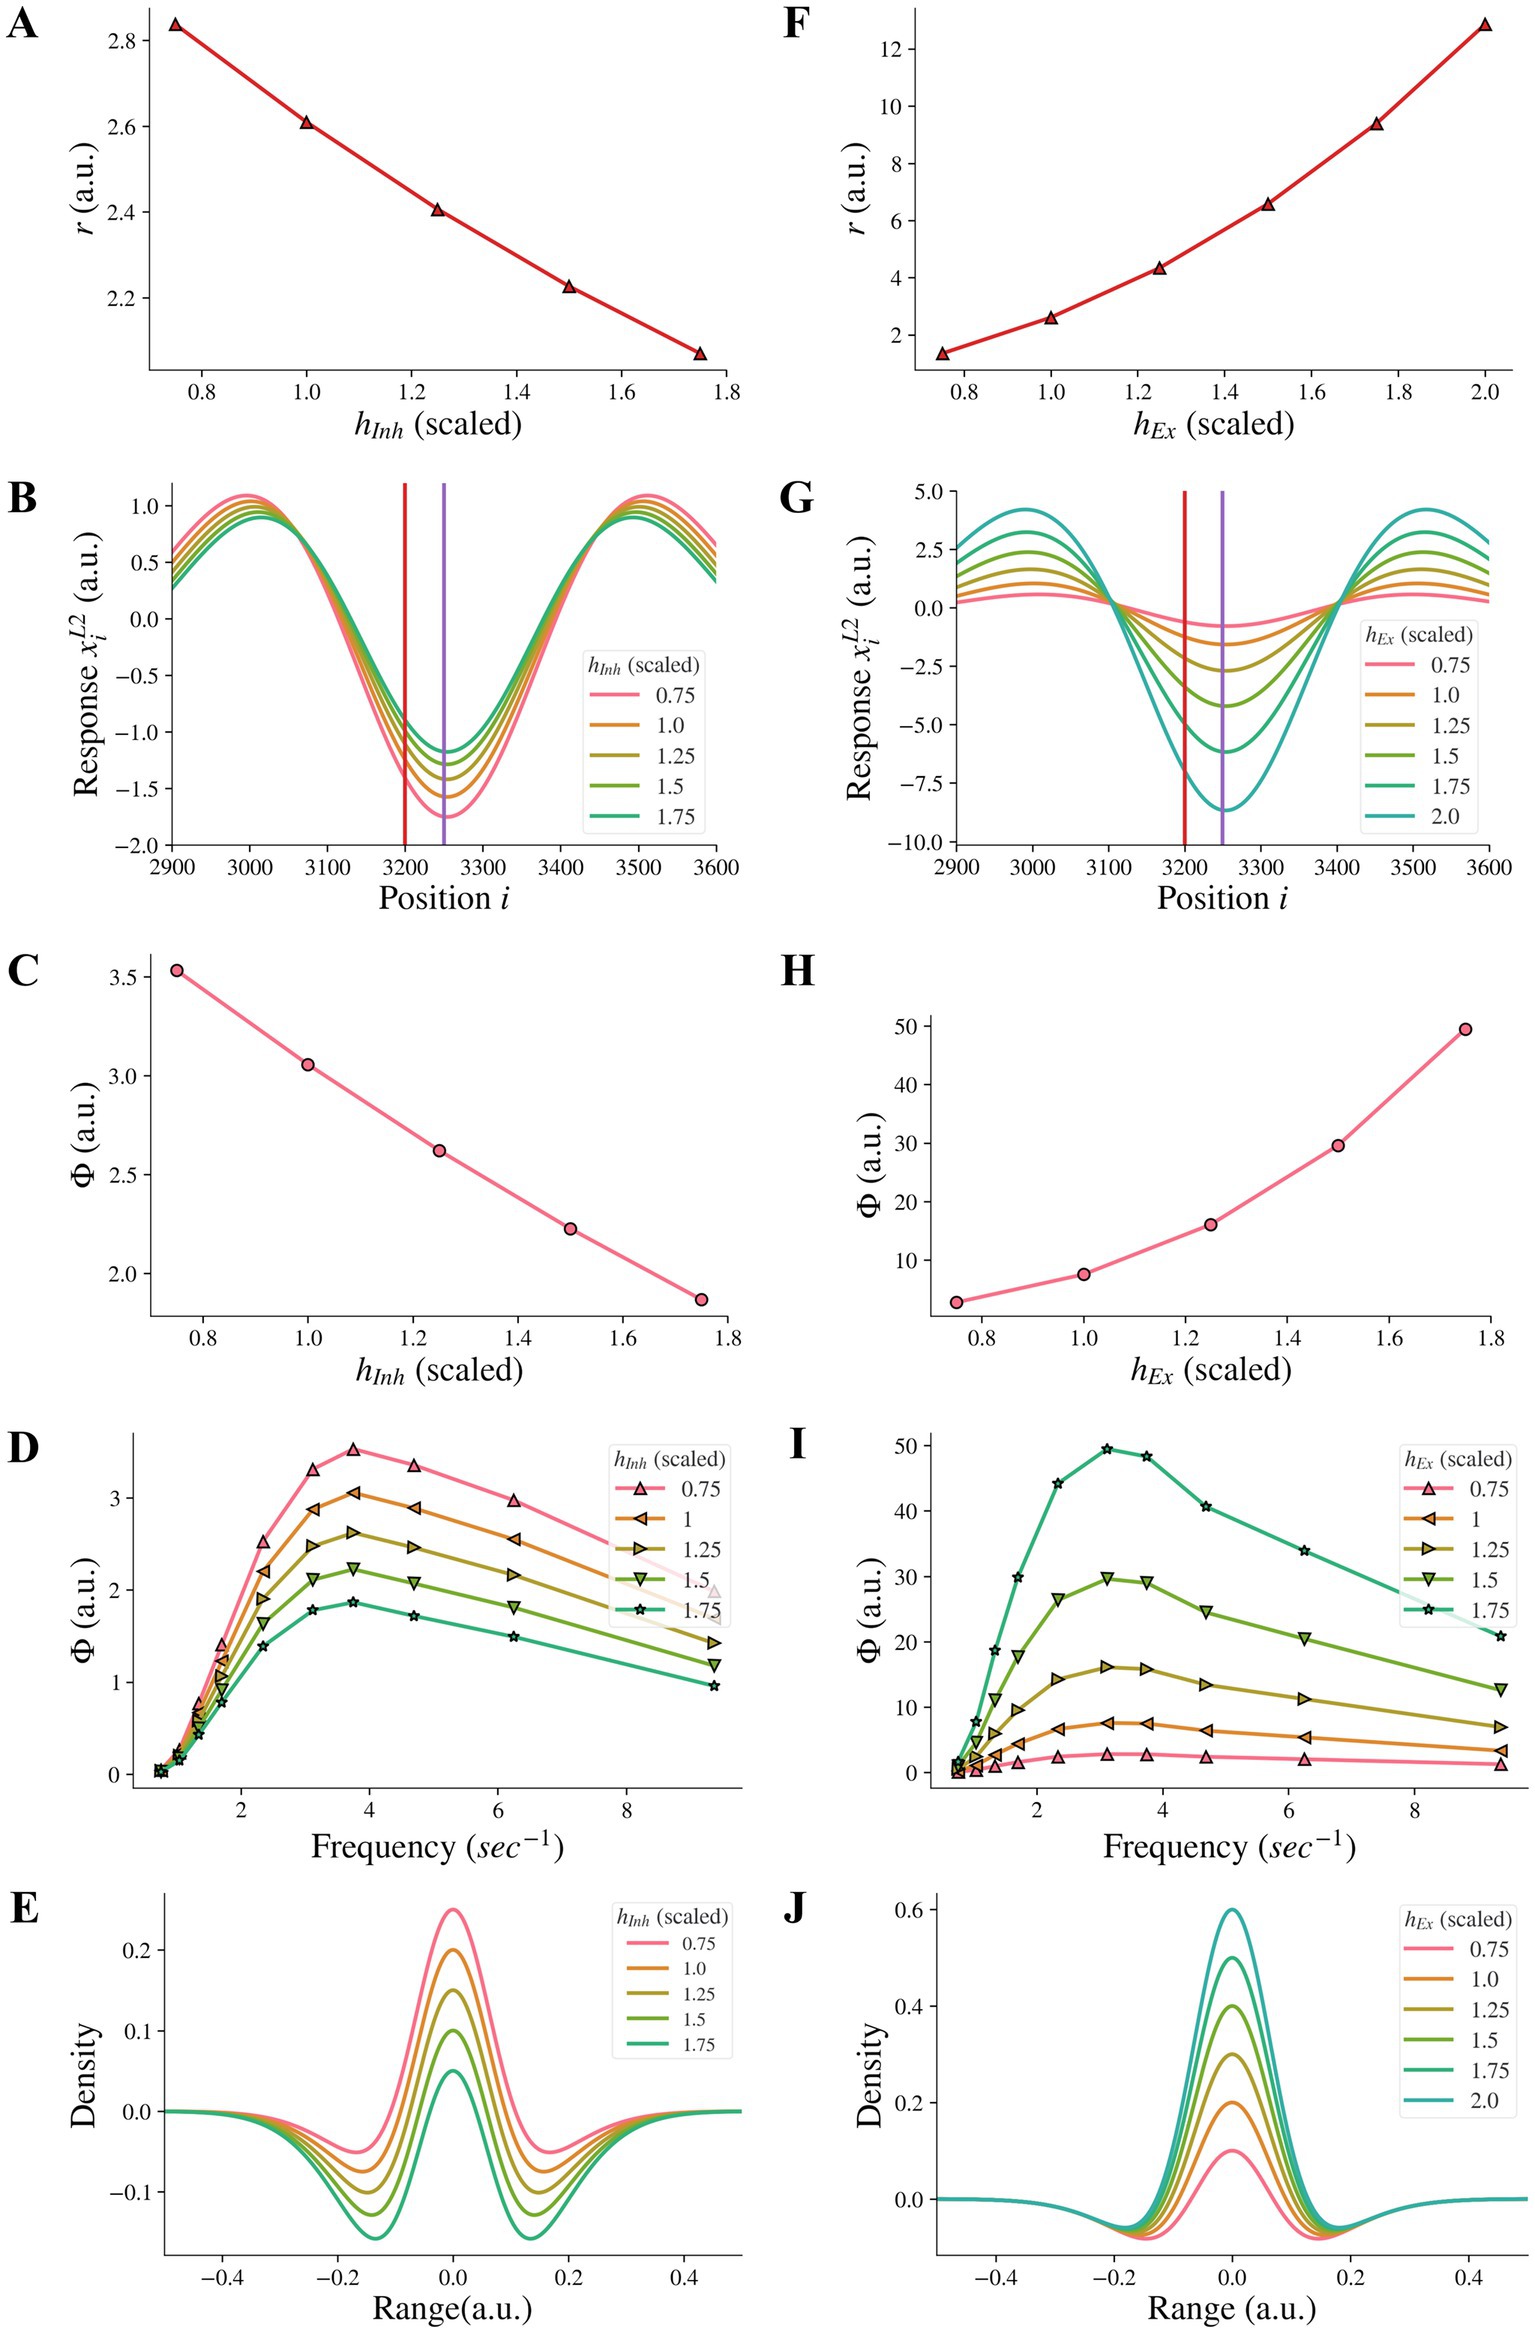
Figure 6. Model representations of illusions for different inhibitory amplitude hInh and excitatory amplitude hEx. (A) The model representation for contrast-contrast illusion. (B) The model response profile to the contrast-contrast illusion stimulus. The red vertical line is at the left edge of the lower contrast patch and the purple vertical line is at the center of the stimulus. (C) The model representation for AM illusion against each inhibitory amplitude hInh. (D) The model representations for AM illusion against different frequencies of two flashing stimuli and hInh. (E) The changes of the DoG profile with the changes of the inhibitory amplitude (hInh). (F-J) are equivalent of A-E by replacing changes of hInh with changes of hEx.
We also examined whether increasing the amplitude hEx of the excitatory subfield, as an alternative approach to model the increase of the excitatory subfield, could have the same effect on the illusion representation as increasing the excitatory width σEx in a range of higher values. We found that increasing the excitatory amplitude hEx did not reduce the model representation r of contrast-contrast illusion. Figure 6F shows that the model representation r of contrast-contrast illusion increased as the value of hEx increased. Each data point in Figure 6F represents the value of r calculated from its corresponding r value of each curve in Figure 6G. Similarly, we found that increasing the excitatory amplitude hEx did not reduce the model representation Φ of AM illusion. Figure 6H shows that the model representation Φ of the AM illusion increased as the value of hEx increased. All the peak values in Figure 6I are plotted in Figure 6H. Figure 6J shows that the on-center area of the DoG profile became larger as the excitatory amplitude hEx increased.
3.5. The combined effect of concurrent changes in the widths of inhibitory and excitatory subfields
When the inhibitory width σInh and the excitatory width σEx changed simultaneously, the contribution of the change of σEx to the model representation was not affected by the change of σInh and vice versa, i.e., there was no interaction, and each factor had its own independent effect on the representation. The model representation r of contrast-contrast illusion against the excitatory width σEx is presented in Figure 7A, with each curve for a different value of the inhibitory width σInh. When the inhibitory width σInh decreased, the curve of the model representation r moved down, and the slope remained almost the same. When the excitatory width σEx decreased, the value of the model representation r increased monotonically, and the change rate was almost the same for different values of the inhibitory width σInh. We saw the same pattern for the model representation Φ of AM illusion (Figure 7B).
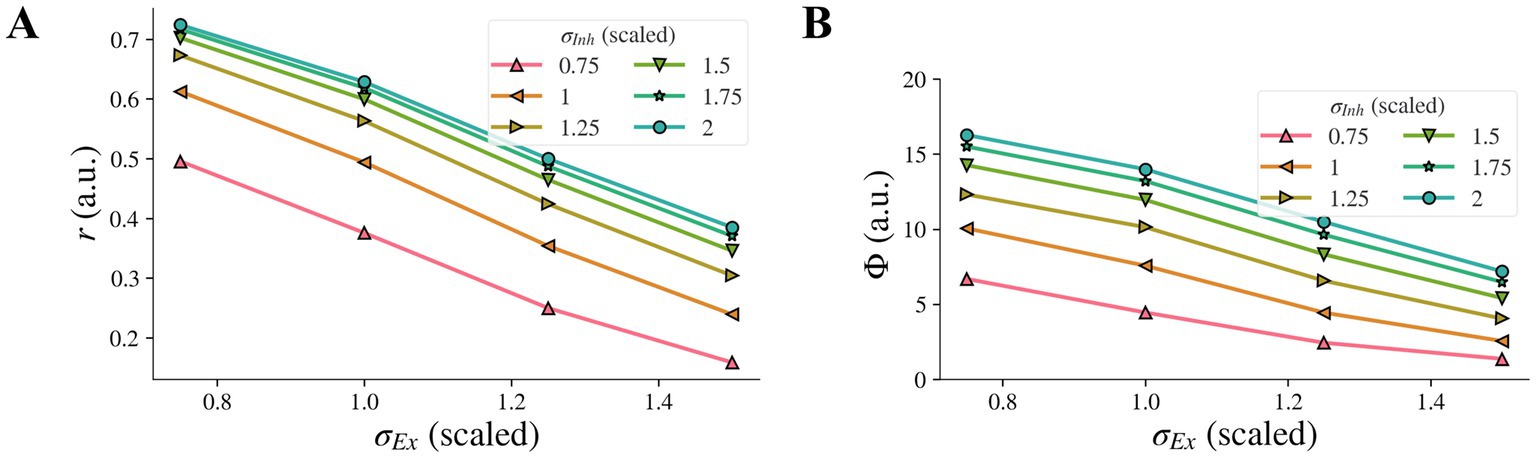
Figure 7. Combined effects on model illusion representation for concurrent changes of σInh and σEx. Model representation for contrast-contrast (A) and AM (B) illusions. In both cases, decrease of σInh and simultaneous increase of σEx led to decreased illusion representation.
4. Discussion
We constructed a two-layer neural model that can replicate the perceptual results in contrast-contrast and AM illusions, as elaborated below. We observed reduction of simulated illusion representation when changing the model parameters independently or combined, including decrements of the width of the inhibitory surround, decrements of the top-down feedback, and increments or decrements of the width of the excitatory subfield (Figure 8).
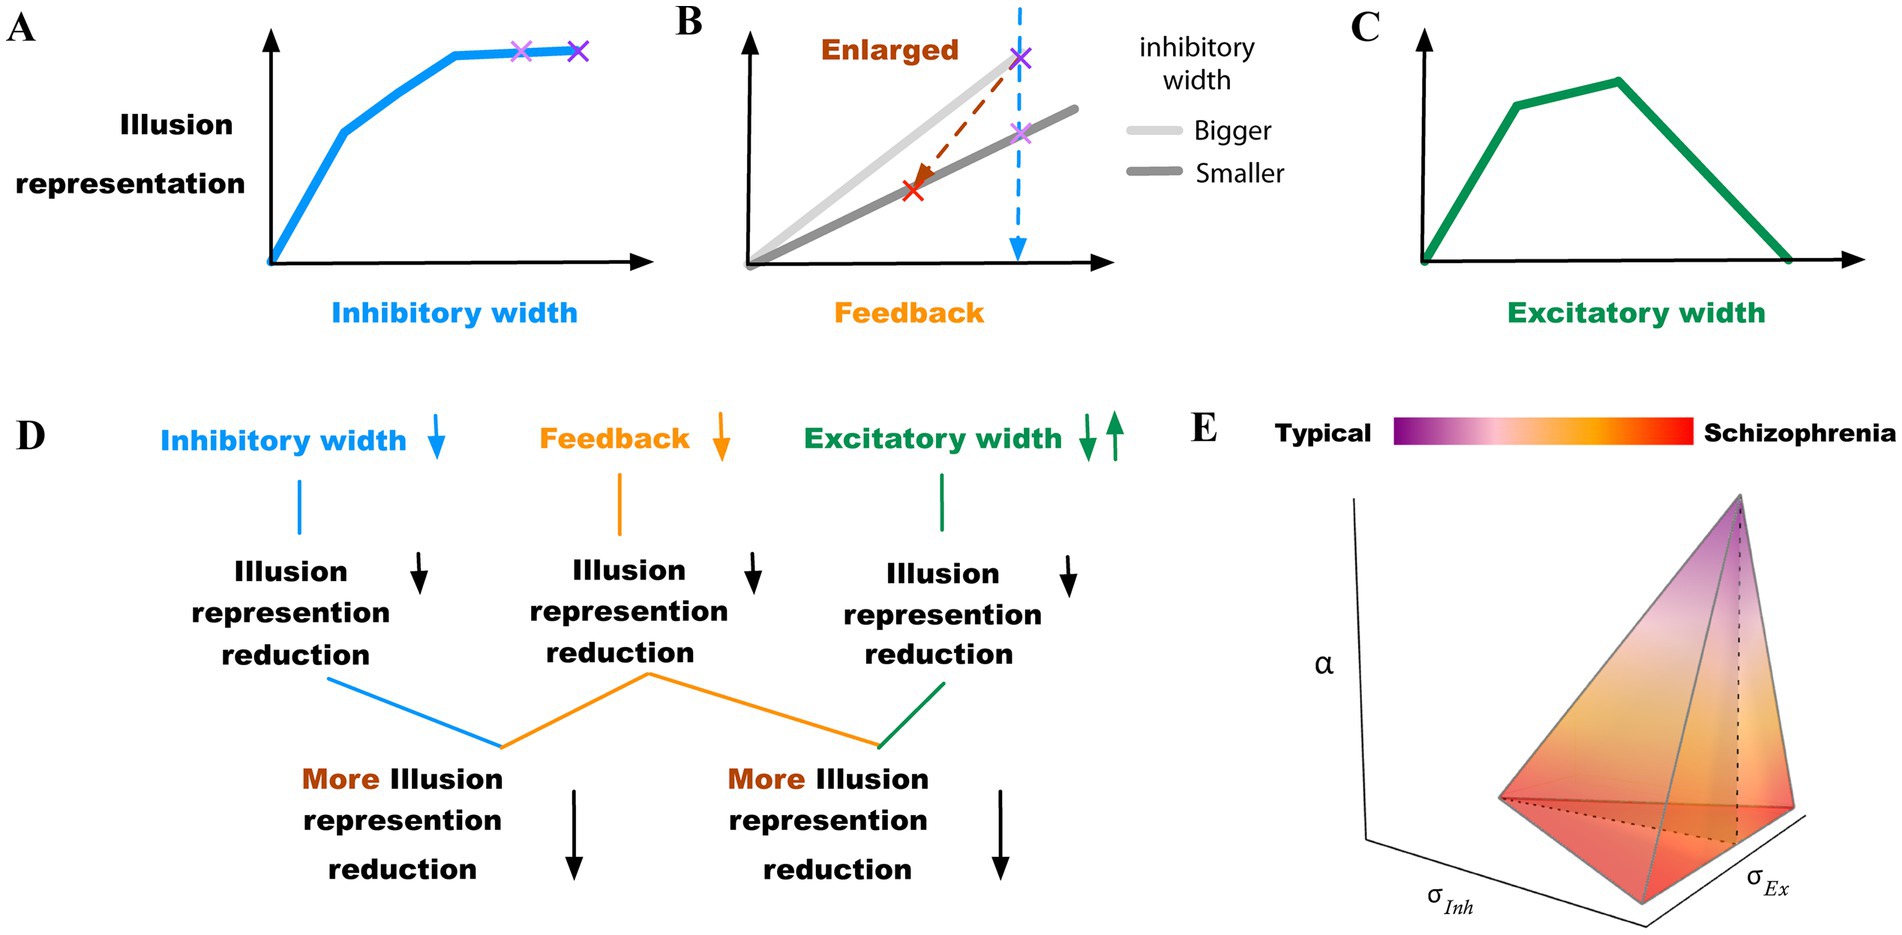
Figure 8. Summary of findings. (A) Model illusion representation reduces as the width of the inhibitory surround decreases. The two purple “x” marks indicate little change within the upper range of inhibitory width values. (B) Model illusion representation reduces as the feedback decreases. The light purple “x” mark indicates the illusion change when the width of the inhibitory surround decreases (the same as in (A)), highlighting combined effects of inhibitory surround and feedback changes on illusion respresentation. The red “x” mark indicates a greater reduction of illusion representation, when both the inhibitory width and the feedback decrease simultaneously. (C) Model illusion representation reduces as the width of the excitatory subfield increases or decreases depending on different starting points. (D) Summary diagram highlighting first independent parameter change possibilities that led to reduction of the model illusion representation and combinations of parameter changes, which consistently resulted in stronger reduction of illusion representation. (E) Transition from typically developed individuals to those with schizophrenia within α, σInh, and σEx (feedback, inhibitory, and excitatory subfields) space. The schizophrenia region is within ranges of reduced feedback and/or reduced inhibition with either reduced or increased excitation highlighting the multitude of possible parameter change combinations that likely underlie neurobiological heterogeneity.
4.1. Comparison with behavioral studies
Our model representation (Φ) of AM illusion climbed to a peak at around 3 Hz and then dropped (e.g., Figure 3D), similar to reports for AM perception in Sanders et al. (16), where individuals with paranoid schizophrenia perceived lower illusion and the peak of the illusion occurred when presentation frequency of AM stimulus was at 3.12 Hz. Behavioral studies (5, 7) suggested that individuals with schizophrenia have impaired lateral connectivity in V1, which suggests reduced inhibition. In Figure 3D, the plot of the illusion representation Φ moved downward as the inhibitory width σInh decreased, just as the percept-frequency plot for schizophrenia shifting down in comparison to healthy controls [see Figure 1A in Sanders et al. (16)]. While our results are consistent with these previous studies, we took an additional step to provide mechanistic support for the hypothesis that reduced lateral inhibition can cause impaired representation of AM illusion.
Moreover, our estimation of the illusion representation for contrast-contrast stimulus is also consistent with perceptual data. The model representation r for contrast-contrast illusion decreased as the inhibitory width σInh decreased as shown in Figure 3A, in line with (12), who reported that individuals with chronic schizophrenia perceive weaker contrast-contrast illusion than healthy controls. Our findings again provide additional mechanistic support to the hypothesis that reduced lateral inhibition could cause impaired contrast-contrast illusion.
The changing patterns of perception for AM and contrast-contrast illusions have not been studied comparatively. Here we found that the changing pattern of the model representation across different values of σInh for AM illusion simulation was the same as for contrast-contrast illusion (see the curve shapes in Figures 3A,C). These findings support and validate the use of our proposed two-layer model for probing neurobiological changes in conditions such as schizophrenia and their impact on visual percepts.
Our results are consistent with reports that individuals with schizophrenia have reduced top-down feedback (6, 32) and reveal a plausible mechanism showing that reduced top-down feedback can impair contrast-contrast and AM illusions percept. Furthermore, our results showed that the model representation for both contrast-contrast and AM illusions shared the same trend when the feedback strength α decreased (see the plots in Figures 4A,D).
Several studies, reviewed in Silverstein et al. (7), suggested that increased lateral excitation within V1 may be associated with varying degrees of visual perception changes in schizophrenia (36–41). In line with these studies, our results show that increased excitation width (σEX), can explain reduced contrast-contrast and apparent motion illusion (Figures 5A,C right panels). In the other direction, Keri et al. (42, 43) showed that in schizophrenia, excitatory lateral connections in early visual cortex are impaired, and in our model, the decreased excitation width (σEX) too, can contribute to illusion reduction of both contrast-contrast and apparent motion (Figures 5A,C left panels). Therefore, both directions of excitation changes, including increasing and decreasing excitation widths that fall outside an optimal mid-range of excitation levels, can contribute to illusion reduction of both contrast-contrast and apparent motion (summarized in Figures 8D,E). Our model shows that for both illusions, strength vs. excitation follows an inverted U pattern (summarized in Figure 8C).
4.2. Top-down feedback can enlarge the difference in illusion representation
In our model, the simulated illusion representation did not change linearly with the lateral inhibition change. The simulated illusion representation increased as the width of the inhibitory subfield got larger, but the change rate of the illusion representation became smaller. For instance, Figure 8A shows that the model illusion representation decreased slowly between the two purple” x” marks. In this range, the change of the illusion representation may not be large enough to be interpreted as a significant change of illusion representation in higher association cortices. This suggests that impaired lateral inhibition alone in schizophrenia (5) might not be enough to explain variability in findings, e.g., why Dakin et al. (12) reported significant difference between individuals with schizophrenia and controls in perceiving the contrast-contrast illusion, while Barch et al. (15) found smaller effects. This supports the hypothesis that there might be considerable heterogeneity of symptoms, their severity, and underlying mechanisms of pathology among individuals with schizophrenia (Table 2). Because lateral inhibition is a mechanism underlying low-level visual integration our findings can also explain decreased susceptibility to some low-level integration of visual illusions in schizophrenia (2). Based on this, it is likely that disruption of top–down perceptual organization mechanisms may be the major factor underlying resistance to high-level illusions, which is often reported in individuals with schizophrenia (2).
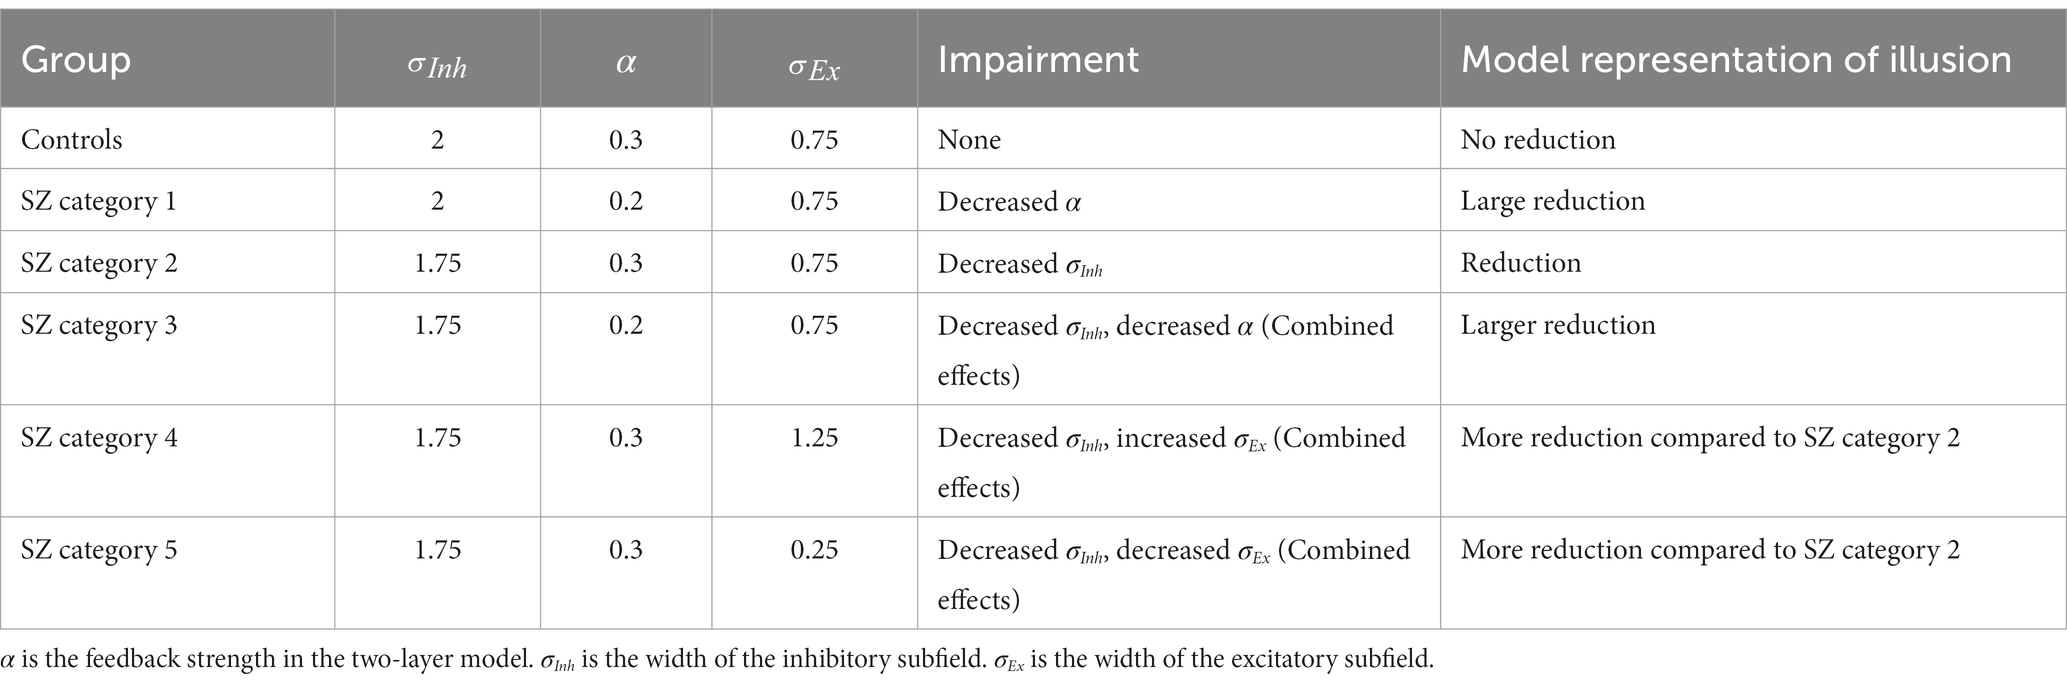
Table 2. Possible combined effects of parameter changes on model representation of illusions that can be used to identify distinct types of SZ across a heterogeneous spectrum.
Indeed, changing the inhibition and feedback simultaneously produced much larger changes in illusion representation. For example, the blue dashed line between the two purple” x” marks in the sketch in the Figure 8B shows a relatively smaller reduction in illusion, when decreasing the width of the inhibitory subfield alone, compared to the brown oblique dashed line between the red” x” mark and the purple” x” mark that shows a greater reduction in illusion when decreasing the width of the inhibitory subfield and the top-down feedback simultaneously (see also Figures 4C,F, summarized in sketch of Figure 8B).
Notredame et al. (3) proposed a Bayesian framework that combines sensory evidence and prior knowledge to explain visual perception changes in schizophrenia. Dima, et al. (20) found that during the hollow-mask illusion task the neurophysiological signals from high-order, association cortices to lower-in-the-visual-hierarchy cortices were significantly different between individuals with schizophrenia and controls and correlated the reduction of illusion perception with weakened top-down modulation. Behavioral and neurophysiological studies for AM illusion (17, 44) also suggest there is correlation between reduction of AM illusion and weakened feedback from higher association cortices to V1 in schizophrenia. These studies inferred that the perceived illusion was influenced by the stored information of experience (prior knowledge) passed from higher association cortices to lower cortices. That is to say that the Bayesian model explaining visual perception in schizophrenia (3) is based on the correlation relationship between prior knowledge and feedforward visual input.
Our two-layer network, on the other hand, provides a mechanistic relationship between weakened top-down feedback and reduced representation of illusions (Figure 8B). The top-down feedback in the two-layer network is a mechanism that does not include any stored information of experience (priors). This suggests that the decreased top-down feedback per se can cause the reduced AM illusion besides top-down process of prior knowledge. Correspondingly, for a few illusions other than AM, Kaliuzhna et al. (21) showed no significant changes in the formation of priors in stable outpatient individuals with schizophrenia, therefore again, disturbed priors could depend on the type of stimulus or task and the clinical state and type of patients. Nevertheless, our simulation results show that the decreased top-down feedback from a higher area to a lower one (cortex or thalamus) can amplify the reduction of the illusion representation, which can be considered as a possible mechanism for AM and contrast-contrast illusion susceptibility reduction within a heterogenous range of patients with schizophrenia at variable clinical states.
In our neural model, impaired lateral inhibition reduced the representation of illusions too, and the reduction was magnified by weakened top-down feedback (Figures 4C,F, 8B). Therefore, we propose that depending on the level of weakening of the feedback, there would be variable changes in illusion perception in individuals with schizophrenia. This suggests that there may be a range of percept change of illusions in schizophrenia, depending on the extent of top-down feedback reduction. As mentioned, the top-down feedback is a magnifying factor in perceiving illusions: the top-down feedback regulates illusion perception more coarsely, whereas lateral inhibition impact is finer (Figures 4C,F, 8B). Our findings suggest that the variations in the inhibitory surround or the excitatory center can replicate minor differences of illusion precepts between individuals with schizophrenia and neurotypical controls, whereas the top-down feedback can enlarge and magnify these differences in the illusion perception.
4.3. Implications for diagnostic and therapeutic approaches
Based on our simulation results, it might be possible to classify people with schizophrenia into several categories with variable levels of reduced illusion representation (Figure 8): (1) patients with impaired top-down feedback; (2) patients with impaired width of inhibitory subfields (reduced GABA); (3) patients with a combination of reduced top-down feedback and width of inhibitory subfields; (4) patients with increased width of excitatory subfields (e.g., overactive dopamine); and (5) decreased width of excitatory subfields (e.g., reduced dopamine). The last two categories can be combined as patients with either increased or decreased excitatory field outside an optimal mid-range (Figure 8C). Table 2 shows how the changes of parameters can influence the illusion representation when they deviate from scaled values σInh = 2, α = 0.3 and σEx = 0.75, which are for typical responses (see the group “Controls,” first row in Table 2). The influencing factors (parameters) may change simultaneously and form a spectrum that includes additional combinations of the above scenarios, which could reveal the underlying source of heterogeneity in illusion perception in individuals with schizophrenia (Figure 8E). For example, changes in feedback α alone, or in combination with changes in the inhibitory subfields (schizophrenia (SZ) categories 1 and 3, Table 2), show progressively larger reduction of illusion representation compared to the other parameter sets in Table 2. The last two rows of Table 2 show that reducing the width of the inhibitory subfield while decreasing or increasing the width of the excitatory subfield can also lead to a reduction in illusion perception. Grouping individuals with schizophrenia in categories, as suggested here, when analyzing individual differences in illusion perception may help interpret behavioral and other disease heterogeneity.
A more nuanced classification of SZ can improve our understanding of mechanisms underlying treatment approaches. Experimental approaches that can directly measure the pathophysiological underpinnings of SZ are traditionally used for the identification of biomarkers (45), but theoretical and computational studies like this can further help disambiguate contradictory findings and lead to development of effective, validated biomarkers (46). For example, dopamine antagonists are not effective for all patients (47). Decreasing dopamine can lead to normalized behaviors, as in healthy controls, but often this approach has no effects. This can be explained in our model, in which decreasing dopamine is reflected by decreasing the width of the excitatory subfield. Figures 5A,C, 8C–E show that decreasing the width of the excitatory subfield does not always lead to increased illusion representation: only within an optimal mid-range of the excitatory subfield (i.e., a scaled value of σEx in range [0.75–1.5]) we observe increased illusion representation, which is a behavior in healthy controls, whereas a smaller excitatory width (i.e., a scaled value of σEx in range [0.25–0.75]) does not lead to increased illusion representation.
For the current study, we chose the two illusions, contrast-contrast and apparent motion, because they leverage low level visual attributes, contrast and transient light flashes, appropriate for probing visual system fine spatial and temporal processing (48, 49). The contrast-contrast illusion is useful for probing the impact of neural circuits involved in excitatory and inhibitory subfields and feedback (50). Apparent motion is useful for probing the temporal dynamics of responses of neuronal networks, which are dynamically modulated by feedback, and because each transient flash has a dynamical contrast with its surround, the excitatory and inhibitory subfields or excitation inhibition balance are also involved in the representation (51). Therefore, both illusions are directly useful to probe the impact of feedback and excitation/inhibition balance. While both illusions recruit excitation-inhibition and feedback mechanisms in general, and are initially processed through LGN and V1, each illusion engages a distinct brain circuit within the visual hierarchy; the apparent motion and motion representation in general engage the magnocellular/dorsal pathway (49, 52) and involve extensive feedback communication from higher visual areas like MT/V5 back to V1 (53, 54), while the contrast-contrast illusion, a static illusion, engages both the parvocellular and magnocellular systems (55).
Several other illusions are impacted in schizophrenia. For example, individuals with schizophrenia are less susceptible to the size contrast (Ebbinghaus) illusion during the acute phase of illness and after the first episode of psychosis, but illusion susceptibility during recovery phase is similar to the normal population, making this illusion a good state marker of the disease (56). Another visual illusion affected in schizophrenia is the Depth Inversion Illusion (DII) (57). Positive symptoms and the need for treatment of schizophrenia are associated with lower susceptibility to DII. However, treatment progress closes the gap in illusion susceptibility between the schizophrenia and control groups. Therefore, similar to the Ebbinghaus illusion, the susceptibility to DII appears to be dependent on the illness state (57). These two illusions engage mechanisms for temporal processing of low-level spatial contrast, which are included in our current model. However, the full representation of the DII and size contrast illusions demands additional features that are absent in our current model, such as integration of local and global cues. Such features are dependent on top-down feedback (58), further highlighting the key role of feedback in these illusions and the contrast-contrast and AM illusions, modeled here.
Depending on the underlying neural mechanisms involved in illusion representation susceptibility can decrease in schizophrenia, as is the case for the illusions in this study, or instead increase: Yang et al. (59) replicated weakened contrast-contrast illusion but normal or slightly stronger orientation suppression effect for center-surround orientation repulsion illusion in schizophrenia. These findings suggest that abnormal contextual modulation in schizophrenia is specific and depends on the illusion type and the neural mechanisms underlying its representation. In this regard, Kéri et al. (43) showed that in schizophrenia, Gabor flankers did not facilitate contrast detection for target stimuli at certain distances compared to controls. Our model by its reduced excitatory field could partially explain this finding but the reported effect could also depend on lateral interactions of local processing units via intra-areal connections in early visual cortex.
Therefore, it is important to consider the severity of the disease and stage of treatment as well as the types of illusions, which engage distinct mechanisms that can sometimes have no effects, or can lead to increased, or decreased illusion perception. With this in mind, our model showed that for given illusion types, ranges of susceptibility rates in individuals with schizophrenia could emerge based on the magnitude of changes in excitation-inhibition balance and feedback which are summarized in Figure 8E, providing an abstract visual representation of the heterogeneity space of the disease. However, there are limitations regarding attribution of these gradients to patients at the same stage of disease and with the same medication status, because there are considerable variabilities in the nature and severity of symptoms and of cognitive processing and perception. Therefore, our model can be seen as relevant to groups of patients but not necessarily to all patients within a group (7).
4.4. Conclusion
In this work, we proposed a two-layer network model, applied it to simulate neural representation of contrast-contrast and apparent motion illusions and observed similar results between the simulations of the two illusions. The results were also consistent with behavioral findings in previous studies with human observers (12, 16).
By searching the parameter space of the model and also changing each parameter independently, we found that illusion representation reduced as the width of the inhibitory surround decreased, which likely reflects impaired lateral connectivity in individuals with schizophrenia. We also found that reduced illusion representation can be caused by the decrement of the top-down feedback or the change of the width in the excitatory subfield outside an optimal mid-range.
Key contributions of our model include providing evidence for a mechanism that explains how top-down feedback can enlarge the change of illusion representation and support for the hypothesis that illusion perception can be affected by the top-down feedback without the need for stored contextual information or experience (priors), keeping in mind that priors can also affect illusion perception. The model shows that decreasing the top-down feedback and decreasing the width of the inhibitory subfield simultaneously amplifies reduction in illusion representation compared to decreasing the width of the inhibitory subfield alone. This can explain a range of observations in previous studies and explain heterogeneity in SZ, reflected through variability in illusion susceptibility, depending on whether the top-down feedback reduction is large or small.
Data availability statement
The original contributions presented in the study are included in the article/supplementary material, further inquiries can be directed to the corresponding authors.
Author contributions
JZ: design, methodology, formal analysis, and writing of first draft. BZ and AY: funding acquisition, design, methodology, and resources. JZ, BZ, and AY: writing. All authors contributed to the article and approved the submitted version.
Funding
This work was supported by National Institute of Mental Health, Grant/Award Number: R01MH118500.
Acknowledgments
The authors would like to thank Sangwook Park, Natalia Matuk, Megan Qin Deng, Cici Chen, and Caroline Dugan for their useful comments during discussions of this work.
Conflict of interest
The authors declare that the research was conducted in the absence of any commercial or financial relationships that could be construed as a potential conflict of interest.
Publisher’s note
All claims expressed in this article are solely those of the authors and do not necessarily represent those of their affiliated organizations, or those of the publisher, the editors and the reviewers. Any product that may be evaluated in this article, or claim that may be made by its manufacturer, is not guaranteed or endorsed by the publisher.
References
1. Cao, B , Mingolla, E , and Yazdanbahksh, A . A computational study of brightness-related responses in visual cortex. J Vis. (2013) 13:8. doi: 10.1167/13.1.8
2. King, DJ , Hodgekins, J , Chouinard, PA , Chouinard, VA , and Sperandio, I . A review of abnormalities in the perception of visual illusions in schizophrenia. Psychon Bull Rev. (2017) 24:734–51. doi: 10.3758/s13423-016-1168-5
3. Notredame, CE , Pins, D , Deneve, S , and Jardri, R . What visual illusions teach us about schizophrenia. Front Integr Neurosci. (2014) 8:63. doi: 10.3389/fnint.2014.00063
4. Wurbs, J , Mingolla, E , and Yazdanbakhsh, A . Modeling a space-variant cortical representation for apparent motion. J Vis. (2013) 13:2. doi: 10.1167/13.10.2
5. Anderson, EJ , Tibber, MS , Schwarzkopf, DS , Shergill, SS , Fernandez-Egea, E , Rees, G, et al. Visual Population Receptive Fields in People with Schizophrenia Have Reduced Inhibitory Surrounds. J Neurosci. (2017) 37:1546–56. doi: 10.1523/JNEUROSCI.3620-15.2016
6. Silverstein, SM . Visual perception disturbances in Schizophrenia: a unified model. Neb Symp Motiv. (2016) 63:77–132. doi: 10.1007/978-3-319-30596-7_4
7. Silverstein, SM , Demmin, DL , and Bednar, JA . Computational Modeling of Contrast Sensitivity and Orientation Tuning in First-Episode and Chronic Schizophrenia. Comput Psychiatr. (2017) 1:102–31. doi: 10.1162/CPSY_a_00005
8. Silverstein, SM , and Rosen, R . Schizophrenia and the eye. Schizophr Res Cogn. (2015) 2:46–55. doi: 10.1016/j.scog.2015.03.004
9. Gori, S , Molteni, M , and Facoetti, A . Visual Illusions: An Interesting Tool to Investigate Developmental Dyslexia and Autism Spectrum Disorder. Front Hum Neurosci. (2016) 10:175. doi: 10.3389/fnhum.2016.00175
10. Park, S , Zikopoulos, B , and Yazdanbakhsh, A . Visual illusion susceptibility in autism: A neural model. Eur J Neurosci. (2022) 56:4246–65. doi: 10.1111/ejn.15739
11. Yazdanbakhsh, A , Barbas, H , and Zikopoulos, B . Sleep spindles in primates: modelling the effects of distinct laminar thalamocortical connectivity in core, matrix, and reticular thalamic circuits. Netw Neurosci. (2023) 7:1–58. doi: 10.1162/netn_a_00311
12. Dakin, S , Carlin, P , and Hemsley, D . Weak suppression of visual context in chronic schizophrenia. Curr Biol. (2005) 15:R822–4. doi: 10.1016/j.cub.2005.10.015
13. Chubb, C , Sperling, G , and Solomon, JA . Texture interactions determine perceived contrast. Proc Natl Acad Sci U S A. (1989) 86:9631–5. doi: 10.1073/pnas.86.23.9631
14. Cavanaugh, JR , Bair, W , and Movshon, JA . Nature and interaction of signals from the receptive field center and surround in macaque V1 neurons. J Neurophysiol. (2002) 88:2530–46. doi: 10.1152/jn.00692.2001
15. Barch, DM , Carter, CS , Dakin, SC , Gold, J , Luck, SJ , Macdonald, A 3rd, et al. The clinical translation of a measure of gain control: the contrast-contrast effect task. Schizophr Bull. (2012) 38:135–43. doi: 10.1093/schbul/sbr154
16. Sanders, LL , De Millas, W , Heinz, A , Kathmann, N , and Sterzer, P . Apparent motion perception in patients with paranoid schizophrenia. Eur Arch Psychiatry Clin Neurosci. (2013) 263:233–9. doi: 10.1007/s00406-012-0344-5
17. Edwards, G , Vetter, P , Mcgruer, F , Petro, LS , and Muckli, L . Predictive feedback to V1 dynamically updates with sensory input. Sci Rep. (2017) 7:16538. doi: 10.1038/s41598-017-16093-y
18. Dima, D , Dietrich, DE , Dillo, W , and Emrich, HM . Impaired top-down processes in schizophrenia: a DCM study of ERPs. NeuroImage. (2010) 52:824–32. doi: 10.1016/j.neuroimage.2009.12.086
19. Dima, D , Dillo, W , Bonnemann, C , Emrich, HM , and Dietrich, DE . Reduced P300 and P600 amplitude in the hollow-mask illusion in patients with schizophrenia. Psychiatry Res. (2011) 191:145–51. doi: 10.1016/j.pscychresns.2010.09.015
20. Dima, D , Roiser, JP , Dietrich, DE , Bonnemann, C , Lanfermann, H , Emrich, HM, et al. Understanding why patients with schizophrenia do not perceive the hollow-mask illusion using dynamic causal modelling. NeuroImage. (2009) 46:1180–6. doi: 10.1016/j.neuroimage.2009.03.033
21. Kaliuzhna, M , Stein, T , Rusch, T , Sekutowicz, M , Sterzer, P , and Seymour, KJ . No evidence for abnormal priors in early vision in schizophrenia. Schizophr Res. (2019) 210:245–54. doi: 10.1016/j.schres.2018.12.027
22. Choung, OH , Gordillo, D , Roinishvili, M , Brand, A , Herzog, MH , and Chkonia, E . Intact and deficient contextual processing in schizophrenia patients. Schizophr Res Cogn. (2022) 30:100265. doi: 10.1016/j.scog.2022.100265
23. Zuiderbaan, W , Harvey, BM , and Dumoulin, SO . Modeling center-surround configurations in population receptive fields using fMRI. J Vis. (2012) 12:10. doi: 10.1167/12.3.10
24. Hubel, DH , and Wiesel, TN . Receptive fields, binocular interaction and functional architecture in the cat's visual cortex. J Physiol. (1962) 160:106–54. doi: 10.1113/jphysiol.1962.sp006837
25. Layton, OW , Mingolla, E , and Yazdanbakhsh, A . Dynamic coding of border-ownership in visual cortex. J Vis. (2012) 12:8. doi: 10.1167/12.13.8
26. Sherbakov, L , and Yazdanbakhsh, A . Multiscale sampling model for motion integration. J Vis. (2013) 13:18. doi: 10.1167/13.11.18
27. Crawford, TJ , Hamm, JP , Kean, M , Schmechtig, A , Kumari, V , Anilkumar, AP, et al. The perception of real and illusory motion in schizophrenia. Neuropsychologia. (2010) 48:3121–7. doi: 10.1016/j.neuropsychologia.2010.06.027
28. Bertsekas, DP , and Tsitsiklis, JN . Introduction to probability. Belmont MA: Athena Scientific (2008).
29. Yoon, JH , Maddock, RJ , Dongbo Cui, E , Minzenberg, MJ , Niendam, TA , Lesh, T, et al. Reduced in vivo visual cortex GABA in schizophrenia, a replication in a recent onset sample. Schizophr Res. (2020) 215:217–22. doi: 10.1016/j.schres.2019.10.025
30. Yoon, JH , Maddock, RJ , Rokem, A , Silver, MA , Minzenberg, MJ , Ragland, JD, et al. GABA concentration is reduced in visual cortex in schizophrenia and correlates with orientation-specific surround suppression. J Neurosci. (2010) 30:3777–81. doi: 10.1523/JNEUROSCI.6158-09.2010
31. John, YJ , Zikopoulos, B , Bullock, D , and Barbas, H . Visual Attention Deficits in Schizophrenia Can Arise From Inhibitory Dysfunction in Thalamus or Cortex. Comput Psychiatr. (2018) 2:223–57. doi: 10.1162/cpsy_a_00023
32. Gilbert, CD , and Sigman, M . Brain states: top-down influences in sensory processing. Neuron. (2007) 54:677–96. doi: 10.1016/j.neuron.2007.05.019
33. Chung, DW , Fish, KN , and Lewis, DA . Pathological Basis for Deficient Excitatory Drive to Cortical Parvalbumin Interneurons in Schizophrenia. Am J Psychiatry. (2016) 173:1131–9. doi: 10.1176/appi.ajp.2016.16010025
34. Gracitelli, CP , Abe, RY , Diniz-Filho, A , Vaz-De-Lima, FB , Paranhos, A Jr, and Medeiros, FA . Ophthalmology issues in schizophrenia. Curr Psychiatry Rep. (2015) 17:28. doi: 10.1007/s11920-015-0569-x
35. Howes, O , Mccutcheon, R , and Stone, J . Glutamate and dopamine in schizophrenia: an update for the 21st century. J Psychopharmacol. (2015) 29:97–115. doi: 10.1177/0269881114563634
36. Anticevic, A , Cole, MW , Repovs, G , Savic, A , Driesen, NR , Yang, G, et al. Connectivity, pharmacology, and computation: toward a mechanistic understanding of neural system dysfunction in schizophrenia. Front Psych. (2013) 4:169. doi: 10.3389/fpsyt.2013.00169
37. Anticevic, A , Corlett, PR , Cole, MW , Savic, A , Gancsos, M , Tang, Y, et al. N-methyl-D-aspartate receptor antagonist effects on prefrontal cortical connectivity better model early than chronic schizophrenia. Biol Psychiatry. (2015) 77:569–80. doi: 10.1016/j.biopsych.2014.07.022
38. Corlett, PR , Honey, GD , Krystal, JH , and Fletcher, PC . Glutamatergic model psychoses: prediction error, learning, and inference. Neuropsychopharmacology. (2011) 36:294–315. doi: 10.1038/npp.2010.163
39. Rivolta, D , Castellanos, NP , Stawowsky, C , Helbling, S , Wibral, M , Grutzner, C, et al. Source-reconstruction of event-related fields reveals hyperfunction and hypofunction of cortical circuits in antipsychotic-naive, first-episode schizophrenia patients during Mooney face processing. J Neurosci. (2014) 34:5909–17. doi: 10.1523/JNEUROSCI.3752-13.2014
40. Silverstein, SM , All, SD , Thompson, JL , Williams, LM , Whitford, TJ , Nagy, M, et al. Absolute Level of Gamma Synchrony is Increased in FirstEpisode Schizophrenia during Face Processing. J Exp Psychopathol. (2012) 3:702–23. doi: 10.5127/jep.023311
41. Sun, L , Castellanos, N , Grutzner, C , Koethe, D , Rivolta, D , Wibral, M, et al. Evidence for dysregulated high-frequency oscillations during sensory processing in medication-naive, first episode schizophrenia. Schizophr Res. (2013) 150:519–25. doi: 10.1016/j.schres.2013.08.023
42. Keri, S , Kelemen, O , and Benedek, G . Attentional modulation of perceptual organisation in schizophrenia. Cogn Neuropsychiatry. (2009) 14:77–86. doi: 10.1080/13546800902757936
43. Keri, S , Kelemen, O , Benedek, G , and Janka, Z . Lateral interactions in the visual cortex of patients with schizophrenia and bipolar disorder. Psychol Med. (2005) 35:1043–51. doi: 10.1017/S0033291705004381
44. Sanders, LL , Muckli, L , De Millas, W , Lautenschlager, M , Heinz, A , Kathmann, N, et al. Detection of visual events along the apparent motion trace in patients with paranoid schizophrenia. Psychiatry Res. (2012) 198:216–23. doi: 10.1016/j.psychres.2012.03.006
45. Kraguljac, NV , Mcdonald, WM , Widge, AS , Rodriguez, CI , Tohen, M , and Nemeroff, CB . Neuroimaging Biomarkers in Schizophrenia. Am J Psychiatry. (2021) 178:509–21. doi: 10.1176/appi.ajp.2020.20030340
46. Murray, JD , and Anticevic, A . Toward understanding thalamocortical dysfunction in schizophrenia through computational models of neural circuit dynamics. Schizophr Res. (2017) 180:70–7. doi: 10.1016/j.schres.2016.10.021
47. Mccutcheon, RA , Krystal, JH , and Howes, OD . Dopamine and glutamate in schizophrenia: biology, symptoms and treatment. World Psychiatry. (2020) 19:15–33. doi: 10.1002/wps.20693
48. Jones, HE , Grieve, KL , Wang, W , and Sillito, AM . Surround suppression in primate V1. J Neurophysiol. (2001) 86:2011–28. doi: 10.1152/jn.2001.86.4.2011
49. Mikami, A . Direction selective neurons respond to short-range and long-range apparent motion stimuli in macaque visual area MT. Int J Neurosci. (1991) 61:101–12. doi: 10.3109/00207459108986278
50. Angelucci, A , Levitt, JB , and Lund, JS . Anatomical origins of the classical receptive field and modulatory surround field of single neurons in macaque visual cortical area V1. Prog Brain Res. (2002) 136:373–88. doi: 10.1016/s0079-6123(02)36031-x
51. Muckli, L , Kohler, A , Kriegeskorte, N , and Singer, W . Primary visual cortex activity along the apparent-motion trace reflects illusory perception. PLoS Biol. (2005) 3:e265. doi: 10.1371/journal.pbio.0030265
53. Moutoussis, K , and Zeki, S . Motion processing, directional selectivity, and conscious visual perception in the human brain. Proc Natl Acad Sci U S A. (2008) 105:16362–7. doi: 10.1073/pnas.0802867105
54. Sterzer, P , Haynes, JD , and Rees, G . Primary visual cortex activation on the path of apparent motion is mediated by feedback from hMT+/V5. NeuroImage. (2006) 32:1308–16. doi: 10.1016/j.neuroimage.2006.05.029
55. Kaplan, E , and Shapley, RM . The primate retina contains two types of ganglion cells, with high and low contrast sensitivity. Proc Natl Acad Sci U S A. (1986) 83:2755–7. doi: 10.1073/pnas.83.8.2755
56. Silverstein, SM , Keane, BP , Wang, Y , Mikkilineni, D , Paterno, D , Papathomas, TV, et al. Effects of short-term inpatient treatment on sensitivity to a size contrast illusion in first-episode psychosis and multiple-episode schizophrenia. Front Psychol. (2013) 4:466. doi: 10.3389/fpsyg.2013.00466
57. Keane, BP , Silverstein, SM , Wang, Y , and Papathomas, TV . Reduced depth inversion illusions in schizophrenia are state-specific and occur for multiple object types and viewing conditions. J Abnorm Psychol. (2013) 122:506–12. doi: 10.1037/a0032110
58. Qian, J , and Yazdanbakhsh, A . A Neural Model of Distance-Dependent Percept of Object Size Constancy. PLoS One. (2015) 10:e0129377.
Keywords: top-down feedback, lateral connectivity, visual receptive fields, thalamocortical networks, visual hierarchy, contrast-contrast illusion, apparent motion illusion
Citation: Zhu J, Zikopoulos B and Yazdanbakhsh A (2023) A neural model of modified excitation/inhibition and feedback levels in schizophrenia. Front. Psychiatry. 14:1199690. doi: 10.3389/fpsyt.2023.1199690
Edited by:
Sou Nobukawa, Chiba Institute of Technology, JapanReviewed by:
Brian P. Keane, The State University of New Jersey, United StatesTeijiro Isokawa, University of Hyogo, Japan
Copyright © 2023 Zhu, Zikopoulos and Yazdanbakhsh. This is an open-access article distributed under the terms of the Creative Commons Attribution License (CC BY). The use, distribution or reproduction in other forums is permitted, provided the original author(s) and the copyright owner(s) are credited and that the original publication in this journal is cited, in accordance with accepted academic practice. No use, distribution or reproduction is permitted which does not comply with these terms.
*Correspondence: Arash Yazdanbakhsh, yazdan@bu.edu; Basilis Zikopoulos, zikopoul@bu.edu