 Graeme Stephens1*
 Olga Kalashnikova1
 Jake J. Gristey2,3
 Peter Pilewskie4
 David R. Thompson1Xianglei Huang5
 Matthew Lebsock1Sebastian Schmidt4
- 1Jet Propulsion Laboratory, California Institute of Technology, Pasadena, CA, United States
- 2Cooperative Institute for Research in Environmental Sciences, University of Colorado, Boulder, CO, United States
- 3NOAA Chemical Sciences Laboratory, Boulder, CO, United States
- 4Laboratory for Atmospheric and Space Physics, University of Colorado, Boulder, CO, United States
- 5Department of Climate and Space Sciences and Engineering, The University of Michigan, Ann Arbor, MI, United States
This paper introduces the aerosol, clouds, convection and precipitation (ACCP) program that is currently in the process of defining a number of measurement objectives for NASA that are to be implemented toward the end of the current decade. Since a (solar) visible-shortwave infrared (VSWIR) spectrometer is being considered as part of the ACCP architecture, illustrations of the different ways these measurements will contribute to this program and how these measurements can be expected to advance the science objectives of ACCP are highlighted. These contributions range from 1) constraining cloud radiative process and related estimates of radiative fluxes, 2) scene discrimination, 3) providing aerosol and cloud optical properties, and 4) providing other enhanced information such as the phase of water in clouds, and total column water vapor. The spectral measurements also offer new capabilities that will further enhance the ACCP science such as the discrimination of dust aerosol and the potential for the vertical profiling cloud droplet size in shallow clouds. The areas where the maturity of approaches is lacking is also highlighted as a way of emphasizing research topics to be a focus in the coming years.
Introduction
The reflection of sunlight by Earth to space is a process that exerts a basic control on Earth’s climate through the way Earth differentially scatters and absorbs solar energy from place to place which is a basic forcing of the transport of heat poleward. The scattered sunlight also influences Earth’s climate through the processes it shapes in the form of feedbacks that principally control the responses to external forcings of the climate system. Insights about these processes are encoded in the spectral nature of the reflected solar radiation to space. On a very gross Earth-system level, the relevance of spectrally resolved measurements of reflected sunlight is underscored in the example of Figure 1fig1 from Stephens et al. (2015). It offers a commentary on an observational quirk about the broadband albedo of planet Earth in that each hemisphere reflects exactly the same amount of sunlight (von der Haar and Suomi, 1969; Stephens et al., 2015). This curious symmetry is not replicated by current state of the art Earth system models (e.g Haywood et al., 2016; Stephens et al., 2016). While the total energy reflected back to space from each hemisphere of Earth is the same, the details are quite different between hemispheres as revealed in the spectral nature of this reflected energy observed by SCHIAMACHY shown in Figure 1. The Northern Hemisphere has less visible reflection due to a smaller cloud contribution but more SWIR reflection from greater land areas. Conversely the Southern Hemisphere reflects proportionally more at shorter visible wavelengths than in the SWIR do to the larger cloud cover of that hemisphere. These spectral differences hint at how both land and clouds contribute in different ways to the reflection by each hemisphere, hinting at a broad insight on processes that govern the planetary albedo. This is a simple illustration of the way spectral measurements provide a way of deciphering how different reflecting surfaces and scattering media contribute to the total spectrally integrated energy reflected to space.
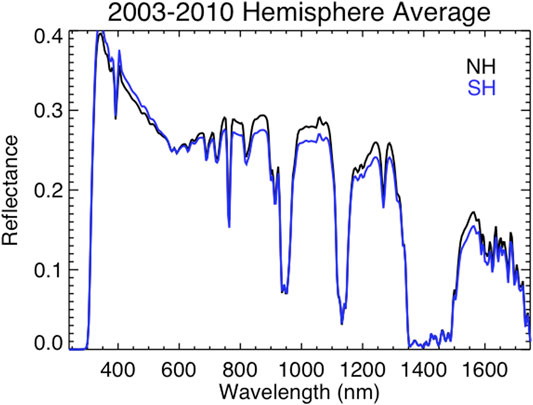
FIGURE 1. The hemispheric averaged spectral reflection measured by SCIAMACHY that highlighting the nature of the difference in spectral reflection between these two hemispheres (adapted from Stephens et al. (2015)).
Also encoded in the spectral properties of reflected sunlight is important information about the scatterers themselves. The retrieval of cloud optical properties using measurements of reflected sunlight, for example, has a relatively long history (e.g. Stephens and Kummerow, 2007 and references therein) with the bi-spectral reflectance method of Twomey and Seton (1980) being mature and now applied to measurements across a number of different satellite sensors. Surface measurements of spectral transmittance have also been used to deduce properties of aerosol for more than a century (e.g. Stephens, 1994; O’Neil et al., 2003) while satellite measurements of spectral reflectance provide the means to deduce properties of aerosol, such as their optical properties classified in terms of fine and coarse mode over ocean (e.g. Kaufman et al., 1997; Levy et al., 2007; Wang et al., 2015) or over land (e.g. Yan et al., 2019; Yan et al., 2021). In addition, UV reflected radiation is sensitive to both aerosol scattering and absorption which makes it possible to deduce both total aerosol optical depth (AOD) and absorption properties expressed as single scattering albedo (Ahn et al., 2014). Still other important information lies in the spectral reflectance as described below.
The purpose of this paper is to expand on the different ways measurements of spectrally resolved VSWIR reflectances serve a number of emerging Earth science objectives in the coming decade. The paper begins with a brief introduction to the Aerosol, clouds, convection and precipitation (ACCP) program that is currently in the process of defining a number of measurement objectives for NASA to be implemented toward the end of the current decade. The full complement of sensor measurements planned for ACCP, and the advantages of combining the different information from these sensors, is not discussed in any detail and is to be a topic of a future paper. This paper focuses specifically on the different ways a VSWIR spectrometer that is being considered as part of the ACCP architecture is expected to contribute to this program and can be expected to advance the science objectives of ACCP. These range from 1) constraining cloud radiative process and related estimates of radiative fluxes described in more detail below in Top-of-Atmosphere Radiative Effects, 2) scene discrimination, 3) providing aerosol and cloud optical properties, and 4) providing other enhanced information such as the phase of water in clouds, total column water vapor (TCWV), particle size profiles in shallow clouds among other properties discussed.
The Aerosol, Clouds, Convection and Precipitation Designated Observable Program
The National Academies of Sciences, Engineering, and Medicine conducted the 2017–2027 decadal survey of Earth Science and Applications from Space and produce a series of recommendations in the report (NAS, 2018). This was the second such Earth science survey and it converged to a final, small set of science, applications and observing system priorities starting from a large number of community-provided inputs. Emerging from these were a set of five designated observables (DO’s) declared to be of highest priority for the decade and NASA has commenced in developing these observable recommendations into missions.
Observations of aerosol and separately observations of clouds and convection and precipitation were two recommended designated observables. It was recognized from the outset that science of each significantly overlap. Cloud feedback was a preeminent issue considered by the climate panel and convection and precipitation measurements were deemed essential to advance understanding and prediction of moist convection and its influence on weather and extremes. Observations of aerosol were also a high priority to climate science due to their influence on climate forcings as well as on clouds and precipitation. The relation between aerosol and air quality was further considered to be a pressing environmental risk.
The two designated observable recommendations, aerosol (A) and clouds, convection and precipitation (CCP), were subsequently combined into a single study (hereafter ACCP) to define the measurement strategy to advance the observations under these topic areas. ACCP is largely a process focused effort that has a number of integrative elements including, 1) a wider exploitation of the existing and planned instruments and satellites in the program of record (POR) particularly the spectral imagery from the current ring of geostationary satellites, 2) new spaceborne architectures framed around advanced spaceborne lidar and Doppler radar, 3) an active effort to develop multi-sensor approaches that combine supporting measurements from the active systems with measurements from a polarimeter, the VSWIR spectrometer, and microwave radiometer, 4) an integrated sub-orbital program and 5) a desire to link directly to modeling and analysis systems. The program is defined around eight interconnected science objectives that focus on processes central to low cloud feedbacks (O1), high cloud feedbacks (O2), convective processes (O3), cold cloud and precipitation processes (O4), aerosol property (O5), aerosol process evolution (O6), and aerosol direct (O7) and indirect (O8) forcing.
The measurement approach of ACCP currently under development is formulated around active profiling capabilities provided by a high spectral resolution lidar (HSRL) and multi-frequency Doppler radar. These active sensors will continue the data records started by a number of NASA missions including CloudSat, CALIPSO, TRMM and GPM as well as the ESA mission EarthCARE (e.g. Illingworth et al., 2015).
Table 1 below offers an abbreviated overview of the principal geophysical variables that are to be derived from a VSWIR spectrometer, their relation to ACCP objectives and their relationship to other candidate ACCP instruments. A VSWIR spectrometer contributes to ACCP geophysical measurement capabilities in four distinct ways: 1) the spectra add information content to other observations where they overlap; 2) the spectrometer adds both swath and an imaging capability for both context and cloud property mapping; 3) they offer new potential capabilities highlighted in the examples of particle profiling below and 4) the spectral information offers an important way to constrain estimates of cloud broad band radiation fluxes and radiation kernels at a resolution much finer than that of the current program of record exemplified by CERES (e.g. Wielicki et al., 1996).
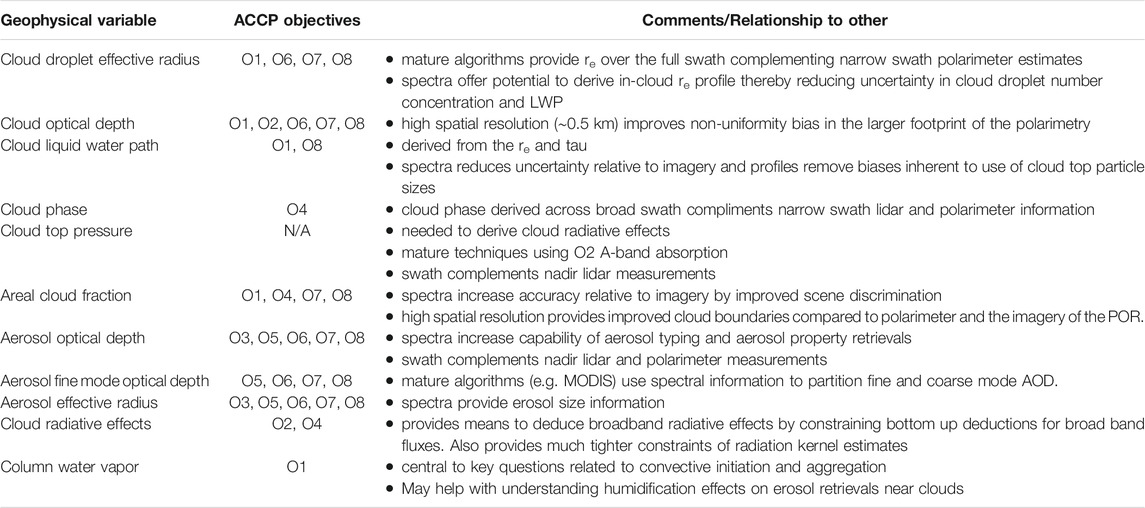
TABLE 1. Geophysical variables that are to be derived from solar spectrum and their relation to ACCP objectives.
VSWIR Spectrometry in the ACCP Era
Two very similar-in-capability spectrometer concepts were offered in response to a request for information that was solicited from the community. The concepts being considered are relatively mature. One has roots in design for a 6U cubesat application while the other is from a provider who has already demonstrated the measurements of spectral solar irradiance on a 6U cubesat (Figure 2). Spectral measurements of reflection have also been demonstrated with instruments on micro-satellites. Zhang et al. (2018), for example, describe the vicarious calibration of two spectrometers on two 50 kg microsatellites (SPARK-01 and 02). The credible expectation for ACCP is that a hyperspectral solar measurement implementation ought to be in the form of a small class sensor. In the coming years, the CLARREO pathfinder (CPF; Shea et al., 2020) plans to provide traceable, accurate spectra by direct solar calibration; see Kopp et al., (2017) against which other observing systems would be benchmarked. The characteristics of the proposed ACCP spectrometer is expected to largely duplicate those of the CPF.
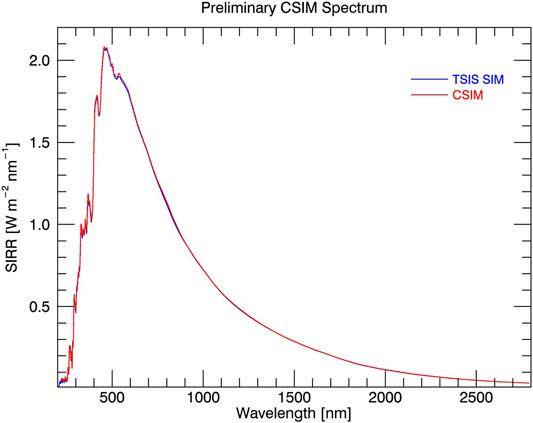
FIGURE 2. Early results from CSIM-FD comparing the solar spectral irradiance measured by both TSIS-1 and CSIM. Both instruments have their pre-launch spectral irradiance calibrations tied to a cryogenic radiometer. The preliminary agreement is with an absolute SSI differences <1% between 400 – 2,400 nm (from Stephens et al. (2020)).
Although the spectrometry being discussed in this paper has considerable space heritage, not all applications offer the same degree of ‘science maturity’, a point emphasized below especially in Top-of-Atmosphere Radiative Effects. Table 2 is a summary of like-sensors flown on Earth orbiting satellites, both current and planned. This table is not meant to be a complete review of all such sensors flown, for example its doesn't include OCO-class spectrometry. The characteristics of sensors already flown and expected to be in orbit in the coming ACCP decade are noted. It should be remarked that implementation of the measurement in the form of micro-sat or cube-sat sensors have much less heritage and how these sensors mature in the coming decade remains uncertain.
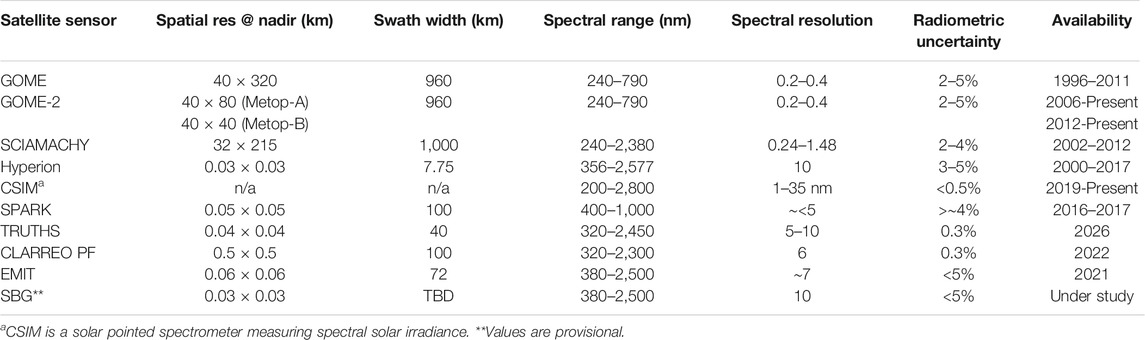
TABLE 2. VSWIR spectrometer systems either flown on or proposed for Earth orbiting satellites.
The Spectral Character of Earth’s Reflected Radiation
The following discussion provides background to highlight how different components of the Earth system are manifest in solar reflection spectra thereby hinting at how information about these components might be gleaned from measurements of such spectra and exploited in the ACCP era. Extracting this information in many cases is mature, being demonstrated either with observations obtained from sensors on present day orbiting satellites, spectrometers flown on aircraft observations, or both. In some other cases described, the information extraction is less mature, more heuristic in nature and requires further development in the coming years.
Earth’s Land Surface as a Source of Atmospheric Aerosols
The VSWIR spectral region carries rich information about surface composition, and airborne hyperspectral reflection measurements have been used in mineralogical exploration for decades (e.g. Kruse et al., 1993; Clark et al., 2003). It is no accident this measurement is a central tool of another recommended DO: the Surface Biology and Geology (SBG) investigation that targets observables spanning snow and glacier albedo, rock and soil properties, vegetation canopy chemistry, and much more (Schimel et al., 2020).
Knowledge of the mineral composition of atmospheric dust exemplifies the direct connection between the land surface and air advanced with hyperspectral reflection measurements. This knowledge is also essential to our understanding of climate forcing, dust downwind impacts on clouds and air-quality, and dust biogeochemical feedbacks and thus relevant to a range of ACCP goals. Dust mineralogical content may also provide clues for understanding the mechanisms behind dust variability and continental provenance (Sokolik et al., 2001). Conventional aerosol retrievals at a few selected wavelengths are designed for retrieving the aerosol optical depth and some information on the particle size (such as fine fraction or Angstrom exponent as noted above; Anderson et al., 2005; Levy et al., 2005; Levy et al., 2007; Chen et al., 2020). Multiangle and polarimetric retrievals add information on dust shape and wavelength-dependent refractive indices (Dubovik et al., 2019), however, the spectral resolution is not sufficient to determine actual dust mineral composition.
To underscore this point and the further potential relevance to ACCP, the spectral properties of different minerals known to represent the composition of dust are shown in Figure 3A. The measurement of these spectra is central to the Earth Surface Mineral Dust Source Investigation (EMIT) mission that seeks to quantify dust source emission from the surface (Green et al., 2020). As Figure 3B indicates the composition of airborne dust is, however, non-uniform exemplified by the large variability of estimated iron oxide fraction in dust and thus a priori not readily approximated with simple composition models as widely used today. Apart from their utility for geology or ecology, the unique spectra of surface materials in the VSWIR range, exploited by EMIT, provide powerful statistical constraints on measured radiance and form a backstop against which one can disambiguate atmospheric effects.
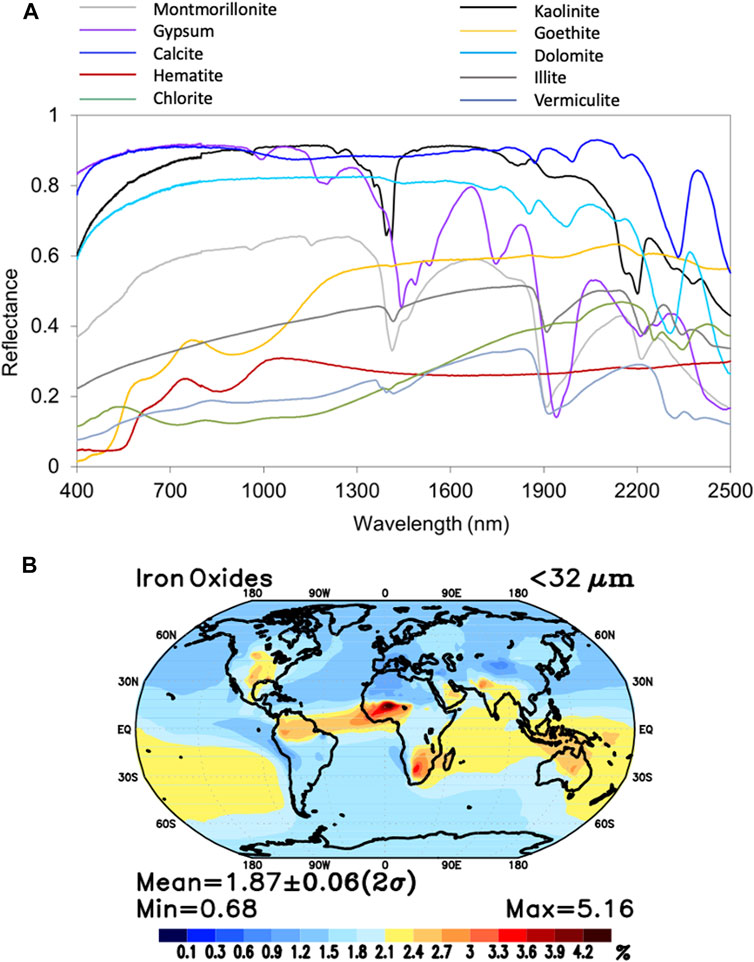
FIGURE 3. (A) The spectral structure of dust forming minerals. (B) The fractional contribution of iron oxides in dust.
Theoretically, smooth spectral scattering features of the light scattered by aspherical size-distributed atmospheric dust can be separated from the sharp spectral features that characterize the mineral absorption features of Figure 3A. The ability to determine the mineralogical composition of airborne dust has been demonstrated with hyperspectral Hyperion satellite observations of a dust storm near the Bodélé Depression in Chad (Chudnovsky et al., 2009; Chudnovsky et al., 2011), which used the longest part of the SWIR (2080–2,380 nm), in particular, where the atmosphere is transparent, optical properties are stable, and absorption features of hydroxyl-bearing minerals, sulfates, and carbonates are most pronounced.
Earth’s Atmosphere
Water Vapor
Atmospheric water vapor is of critical importance to most to the ACCP objectives, through its influence on clouds, convection as well as in modifying aerosol optical properties (e.g. Wu et al., 2018, Zu et al., 2019). High quality water vapor data products are currently available from many satellite sensors operating in various wavelength regions. Each sensor has its specific advantages and limitations in terms of spatio-temporal resolution, coverage, capability and instrument sensitivity. An extensive overview of satellite measurements of water vapor can be found in Schröder et al. (2018). Multi-band water vapor absorption is a dominant spectral feature of the SWIR spectrum and its presence has significantly shaped many remote sensing methods, either explicitly by using the absorption features, or implicitly by avoiding these features entirely. The retrieval of total column water vapor (TCWV) from SWIR reflectance measurements is one example where the absorption is used directly. The approach to estimate the TCWV can be regarded as mature, exemplified by the column water vapor products of MODIS (e.g. Gao and Kaufman, 2003) MERIS (Diedrich et al., 2015) and GOME (e.g. Grossi et al., 2015). These measurements are especially pertinent over land where microwave measurements fail and the information is also more decisively weighted to the boundary layer (e.g. Christi and Stephens, 2004) than are other column methods of water vapor retrieval. Another important advantage of the VSWIR measurement of TCWV is that very high horizontal resolution which provide mesoscale variability of the water vapor field, an advantage highlighted by the example of Figure 4.
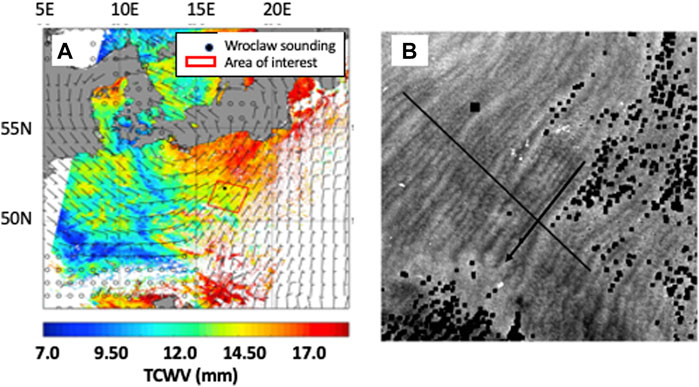
FIGURE 4. (A),left) MERIS TCWV field overlayed with ERA-Interim wind barbs computed from the mean boundary layer wind field (B), right) TCWV field for the area of interest as indicated by the red box in the panel to the left. Black areas in the right panel indicate cloudy regions for which no TCWV retrievals are performed (adapted from Henken et al. (2015)).
In preparing for the MERIS observations, Diedrich et al. (2015) developed a multi-band algorithm that they tested using MODIS data and demonstrated clearly that adding more spectral information from multiple water vapor bands improved known biases in the MODIS product limited only to a pair of channels. Gao and Goetz (1990) and Thompson et al. (2015) further illustrated how a more refined, better constrained and accurate estimate is possible when hyperspectral reflectance measurements of the shape of the H2O absorption bands are more tightly fitted against forward model calculations.
It is not difficult to appreciate the value of high-spatial-resolution boundary layer water vapor to the science objectives of ACCP as it is central to key questions related to convective initiation and aggregation, to cloud formation and to the definition of aerosol properties. For example, Figure 4 is a high-resolution MERIS TCWV field that corresponds to a high-pressure event occurring in May 9, 2008 over central Europe (Figure 4A) derived on ∼250 m spatial scale. Evident is the detection of horizontal convective rolls that appear as quasi-parallel bands of alternating low- and high-TCWV (Figure 4B). This distinct PBL moisture structure consists of bands of high humidity that align parallel to the boundary layer winds obtained from a numerical weather prediction model and radiosonde data. Closer examination further reveals that cloud streets observed in the east extend along bands of maximum TCWV.
Aerosol
Methods for retrieving aerosol properties from spectral reflection measurements have a long history (e.g. Kaufman et al., 1997; Remer et al., 2005; Levy et at., 2005). Li et al. (2009) provide a comprehensive review of different methods for estimating aerosol optical depth. Most methods require significant amounts of spectral information beyond that used for aerosol property retrieval alone (e.g. Lyapustin et al., 2018). For example, MODIS aerosol algorithms require inputs from several spectral channels to define the scene. Reflection measurements in the 1.38 μm water band are used to test for the presence of high thin cirrus that, when unaccounted for, contaminates retrievals. Dust is further identified using reflection differences between at 0.47 and 0.66 μm and aerosol properties are then derived by matching reflections in several other spectral channels to model-based look up tables (e.g Remer et al., 2005). Clear sky screening of the observations, critical to any aerosol retrieval method, also relies on spectral analyses as does radiance corrections applied to clear sky radiances, each important components of any surface property retrieval approach to be used in SBG.
Analysis of data collected from recent airborne field programs like the FIREX-AQ 2019 is ongoing and information content assessments of hyperspectral measurements applied to selected aerosol types, such as dust and smoke, now exist. Furthermore, methods to retrieve AOD of different species within the same airmass have been tested against airborne observations (e.g. Mauceri et al., 2019). Information content analysis of Hou et al. (2017) demonstrates that there are multiple degrees of freedom in the signal for retrieval of aerosol properties, and that this information is improved with observations accumulated over time with repeat observations that further constrain surface reflectance. Three examples are presented to highlight these developments.
1) An example of smoke observed during the recent FIREX-AQ 2019 field campaign by the AVIRIS-C instrument (Green et al., 1998) onboard of the high-altitude ER-2 aircraft is demonstrated in Figure 5. A hyperspectral retrieval of aerosol optical depth (AOD) on the right is shown together with RGB imagery of smoke on the left, and simultaneously retrieved surface properties under the smoke in the center of the figure. The solution for AOD and Surface Reflectance is based on a simultaneous model inversion of atmospheric and surface properties (Thomson et al., 2015; Thomson et al., 2019), permitting aerosol retrievals at high spatial resolution (<30 m) over heterogeneous terrain without the need for special scene content such as shadowed or dark vegetation pixels. The uncertainties of simultaneous AOD and surface reflectance retrievals of AVIRIS-C observations collected during the FIREX-AQ have been evaluated and the initial validation shows a good agreement with collocated AERONET observations.
2) An example of the information coded in hyperspectral measurements of African dust is highlighted in Figure 6 taken from the study of Xu et al. (2017). Shown are spectral Jacobians (the spectral reflection sensitivity) of dust optical depth associated with four different particle size ranges of dust (refer to caption). The reflection spectra exhibit distinct magnitude sensitivities and spectral variability among different size bins. The spectral sensitivities associated with these different size ranges of dust merely underscores the point that information about dust particle size exists in these measurements.
3) Su et al. (2020) demonstrate how spectral information constrains surface albedo and thus enhance retrievals of aerosol optical depth over reflecting surfaces. They apply a machine learning model to estimate surface albedo in a visible region derived from reflection measurements at longer near infrared wavelengths that then results in a significantly improved ability to the retrieve of AOD over land.
4) Mauceri et al. (2019) also demonstrate the utility of hyperspectral imagery applied to a machine learning application of aerosol retrievals and aerosol typing. Eerosol optical thicknesses for brown carbon, dust and sulfate aerosols were shown to be derived from hyperspectral imagery acquired by the AVIRIS-NG instrument. The extraction of aerosol information from these measurements requires no a priori information about surface albedo or atmospheric state, in many ways similar to Su et al. (2020). The model, a neural network, was trained on atmospheric radiative transfer simulations with varying aerosol concentration and type, surface albedo, water vapor and viewing geometries. Mauceri et al. were able to distinguish and retrieve AOD of each component with a standard error of better than ±0.05 and used AVIRIS-NG imagery from a recent campaign over India to demonstrate its performance under high and low aerosol loadings and different aerosol types (Figure 7). As expected, retrieval performance was degraded when using fewer wavelengths and increased measurement uncertainty. Agreement with independent measurements (MODIS and AERONET) yielded an RMS closer to 0.1, which included errors in these independent datasets as well as discrepancies in spatiotemporal overlap. A related study by Thompson et al. (2019) adopted a similar palette of three aerosol types assumed in retrievals using AVIRIS-NG data also obtained during a campaign in India. Their estimates of total AOT matched in-situ and remote observations across a wide range of aerosol loads, confirming the performance of the Mauceri et al. study. Finally, field data from the FireX AQ campaign has confirmed sensitivity to optical properties in scenes where the aerosol compositions were well understood (Brodrick et al., 2021).
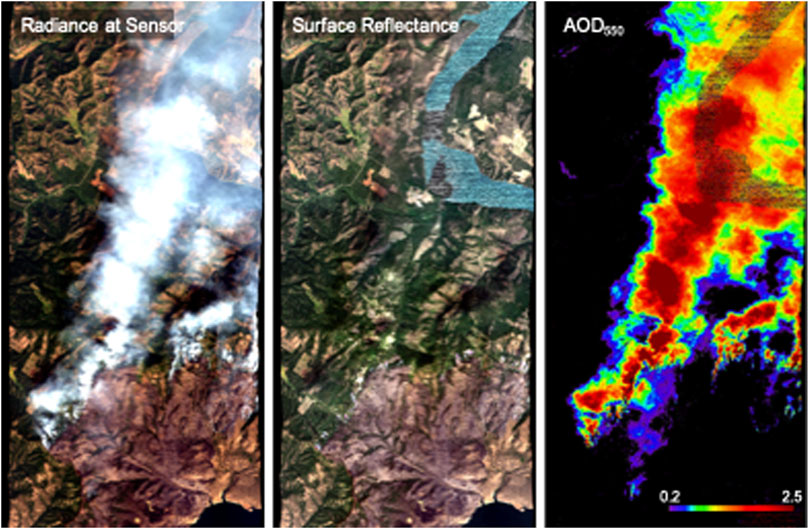
FIGURE 5. AVIRIS-C data acquired over the Williams Flat Fire, August 2019, demonstrating spectroscopic aerosol measurement at high spatial resolution over heterogeneous terrain. Image courtesy Philip G. Brodrick (Left) Visible radiance channels (Center) Estimated surface reflectance (Right) Estimated aerosol optical depth at 550 nm.
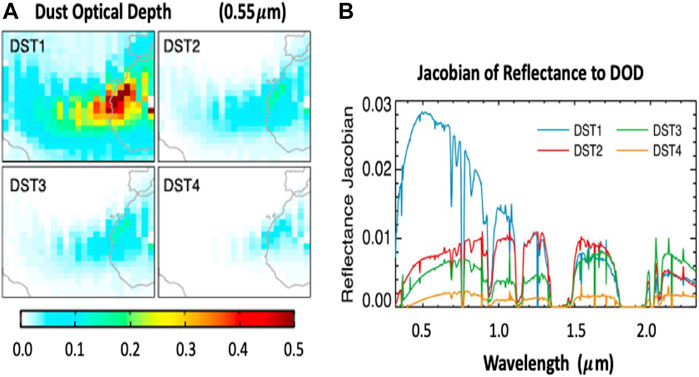
FIGURE 6. (A) The optical depth of simulated African dust outbreak over the Atlantic in four size bins ranging 0.1–1.0 μm DST1), 1.0–1.8 μm (DST2), 1.8–3.0 μm (DST3), and 3.0–6.0 μm (DST4) (B) Averaged Jacobians of reflection spectra associated with the case of (A) (after Xu et al., 2017).
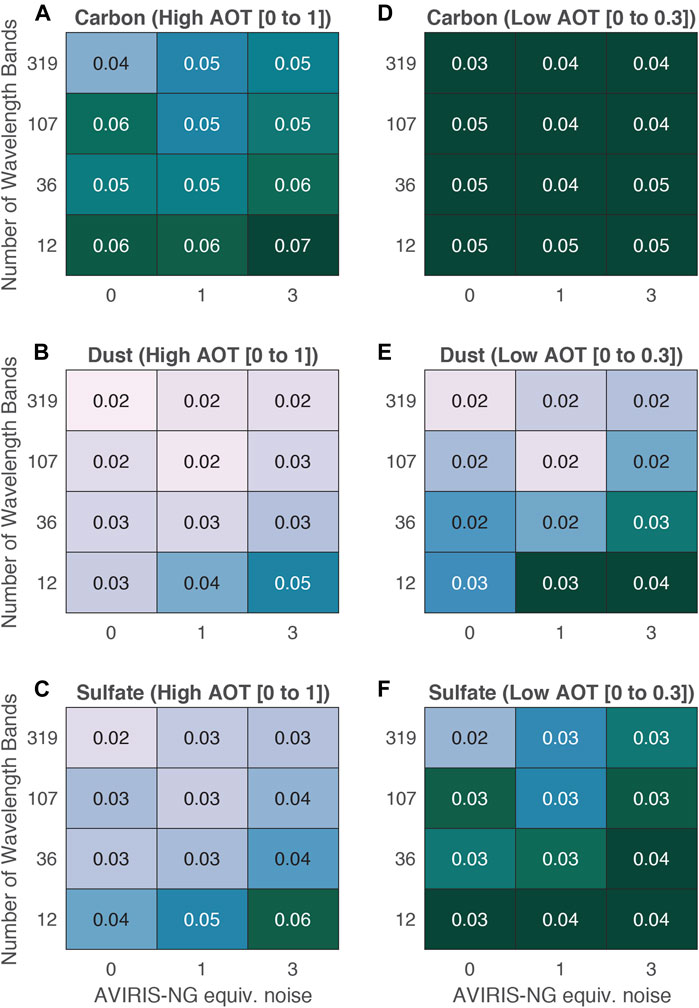
FIGURE 7. Standard error for retrieved AOT of 12 individually trained neural networks with varying wavelength bands and a varying amount of simulated AVIRIS-NG equivalent noise from the test set. (A–C) show the standard error when AOT is varied between 0 and 1. (D–F) show the standard error for AOT between 0 and 0.3 (Mauceri et al. (2019).
Clouds
The spectral reflection by clouds, especially when viewed through the lens of hyperspectral VSWIR measurements, contains a diverse range of information described below. The study of Gristey et al. (2019) who analyzed both global SCIAMACHY observations and SCIAMACHY simulated observations offers a general context for understanding cloud influences on these spectra. Figure 8 is an example taken from that study and shows spectra clustered according to surface types (Figure 8A) and cloud types (Figure 8B). Absent broad-band measurements, these cloud spectra hint the value for spectra of this type for defining the broadband reflection from clouds (described below in Top-of-Atmosphere Radiative Effects) and, more importantly, how this broadband information changes as cloud properties change. Figure 8 also hints at the potential wide range of properties that might possibly be gleaned from these spectra. Specifically, the different spectral character between ice and water clouds, evident especially around the 1.6 μm ‘window,’ discriminates water from ice and is the effective basis for cloud phase detection as described below. Reflection around the oxygen A-band (∼0.76 μm) has well understood signatures of cloud top height changes (eg. Fischer and Grassl, 1991). The spectra themselves effectively discriminate clear sky from cloudy sky scenes especially in marginal cases, an observation that has been appreciated for some time and used in modern cloud clearing methods. Water vapor absorption, apparent in these spectra, can also be used to extract total column water vapor over land as described above, and the water vapor absorption around the 1.38 μm water vapor band provides a method not only for detecting high thin clouds but also in deducing profiles of ice cloud properties (Baum et al., 2000, 2005; Meyer and Platnick, 2000; Barnard et al., 2008; Wang et al., 2012). The shape of the spectra, especially the visible portion contrasted against the SWIR portion of the spectra, not only offers bulk information about particle size but also information about the profile of particle size in shallow clouds (eg. King and Vaughan, 2012).
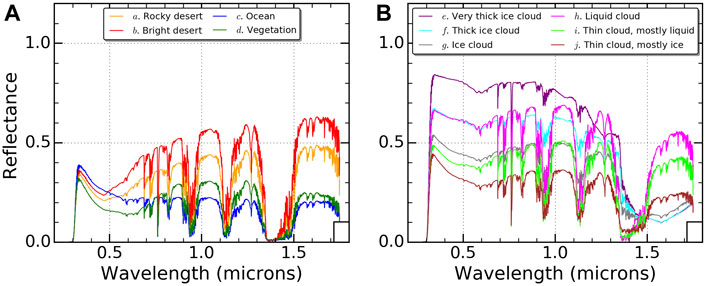
FIGURE 8. Cluster centroids of top-of-atmosphere reflectance spectra at a spatial scale of 1 km. Ten clusters are shown, separated into (A) surface clusters and (B) cloud clusters. The cluster centroids are identified from 90,917 computed SCIAMACHY-like reflectance spectra that are re-gridded to a 0.001- micron spectral resolution. Input for the computations is derived from A-Train satellite observations over West Africa in 2010 (Gristey et al., 2019).
Cloud -Aerosol Radiative Effects
Figure 9 presents spectra of downwelling irradiance measured below a cumulus cloud field adapted from Schmidt et al. (2009). Spectra immediately below cloud and in the gap between clouds are shown respectively as red and blue lines, and respective model simulated spectra are represented by symbols. These spectra are contrasted against a modeled clear sky spectrum without cloud influences (green). This specific contrast, expressed by the spectral difference in black, reveals the influence of neighboring clouds on the spectra measured between them, and on the aerosol radiative effects there. The spectral downwelling irradiance at visible wavelengths, less than about 700 nm, is reduced in the gap regions compared to the purely clear sky spectra. Although the model simulations point to the aerosol as being responsible for this reduction, the reduction is partially compensated by the increased diffuse downward flux from cloud sides. This increase in diffuse flux is evident at longer wavelengths where aerosol effects are small (e.g. wavelengths longer than about 1,000 nm). This set of measurements highlights how 3D cloud effects on radiative transfer confound the estimation of aerosol effects in complex cloudy environments. Although this particular example applies to downwelling fluxes, reciprocal changes to reflected fluxes will also occur. Clearly measurements of spectral transmittance in this example, and by implication spectral reflectance, provide a greater means to constrain estimates of erosol radiative effects in fields of clouds.
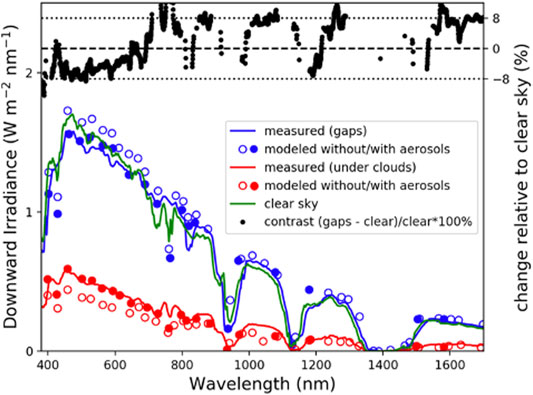
FIGURE 9. Spectra of measured and modeled downward irradiance (blue: below cloud gaps, red: below clouds). Solid green is the spectrum in clear air, and symbols represent modeled spectra with (solid) and without (open) erosol. The upper spectrum is the difference between the downwelling irradiance in gap regions and the clear sky cloud free spectrum, expressed as a percentage of the latter (modified from Schmidt et al. (2009)).
Quantitative Cloud Retrieval Examples
Many of the methods for deriving cloud properties from spectral reflectance data, such as the popular bi-spectral methods commonly applied to radiometer measurements like those provided by MODIS, are mature and the limitations on properties derived are, for the most part, well understood, although often difficult to quantify. As hinted at above, a number of different methods have been developed to deduce clouds properties from hyperspectral reflectance observations and some examples are presented below that also include a quantitative assessment of the retrieval performance based on in situ observations. The general improvement achieved using hyperspectral measurements for the standard cloud retrieval problem was quantified by Coddington et al. (2012) over the spectral range from 300 to 2,500 nm. The spectrally dependent Shannon information was derived across the spectrum and used to determine the cumulative information content in hyperspectral cloud retrievals for nine different cloud scenes, illustrating the expected improvements by added spectral coverage and improved resolution.
Bulk Cloud properties
Bulk cloud properties here refer to properties averaged or weighted over either an unspecified depth of cloud or over the entire cloud layer. Little vertical profile information is implied and by far the bulk of the cloud information from almost all passive methods fall into this category.
Cloud Phase
Spectral reflection differences between water and ice clouds in the region between 1.4 and 1.8 μm, noted previously (e.g. Figure 8), serves as the basis of cloud phase detection. This too is a mature topic dating back to studies in the 1980s (e.g. Pilewskie and Twomey, 1987) and now formerly implemented as a MODIS product (Baum et al., 2012). MODIS phase retrieval using limited near-infrared channels only is, however, limited in its capability (Riedi et al., 2010) and attempts to improve this information include adopting complementary thermal infrared bands. Riedi et al. 2010 developed a joint MODIS -POLDER phase discrimination approach also in an attempt to improve phase discrimination ambiguity and they argue this combination is superior to the discrimination provided by either method separately. Continuous hyperspectral measurements in the near-infrared offers a significant step forward improving on detection making phase discrimination somewhat trivial as the example of Figure 10 shows. Measurements from an airborne spectrometer, matched to co-located in situ microphysics observations (Figure 10A), demonstrate the clear relation between spectral indices of ice fraction using spectra between 1.4 and 1.8 μm and the appearance of ice (Figures 10B,C, Thompson et al., 2016).
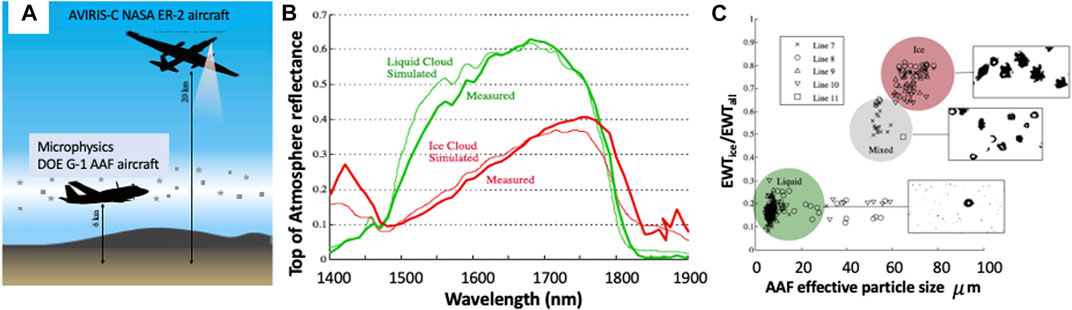
FIGURE 10. Cloud phase results from airborne measurements with (A) cloud particles measured at identical locations, less than 10 min apart by in situ high-speed imaging with remote imaging spectroscopy above. (B) Red (ice) and green (water) spectra plot of airborne spectrometer measurements of liquid and ice cloud reflectances. Shown are measured and simulated cloud spectra where details of simulations are described in Thompson et al. (2016). The details of the spectral reflectances are accurately reproduced. (C) The remotely estimated water fraction of ice (EWTice/EWTall), effectively ice to total water optical depth, derived from spectra of (B). Each point in the plot is a spectrum from one of five flight lines (“lines 7–11”). Image inserts show direct microscopic images of cloud particles obtained in situ, confirming the remote classification, adapted from Thompson et al. (2016).
Cloud Optical Properties
Measurements of spectral sunlight reflected by clouds are inputs for deducing cloud ‘optical’ properties most commonly expressed as the cloud optical depth (τ) and droplet or ice crystal effective radius re. This measurement approach has a relatively long history (e.g. refer to the review of Stephens and Kummerow, 2007). These particular properties are minimally required for addressing ACCP O1, O2 and O8 objectives. It was Twomey and Seton (1980) who introduced the present widely used bi-spectral reflectance method to estimate these two cloud variables and Nakajima and King (1990) expanded the method into an operational algorithm that is the basis of the MODIS cloud products now widely used. This bi-spectral method is based on measurements of narrow-band reflectances in two spectral regions or channels, one at visible wavelengths where reflection varies principally as a function of τ and a second located within the near infrared region in which solar radiation is both absorbed and scattered being influenced by both τ and re. The combination of measurements thus yields information on the pair of optical properties, τ and re. These essential aspects of the approach are conveyed in Figure 11 taken from the study of King and Vaughan (2012) showing the spectral distribution of Shannon information content as defined by Rodgers (1998). The Figure 11B expresses the initial information content above that of some a priori knowledge associated with cloud top effective particle size rt, cloud base particle size rb and optical thickness τc for a specific cloud state of rt = 10 μm, rb = 5 μm, τc = 15, a solar zenith angle of 30o, nadir viewing, a standard tropical atmosphere and 2% measurement error. Spectral regions outside the water vapor absorption bands where single scatter albedo ϖ0 is at a minimum (Figure 11A), like the spectral region between 2.1–2.4 μm, offer the most information about rt whereas the regions where ϖ0 ≈ 1 possess most information about τc. There are a number of confounding issues inhernet to the bi-spectral approach, such as ambiguities introduced by 3D radiative transfer effects and drizzle (Zhang et al., 2012) and the extent hyperspectal information helps address these issues will be topics of future research.
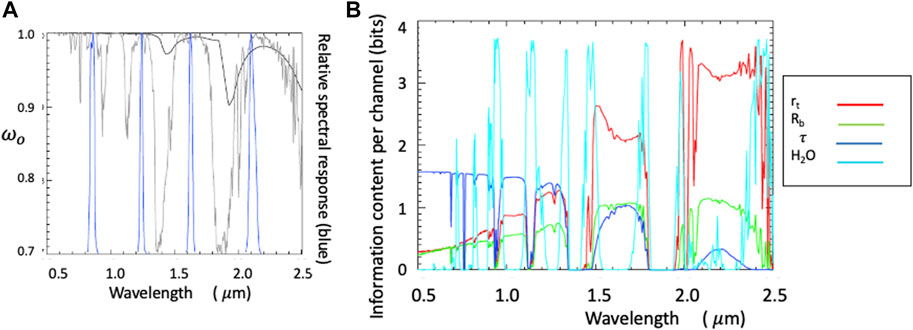
FIGURE 11. (A) Single scattering albedo of a gamma droplet size distribution with re = 10 μm and effective variance = 0.1 (black line). Also plotted are the relative spectral response curves of the MODIS channels centered on 0.8, 1.2, 1.6, 2.1and 3.7 μm (blue lines) and the atmospheric transmission of a standard tropical atmosphere (gray line) (B) Shannon information content of hyperspectral reflectances applied to selected cloud properties (cloud top, base particle size optical depth and water vapor) where the information content is a measure of that which lies above a priori knowledge (after King and Vaughan, 2012).
Droplet Number Concentration Nc
Although a number of studies report on approaches to estimate Nc using spectral reflection measurements (e.g. Grosvernor et al., 2018), the approaches developed for this property have large inherent uncertainties being framed around a simple adiabatic model of cloud properties (e.g. Stephens et al., 2019). It is expected that the particle size profiling capability described below that is offered by hyperspectral measurements, especially when connected to radar observations that identify drizzle presence (e.g. Wood et al., 2012), would improve on these restrictive and empirical retrieval assumptions and thereby improve our ability to deduce Nc.
Cloud Profile Properties
Cloud Top Pressure (CTP)
Retrieval of cloud top pressure from measurements of sunlight reflected in the oxygen A-Band is mature, being supported by several theoretical studies (e.g. Fischer and Grassl, 1991; Kuze and Chance, 1994), analyses of airborne measurements (Henken et al., 2015), as well as to satellite measurements. MERIS on ENVISAT provided global A-band measurements and a number of validation efforts have been developed to support the MERIS CTP product. With OCO we now have measurements at much finer spectral resolution than available previously and are now able to assess and confirm the benefits of such higher spectral resolution previously posed theoretically.
Understanding the measurement approach and the expected performances of the different satellite systems is now well advanced. Figure 12 illustrates this point providing two different examples of spaceborne estimates of cloud top height. Figure 12A is a MERIS A-Band cloud top pressure retrieval assessed against matched under flights of an airborne lidar. The second example is that using the A-band measurements of OCO showing low cloud top pressure assessed in this case matched against CALIPSO lidar observations. The uncertainty of these CTP estimates is equivalent to about 200 m in both examples.
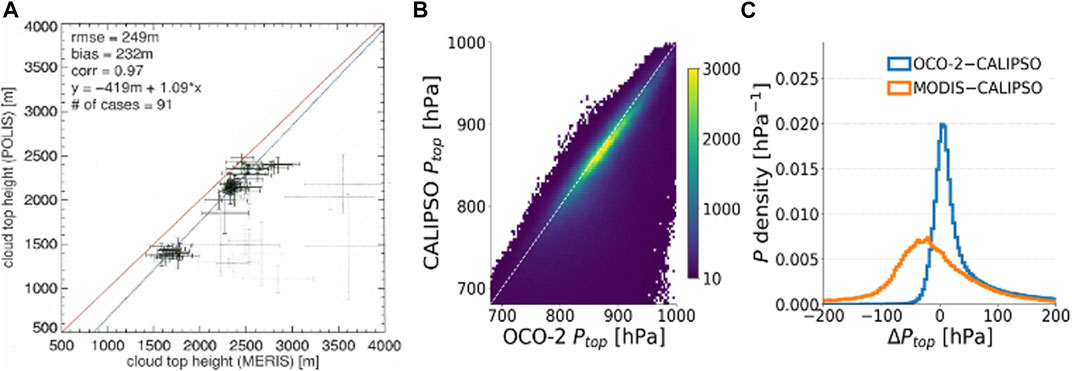
FIGURE 12. (A), left) Comparison of POLIS (airborne lidar) and MERIS cloud-top heights. Gray crosses mark cases with presence of cirrus clouds. The one-to-one line and the regression line are displayed in red and blue, respectively. Lager studies show the MERIS bias can be removed when other information is added (Henken et al., 2015) (B), middle and right) The CTP retrieval of low clouds from OCO verified against CALIPSO CTP and contrasted against the MODIS IR based estimate (right). The interquartile range of the difference is ∼30 hPa. The long tail are cases where CALIPSO identified high thin cloud above (Richardson et al., 2019).
Low Cloud Particle Size Profiles
A few studies have explored particle-size profile information primarily based on multi-spectral MODIS observations (e.g. Platnick, 2000; Chang and Li, 2002). These studies have explored this capability using the limited spectral capability of MODIS offering some insights on the capabilities. Despite these studies, the actual information about particle sizes within and through the cloud that is contained in spectral data is not well appreciated. The cloud base particle size information is one form of expression of this profile information and the results of Figure 11 suggest the near infrared spectra contain non-trivial information content relating to rb, provided the measurements have sufficient absolute accuracy. As Platnick (2000) had shown, this information maximizes in the region around 1.6 μm which is a where a significant proportion of photons penetrate to lower levels provided optical depth are not so large that reflection becomes invariant to changes in drop size (see also Nakajima et al., 2010a; Nakajima et al., 2010b). Since the mean optical depth of oceanic low clouds is less than 15 (e.g. Christensen et al., 2013), hyperspectral measurements potentially offer a significant capability for profiling droplet size in low clouds (see below) of τc<15. However, the accuracy needed to profile to cloud base according the King and Vaughn is order 1% and how much of the profile can be retrieved practically with VSWIR measurements from space will require more study.
King and Vaughan (2012) developed a retrieval of the profile of drop sizes and applied the method to airborne spectrometer measurements collected during VOCALS. These retrieved profiles were then evaluated against matched in situ profiles of cloud drop radius. Figure 13A is an example of two cases showing the capability for extracting information about microphysics profiles of low clouds. The in situ profiles each exhibit the typical increase of re with height whereas the MODIS like bi-spectral retrieval (indicated as TBLUT) corresponds to the droplet sizes near to cloud top and being a bulk property then applies through the entire layer. The difference between the constant profile vs. a retrieved profile, as highlighted in this figure, profoundly influences our ability to deduce liquid water path (LWP) from solar reflection measurements as highlighted in Figure 13B. When applied to all VOCALS-Rex clouds sampled by aircraft throughout the entire experiment the histogram of the percentage differences between the retrieved and in situ values for MODIS-like LWP retrievals vs. that using the profile-based retrievals made possible with hyperspectral observations reveals a significant LWP overestimate using MODIS. Since the MODIS-like retrieval (TBLUT) corresponds to the larger droplet sizes near cloud top, the total liquid water path is then overestimated by between 5 and 25% whereas the hyperspectral retrieval of liquid water path agreed with in situ LWP to within 3% in all but two cases. Because the results reveal that the magnitudes of this LWP biases vary considerably, they cannot be simply be corrected by applying some form of a priori, fixed adiabatic correction to MODIS-like retrievals. The improvement to LWP retrievals that profiles of particle size offers was also noted in the studies of Chen et al., 2008; Chen et al., 2011.
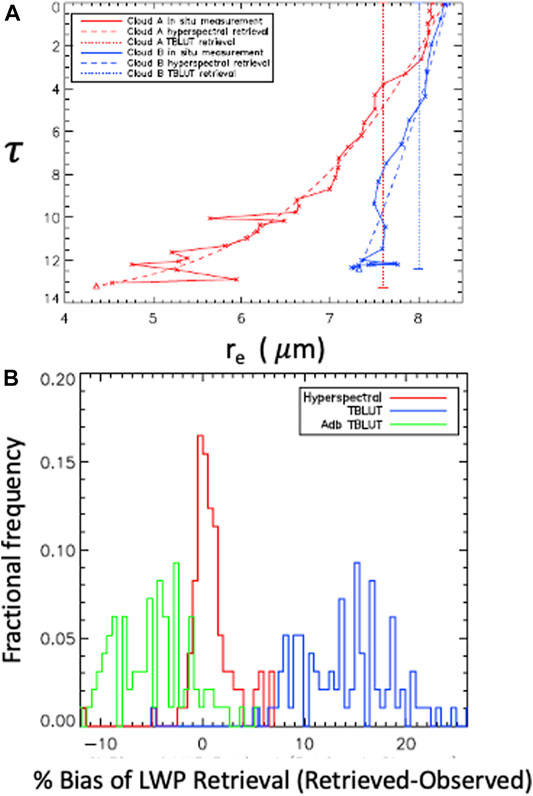
FIGURE 13. (A) Two examples of in situ measurements of cloud droplet radius profiles measured during VOCALS plotted with the corresponding hyperspectral retrieved profile and contrasted against a two channel MODIS-like retrieval (vertical lines). Cloud A has a total optical thickness of 13.3 and LWP of 58.0 gm−2. Cloud B has a total optical thickness of 12.4 and a LWP of 60.8 g m−2. (B) Histogram of the difference between retrieved and observed total liquid water path using a hyperspectral retrieval and estimations from a TBLUT retrieval using constant vertical profile (blue line) and adiabatic (green line) assumptions (King and Vaughan, 2012).
Top-of-Atmosphere Radiative Effects
The need to relate broad band radiative fluxes to the cloud and aerosol properties obtained from the measurements provided by different sensors being proposed for ACCP is central to a number of ACCP objectives. The desire to examine these relationships on the sub-kilometer to kilometer scale more characteristic of clouds and aerosol plumes and more typical of the cloud information to be provided by ACCP measurements, and also exemplified by the measurements discussed in relation to Figure 9, is a challenge given that the spatial coarseness of the available single footprint derived flux data of CERES and proposed for the Libera mission expected in the ACCP time frame is approximately 20 km.
The ACCP approach to address this challenge is not yet mature and advancing the approach will be the focus of much more intense research during the early phases of ACCP. The approach for shortwave fluxes revolves around use of the VSWIR spectral radiance measurements combined with radiative transfer calculations applied to inputs provided by cloud and aerosol profile information measured by the radar and lidar of ACCP on the cloud scale. A parallel approach for LW fluxes, not described here, will also be based on using LW spectral radiance measurements. The strategy will follow that first proposed by Barker et al. (2011) for EarthCARE and is to be tested and evaluated in greater depth using EarthCARE data as it becomes available after the launch planned for 2023. In contrast to the EarthCARE approach, which employs broadband radiances at nadir and two additional angles, the ACCP concept exploits the spectral radiance measurements at nadir as a way of tightly constraining the derived fluxes. In a broad sense, this overall approach that uses atmospheric profile input is analogous to that developed for the CloudSat flux product (Hendersen et al., 2013), although on a different spatial scale, as well as closely following the EarthCARE approach. Both have been shown to perform similarly to CERES observed fluxes at the top of atmosphere while also delivering vertical flux profiles and related radiative heating rates (Barker et al., 2015; Tornow et al., 2018). Construction of broad band shortwave fluxes from spectral radiances has also been demonstrated in a few studies, such as in Doelling et al., 2013 who used geostationary spectral radiances to derive CERES-like time resolved fluxes and Oyola et al., 2019 who provide a case study field experiment example combining airborne HSRL lidar measurements with spectral radiance imagery to quantify radiative properties of aerosol.
A very preliminary, albeit empirical example of how spectral radiances can be expected to constrain broad band flux estimates is provided by Figure 14A. This is an example of the construction of broadband fluxes from spectral MODIS data. The figure shows comparison of broadband SW fluxes, globally distributed and deduced using 11 VSWIR channels of MODIS compared to the collocated CERES broadband SSF fluxes. In producing this result, MODIS Aqua Level 1B calibrated radiances, sub-sampled at 5 km, were co-located with CERES SSF 4.0SW fluxes and with associated ancillary scene type information. A simple linear regression of these 11 channels of radiances, binned by fixed solar zenith angles (SZA), viewing zenith angles (VZA), and relative azimuthal angle (RAA), was created by regressing these combined channels against SSF broadband data. The training of this regression was based on one month of data and then applied to data collected for different times. The results of the reconstructed broadband fluxes from the empirical regression are then compared to the matched CERES SSF. These fluxes correspond to instantaneous reflected solar fluxes for the local time of approximately 1,330. The performance of this simple empirical regression, characterized by the RMSE of 23.7 W m−2, is similar to the flux consistency estimated from a MODIS-based narrow-to-broadband flux conversion (Su et al., 2015) and meets the requirements of ACCP attached to instantaneous solar fluxes. These requirements are currently in development and how they are arrived at is a topic of a future paper. The performance from this limited, and by design, simple example is consistent with other analysis developed for EarthCARE (Barker et al., 2011) and suggests spectral radiances will provide broadband fluxes that meet not only EarthCARE requirements but also the ACCP requirements currently under development. Much more work is needed to refine the approach and quantify uncertainties that arise across different spatial scales.
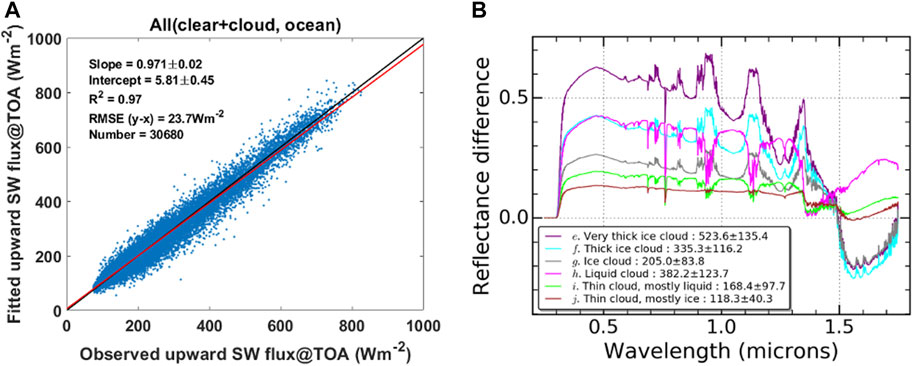
FIGURE 14. (A) A reconstructed broadband TOA solar flux from 11 MODIS channels (ordinate) compared to the CERES SSF flux (abscissa). The correlation is for one month of global data and applies to all scenes, both cloudy and clear. The fluxes correspond to instantaneous fluxes and the RMSE is similar in magnitude to the projected RMSE of the SSF flux itself. Results shown here is for all observations over oceans with SZA between 22o and 36o, VZA 12o and 19o, and RAA 2o and 6o. (B) The mean spectral SWCRE (all sky minus clear) for computed SCIAMACHY- like reflectance spectra belonging to each of the six cloud clusters presented in Figure 8B. To the right of the colon in the legend is the mean broadband SWCRE of the given cluster with one standard deviation (Wm−2). Positive SWCRE represents an increase in reflected solar radiation when clouds are present (adapted from Gristey et al. (2019)).
Not only does the integration of spectral data provide a meaningful way of deriving broadband radiances and then fluxes but more importantly spectral measurements offer a more direct way of differentiating responses of these fluxes to changes in aerosol and cloud properties. This is an essential step in providing meaningful observational constraints either on aerosol-radiative effects, as highlighted above in the discussion of Figure 9, or on radiative kernels which expresses the sensitivity of the fluxes to changes in given cloud properties and is an important tool in quantitative analyses of cloud feedback (e.g., Colman, 2003; Zelinka et al., 2012). Figure 14B underscores this point. It shows the spectral character of the shortwave cloud radiative effect (SWCRE) expressed in the form of both spectral reflectance differences and broadband flux differences both being differences between reflected radiation from cloudy and clear skies. As in the example of Figure 14A, the broadband SWCRE values (provided in the legend inset) are instantaneous at the time of satellite overpass based on an equator crossing (1,330 local time). The spectra shown differentiate the clusters of different cloud types identified previously in Figure 8 and reveal how differences between the clusters emerge more clearly in the spectra. This point is emphasized in a number of ways in Figure 14B. For example, the changes to SWCRE spectra at visible wavelengths, such as at 0.5 μm, reflects the sensitivity of the reflected flux to cloud optical depth. The high and low cloud example, labeled spectra f and h, are of clouds of the same optical depth and thus same visible SWCRE yet the broadband SWCRE differ by almost 50 W m−2. This underscores the point that factors other than optical depth obviously contribute to this broadband SWCRE difference. Consequently, the broadband SWCRE, and changes to it, cannot be expected to be reproduced from visible measurements alone. Specifically, the spectral structure of the SWCRE reveals an important sensitivity to height, through influences of water vapor absorption on it. The presence of a swing in reflectance around 1.6 μm between water and ice clouds is indicative of the influence of the thermodynamic phase of water on cloud particle scattering discussed above. These positive and negative SWCRE responses in different parts of the spectrum partly compensate in the broadband obscuring the sensitivities of these cloud properties in broadband fluxes. The broadband SWCRE from two distinctly different cloud regimes can thus appear similar, such as in the case of spectra g and i, respectively associated with ice cloud and thin liquid cloud, while possessing very different sensitivities to parameters that define them and the environment in which they form.
Summary
This paper discusses the different ways spectrally resolved measurements of reflected sunlight can be expected to serve a number of emerging Earth science objectives in the coming decade. The paper briefly introduced the aerosol, clouds, convection and precipitation (ACCP) program currently in the process of defining a number of measurement objectives for NASA to be implemented toward the end of the current decade. A (solar) VSWIR spectrometer is being considered as part of the ACCP architecture and the different ways these measurements can be expected to advance the science objectives of ACCP were summarized (Table 1) and examples of how the spectral measurements might specifically be used were presented. These potential uses range from:
1) Determining the composition of dust aerosol: Although multiangle and polarimetric measurements contain information on dust shape and wavelength-dependent refractive indices, the spectral resolution is not sufficient to determine actual dust mineral composition. Smooth spectral scattering features of the light scattered by aspherical, size-distributed atmospheric dust can be separated from the sharp spectral features that characterize the mineral absorption features in hyperspectral measurements which thus offers some capability for determining the mineralogical composition of dust simultaneously with underlying surface properties.
2) Determining total column water vapor: Water vapor absorption is a dominant spectral feature of the near infrared reflection spectrum. The retrieval of total column water vapor (TCWV) from reflectance measurements, over land where microwave measurements fail and for which the information is more decisively weighted to the boundary layer, makes spectral SWIR measurements particularly pertinent to ACCP. Studies have clearly demonstrated that fitting of spectral SWIR information from multiple water vapor bands significantly improves on biases in TCWV products derived from a much more limited channel method.
3) Cloud properties and profiles of cloud microphysics: Existing methods for deriving cloud properties from spectral reflectance data, such as the popular bi-spectral methods commonly applied to radiometer measurements provided by MODIS, are mature and can be readily adopted to spectral VSWIR measurements of the type being proposed for ACCP. The advantage of more spectrally continuous hyperspectral measurements, however, extends beyond significant improvement on bulk layer information, including improved estimates of cloud phase (Cloud Phase) and more advanced information about the profile of cloud properties. This in turn directly improves estimates of cloud water (and ice) content properties (Figures 13A,B).
4) Radiative fluxes and radiative kernels: Although spectral measurements will provide important constraints to estimates of broadband fluxes reflected by clouds and aerosol on the sub-kilometer scale more typical of clouds, much more work is needed to mature the approach pioneered under EarthCARE and is being adopted for ACCP including research to quantify the expected errors, which will undoubtedly arise not only from 3D effects at such a small scale but also from other effects. The sensitivity of radiative fluxes to changes in cloud and aerosol properties on these same scales, critical in studies of aerosol radiative effects and cloud feedbacks, are also potentially better resolved in spectra of reflectances than in the broadband fluxes (refer to discussions of Figures 9, 14). Quantifying these sensitivities is an essential step in providing meaningful observational constraints either on aerosol-radiative effects, as highlighted above in the discussion of Figure 9, or on radiative kernels which expresses the sensitivity of the fluxes to changes in given cloud properties and is a main factor in quantitative analyses of cloud feedback.
Author Contributions
The corresponding author wrote the paper, assimilated information provided by co-authors Co-authors provided inputs to different sections of the paper and provided some figures.
Conflict of Interest
The authors declare that the research was conducted in the absence of any commercial or financial relationships that could be construed as a potential conflict of interest.
Acknowledgments
Aspects of this work were performed at the Jet Propulsion Laboratory, California Institute of Technology, under a contract 80NM0018D004 with the National Aeronautics and Space Administration.
References
Ahn, C., Torres, O., and Jethva, H. (2014). Assessment of OMI Near‐UV Aerosol Optical Depth Over Land. J. Geophys. Res. Atmos. 119, 2457–2473. doi:10.1002/2013JD020188
Anderson, T. L., Wu, Y., Chu, D. A., Schmid, B., Redemann, J., and Dubovik, O. (2005). Testing the MODIS Satellite Retrieval of Aerosol Fine-Mode Fraction. J. Geophys. Res. 110, D18204. doi:10.1029/2005JD005978
Barker, H. W., Jerg, M. P., Wehr, T., Kato, S., Donovan, D. P., and Hogan, R. J. (2011). A 3D Cloud-Construction Algorithm for the EarthCARE Satellite Mission. Q.J.R. Meteorol. Soc. 137, 1042–1058. doi:10.1002/qj.824
Barker, H. W., Cole, J. N. S., Domenech, C., Shephard, M. W., Sioris, C. E., Tornow, F., et al. (2015). Assessing the Quality of Active-Passive Satellite Retrievals Using Broad‐band Radiances. Q.J.R. Meteorol. Soc. 141, 1294–1305. doi:10.1002/qj.2438
Barnard, J., Long, C., Kassianov, E., McFarlane, S., Comstock, J., Freer, M., et al. (2008). Development and Evaluation of a Simple Algorithm to Find Cloud Optical Depth with Emphasis on Thin Ice Clouds. Open Atmos. Sci. J. 2, 46–55. doi:10.2174/1874282300802010046
Baum, B. A., Heymsfield, A. J., Yang, P., and Bedka, S. T. (2005). Bulk Scattering Properties for the Remote Sensing of Ice Clouds. Part I: Microphysical Data and Models. J. Appl. Meteorol. 44, 1885–1895. doi:10.1175/jam2308.1
Baum, B. A., Kratz, D. P., Yang, P., Ou, S. C., Hu, Y., Soulen, P. F., et al. (2000). Remote Sensing of Cloud Properties Using MODIS Airborne Simulator Imagery during SUCCESS: 1. Data and Models. J. Geophys. Res. 105, 11767–11780. doi:10.1029/1999JD901089
Baum, B. A., Menzel, W. P., Frey, R. A., Tobin, D. C., Holz, R. E., Ackerman, S. A., et al. (2012). MODIS Cloud-Top Property Refinements for Collection 6. J. Appl. Met. Climatol. 51, 1145–1163. doi:10.1175/JAMC-D-11-0203.1
Brodrick, P. G., Thompson, D. R., Garay, M., and Kalashnikova, O. V. (2021). Simultaneous Characterization of Wildfire Smoke and Surface Properties with Imaging Spectroscopy during the FIREX-AQ Field Campaign. J. Geophys. Res. - Atmos. doi:10.1002/essoar.10506794.1
Chang, F.-L., and Li, Z. (2002). Estimating the Vertical Variation of Cloud Droplet Effective Radius Using Multispectral Near-Infrared Satellite Measurements. J. Geophys. Res. 107 (D15), JD000766. doi:10.1029/2001JD000766
Chen, R., Chang, F., Li, Z., Ferraro, R., and Weng, F. (2008). Impact of the Vertical Variation of Cloud Droplet Size on the Estimation of Cloud Liquid Water Path and Rain Detection. J. Atmos. Sci. 64, 3843–3853. 10.1175/2007JAS2126.1
Chen, R., Li, Z., Kuligowski, R. J., Ferraro, R., and Weng, F. (2011). A Study of Warm Rain Detection Using A-Train Satellite Data. Geophys. Res. Lett. 38, 6217. doi:10.1029/2010GL046217
Chen, X., de Leeuw, G., Arola, A., Liu, S., Liu, Y., Li, Z., et al. (2020). Joint Retrieval of the Aerosol Fine Mode Fraction and Optical Depth Using MODIS Spectral Reflectance over Northern and Eastern China: Artificial Neural Network Method. Remote Sensing Environ. 249, 112006. doi:10.1016/j.rse.2020.112006
Christensen, M. W., Stephens, G. L., and Lebsock, M. D. (2013). Exposing Biases in Retrieved Low Cloud Properties from CloudSat: A Guide for Evaluating Observations and Climate Data. J. Geophys. Res. Atmos. 118, 120–121. doi:10.1002/2013JD020224
Christi, M. J., and Stephens, G. L. (2004). Retrieving Profiles of Atmospheric CO2 in Clear Sky and in the Presence of Thin Cloud Using Spectroscopy from the Near and Thermal Infrared: A Preliminary Case Study. J. Geophys. Res. 109, 58. doi:10.1029/2003JD004058
Chudnovsky, A., Ben-Dor, E., Kostinski, A. B., and Koren, I. (2009). Mineral Content Analysis of Atmospheric Dust Using Hyperspectral Information from Space. Geophys. Res. Lett. 36, 22. doi:10.1029/2009GL037922
Chudnovsky, A., Kostinski, A., Herrmann, L., Koren, I., Nutesku, G., and Ben-Dor, E. (2011). Hyperspectral Spaceborne Imaging of Dust-Laden Flows: Anatomy of Saharan Dust Storm from the Bodélé Depression. Remote Sensing Environ. 115 (4), 1013–1024. doi:10.1016/j.rse.2010.12.006
Clark, R. N., Swayze, G. A., Eric Livo, K., Kokaly, R. F., Sutley, S. J., Brad Dalton, J., et al. (2003). Imaging Spectroscopy: Earth and Planetary Remote Sensing with the USGS Tetracorder and Expert Systems. J.-Geophys.-Res. 108 (E12), 1847. doi:10.1029/2002JE001847
Coddington, O., Pilewskie, P., and Vukicevic, T. (2012). The Shannon Information Content of Hyperspectral Shortwave Cloud Albedo Measurements: Quantification and Practical Applications. J. Geophys. Res. 117, 771. doi:10.1029/2011JD016771
Colman, R. (2003). A Comparison of Climate Feedbacks in General Circulation Models. Clim. Dynam. 20865, 865–873. doi:10.1007/s00382-003-0310-z
Diedrich, H., Preusker, R., Lindstrot, R., and Fischer, J. (2015). Retrieval of Daytime Total Columnar Water Vapour from MODIS Measurements over Land Surfaces. Atmos. Meas. Tech. 8, 823–836. doi:10.5194/amt-8-823-2015
Doelling, D. R., Loeb, N. G., Keyes, D. F., Nordeen, M. L., Morstad, D., Nguyen, C., et al. (2013). Geostationary Enhanced Temporal Interpolation for CERES Flux Products. J. Atmos. Oceanic Technol. 30, 1072–1090. doi:10.1175/JTECH-D-12-00136.1
Dubovik, O., Li, Z., Mishchenko, M. I., Tanré, D., Karol, Y., Bojkov, B., et al. (2019). Polarimetric Remote Sensing of Atmospheric Aerosols: Instruments, Methodologies, Results, and Perspectives. J. Quant. Spectrosc. Radiat. Transfer 224, 474–511. doi:10.1016/j.jqsrt.2018.11.024
Fischer, J., and Grassl, H. (1991). Detection of Cloud-Top Height from Backscattered Radiances within the Oxygen A Band. Part 1: Theoretical Study. J. Appl. Meteorol. 30 (9), 1245–1259. doi:10.1175/1520-0450(1991)030<1245:docthf>2.0.co;2
Gao, B.-C., and Goetz, A. F. H. (1990). Column Atmospheric Water Vapor and Vegetation Liquid Water Retrievals from Airborne Imaging Spectrometer Data. J. Geophys. Res. 95 (D4), 3549–3564. doi:10.1029/JD095iD04p03549
Gao, B.-C., and Kaufman, Y. J. (2003). Water Vapor Retrievals Using Moderate Resolution Imaging Spectroradiometer (MODIS) Near-Infrared Channels. J. Geophys. Res. 108, JD003023. doi:10.1029/2002JD003023
Gristey, J. J., Chiu, J. C., Gurney, R. J., Shine, K. P., Havemann, S., Thelen, J.-C., et al. (2019). Shortwave Spectral Radiative Signatures and Their Physical Controls. J. Clim. 32, 4805–4828. doi:10.1175/JCLI-D-18-0815.1
Grosvenor, D. P., Sourdeval, O., Zuidema, P., Ackerman, A., Alexandrov, M. D., Bennartz, R., et al. (2018). Remote Sensing of Droplet Number Concentration in Warm Clouds: A Review of the Current State of Knowledge and Perspectives. Rev. Geophys. 56, 409–453. doi:10.1029/2017RG000593
Green, R. O., Mahowald, N., Ung, C., Thompson, D. R., Bator, L., Bennet, M., et al. (2020). The Earth Surface Mineral Dust Source Investigation: An Earth Science Imaging Spectroscopy Mission. IEEE Aerospace Conf. 2020, 1–15. doi:10.1109/AERO47225.2020.9172731
Green, R. O., Eastwood, M. L., Sarture, C. M., Chrien, T. G., Aronsson, M., Chippendale, B. J., et al. (1998). Imaging Spectroscopy and the Airborne Visible/Infrared Imaging Spectrometer (AVIRIS). Remote Sensing Environ. 65 (3), 227–248. doi:10.1016/S0034-4257(98)00064-9
Grossi, M., Valks, P., Loyola, D., Aberle, B., Slijkhuis, S., Wagner, T., et al. (2015). Total Column Water Vapour Measurements from GOME-2 MetOp-A and MetOp-B. Atmos. Meas. Tech. 8, 1111–1133. doi:10.5194/amt-8-1111-2015
Henderson, D. S., L’Ecuyer, T., Stephens, G., Partain, P., and Sekiguchi, M. (2013). A Multisensor Perspective on the Radiative Impacts of Clouds and Aerosols. J. Appl. Meteorol. Climatol. 52, 853–871. doi:10.1175/JAMC-D12-025.110.1175/jamc-d-12-025.1
Haywood, J. M., Jones, A., Dunstone, N., Milton, S., Vellinga, M., Bodas‐Salcedo, A., et al. (2016). The Impact of Equilibrating Hemispheric Albedos on Tropical Performance in the HadGEM2‐ES Coupled Climate Model. Geophys. Res. Lett. 43, 395–403. doi:10.1002/2015GL066903
Henken, C. K., Diedrich, H., Preusker, R., and Fischer, J. (2015). MERIS Full-Resolution Total Column Water Vapor: Observing Horizontal Convective Rolls. Geophys. Res. Lett. 42 (10), 81. doi:10.1002/2015GL066650
Hou, W., Wang, J., Xu, X., and Reid, J. S. (2017). An Algorithm for Hyperspectral Remote Sensing of Aerosols: 2. Information Content Analysis for Aerosol Parameters and Principal Components of Surface Spectra. J. Quant. Spectrosc. Radiat. Transfer 192, 14–29. doi:10.1016/j.jqsrt.2017.01.041
Illingworth, A. J., Barker, H. W., Beljaars, A., Ceccaldi, M., Chepfer, H., Clerbaux, N., et al. (2015). The EarthCARE Satellite: The Next Step Forward in Global Measurements of Clouds, Aerosols, Precipitation, and Radiation. Bull. Amer. Meteorol. Soc. 96, 1311–1332. doi:10.1175/BAMS-D-12-00227.1
Kaufman, Y. J., Tanré, D., Remer, L. A., Vermote, E. F., Chu, A., and Holben, B. N. (1997). Operational Remote Sensing of Tropospheric Aerosol over Land from EOS Moderate Resolution Imaging Spectroradiometer. J. Geophys. Res. 102 (D14), 17051–17117. doi:10.1029/96jd03988
King, N. J., and Vaughan, G. (2012). Using Passive Remote Sensing to Retrieve the Vertical Variation of Cloud Droplet Size in Marine Stratocumulus: An Assessment of Information Content and the Potential for Improved Retrievals from Hyperspectral Measurements. J. Geophys. Res. 117, 15026. doi:10.1029/2012JD017896
Kopp, G. P., Smith, C., Belting, Z., Castleman, G., Drake, J., Espejo, K., et al. (2017). Radiometric flight results from the HyperSpectral Imager for Climate Science (HySICS). Geosci. Instrum. Method. Data Syst. 6, 169–191. doi:10.5194/gi-6-169-2017
Kruse, F. A., Lefkoff, A. B., and Dietz, J. B. (1993). Expert System-Based Mineral Mapping in Northern Death Valley, California/Nevada, Using the Airborne Visible/infrared Imaging Spectrometer (AVIRIS). Remote Sensing Environ. 44 (2–3), 309–336. doi:10.1016/0034-4257(93)90024-R
Levy, R. C., Remer, L. A., Martins, J. V., Kaufman, Y. J., Plana-Fattori, A., Redemann, J., et al. (2005). Evaluation of the MODIS Aerosol Retrievals over Ocean and Land during CLAMS. J. Atmos. Sci. 62, 974–992. doi:10.1175/jas3391.1
Levy, R. C., Remer, L. A., Mattoo, S., Vermote, E. F., and Kaufman, Y. J. (2007). Second‐generation Operational Algorithm: Retrieval of Aerosol Properties over Land from Inversion of Moderate Resolution Imaging Spectroradiometer Spectral Reflectance. J. Geophys. Res. 112, D13211. doi:10.1029/2006JD007811
Li, Z., Zhao, X., Kahn, R., Mishchenko, M., Remer, L., Lee, K.-H., et al. (2009). Uncertainties in Satellite Remote Sensing of Aerosols and Impact on Monitoring its Long-Term Trend: a Review and Perspective. Ann. Geophys. 27, 2755–2770. doi:10.5194/angeo-27-2755-2009
Mauceri, S., Kindel, B., Massie, S., and Pilewskie, P. (2019). Neural Network for Aerosol Retrieval from Hyperspectral Imagery. Atmos. Meas. Tech. 12 (11), 6017–6036. doi:10.5194/amt-12-6017-2019
Meyer, K., and Platnick, S. (2010). Utilizing the MODIS 1.38 μM Channel for Cirrus Cloud Optical Thickness Retrievals: Algorithm and Retrieval Uncertainties. J. Geophys. Res. 115, D24209. doi:10.1029/2010JD014872
Lyapustin, A., Wang, Y., Korkin, S., and Huang, D. (2018). MODIS Collection 6 MAIAC Algorithm. Atmos. Meas. Tech. 11, 5741–5765. doi:10.5194/amt-11-5741-2018
Nakajima, T., and King, M. D. (1990). Determination of the Optical Thickness and Effective Particle Radius of Clouds from Reflected Solar Radiation Measurements. Part I: Theory. J. Atmos. Sci. 47, 1878–1893. 10.1175/1520-0469(1990)047<1878:DOTOTA>2.0.CO;2
Nakajima, T. Y., Suzuki, K., and Stephens, G. L. (2010a). Droplet Growth in Warm Water Clouds Observed by the A-Train. Part I: Sensitivity Analysis of the MODIS-Derived Cloud Droplet Sizes. J. Atmos. Sci. 67, 1884–1896. doi:10.1175/2009jas3280.1
Nakajima, T. Y., Suzuki, K., and Stephens, G. L. (2010b). Droplet Growth in Warm Water Clouds Observed by the A-Train. Part II: A Multi-Sensor View. J. Atmos. Sci. 67, 1897–1907. doi:10.1175/2010jas3276.1
National Academies of Sciences, Engineering, and Medicine (NAS) (2018). Thriving on Our Changing Planet: A Decadal Strategy for Earth Observation from Space. Washington, DC: The National Academies Press. doi:10.17226/24938
O'Neill, N. T., Eck, T. F., Smirnov, A., Holben, B. N., and Thulasiraman, S. (2003). Spectral Discrimination of Coarse and Fine Mode Optical Depth. J. Geophys. Res. 108, 4559. doi:10.1029/2002JD002975
Oyola, M. I., Campbell, J. R., Xian, P., Bucholtz, A., Ferrare, R. A., Burton, S. P., et al. (2019). Quantifying the Direct Radiative Effect of Absorbing Aerosols for Numerical Weather Prediction: a Case Study. Atmos. Chem. Phys. 19 (1), 205–218. doi:10.5194/acp-19-205-2019
Pilewskie, P., and Twomey, S. (1987). Cloud Phase Discrimination by Reflectance Measurements Near 1.6 and 2.2 μm. J. Atmos. Sci. 44, 3419–3420. doi:10.1175/1520-0469(1987)044<3419:cpdbrm>2.0.co;2
Platnick, S. (2000). Vertical Photon Transport in Cloud Remote Sensing Problems. J. Geophys. Res. 105 (22), 935. doi:10.1029/2000JD900333
Riedi, J., Marchant, B., Platnick, S., Baum, B. A., Thieuleux, F., Oudard, C., et al. (2010). Cloud Thermodynamic Phase Inferred from Merged POLDER and MODIS Data. Atmos. Chem. Phys. 10, 11851–11865. doi:10.5194/acp-10-11851-2010
Remer, L. A., Kaufman, Y. J., Tanré, D., Mattoo, S., Chu, D. A., Martins, J. V., et al. (2005). The MODIS Aerosol Algorithm, Products, and Validation. J. Atmos. Sci. 62 (4), 947–973. doi:10.1175/jas3385.1
Richardson, M., Leinonen, J., Cronk, H. Q., McDuffie, J., Lebsock, M. D., and Stephens, G. L. (2019). Marine Liquid Cloud Geometric Thickness Retrieved from OCO-2's Oxygen A-Band Spectrometer. Atmos. Meas. Tech.Meas. Tech. 12, 1717–1737. doi:10.5194/amt-12-1717-2019
Rodgers, C. D. (1998). Information Content and Optimisation of High Spectral Resolution Remote Measurements. Adv. Space Res. 21, 361–367. doi:10.1016/s0273-1177(97)00915-0
Schimel, D., Nastal, J., and Thompson, D. R. (2020). Science and Applications Traceability Matrix - March 2020 Release. Available at: https://sbg.jpl.nasa.gov/satm/SBG_SATM_Release_20200303.xlsx (Accessed 16 March, 2020).
Schmidt, K. S., Feingold, G., Pilewskie, P., Jiang, H., Coddington, O., and Wendisch, M. (2009). Irradiance in Polluted Cumulus Fields: Measured and Modeled Cloud-Aerosol Effects. Geophys. Res. Lett. 36, 848. doi:10.1029/2008GL036848
Schröder, M., Lockhoff, M., Fell, F., Forsythe, J., Trent, T., Bennartz, R., et al. (2018). The GEWEX Water Vapor Assessment Archive of Water Vapour Products from Satellite Observations and Reanalyses. Earth Syst. Sci. Data 10, 1093–1117. doi:10.5194/essd-10-1093-2018
Shea, Y., Fleming, G., Kopp, G., Lukashin, C., Pilewskie, P., Smith, P., et al. (2020). IClarreo Pathfinder: Mission Overview and Current Status, IGARSS 2020 ‐ 2020 IEEE International Geoscience and Remote Sensing Symposium, Waikoloa, HI. 3286–3289. doi:10.1109/IGARSS39084.2020.9323176
Sokolik, I. N., Winker, D. M., Bergametti, G., Gillette, D. A., Carmichael, G., Kaufman, Y. J., et al. (2001). Introduction to Special Section: Outstanding Problems in Quantifying the Radiative Impacts of Mineral Dust. J. Geophys. Res. 106 (D16), 18015–18027. doi:10.1029/2000JD900498
Stephens, G. L. (1994). Remote Sensing of the Lower Atmosphere: An Introduction. Oxford: Oxford University Press.
Stephens, G. L., and Kummerow, C. (2007). The Remote Sensing of Clouds and Precipitation from Space: A Review. J. Atmos. Sci. 64, 3742–3765. 10.1175/2006JAS2375.1
Stephens, G. L., O'Brien, D., Webster, P. J., Pilewskie, P., Kato, S., and Li, J.-l. (2015). The Albedo of Earth. Rev. Geophys 53, 141–163. doi:10.1002/2014RG000449
Stephens, G., Hakuba, M., Behrangi, A., Haywood, J., Hawcroft, M., Kay, J., et al. (2016). The Curious Nature of the Hemispheric Symmetry of the Earth’s Water and Energy Balances. Curr. Clim. Change Rep. 2, 9. doi:10.1007/s40641-016-0043-9
Stephens, G. L., Christensen, M., Andrews, T., Haywood, J., Malavelle, F. F., and Suzuki, K. (2019). Cloud Physics from Space. Quart J. Roy Meteorol. Soc. 145, 3589. doi:10.1002/qj.3589
Stephens, G. L., Freeman, A., Richard, E., Pilewskie, P., Larkin, P., and Chew, C. (2020). The Emerging Technological Revolution in Earth Observations. Bull. Amer. Met. Soc. 101, E274–E285. doi:10.1175/BAMS-D-19-0146.1
Su, W., Corbett, J., Eitzen, Z., and Liang, L. (2015). Next-generation Angular Distribution Models for Top-Of-Atmosphere Radiative Flux Calculation from CERES Instruments: Validation. Atmos. Meas. Tech. 8, 3297–3313. doi:10.5194/amt-8-3297-2015
Su, T., Laszlo, I., Li, Z., Wei, J., and Kalluri, S. (2020). Refining Aerosol Optical Depth Retrievals over Land by Constructing the Relationship of Spectral Surface Reflectances through Deep Learning: Application to Himawari-8. Remote Sens. Environ. 251, 112093. doi:10.1016/j.rse.2020.112093
Thompson, D. R., Babu, K. N., Braverman, A. J., Eastwood, M. L., Green, R. O., Hobbs, J. M., et al. (2019). Optimal Estimation of Spectral Surface Reflectance in Challenging Atmospheres. Remote Sensing Environ. 232, 111258. doi:10.1016/j.rse.2019.111258
Thompson, D. R., Gao, B. C., Green, R. O., Roberts, D. A., Dennison, P. E., and Lundeen, S. R. (2015). Atmospheric Correction for Global Mapping Spectroscopy: ATREM Advances for the HyspIRI Preparatory Campaign. Remote Sensing Environ. 167, 64–77. doi:10.1016/j.rse.2015.02.010
Thompson, D. R., McCubbin, L., Gao, B. C., Green, R. O., Matthews, A. A., Mei, F., et al. (2016). Measuring Cloud Thermodynamic Phase with Shortwave Infrared Imaging Spectroscopy. J. Geophys. Res. Atmos. 121, 9174–9190. doi:10.1002/2016JD024999
Tornow, F., Barker, H., Blázquez, V., Domenech, C., and Fischer, J. (2018). EarthCARE’s Broadband Radiometer: Uncertainties Associated with Cloudy Atmospheres. J.Atmos. Ocean. Tech. 35, 2201–2211. doi:10.1175/JTECH-D-18-0083.1
Twomey, S., and Seton, K. J. (1980). Inferences of Gross Microphysical Properties of Clouds from Spectral Reflectance Measurements. J. Atmos. Sci. 37, 1065–1069. 10.1175/1520-0469(1980)037<1065:IOGMPO>2.0.CO;2
Vonder Haar, T. H., and Suomi, V. E. (1969). Satellite Observations of the Earth's Radiation Budget: Science. New Ser. 163 (3868), 667–669. doi:10.1126/science.163.3868.667
Wang, S., Fang, L., Zhang, X., and Wang, W. (2015). Retrieval of Aerosol Properties for Fine/Coarse Mode Aerosol Mixtures over Beijing from PARASOL Measurements. Remote Sens 7, 9311–9324. doi:10.3390/rs70709311
Wang, C., Ding, S., Yang, P., Baum, B., and Dessler, A. E. (2012). A New Approach to Retrieving Cirrus Cloud Height with a Combination of MODIS 1.24- and 1.38-um Channels. Geophys. Res. Lett. 39, L24806. doi:10.1029/2012GL053854
Wielicki, B. A., Barkstrom, B. R., Baum, B. A., Charlock, T. P., Green, R. N., and Kratz, D. P. (1996). Clouds and the Earth’s Radiant Energy System (CERES): An Earth Observing System. Bull. Am. Meteorol. Soc. 72, 853–868. 10.1175/1520-0477(1996)077<0853:CATERE>2.0.CO;2
Wood, R., Leon, D., Lebsock, M., Snider, J., and Clarke, A. D. (2012). Precipitation Driving of Droplet Number Concentration Variability in Marine Low Clouds. J. Geophys. Res. 117, D19210. doi:10.1029/2012JD018305
Wu, Z., Chen, J., Wang, Y., Zhu, Y., Liu, Y., Yao, B., et al. (2018). Interactions between Water Vapor and Atmospheric Aerosols Have Key Roles in Air Quality and Climate Change. Natl. Sci. Rev. 5 (4), 452–454. doi:10.1093/nsr/nwy063
Xu, X., Wang, J., Wang, Y., Henze, D. K., Zhang, L., Grell, G. A., et al. (2017). Sense Size Dependent Dust Loading and Emission from Space Using Reflected Solar and Infrared Spectral Measurements: An Observation System Simulation Experiment. J. Geophys. Res. Atmos. 122, 8233–8254. doi:10.1002/2017JD026677
Yan, X., Li, Z., Luo, N., Shi, W., Zhao, W., Yang, X., et al. (2019). An Improved Algorithm for Retrieving the Fine-Mode Fraction of Aerosol Optical Thickness. Part 2: Application and Validation in Asia. Remote Sens. Environ. 222, 90–103. doi:10.1016/j.rse.2018.12.012
Yan, X., Zang, Z., Liang, C., Luo, N., Ren, R., Cribb, M., et al. (2021). New Global Aerosol Fine-Mode Fraction Data over Land Derived from MODIS Satellite Retrievals. Environ. Pollut. 276, 116707. doi:10.1016/j.envpol.2021.116707
Zelinka, M., Klein, S., and Hartmann, D. (2012). Computing and Partitioning Cloud Feedbacks Using Cloud Property Histograms. Part I: Cloud Radiative Kernels. J. Clim. 25, 3715–3735. doi:10.1175/JCLI-D-11-00248.1
Keywords: solar radiation, spectral solar radiation, cloud properties, aerosol properties, cloud albedo
Citation: Stephens G, Kalashnikova O, Gristey JJ, Pilewskie P, Thompson DR, Huang X, Lebsock M and Schmidt S (2021) The Spectral Nature of Earth’s Reflected Radiation: Measurement and Science Applications. Front. Remote Sens. 2:664291. doi: 10.3389/frsen.2021.664291
Received: 04 February 2021; Accepted: 06 May 2021;
Published: 26 May 2021.
Edited by:
Yongxiang Hu, National Aeronautics and Space Administration (NASA), United StatesReviewed by:
Norman Loeb, National Aeronautics and Space Administration (NASA), United StatesZhanqing Li, University of Maryland, United States
Brian Cairns, Goddard Institute for Space Studies (NASA), United States
Copyright © 2021 Stephens, Kalashnikova, Gristey, Pilewskie, Thompson, Huang, Lebsock and Schmidt. This is an open-access article distributed under the terms of the Creative Commons Attribution License (CC BY). The use, distribution or reproduction in other forums is permitted, provided the original author(s) and the copyright owner(s) are credited and that the original publication in this journal is cited, in accordance with accepted academic practice. No use, distribution or reproduction is permitted which does not comply with these terms.
*Correspondence: Graeme Stephens, Z3JhZW1lLnN0ZXBoZW5zQGpwbC5uYXNhLmdvdg==