 Francisco P. J. Valero1*
 Alexander Marshak
- 1Scripps Institution of Oceanography, University of California, San Diego, San Diego, CA, United States
- 2Goddard Space Flight Center, Greenbelt, MD, United States
- 3Science Systems and Applications, Inc., NASA Langley Research Center, Hampton, VA, United States
A new perspective for studying Earth processes has been soundly demonstrated by the Deep Space Climate Observatory (DSCOVR) mission. For the past 6 years, the first Earth-observing satellite orbiting at the Lagrange 1 (L1) point, the DSCOVR satellite has been viewing the planet in a fundamentally different way compared to all other satellites. It is providing unique simultaneous observations of nearly the entire sunlit face of the Earth at a relatively high temporal resolution. This capability enables detailed coverage of evolving atmospheric and surface systems over meso- and large-scale domains, both individually and as a whole, from sunrise to sunset, under continuously changing illumination and viewing conditions. DSCOVR’s view also contains polar regions that are only partially seen from geostationary satellites (GEOs). To exploit this unique perspective, DSCOVR instruments provide multispectral imagery and measurements of the Earth’s reflected and emitted radiances from 0.2 to 100 µm. Data from these sensors have been and continue to be utilized for a great variety of research involving retrievals of atmospheric composition, aerosols, clouds, ocean, and vegetation properties; estimates of surface radiation and the top-of-atmosphere radiation budget; and determining exoplanet signatures. DSCOVR’s synoptic and high temporal resolution data encompass the areas observed during the day from low Earth orbiting satellites (LEOs) and GEOs along with occasional views of the Moon. Because the LEO and GEO measurements can be easily matched with simultaneous DSCOVR data, multiangle, multispectral datasets can be developed by integrating DSCOVR, LEO, and GEO data along with surface and airborne observations, when available. Such datasets can open the door for global application of algorithms heretofore limited to specific LEO satellites and development of new scientific tools for Earth sciences. The utility of the integrated datasets relies on accurate intercalibration of the observations, a process that can be facilitated by the DSCOVR views of the Moon, which serves as a stable reference. Because of their full-disc views, observatories at one or more Lagrange points can play a key role in next-generation integrated Earth observing systems.
Introduction
Satellite remote sensing of the Earth has long relied on instruments aboard platforms in either low-Earth orbits (LEO, ∼500–2000 km altitude) or geostationary orbits (GEO, at ∼36,000 km). Although they can produce high-resolution views, LEOs can only scan a small portion of the surface at a given time, while a GEO can provide temporally continuous, though lower-resolution observations of a significant, though incomplete and unchanging portion of the Earth’s disk. The entire disk of the planet can only be observed at the same time from a single platform at a great distance, such as the Lagrange points at ∼1.5 million km, the Moon, or in transit to or from another heavenly body. The placement of satellites around the Lagrange L1 and L2 points was considered early in the satellite era by Farquhar (1960, 1968). The “Blue Marble” images of the Earth taken by the 1972 Apollo 17 spacecraft crew on their way to the Moon inspired then Vice President, Al Gore, in 1998 to propose to NASA a mission named Triana that would produce a continuous movie-like view of the Earth from L1 for dissemination via television and the internet as an inspiration and educational tool. Later that year, NASA issued a “request for proposals” to scientifically exploit the unique orbit of Triana. Thus, began the long and hard-fought battle for the Triana spacecraft, renamed the Deep Space Climate Observatory (DSCOVR) in 2003 (Valero, 2006), to reach the L1 position.
After traversing the customary stringent scientific peer-review process with nine other submissions, the winning proposal, authored by a team of scientists from several academic, government and private institutions led by the Scripps Institution of Oceanography, University of California, San Diego1, would enhance the solar-viewing instruments on the Triana spacecraft with two new Earth-viewing instruments. Work to transform the concept into reality was immediately started by the science team and the NASA Goddard Space Flight Center which designed and built the spacecraft and managed the project. Soon thereafter, NASA requested a follow up review of the scientific value and justification of the mission, this time by the National Academy of Sciences/National Research Council (NAS/NRC). Although this request temporarily halted work on mission preparations, the ensuing review served to highlight the exceptional and innovative science and potential for future scientific advances that could be pioneered by this experimental mission.
In a December 1999 response to the NAS/NRC request, the Triana science team prepared and submitted a report describing the mission scientific objectives (Valero et al., 1999). Following its review of the report and an oral review, the NAS/NRC released its conclusions on the scientific merits of the mission (National Research Council, 2000). A few notable conclusions in the NAS/NRC report are paraphrased below:
• “As an exploratory mission Triana has experimental and innovative aspects that carry more than usual risks but have the potential to make unique scientific contributions. The use of L1 for making Earth observations is itself experimental, since it will test the algorithms used to reduce remotely sensed data from a new combination of solar zenith angle and viewing backscattering angles”. (Page 11 of the report)
• “Furthermore, the full-disk Earth observations provide a unique perspective from which to develop new databases and validate and augment existing and planned global databases. As an exploratory mission, Triana may well open up the use of deep space observation points such as L1 for Earth science. The task group believes that the potential impact is sufficiently valuable to Earth science that such a mission might have been viewed as an earlier NASA priority had adequate technology been available at reasonable cost.” (Page two of the NAS report cover letter).
• “The task group therefore recommends that NASA seriously consider increasing the level of effort invested in development and testing of data reduction algorithms for the core Earth data products as soon as possible. In addition, it is concerned that there may be insufficient funding for scientific analysis of the data.” (Page two of the NAS report cover letter).
In summary, Triana (DSCOVR) was found to be a strong and scientifically vital and feasible mission that will contribute unique data on Earth’s climate systems. This positive final judgement of the NAS/NRC review of the mission scientific goals moved NASA to restart work on the Triana (DSCOVR) mission. In 2001, the instruments and spacecraft were built, but Triana was placed in “Stable Suspension” and finally cancelled due to shifting priorities within NASA.
Later, in November 2008, another agency, the National Oceanic and Atmospheric Administration (NOAA), discovered a solution to ensure continuing observation of critical space weather parameters. DSCOVR, already built and equipped with solar monitoring instrumentation (a magnetometer, an electron electrostatic analyzer and a Faraday Cup), was chosen by NOAA as the replacement for its aging Advanced Composition Explorer (ACE) spacecraft (e.g., Clark, 2009). Launch preparations were re-initiated. In 2012, the U.S. Air Force allocated funds to procure a launch vehicle, the SpaceX Falcon nine rocket, and fund its operations. After more than 12 years in storage, suspensions, cancellations, reactivations and refurbishment and almost 17 years after the initial proposal, DSCOVR was finally launched on February 11, 2015.
To scientifically exploit the Earth-viewing instrument data, NASA issued a new request for proposals in 2013 to develop and utilize algorithms and processes to generate daytime products from data measured by those sensors. Proposals were selected in 2014 and funded later that year. Work on the algorithms began shortly thereafter and since 2016 a variety of Earth and atmosphere products have been generated for climate research. NOAA has also been providing important DSCOVR space weather data since July 27, 2016.
Because DSCOVR is the first Earth-observing satellite at the Sun-Earth Lagrange L1 point, it is an exploratory mission that tests and validates the scientific and observational concepts that motivated the original Triana mission. This paper serves as an introduction to the DSCOVR mission, its history, and its scientific findings. In particular, it discusses the unique features of the DSCOVR observations that demonstrate the potential of deep space observatories for advancing the Earth sciences. Also presented is the possibility of developing a globally Integrated Earth observation system by the synergistic association of data from space-based, airborne, and surface platforms, as enabled by DSCOVR.
Remote Sensing Instruments on DSCOVR
In addition to its space weather package, DSCOVR carries the Scripps’ specified (built by Lockheed Martin) Earth Polychromatic Imaging Camera (EPIC) and the National Institute of Standards and Technology Advanced Radiometer (NISTAR). The EPIC consists of a telescope, a filter wheel, and a 2,048 × 2,048 pixel charged couple device (CCD) coated with hafnium. The Cassegrain telescope has a 0.62° field of view (FOV) that includes the full disc of the Earth, which subtends a solid angle of 0.5°, and some surrounding space. Light that comes into the telescope passes through some field lenses then through one of the filters on the wheel and is focused on the CCD. Ten narrowband filters, hereafter referred to as channels (Table 1), reside on the wheel providing measurements in the ultraviolet (UV) range (first column in Table 1), and in the visible (VIS), and near-infrared (NIR) bands. Some of the VIS/IR channels correspond to their counterparts on the latest operational LEO and GEO imagers (column 2 in Table 1), while two others are in the oxygen A and B absorption bands (last column, Table 1). Including the instrument’s point spread function yields a pixel resolution of 10 km at nadir. To reduce transmission time, the images for each channel, except at 443 nm, are reduced by averaging 2 × 2 arrays of pixels to yield a 1,024 × 1,024 pixel image. The resulting effective resolution is ∼18 km at nadir. Due to a loss of transmission receivers around the globe during the hibernation of DSCOVR, the original planned hourly imagery has been reduced to between 13 and 22 images per day in boreal winter and summer, respectively. This sampling, however, is sufficient for most climate research (e.g., Holdaway et al., 2016a,b).
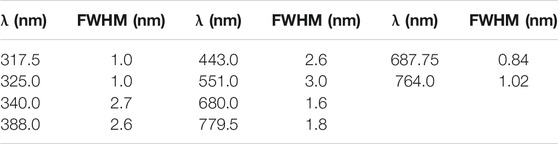
TABLE 1. EPIC Channels: Central wavelength is λ, and full width, half maximum is FWHM.
Creating an image from the raw radiance measurements is not a straightforward process. In addition to applying at least six electronic and thermal corrections to obtain a raw calibration for each spectral image, the 10 images must be geolocated to common footprint in time and space. Each image requires a dwell time of 0.5–4.0 min for a given filter on the wheel. During that time, the Earth rotates and the spacecraft moves in its orbit. The spacecraft also undergoes a small amount of jitter and the atmospheric refraction alters the linear path of reflected light to the telescope. Marshak et al. (2018) describe the process used to correct for distortions in and discrepancies among the spectral images at a given time slot. Using an automated coastline detection approach, Molina-García et al. (2019) have improved the geolocation of the EPIC images. The result is ten images that are projected onto a reference grid at the same common universal time (UTC).
EPIC’s initial raw pixel data consist of 12-bit counts. Before being converted into physical units, the counts are corrected for various effects such as non-linearity in the response and stray light contamination (Cede et al., 2021). The corrected raw images are calibrated by regressing the raw EPIC counts against calibrated radiances from LEO imagers having similar channels. That process requires matching the EPIC and LEO imagers in time and space with the same viewing and illumination conditions. To calibrate the UV channels, Herman et al. (2018a) used reflectances measured by the Ozone Mapping and Profiler Suite (OMPS) on the Suomi National Polar-orbiting Partnership (S-NPP) satellite. The VIS/NIR channels outside of the oxygen absorbing bands have been calibrated using reflectances from the MODerate-resolution Imaging Spectroradiometer (MODIS) on the Terra and Aqua platforms and from the S-NPP Visible Infrared Imaging Suite (VIIRS) (Haney et al., 2016; Geogdzhayev and Marshak, 2018; Doelling et al., 2019a; Geogdzhayev et al., 2021). Since the lunar disc occasionally passes through the EPIC FOV (Figure 1) and the Moon has no atmosphere, the Moon is used to calibrate the EPIC oxygen absorption bands relative to their non-absorbing neighbors at 680.0 and 779.5 nm (Marshak and Ward, 2018; Geogdzhaev and Marshak, 2018).
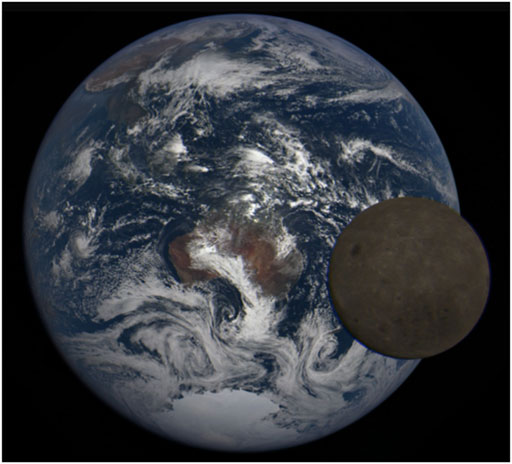
FIGURE 1. Lunar transit of Earth observed in an EPIC RGB image, February 11, 2021. “Back” side of Moon is visible to the east of Australia.
The NISTAR comprises a set of three single-pixel active cavity radiometers that measure broadband irradiance from the entire Earth hemisphere in three wavelength regions: shortwave (SW, 0.2–4.0 µm), NIR (0.7–4.0 µm), and total (0.2–100 µm). Measurements in those bands are taken every 4 minutes by placing the appropriate filter over each radiometer for 2 min followed by a shutter over the cavity for another 2 min to measure the offset. While originally designed to continuously monitor the sunlit side of the Earth, the small signal-to-noise ratios require averaging over a 4-h period to obtain a reliable flux. The raw filtered NISTAR irradiances are determined using prelaunch system-level optical calibration and the on-orbit offset measurements. To obtain a radiance from the Earth, the raw irradiances are first converted to radiances by dividing by the solid angle of the Earth disc. The resulting radiances are then unfiltered to obtain the “true” irradiance. Su et al. (2020) detail the processing of the NISTAR data and their conversion to usable scientific quantities.
Earth-Observing Characteristics of DSCOVR
As noted, the Lagrange points, L1 and L2, are unique locations for observing Earth from deep space. L1 and L2 are found along the Earth-Sun line: L1 between the Sun and the Earth and L2 beyond the Earth. Observational platforms at L1 and L2 would orbit the Sun in synch with Earth (the same orbital period as the Earth), thus, keeping their position “in line” with the Sun.
As a result, L1, L2 and the Earth orbit the Sun keeping on the same radial line as shown in Figure 2. From L1 the satellite has a continuous view of the entire sunlit face of the rotating Earth, including details of large-scale and mesoscale evolution of processes affecting the Earth’s weather. L2 has a full view of the unilluminated opposing disc, so it can only use instruments that measure at non-solar wavelengths.
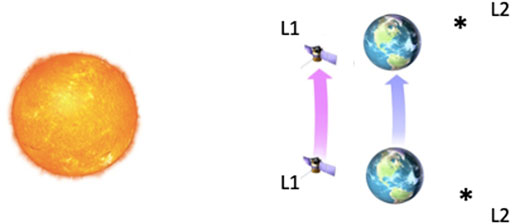
FIGURE 2. L1 and L2 are positions on the Ecliptic plane where the net gravitational pull of the Earth and Sun equals the centripetal force required to orbit the Sun with the same orbital angular velocity as the Earth. Satellites at L1 and L2 keep the same Sun-Earth relative position and continuously view the full planet as the Earth rotates around its axis.
The equilibrium at the L1, L2 (and L3) points is unstable. If a spacecraft at L1, for example, drifted toward or away from Earth, it would fall toward the Sun or Earth. This is the reason why there is no accumulation of “space debris” or asteroids at these points. The contrary happens at the stable points, L4 and L5. To station a spacecraft at L1 or L2, it is necessary to place it in a non-repeating elliptical Lissajous orbit around the Lagrange point perpendicular to the Earth-Sun axis. Using this orbit can take DSCOVR off the axis by 4–12° (2–12° after March 2020) relative to Earth. In doing so, it keeps solar fluxes from interfering with transmissions, but alters the amount of sunlit Earth observable by the satellite as drawn in Figure 3. The relative azimuth angle ϕD, or off-axis angle due to the Lissajous orbit is shown Figure 3A. Also indicated is a set of scattering angles Θ illustrating the multidirectionality of the reflected sunlight. Figure 3B is a schematic of the sunlit and unlit fractions, Av and Ad, respectively, seen by DSCOVR and the sunlit portion, Ah, that would be observed at L2. As ϕD approaches 180°, Av tends toward unity. Thus, a small portion, 3–8%, of the sunlit disc is actually missed because of the Lissajous orbit.

FIGURE 3. Schematic of (A) Earth-Sun-DSCOVR geometry and (B) portion of sunlit Earth disc viewed by DSCOVR and the portion that would be viewed at L2 (right). Golden area on left is the daytime area fraction, Av, visible to DSCOVR and the black area, Ad, is the nighttime fraction seen by DSCOVR. The dark fraction is enhanced for purposes of illustration. The golden area on the right indicates the sunlit fraction, Ah, not seen by DSCOVR. Not to scale. (Adapted from Su et al., 2018).
Because of the tilt of the planet's axis of rotation, the northern or southern polar regions are observable from L1 during their respective summer solstices. The diagram in Figure 4 depicts the conditions applicable to the southern hemisphere around the summer solstice and the northern hemisphere during the winter solstice. The EPIC images in Figure 5 demonstrate this oscillating view. The northern polar region, including all of Greenland, is clearly seen on June 20, 2020 near the summer solstice in the Northern hemisphere (Figure 5A), while Figure 5B illustrates the DSCOVR view near the autumnal equinox on September 20, 2020. Most of Antarctica becomes viewable around the December solstice (Figure 5C). Because of the large viewing zenith angles (VZAs) and increased pixel size near the edge of the disc, the discernible detail is greatly reduced.
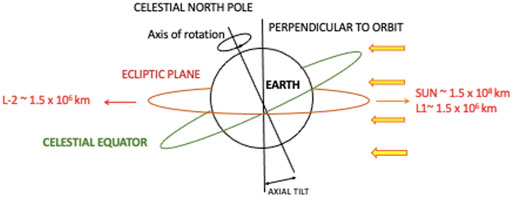
FIGURE 4. In this diagram the Earth orbits the Sun in the ecliptic plane in the direction perpendicular to the drawing. It represents the southern hemisphere near the summer solstice and the northern hemisphere near the winter solstice.
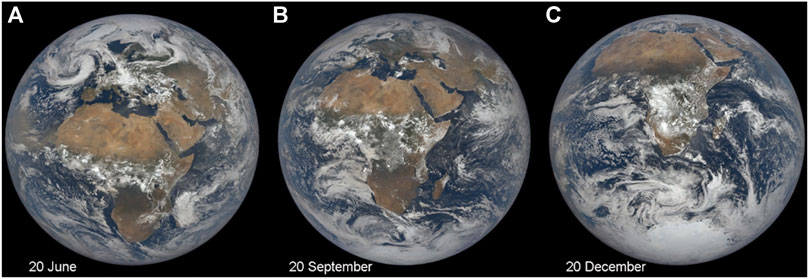
FIGURE 5. EPIC RGB enhanced images (https://epic.gsfc.nasa.gov) during 2020 (A) Northern hemisphere summer solstice, (B) Autumnal equinox, and (C) Southern hemisphere summer solstice.
For the cases in Figures 5A,C a DSCOVR-like satellite at L2 would view the northern hemisphere polar region during the winter solstice and vice versa, respectively, giving full coverage of the globe. Thus, addition of a satellite at L2, performing measurements from local sunset to local sunrise (nighttime) would enable observations during the complete diurnal cycle, day (L1) and night (infrared observations) (L2), which again, highlights the importance of adding a second platform at L2.
These nearly complete disc views contrast with the smaller areas observed by LEO and GEO satellites, as noted earlier. To obtain imagery or derived products that would provide 13–22 observations of the sunlit Earth as seen by DSCOVR requires stitching together of images from five GEOs and three or more LEOs. That process still necessitates inclusion of data taken up to 3 h from the nominal time (Khlopenkov et al., 2017). Combining all of those satellite images is a challenging task, requiring excellent intercalibration, significant angular adjustments, and edge blending to minimize artificial discontinuities. And that is only for some VIS/NIR imagery. No GEO UV or oxygen A and B band imagers are in operation, thus, only LEO satellites have been providing the information needed for retrieving ozone concentrations, surface UV irradiances, and various cloud and aerosol properties.
For example, the LEO Total Ozone Mapping Spectrometer (TOMS) samples the Earth in strips between 2000–3,000 km wide around local noon. The left image in Figure 6 depicts the ozone concentrations determined from TOMS UV data acquired over a period of ∼45 min. All points are seen near local noon only (Sun synchronous satellite). The right panel shows the ozone concentrations determined from EPIC UV data on April 19, 2016 over a period of a few minutes (plus ∼15 min data transmission time). As the Earth rotates, points are seen from sunrise to sunset at continuously changing solar illumination conditions. Construction of an ozone data set from TOMS or a similar instrument would require at least five appropriately equipped satellites in Sun-synchronous orbits with equally spaced equatorial crossing times.
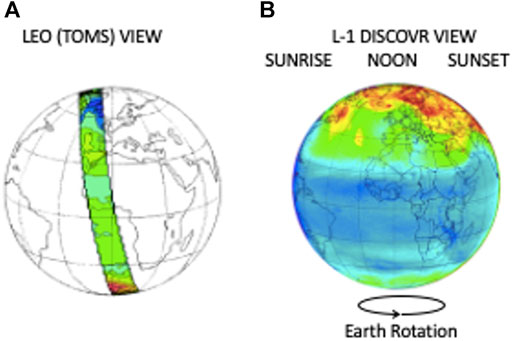
FIGURE 6. (A) LEO (TOMS) vs. (B) DSCOVR views (Adapted from Herman et al. 2018a).
Some LEOs are in precessing orbits such that their equatorial crossing times increment forward or backward in time each day depending on the direction and inclination of the orbit. Those LEOs can cover the diurnal cycle for part of the Earth, but it usually takes a month or more to cover all local hours (e.g., Harrison et al., 1983). Obviously, GEOs cover the complete diurnal cycle each day but only for a fourth or fifth of the globe equatorward of 60° latitude or so. The edge of the GEO FOV along the subsatellite meridian is at ∼72° latitude. Even so, data taken poleward of 60° are of minimal usability. Again, to cover all hours around the globe, data from four or five GEOs must be combined with all of the attendant issues noted above.
Each type of satellite has its unique viewing and illumination limitations. GEOs observe a given area at a constant VZA, but the solar zenith (SZA) and relative azimuth (RAA) angles change over the course of the day. Imagers on Sun-synchronous LEOs typically view an area over a wide range of RAA and VZA, but the range of SZA over a given area is constrained to those angles corresponding to ∼±45 min around the equatorial crossing time. DSCOVR views a given location from a relatively constant RAA, i.e., ϕD in Figure 2, while both SZA and VZA vary in synch over the course of the day. The points on the surface that are in the ecliptic plane will be observed at VZAs and SZAs that range from 90° at sunrise to 0° at noon and back to 90° at local sunset. For points off the plane, the minimum VZA and SZA at local noon will increase latitudinally from the ecliptic. SZA and VZA will always be within a few degrees of each other. The result is that light reflected from any location on the planet is observed from DSCOVR at a scattering angle, 168°< Θ < 178°, close to direct backscatter at 180°. During many seasons, measurements are taken relatively infrequently at those scattering angles from LEO and GEO satellites [e.g., Minnis et al. (1998), Figure A1], so DSCOVR’s nearly constant scattering angle everywhere on Earth is markedly different from those associated with other satellites. Yet, each scattering angle configuration has its advantages and problems, Marshak et al., 2021).
As pictured in Figure 2A, light is reflected anisotropically from the Earth-atmosphere system. The distribution of the radiant intensity varies over the hemisphere above a given location as a function of many factors such as surface type, terrain, and vegetation; cloud cover, height, phase, particle size and shape, and horizontal and vertical structure; aerosol type and optical depth; and absorbing gas concentrations among other parameters. To correct for the anisotropy, remote sensing of the Earth from LEO and GEO satellites typically employs bidirectional reflectance distribution functions (BRDFs), also referred to as anisotropic directional models (ADMs). It is no different for DSCOVR, except that only a small portion of the BRDF is used at a given SZA because of the constrained angular range. Thus, it is important to know the BRDF very accurately for DSCOVR views because there are no measurements at other angles to balance out any biases that may be in the BRDF at a given scattering angle. GEO and LEO measurements are taken over a wide range of scattering angles and, hence, cover various portions of a given BRDF and, hence, averaging over several measurements can minimize any biases in the BRDF at any one set of viewing and illumination conditions.
Scientific Products and Analyses
Surface and Atmospheric Properties
The proposed products from the EPIC observations include physical parameters related to land surface and ocean properties, atmospheric gases, and cloud and aerosol properties, while NISTAR data were to be used to study the top-of-atmosphere radiation budget. These parameters and others are being determined from DSCOVR data on an ongoing basis and used in a variety of scientific studies. Marshak et al. (2018) provide a review of the scientific results up to the time of that paper’s acceptance. Many additional analyses of the DSCOVR measurements have been published since then, including those in this issue, and they are continuing.
Surface irradiance is derived over the sunlit part of the day from the EPIC reflectances. This includes broadband shortwave (Hao et al., 2019, 2020), photosynthetically active radiation at the ocean and land surfaces (Frouin et al., 2018; Hao et al., 2019, 2020; Zhang et al., 2020), and UV erythemal radiation that is harmful to life on the surface (Herman et al., 2018b, 2020). Spectral (Gao B.-C. et al., 2019) and broadband radiation leaving the surface is also derived from the EPIC data for the entire daylight period. Wen et al. (2020) exploited DSCOVR’s L1 location to determine the impact of the 2017 total solar eclipse on the broadband shortwave surface radiation budget as the Sun’s shadow traveled around the globe. The health and condition of vegetation is also monitored from DSCOVR by estimating the leaf area index (Yang et al., 2017), the enhanced vegetation index (Weber et al., 2020), and the clumping index (Pisek et al., 2021). The oxygen-B band on EPIC allows the computation of a normalized difference vegetation index that represents an improvement over that computed using the typical visible and NIR channels on lower-orbit satellites (Marshak and Knyazikhin, 2017).
As noted earlier, the UV channels on EPIC are quite valuable for tracking ozone loading in the atmospheric column throughout the day (Herman et al., 2018a, 2020). Figure 7 provides an example of the column ozone and erythemal UV irradiance retrieved from EPIC at 18:40 UTC, June 21, 2016.
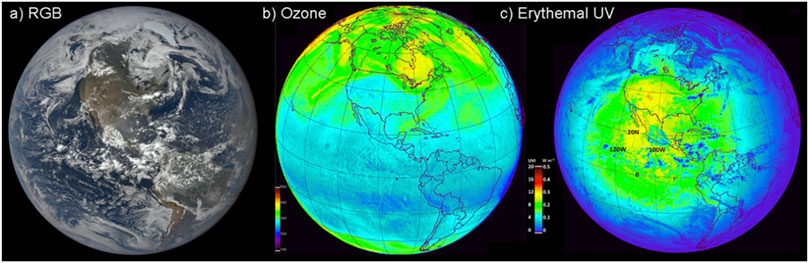
FIGURE 7. Example of some UV-based products from EPIC, 18:40 UTC, June 21, 2016. (A) RGB image, (B) column ozone in Dobson units, and (C) Erythemal UV in Wm−2. O3 levels are greatest in frontal areas and lowest in tropics. The erythemal UV decreases toward edge of disc because of increasing SZA. Relative maxima correspond to clearest areas. (Adapted from Herman et al., 2018b).
When combined with climatological information, the column ozone retrievals are converted to vertical profiles of ozone concentrations (Yang and Liu, 2019). Tracking of sulfur dioxide emitted into the atmosphere within volcanic ash plumes is also enabled by using the EPIC UV channels (Carn et al., 2016a, 2016, 2018). Torres et al. (2020) used the EPIC UV reflectances combined with a limb profiler and the lidar on the Cloud Aerosol Lidar and Infrared Pathfinder Satellite Observations (CALIPSO) satellite to detect and follow smoke plumes injected into the stratosphere by large forest fires in Canada. This tracking includes retrievals of the UV aerosol optical depths (AODv) and single scattering albedos (SSAv) of the smoke particles, which can reside a relatively long time in the atmosphere (e.g., Ahn et al., 2021). The UV aerosol index (UVAI), a standard EPIC product along with SO2 and O3 column loading and SSAv and AODv, has been employed with satellite-based lidar profiles of aerosol concentrations and modeling to quantify the impacts of pyrocumulonimbus injections of smoke aerosols into the upper troposphere and lower stratosphere (Christian et al., 2019).
Monitoring of aerosols is not confined to use of the UV channels. Aerosol optical depth is retrieved for each of the VIS/NIR channels for cloud-free regions. Additionally, the oxygen A and B bands are employed to retrieve smoke and dust aerosol layer heights with an RMSE ∼0.5 km (Xu et al., 2017, 2019). Recently, Lyapustin et al. (2021) have combined the retrievals of UV and VIS/NIR aerosol optical depths (AOD) and single scattering albedos (SSA) using an innovative retrieval algorithm that utilizes sequences of EPIC images. The initial results are quite promising for improved estimates of those parameters at all wavelengths and development of the algorithms continues (e.g., Sasi et al., 2020).
Detection of clouds and retrievals of their properties using the EPIC channels for the original Triana mission were limited due to the absence of infrared window channels that are valuable for estimating cloud height and detecting thin cirrus and clouds in sunglint. During the refurbishment of DSCOVR after its long storage, two of the original channels were replaced with the oxygen A and B bands. That change mitigated the inability to determine cloud top height/pressure from EPIC. These channels along with other VIS/NIR channels have been used to determine cloud fraction (Yang et al., 2019; Delgado-Bonal et al., 2020), cloud phase and optical depth (Meyer et al., 2016) and cloud-top height/pressure (Yang et al., 2013, 2019; Davis et al., 2018a; Yin et al., 2020). An example of the cloud fraction retrieved from EPIC is compared with the higher resolution cloud retrieval composite from Khlopenkov et al. (2017) in Figure 8. EPIC retrievals have been supported with a body of radiative transfer studies that have determined how accurately certain parameters can be derived within the constraints of the EPIC characteristics (Davis et al., 2018b; Gao M. et al., 2019; Molina García et al., 2018a,b; Tian et al., 2020). Lacking any shortwave infrared channels (e.g., 1.6 µm), detection of clouds over snow and ice-covered surfaces has been difficult. Zhou et al. (2020, 2021) have greatly improved cloud detectability over those surfaces and in sunglint conditions over water surfaces using the oxygen A and B bands. Yang et al. (2019) describe the standard EPIC cloud products and their evaluation. As seen in the above citations, the cloud algorithms, like those for the other products, are evolving as more is learned about the information in the views from DSCOVR and in the EPIC channels.
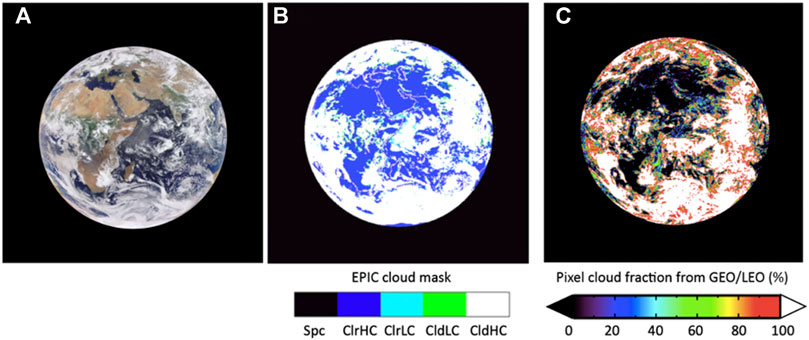
FIGURE 8. Cloud fraction at 08:00 UTC, September 15, 2015. (A) EPIC RGB, (B) EPIC cloud mask, and (C) GEO/LEO cloud fraction for each EPIC pixel. GEO/LEO product is based mainly on a cloud mask using data with horizontal resolutions of 1–4 km. Good agreement is found in most areas. Monthly averages differ by only 1%. (Adapted from Yang et al. 2019).
As a result of DSCOVR’s unique perspective, some of that information has been quite unexpected. Sun glints are flashes of bright specularly reflected light observed in the appropriate conditions over both water and land surfaces. Marshak et al. (2017) and Li et al. (2019) show that glints over land are caused by reflection from horizontally oriented ice platelets in cirrus clouds that are often quite thin. Detecting the glitter from those clouds at such a great distance was a surprise. In addition to sun glint observed from ocean surfaces and clouds (Varnai et al., 2020), Kostinski et al. (2021) detected extremely bright glints in EPIC reflectances from apparently small calm lakes at high altitudes in the Andes. Varnai et al. (2021) extracted the spectral properties of cloud glitter from various EPIC channels. Comparing glint observations with model simulations may provide new information on atmospheric dynamics.
Finally, in support of the Artemis mission, Gorkavyi et al. (2021) recently discussed what an EPIC-type instrument would see from the Moon’s surface (see Figure 10). They showed that the lunar surface offers a unique opportunity to observe cloud glint reflection for different phase angles, to detect polar mesospheric and stratospheric clouds using whole-Earth limb imaging, and to estimate a full phase angle integrated albedo. In addition, observations from the Moon’s surface will allow simultaneous imaging of the day and night parts during crescent phases of the Earth as well as the shadowed parts illuminated by lunar reflection of solar radiation.
Top-Of-Atmosphere Radiation
Measuring the daytime Earth radiation budget (ERB) using NISTAR was one of the prime objectives of the original Triana mission. There are many ways to measure the components of this essential climate parameter: the solar shortwave (SW) irradiance absorbed and longwave (LW) irradiance emitted into space by the Earth-atmosphere system. The former is inferred by measuring the solar radiation reflected by the planet and subtracting it from the incoming. The latter component can be measured using a radiometer with the appropriate spectral filter or by measuring the total irradiance and subtracting from it the reflected solar irradiance. In the absence of broadband radiometers, narrowband measurements have been employed to estimate the broadband fluxes with the aid of the appropriate conversion functions (e.g., Minnis and Harrison, 1984; Doelling et al., 2013).
The best estimates of the ERB to date have come from the Clouds and the Earth’s Radiant Energy System (CERES; e.g., Loeb et al., 2018) and, yet, the initial CERES analyses (Loeb et al., 2009) found an improbably large imbalance in the budget (e.g., Charlson et al., 2005; Valero and Charlson, 2008). This large imbalance, ∼6.5 Wm-2, since reduced to 4.3 Wm-2 in the CERES Edition 4 product (Loeb et al., 2018), is the result of calibration, diurnal correction, and ADM uncertainties. To obtain a better balance, the fluxes are adjusted at one time to be consistent with the measured heat storage in the ocean-atmosphere system. Measuring the radiation budget from DSCOVR would provide an independent assessment of that adjustment.
To begin the process of determining the TOA radiation budget from NISTAR, it is necessary to establish BRDF values for the globe as viewed from DSCOVR (Minnis et al., 2001). Su et al. (2018) utilized the high-resolution cloud properties from the GEO/LEO cloud composite of Su et al. (2017) to select BRDF values for each EPIC pixel from the ADMs of Su et al. (2015a,b). The ADMs for the LW were selected in the same manner by Su et al. (2020). An example of the EPIC ADMs is shown in Figure 9 along with the EPIC RGB image and the composite cloud fraction for 12:17 UTC, May 15, 2017. The SW BRDFs were convolved with pixel broadband radiances estimated from the EPIC 443, 556, and 680-nm channels to compute the global reflected SW radiance and single valued SW BRDFs for the entire disk at each EPIC time. The SW result agreed with the CERES daily global albedos to within 2% with monthly RMS differences of 3.2–5.2 Wm-2, values within the calibration and algorithm uncertainties. This excellent agreement demonstrates the robustness of the BRDF values computed for each time slot. Su et al. (2020) found similar values by computing the global SW and LW ADMs by convolving the SW and LW ADM average radiances for each EPIC pixel in the same manner instead of using the EPIC-based radiances.
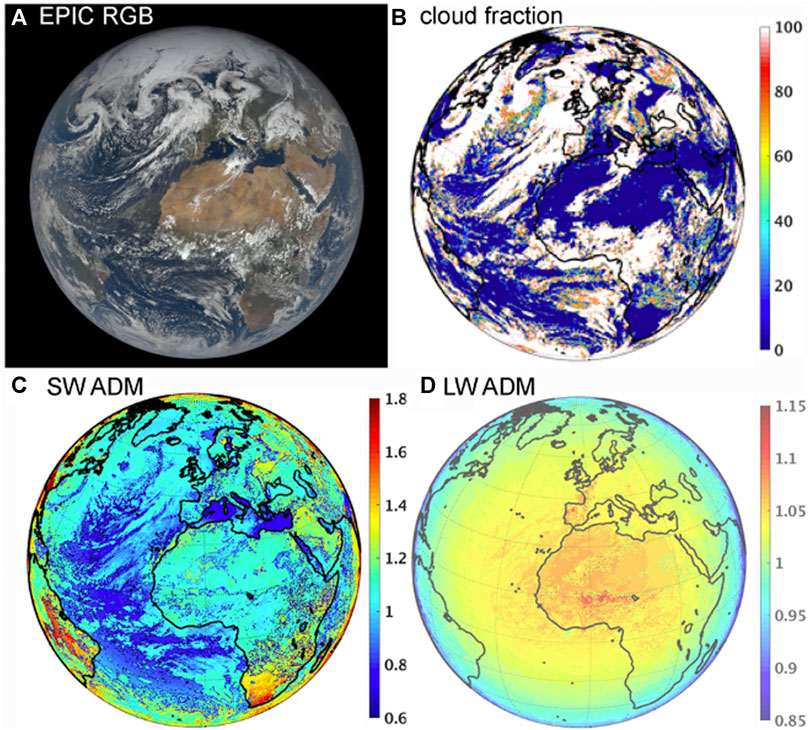
FIGURE 9. Anisotropic directional models selected for each EPIC pixel at 12:17 UTC, May 15, 2017. (A) EPIC RGB image, (B) GEO/LEO cloud fraction for each EPIC pixel, (C) SW ADM, and (D) LW ADM. Ocean has less back scatter than land and other surfaces, except in sun glint. Global weighted average SW and LW ADMs for this scene are 1.275 and 1.041, respectively. (Adapted from Su et al., 2020).
The remaining step is to divide the NISTAR radiances by the BRDFs for each EPIC image. With that approach, Su et al. (2020) found that the NISTAR SW reflected flux is well correlated with CERES, but, on average, is 13.3 Wm-2 greater than CERES. The NISTAR LW flux exceeds that of CERES by 4.8 Wm-2, but is poorly correlated. While much of the difference can be attributed to the uncertainties in the retrievals, explaining the SW flux bias requires more research. Part of the problem may be the lack of recalibrating the NISTAR after it was in long-term storage. Despite those differences, the NISTAR fluxes are still quite useful and have already been employed to evaluate climate model global albedo variability at time scales ranging from less than a few hours to several years (Feldman et al., 2021). Ratios of fluxes from the NISTAR broadband NIR and full SW channels provide information that can also be used to constrain climate models and to serve as signatures of life on exoplanets (Carlson et al., 2019).
In addition to aiding the computation of the global BRDFs for NISTAR, the EPIC data have been employed in a variety of ways to study the spectral characteristics of the globe. Using four EPIC channels, Yang et al. (2018) found that the distributions of land and water surfaces on the sunlit Earth strongly affect the diurnal variation of global reflectance, while clouds dominate the seasonal cycles in average reflectance. Song et al. (2018) established that LEO and GEO imagers tend to overestimate the spectral reflectivity of the planet relative to that from EPIC. Herman et al. (2018b) were able to determine that the August 21, 2017 total eclipse reduced the sunlit Earth reflectance by ∼10% in five nonabsorbing channels between 380 and 780 nm. The spectral variations in EPIC global reflectivity over the seasonal and diurnal cycles also provide information that can be used to determine the likelihood of biological activity on exoplanets (Jiang et al., 2018; Wen et al., 2019).
The Future: An Integrated Earth Observation System
From L1, the synoptic coverage and relatively high time resolution of the daytime radiances from the planet’s surface and atmosphere, including the polar regions, represent a major enhancement of our ability to understand the processes and daily evolution of the Earth systems and climate/climate change. At each time slot, nearly the entire sunlit half of the globe is observed. Thus, any LEO or GEO imager observing the Earth at that time will also be in the EPIC field of view. Since the temporal resolution of GEO imagers is currently 15 min or better, there are large portions of the daytime disc where there will be nearly simultaneous matches of EPIC and GEO data and reasonable contemporaneity with LEO imager data over many other areas. The matching is not limited to VIS/IR imagers or satellites. Data from airborne and surface instruments, as well as active instruments such as lidars and microwave imagers on LEOs, are also within the EPIC footprints. Thus, the temporal resolution and broad coverage have great potential for a variety of synergistic and complementary studies that could yield improved and new products.
To facilitate those studies, Yi et al. (2001) proposed the development of a comprehensive dataset consisting of observations from LEOs and GEOs attached to time and space-matched EPIC footprints. The composite developed by Khlopenkov et al. (2017) is the first step in realizing that possibility. While the comprehensive dataset proposed by Yi et al. (2001) has not yet been fully constructed, many of the papers cited earlier have begun the process of exploiting the matching potential of DSCOVR at L1. Among others, they include combined use of EPIC and lidar data from CALIPSO and the International Space Station (Christian et al., 2019), matched surface and EPIC data (e.g., Hao et al., 2019), and matched LEO/GEO and EPIC retrievals. Yet, there remain many possibilities for creatively and productively using combined datasets. For example, multiangle and multispectral retrievals of cloud (e.g., Chepfer et al., 2002; Pierce et al., 2010) and aerosol (e.g., Abdou et al., 2005) properties and perhaps surface characteristics (e.g., Chopping, 2008) could be accomplished with relative ease using such data. Moreover, they would provide complete diurnal and global coverage unavailable from LEO instruments specifically designed for such retrievals (e.g., Diner et al., 1998; Parol et al., 2004). Other multiangle studies employing GEO and EPIC data could be utilized to more thoroughly examine the reflectance fields at VZAs beyond the roughly 70° limit of LEO scanners.
Critical to using combined satellite datasets is accurate intercalibration of the individual instruments. As noted earlier, some of the EPIC channels were calibrated using data from similar channels on LEO/GEO satellites (e.g., Geogdzhayev and Marshak, 2018). Other channels were calibrated using the “back” side of the Moon viewed about 4 times each year in transit across the Earth disc. Lunar transits provide the opportunity to “calibrate” the Moon for each of those channels using EPIC data already normalized to a reference sensor such as VIIRS. That would provide a temporally stable reference for continued reliable calibration of the EPIC sensor array in the future. Because of its broad view and nearly hourly sampling, EPIC then could be used to monitor and adjust the calibration of similar channels on the host of current and upcoming LEO and GEO instruments as well as extraterrestrial probes (e.g., Doelling et al., 2019b). Having the comprehensive matched dataset would ease that process.
DSCOVR is the first satellite operating at a Lagrange point to serve as an Earth remote sensing platform. It was designed more than 2 decades ago and is operating at half of its initial capacity because of reduced Earth data receivers and transmission rates. Nevertheless, the DSCOVR project has clearly been successful and has demonstrated great potential for studying the Earth, especially in conjunction with other surface, satellite, and airborne datasets. With its broad view of the Earth and calibration potential, DSCOVR could act as the anchor for an integrated Earth observing system (IEOS) using the suggested comprehensive combined observations could serve as the core dataset.
In the future, the IEOS should include both day and night observations of the whole planet using two satellites, one at L1 and another at L2. These are shown schematically in Figure 10 with some of the existing LEO (cyan) and GEO (magenta) satellites that would comprise the system along with surface and airborne sensors. The instruments on both satellites should use the latest technology to observe radiances in additional solar and infrared wavelengths and, perhaps, include polarization for some channels. While the solar channels may not be necessary for the L2 satellite, they could provide some basic scientific information by measuring the shorter wavelength radiation refracted around the Earth’s edge and the crescent of reflected radiation by the small illuminated portion of the disc (see Figure 3). Infrared and broadband LW observations at L2 are technically challenging because the orbit allows some direct solar radiation to impact the spacecraft. The Earth signal would be swamped without appropriate shielding, precise thermal control, and minimization of the Lissajous orbit radius off the Earth-Sun axis. The latter is more feasible in the L2 position since there is minimal solar interference of signals transmitted from the spacecraft to Earth.

FIGURE 10. Example diagram of a potential future integrated Earth observational system showing some LEO (cyan), GEO (magenta), and Lagrange point (white) satellites, and the Moon. (Surface and airborne platforms not shown.) (Adapted from NASA image, https://www.nasa.gov/image-feature/nasas-fleet-of-satellites-keep-an-eye-on-earth).
Temporal and spatial resolution of the Earth observations should also be greatly enhanced by employing a larger telescope on EPIC to reduce dwell time and by employing a denser CCD array, respectively. A larger telescope would also enable better IR spectral measurements at both L1 and L2. Taking advantage of such enhancements would require a faster onboard data processing and transmission system as well as additional ground receiving stations. Currently only one at Wallops, Virginia is used by DSCOVR.
Improved Lagrange-point radiation budget measurements are also possible. A revised version of NISTAR that includes a larger optical aperture, better thermal control and better calibration just prior to launch would provide a more stable and valuable complement to CERES. Inclusion of broadband channels on a revised EPIC would greatly reduce signal-to-noise ratios for radiation budget studies and provide a means for direct intercalibration with CERES or any LEO system making similar measurements.
A satellite in an artificial Lagrange orbit (ALO) is also included at the top of Figure 10 to show a possible expansion beyond L2. An ALO is accomplished by employing the solar wind to maintain the orbit, which aligns the satellite above either of the poles, providing continuous GEO-like coverage of those regions at azimuth angles greatly different from those at L1 (Lazzarra et al., 2011).
Concluding Remarks
The instruments on DSCOVR are providing for the first time, synoptic, simultaneous mesoscale and large-scale spatial coverage of the Earth at high temporal-resolution from sunrise to sunset with periodic plain views of the sunlit polar regions, as well as the Moon, which serves as a spectro-radiometric calibration reference. The results of the DSCOVR-generated research to date are by themselves the validation of the scientific concepts that first motivated the original Triana mission. They demonstrate the scientific potential of observing the globe from deep space platforms. Data taken from satellites at Lagrange points can be easily combined with nearly all observations taken nearer the Earth to play a central role in building a globally integrated Earth observational system. At a minimum, Earth remote sensing from deep space should be incorporated into the NASA Earth Observing System and follow-on Lagrange point satellites should be designed and launched to fully exploit the unique potential of viewing the globe from deep space.
Data Availability Statement
The datasets presented in this study can be found in online repositories. The names of the repository/repositories and accession number(s) can be found below: EPIC imagery are available at https://epic.gsfc.nasa.gov. Digital data and products can be accessed at the NASA Langley Atmospheric Science Data Center, https://earthdata.nasa.gov/eosdis/daacs/asdc.
Author Contributions
FV developed the concept and wrote the first draft of the paper. AM and PM contributed to research for this paper and the development of several figures. All authors contributed to the writing of this paper.
Conflict of Interest
Author PM is employed by the company Science Systems and Applications., Inc. under a non-personal services contract with NASA Langley Research Center.
The remaining authors declare that the research was conducted in the absence of any commercial or financial relationships that could be construed as a potential conflict of interest.
Publisher’s Note
All claims expressed in this article are solely those of the authors and do not necessarily represent those of their affiliated organizations, or those of the publisher, the editors and the reviewers. Any product that may be evaluated in this article, or claim that may be made by its manufacturer, is not guaranteed or endorsed by the publisher.
Acknowledgments
Thanks to the late P. J. Crutzen. R. Charlson, C. Kennel and W. Wiscombe for many helpful discussions on DSCOVR. Thanks to W. Su for helpful discussions on the Earth radiation budget. Thanks to J. Herman for his contributions to the EPIC. Thanks to K. Blank for her help with EPIC images.
Footnotes
1Original Science Team Membership: Valero, F.P.J., Doolittle, J.H., Hutchinson K.D., Gerstl, S.A.W., Lubin, D., Pope, S.K., Bush, B., Bucholtz, A., Ramanathan, V., Minnis, P., Pilewsky, P., Ride, S.K., Smith, G.L. and Wiscombe, W.J., Herman, J.R. joined the team immediately after NASA accepted the proposal.
References
Abdou, W. A., Diner, D. J., Martonchik, J. V., Bruegge, C. J., Kahn, R. A., Gaitley, B. J., et al. (2005). Comparison of Coincident Multiangle Imaging Spectroradiometer and Moderate Resolution Imaging Spectroradiometer Aerosol Optical Depths Over Land and Ocean Scenes Containing Aerosol Robotic Network Sites. J. Geophys. Res. 110, D10S07. doi:10.1029/2004JD004693
Ahn, C., Torres, O., Jethva, H., Tiruchirapalli, R., and Huang, L. K. (2021). Evaluation of Aerosol Properties Observed by DSCOVR/EPIC Instrument From the Earth‐Sun Lagrange 1 Orbit. Geophys. Res. Atmos. 126, e2020JD033651. doi:10.1029/2020JD033651
Carlson, B., Lacis, A., Colose, C., Marshak, A., Su, W., and Lorentz, S. (2019). Spectral Signature of the Biosphere: NISTAR Finds it in Our Solar System From the Lagrangian L‐1 Point. Geophys. Res. Lett. 46, 10679–10686. doi:10.1029/2019GL083736
Carn, S. A., Clarisse, L., and Prata, A. J. (2016). Multi-Decadal Satellite Measurements of Global Volcanic Degassing. J. Volcanology Geothermal Res. 311, 99–134. doi:10.1016/j.jvolgeores.2016.01.002
Carn, S. A., Krotkov, N. A., Fisher, B. L., Li, C., and Prata, A. J. (2018). First Observations of Volcanic Eruption Clouds From the L1 Earth‐Sun Lagrange Point by DSCOVR/EPIC. Geophys. Res. Lett. 45, 11456. doi:10.1029/2018GL079808
Carn, S. A. (2016). “On the Detection and Monitoring of Effusive Eruptions Using Satellite SO2 Measurements,” in Detecting, Modeling and Responding to Effusive Eruptions. Editors A.J.L. Harris, T.F. de Groeve, and S.A. Carn (London: Geolog. Soc. London, Special Publications), 426, 277–292. doi:10.1144/SP426.28
Cede, A., Huang, L. K., Mccauley, G., Herman, J., Blank, K., Kowalewski, M., et al. (2021). Raw EPIC Data Calibration. Front. Remote Sens. 2, 671933. doi:10.3389/frsens.2021.671933
Charlson, R. J., Valero, F. P., and Seinfeld, J. H. (2005). Atmospheric Science. In Search of Balance. Science 308, 806–807. doi:10.1126/science.1108162
Chepfer, H., Minnis, P., Young, D., and Arduini, R. F. (2002). Estimation of Cirrus Cloud Effective Ice crystal Shapes Using Visible Reflectances From Dual-Satellite Measurements. J.-Geophys.-Res. 107 (D23), 21–1. doi:10.1029/2000JD000240
Chopping, M. J. (2008). “Terrestrial Applications of Multiangle Remote Sensing,” in Advances in Land Remote Sensing. Editor S. Liang (Dordrecht: Springer), 95–144. doi:10.1007/978-1-4020-6450-0_5
Christian, K., Wang, J., Ge, C., Peterson, D., Hyer, E., Yorks, J., et al. (2019). Radiative Forcing and Stratospheric Warming of Pyrocumulonimbus Smoke Aerosols: First Modeling Results With Multisensor (EPIC, CALIPSO, and CATS) Views From Space. Geophys. Res. Lett. 46, 10061–10071. doi:10.1029/2019GL082360
Clark, S. (2009). Mothballed Satellite Sits in Warehouse, Waits for New Life. Space.Com. Available at: https://www.space.com/2286-mothballed-satellite-sits-warehouse-waits-life.html (Accessed March 2).
Davis, A. B., Ferlay, N., Libois, Q., Marshak, A., Yang, Y., and Min, Q. (2018a). Cloud Information Content in EPIC/DSCOVR's Oxygen A- and B-Band Channels: A Physics-Based Approach. J. Quantitative Spectrosc. Radiative Transfer. 220, 84–96. doi:10.1016/j.jqsrt.2018.09.006
Davis, A. B., Merlin, G., Cornet, C., Labonnote, L. C., Riédi, J., Ferlay, N., et al. (2018b). Cloud Information Content in EPIC/DSCOVR's Oxygen A- and B-Band Channels: An Optimal Estimation Approach. J. Quantitative Spectrosc. Radiative Transfer. 216, 6–16. doi:10.1016/j.jqsrt.2018.05.007
Delgado-Bonal, A., Marshak, A., Yang, Y., and Oreopoulos, L. (2020). Daytime Variability of Cloud Fraction From DSCOVR/EPIC Observations. J. Geophys. Res. Atmos. 125, e2019JD031488. doi:10.1029/2019JD031488
Diner, D. J., Beckert, J. C., Reilly, T. H., Bruegge, C. J., Conel, J. E., Kahn, R. A., et al. (1998). Multi-Angle Imaging SpectroRadiometer (MISR) Instrument Description and experiment Overview. IEEE Trans. Geosci. Remote Sensing 36, 1072–1087. doi:10.1109/36.700992
Doelling, D., Haney, C., Bhatt, R., Scarino, B., and Gopalan, A. (2019a). The Inter-Calibration of the DSCOVR EPIC Imager With Aqua-MODIS and NPP-VIIRS. Remote Sensing 11, 1609. doi:10.3390/rs11131609
Doelling, D., Khlopenkov, K., Haney, C., Bhatt, R., Bos, B., Scarino, B., et al. (2019b). Inter-Calibration of the OSIRIS-REx NavCams With Earth-Viewing Imagers. Remote Sensing 11, 2717. doi:10.3390/rs11222717
Doelling, D. R., Loeb, N. G., Keyes, D. F., Nordeen, M. L., Morstad, D., Nguyen, C., et al. (2013). Geostationary Enhanced Temporal Interpolation for CERES Flux Products. J. Atmos. Oceanic Tech. 30, 1072–1090. doi:10.1175/JTECH-D-12-00136.1
Farquhar, R. W. (1960). Preliminary Considerations for Establishment of a Satellite in the Neighborhood of Centers of Libation. Los Angeles, CA: M.S. Thesis, University of California.
Farquhar, R. W. (1968). The Control and Use of Libation-point Satellites. Palo Alto, CA: Ph.D. Dissertation, Stanford University, Department of Astronautics and Aeronautics.
Feldman, D. R., Su, W., and Minnis, P. (2021). Subdiurnal to Interannual Frequency Analysis of Observed and Modeled Reflected Shortwave Radiation from Earth. Geophys. Res. Lett. 48, e2020GL089221. doi:10.1029/2020GL089221
Frouin, R. J., Tan, J., Franz, B., Murakami, H., and Ramon, D. (2018). Estimating Photosynthetically Available Radiation at the Ocean Surface From EPIC/DSCOVR Data. Remote Sens. Open Coastal Ocean Inland Waters., 10778. doi:10.1117/12.2501675
Gao, B.-C., Li, R.-R., and Yang, Y. (2019a). Remote Sensing of Daytime Water Leaving Reflectances of Oceans and Large Inland Lakes From EPIC Onboard the DSCOVR Spacecraft at Lagrange-1 Point. Sensors 19, 1243. doi:10.3390/s19051243
Gao, M., Zhai, P.-W., Yang, Y., and Hu, Y. (2019b). Cloud Remote Sensing With EPIC/DSCOVR Observations: a Sensitivity Study With Radiative Transfer Simulations. J. Quantitative Spectrosc. Radiative Transfer. 230, 56–60. doi:10.1016/j.jqsrt.2019.03.022
Geogdzhayev, I. V., Marshak, A., and Alexandrov, M. (2021). Calibration of the DSCOVR EPIC Visible and NIR Channels Using Multiple LEO Radiometers. Front. Remote Sens. 2, 671933. doi:10.3389/frsens.2021.671933
Geogdzhayev, I. V., and Marshak, A. (2018). Calibration of the DSCOVR EPIC Visible and NIR Channels Using MODIS and EPIC Lunar Observations. Atmos. Meas. Tech. 12, 2017–222. doi:10.5194/amt-2017-222
Gorkavyi, N., Carn, S., DeLand, M., Knyazikhin, Y., Krotkov, N., Marshak, A., et al. (2021). Earth Imaging From the Surface of the Moon With a DSCOVR/EPIC-Type Camera. Front. Remote Sens. 2, 724074. doi:10.3389/frsen.2021.724074
Haney, C., Doelling, D., Minnis, P., Bhatt, R., Scarino, B., and Gopalan, A. (2016). The Calibration of the DSCOVR EPIC Multiple Visible Channel Instrument Using MODIS and VIIRS as a Reference. Earth Observing Syst. XXI. 9972, 13. doi:10.1117/12.2238010
Hao, D., Asrar, G. R., Zeng, Y., Zhu, Q., Wen, J., Xiao, Q., et al. (2020). DSCOVR/EPIC-Derived Global Hourly and Daily Downward Shortwave and Photosynthetically Active Radiation Data at 0.1° × 0.1° Resolution. Earth Syst. Sci. Data. 12, 2209–2221. doi:10.5194/essd-12-2209-2020
Hao, D., Asrar, G. R., Zeng, Y., Zhu, Q., Wen, J., Xiao, Q., et al. (2019). Estimating Hourly Land Surface Downward Shortwave and Photosynthetically Active Radiation from DSCOVR/EPIC Observations. Remote Sensing Environ. 232, 111320. doi:10.1016/j.rse.2019.111320
Harrison, E. F., Minnis, P., and Gibson, G. G. (1983). Orbital and Cloud Cover Sampling Analyses for Multisatellite Earth Radiation Budget Experiments. J. Spacecraft Rockets 20, 491–495. doi:10.2514/3.25634
Herman, J., Cede, A., Huang, L., Ziemke, J., Torres, O., Krotkov, N., et al. (2020). Global Distribution and 14-Year Changes in Erythemal Irradiance, UV Atmospheric Transmission, and Total Column Ozone For2005-2018 Estimated From OMI and EPIC Observations. Atmos. Chem. Phys. 20, 8351–8380. doi:10.5194/acp-20-8351-2020
Herman, J., Wen, G., Marshak, A., Blank, K., Huang, L., Cede, A., et al. (2018a). Reduction in 317-780 Nm Radiance Reflected From the Sunlit Earth During the Eclipse of 21 August 2017. Atmos. Meas. Tech. 11, 4373–4388. doi:10.5194/amt-11-4373-2018
Herman, J., Huang, L., McPeters, R., Ziemke, J., Cede, A., and Blank, K. (2018b). Synoptic Ozone, Cloud Reflectivity, and Erythemal Irradiance From Sunrise to Sunset for the Whole Earth as Viewed by the DSCOVR Spacecraft From the Earth-Sun Lagrange 1 Orbit. Atmos. Meas. Tech. 11, 177–194. doi:10.5194/amt-11-177-2018
Holdaway, D., and Yang, Y. (2016a). Study of the Effect of Temporal Sampling Frequency on DSCOVR Observations Using the GEOS-5 Nature Run Results (Part II): Cloud Coverage. Remote Sensing 8 (5), 431. doi:10.3390/rs8050431
Holdaway, D., and Yang, Y. (2016b). Study of the Effect of Temporal Sampling Frequency on DSCOVR Observations Using the GEOS-5 Nature Run Results (Part I): Earth's Radiation Budget. Remote Sensing 8 (2), 98. doi:10.3390/rs8020098
Jiang, J. H., Zhai, A. J., Herman, J., Zhai, C., Hu, R., Su, H., et al. (2018). Using Deep Space Climate Observatory Measurements to Study the Earth as an Exoplanet. Astronomical J. 156, 26. doi:10.3847/1538-3881/aac6e2
Khlopenkov, K. V., Duda, D. P., Minnis, P., Su, W., Bedka, K. M., and Thieman, M. (2017). Development of Multi-Sensor Global Cloud and Radiance Composites for Earth Radiation Budget Monitoring from DSCOVR. Proc. SPIE Conf. Remote Sens. Clouds Atmos. XXII, 11–14. doi:10.1117/12.2278645
Kostinski, A., Marshak, A., and Várnai, T. (2021). Deep Space Observations of Terrestrial Glitter. Earth Space Sci. 8, e2020EA001521. doi:10.1029/2020EA001521
Lazzara, M. A., Coletti, A., and Diedrich, B. L. (2011). The Possibilities of Polar Meteorology, Environmental Remote Sensing, Communications and Space Weather Applications From Artificial Lagrange Orbit. Adv. Space Res. 48, 1880–1889. doi:10.1016/j.asr.2011.04.026
Li, J.-Z., Fan, S., Kopparla, P., Liu, C., Jiang, J. H., Natraj, V., et al. (2019). Study of Terrestrial Glints Based on DSCOVR Observations. Earth Space Sci. 6, 166–173. doi:10.1029/2018EA000509
Loeb, N. G., Doelling, D. R., Wang, H., Su, W., Nguyen, C., Corbett, J. G., et al. (2018). Clouds and the Earth's Radiant Energy System (CERES) Energy Balanced and Filled (EBAF) Top-Of-Atmosphere (TOA) Edition-4.0 Data Product. J. Clim. 31, 895–918. doi:10.1175/JCLI-D-17-0208.1
Loeb, N. G., Su, W., Doelling, D. R., Wong, T., Minnis, P., Thomas, S., et al. (2018). Earth’s Top-of-Atmosphere Radiation Budget. Comprehensive Remote Sensing 5 (3), 67–84. (Oxford, UK: Elsevier) doi:10.1016/B978-0-12-409548.9.10367-7
Loeb, N. G., Wielicki, B. A., Doelling, D. R., Smith, G. L., Keyes, D. F., Kato, S., et al. (2009). Toward Optimal Closure of the Earth's Top-Of-Atmosphere Radiation Budget. J. Clim. 22, 748–766. doi:10.1175/2008JCLI2637.1
Lyapustin, A., Go, S., Korkin, S., Wang, Y., Torres, O., Jethva, H., et al. (2021). Retrievals of Aerosol Optical Depth and Spectral Absorption From DSCOVR EPIC. Front. Remote Sens. 2, 645794. doi:10.3389/frsen.2021.645794
Marshak, A., Delgado-Bonal, A., and Knyazikhin, Y. (2021). Effect of Scattering Angle on Earth Reflectance. Front. Remote Sens. 2, 719610. doi:10.3389/frsen.2021.719610
Marshak, A., Herman, J., Adam, S., Karin, B., Carn, S., Cede, A., et al. (2018). Earth Observations From DSCOVR EPIC Instrument. Bull. Amer. Meteorol. Soc. 99, 1829–1850. doi:10.1175/BAMS-D-17-0223.1
Marshak, A., and Knyazikhin, Y. (2017). The Spectral Invariant Approximation Within Canopy Radiative Transfer to Support the Use of the EPIC/DSCOVR Oxygen B-Band for Monitoring Vegetation. J. Quantitative Spectrosc. Radiative Transfer. 191, 7–12. doi:10.1016/j.jqsrt.2017.01.015
Marshak, A., Várnai, T., and Kostinski, A. (2017). Terrestrial Glint Seen From Deep Space: Oriented Ice Crystals Detected from the Lagrangian point. Geophys. Res. Lett. 44, 5197–5202. doi:10.1002/2017GL073248
Marshak, A., and Ward, A. (2018). Summary of DSCOVR EPIC and NISTAR Science Team Meeting. The Earth Observer. 30 (6), 16–22.
Meyer, K., Yang, Y., and Platnick, S. (2016). Uncertainties in Cloud Phase and Optical Thickness Retrievals From the Earth Polychromatic Imaging Camera (EPIC). Atmos. Meas. Tech. 9, 1785–1797. doi:10.5194/amt-9-1785-2016
Minnis, P., Garber, D. P., YoungArduini, D. F. R. F., Arduini, R. F., and Takano, Y. (1998). Parameterizations of Reflectance and Effective Emittance for Satellite Remote Sensing of Cloud Properties. J. Atmos. Sci. 55, 3313–3339. doi:10.1175/1520-0469(1998)055<3313:poraee>2.0.co;2
Minnis, P., and Harrison, E. F. (1984). Diurnal Variability of Regional Cloud and Clear-Sky Radiative Parameters Derived From GOES Data. Part III: November 1978 Radiative Parameters. J. Clim. Appl. Meteorol. 23, 1032–1051. doi:10.1175/1520-0450(1984)023<1032:dvorca>2.0.co;2
Minnis, P., Huang, J., Doelling, D. R., and Valero, F. P. (2001). Simulation and Correction of Triana-Viewed Earth Radiation Budget With ERBE Data. Proc. SPIE 4540, Sensors, Systems, Next-generation Satellites V. 12-17, 391–401. doi:10.1117/12.450681
Molina García, V., Sasi, S., Efremenko, D. S., Doicu, A., and Loyola, D. (2018a). Radiative Transfer Models for Retrieval of Cloud Parameters From EPIC/DSCOVR Measurements. J. Quantitative Spectrosc. Radiative Transfer. 213, 228–240. doi:10.1016/j.jqsrt.2018.03.014
Molina García, V., Sasi, S., Efremenko, D. S., Doicu, A., and Loyola, D. (2018b). Linearized Radiative Transfer Models for Retrieval of Cloud Parameters From EPIC/DSCOVR Measurements. J. Quantitative Spectrosc. Radiative Transfer. 213, 241–251. doi:10.1016/j.jqsrt.2018.03.008
Molina García, V., Sasi, S., Efremenko, D. S., and Loyola, D. (2019). Improvement of EPIC/DSCOVR Image Registration by Means of Automatic Coastline Detection. Remote Sensing 11 (15), 1747. doi:10.3390/rs11151747
National Research Council (2000). Review of Scientific Aspects of the NASA Triana Mission: Letter Report. Washington, DC: The National Academies Press. doi:10.17226/9789
Parol, F., Buriez, J. C., Vanbauce, C., Riedi, J., C.-Labonnote, L., Doutriaux-Boucher, M., et al. (2004). Review of Capabilities of Multi-Angle and Polarization Cloud Measurements from POLDER. Adv. Space Res. 33, 1080–1088. doi:10.1016/s0273-1177(03)00734-8
Pierce, J. R., Kahn, R. A., Davis, M. R., and Comstock, J. M. (2010). Detecting Thin Cirrus in Multiangle Imaging Spectroradiometer Aerosol Retrievals. J. Geophys. Res. 115, D08201. doi:10.1029/2009JD013019
Pisek, J., Arndt, S. K., Erb, A., Pendall, E., Schaaf, C., Wardlaw, T. J., et al. (2021). Exploring the Potential of DSCOVR EPIC Data to Retrieve Clumping Index in Australian Terrestrial Ecosystem Research Network Observing Sites. Front. Remote Sens. 2, 652436. doi:10.3389/frsen.2021.652436
Sasi, S., Natraj, V., Molina García, V., Efremenko, D. S., Loyola, D., and Doicu, A. (2020). Model Selection in Atmospheric Remote Sensing With an Application to Aerosol Retrieval From DSCOVR/EPIC, Part 1: Theory. Remote Sensing 12, 3724. doi:10.3390/rs12223724
Song, W., Knyazikhin, Y., Wen, G., Marshak, A., Mõttus, M., Yan, K., et al. (2018). Implications of Whole-Disc DSCOVR EPIC Spectral Observations for Estimating Earth's Spectral Reflectivity Based on Low-Earth-Orbiting and Geostationary Observations. Remote Sensing 10, 1594. doi:10.3390/rs10101594
Su, W., Corbett, J., Eitzen, Z., and Liang, L. (2015a). Next-generation Angular Distribution Models for Top-Of-Atmosphere Radiative Flux Calculation From CERES Instruments: Methodology. Atmos. Meas. Tech. 8, 611–632. doi:10.5194/amt-8-611-2015
Su, W., Corbett, J., Eitzen, Z., and Liang, L. (2015b). Next-generation Angular Distribution Models for Top-Of-Atmosphere Radiative Flux Calculation From CERES Instruments: Validation. Atmos. Meas. Tech. 8, 3297–3313. doi:10.5194/amt-8-3297-2015
Su, W., Liang, L., Doelling, D. R., Minnis, P., Duda, D. P., Khlopenkov, K., et al. (2018). Determining the Shortwave Radiative Flux from Earth Polychromatic Imaging Camera. J. Geophys. Res. Atmos. 123, 479–511. doi:10.1029/2018JD029390
Su, W., Minnis, P., Liang, L., Duda, D. P., Khlopenkov, K., Thieman, M. M., et al. (2020). Determining the Daytime Earth Radiative Flux From National Institute of Standards and Technology Advanced Radiometer (NISTAR) Measurements. Atmos. Meas. Tech. 13, 429–443. doi:10.5194/amt-13-429-2020
Tian, Q., Liu, Q., Guang, J., Yang, L., Zhang, H., Fan, C., et al. (2020). The Estimation of Surface Albedo From DSCOVR EPIC. Remote Sensing 12, 1897. doi:10.3390/rs12111897
Torres, O., Bhartia, P. K., Taha, G., Jethva, H., Das, S., Colarco, P., et al. (2020). Stratospheric Injection of Massive Smoke Plume From Canadian Boreal Fires in 2017 as Seen by DSCOVR‐EPIC, CALIOP, and OMPS‐LP Observations. J. Geophys. Res. Atmos. 125. doi:10.1029/2020JD032579
Valero, F. P. (2006). Keeping the DSCOVR Mission Alive. Science. 311 (5762), 775. doi:10.1126/science.311.5762.775c
Valero, F. P. J., and Charlson, R. J. (2008). Albedo-Watching Satellite Needed to Monitor Change. Nature 451 (718), 887. doi:10.1038/451887c
Valero, F. P. J., Herman, J., Minnis, P., Collins, W. D., Sadourny, R., Wiscombe, W., et al. (1999). Triana- a Deep Space Earth and Solar Observatory, NASA Background Report. Available at.
Varnai, T., Kostinski, A. B., and Marshak, A. (2020). Deep Space Observations of Sun Glints From Marine Ice Clouds. IEEE Geosci. Remote Sensing Lett. 17 (5), 735–739. doi:10.1109/LGRS.2019.2930866
Varnai, T., Marshak, A., and Kostinski, A. B. (2021). Deep Space Observations of Cloud Glints: Spectral and Seasonal Dependence. IEEE Geosci. Remote Sensing Lett. 17, 1–5. doi:10.1109/LGRS.2020.3040144
Weber, M., Hao, D., Asrar, G. R., Zhou, Y., Li, X., and Chen, M. (2020). Exploring the Use of DSCOVR/EPIC Satellite Observations to Monitor Vegetation Phenology. Remote Sensing 12, 2384. doi:10.3390/rs12152384
Wen, G., Marshak, A., Song, W., Knyazikhin, Y., Mõttus, M., and Wu, D. (2019). A Relationship Between Blue and Near‐IR Global Spectral Reflectance and the Response of Global Average Reflectance to Change in Cloud Cover Observed from EPIC. Earth Space Sci. 6, 1416–1429. doi:10.1029/2019EA000664
Wen, G., Marshak, A., Tsay, S.-C., Herman, J., Jeong, U., Abuhassan, N., et al. (2020). Changes in Surface Broadband Shortwave Radiation Budget During the 2017 Eclipse. J. Atmos. Chem. Phys., 2019–961. doi:10.5194/acp-2019-961
Xu, X., Wang, J., Wang, Y., Zeng, J., Torres, O., Reid, J. S., et al. (2019). Detecting Layer Height of Smoke Aerosols Over Vegetated Land and Water Surfaces via Oxygen Absorption Bands: Hourly Results From EPIC/DSCOVR in Deep Space. Atmos. Meas. Tech. 12, 3269–3288. doi:10.5194/amt-12-3269-2019
Xu, X., Wang, J., Wang, Y., Zeng, J., Torres, O., Yang, Y., et al. (2017). Passive Remote Sensing of Altitude and Optical Depth of Dust Plumes Using the Oxygen A and B Bands: First Results From EPIC/DSCOVR at Lagrange-1 Point. Geophys. Res. Lett. 44, 7544–7554. doi:10.1002/2017GL073939
Yang, B., Knyazikhin, Y., Mõttus, M., Rautiainen, M., Stenberg, P., Yan, L., et al. (2017). Estimation of Leaf Area Index and its Sunlit Portion From DSCOVR EPIC Data: Theoretical Basis. Remote Sensing Environ. 198, 69–84. doi:10.1016/j.rse.2017.05.033
Yang, K., and Liu, X. (2019). Ozone Profile Climatology for Remote Sensing Retrieval Algorithms. Atmos. Meas. Tech. 12, 4745–4778. doi:10.5194/amt-12-4745-2019
Yang, W., Marshak, A., Várnai, T., and Knyazikhin, Y. (2018). EPIC Spectral Observations of Variability in Earth's Global Reflectance. Remote Sensing 10 (2), 254. doi:10.3390/rs10020254
Yang, Y., Marshak, A., Mao, J., Lyapustin, A., and Herman, J. (2013). A Method of Retrieving Cloud Top Height and Cloud Geometrical Thickness With Oxygen A and B Bands for the Deep Space Climate Observatory (DSCOVR) Mission: Radiative Transfer Simulations. J. Quantitative Spectrosc. Radiative Transfer. 122, 141–149. doi:10.1016/j.jqsrt.2012.09.017
Yang, Y., Meyer, K., Wind, G., Zhou, Y., Marshak, A., Platnick, S., et al. (2019). Cloud Products From the Earth Polychromatic Imaging Camera (EPIC): Algorithms and Initial Evaluation. Atmos. Meas. Tech. 12, 2019–2031. doi:10.5194/amt-12-2019-2019
Yi, H. Y., Minnis, P., Nguyen, L., and Doelling, D. R. (2001). “A Proposed Multiangle Satellite Dataset Using GEO, LEO, and Triana,” in Proc. AMS 11th Conf. Satellite Meteorology and Oceanography (Madison, WI, 570–573. Oct. 15-18. Available at: https://ams.confex.com/ams/pdfpapers/24404.pdf.
Yin, B., Min, Q., Morgan, E., Yang, Y., Marshak, A., and Davis, A. (2020). Cloud Top Pressure Retrieval With DSCOVR-EPIC Oxygen A and B Bands Observation. Atmos. Meas. Tech. 13, 1–18. doi:10.5194/amt-13-1-2020
Zhang, Z., Zhang, Y., Zhang, Y., Gobron, N., Frankenberg, C., Wang, S., et al. (2020). The Potential of Satellite FPAR Product for GPP Estimation: An Indirect Evaluation Using Solar-Induced Chlorophyll Fluorescence. Remote Sensing Environ. 240, 111686. doi:10.1016/j.rse.2020.111686
Zhou, Y., Yang, Y., Gao, M., and Zhai, P.-W. (2020). Cloud Detection Over Snow and Ice With Oxygen A- and B-Band Observations From the Earth Polychromatic Imaging Camera (EPIC). Atmos. Meas. Tech. 13, 1575–1591. doi:10.5194/amt-13-1575-2020
Keywords: lagrange, surface, oceans, clouds, glint, aerosols, radiation, integrated
Citation: Valero FPJ, Marshak A and Minnis P (2021) Lagrange Point Missions: The Key to next Generation Integrated Earth Observations. DSCOVR Innovation. Front. Remote Sens. 2:745938. doi: 10.3389/frsen.2021.745938
Received: 22 July 2021; Accepted: 01 September 2021;
Published: 20 September 2021.
Edited by:
Pavel Lytvynov, Generalized Retrieval of Atmosphere and Surface Properties (GRASP), FranceReviewed by:
Pengwang Zhai, University of Maryland, United StatesShaohua Zhao, Ministry of Ecology and Environment Center for Satellite Application on Ecology and Environment, China
Copyright © 2021 Valero, Marshak and Minnis. This is an open-access article distributed under the terms of the Creative Commons Attribution License (CC BY). The use, distribution or reproduction in other forums is permitted, provided the original author(s) and the copyright owner(s) are credited and that the original publication in this journal is cited, in accordance with accepted academic practice. No use, distribution or reproduction is permitted which does not comply with these terms.
*Correspondence: Francisco P. J. Valero, ZnZhbGVyb0B1Y3NkLmVkdQ==