 Ileana A. Callejas1
 Katie Osborn1
 Christine Lee2*
 Deepak R. Mishra3
 Nicole Auil Gomez4
 Abel Carrias5
 Emil A. Cherrington6
 Robert Griffin7Andria Rosado8Samir Rosado8
 Jennifer Jay1
- 1Department of Civil and Environmental Engineering, University of California, Los Angeles, Los Angeles, CA, United States
- 2Jet Propulsion Laboratory, California Institute of Technology, Pasadena, CA, United States
- 3Department of Geography, University of Georgia, Athens, GA, United States
- 4Wildlife Conservation Society Belize, Belize City, Belize
- 5Faculty of Science and Technology, University of Belize, Belmopan, Belize
- 6Earth System Science Center, University of Alabama in Huntsville, Huntsville, AL, United States
- 7Department of Atmospheric and Earth Science, University of Alabama in Huntsville, Huntsville, AL, United States
- 8Coastal and Marine Data Centre, Coastal Zone Management Authority and Institute, Belize City, Belize
Coral reefs are highly diverse ecosystems that provide many goods and ecosystem services globally. Coral reef ecosystems are also threatened by environmental stressors from anthropogenic sources and shifting climates. The United Nations Sustainable Development Goal 14 (“Life Below Water”) addresses the need to conserve and sustainably use the ocean, seas, and marine ecosystems, including reef systems. Belize’s coral reef system is the second largest in the world, providing sources of income to Belizeans through tourism and fisheries as well as coastline protection. In order to conserve their marine ecosystems, Belize has a network of Marine Protected Areas (MPAs) throughout their coastal waters. Using Aqua MODIS satellite imagery from 2002 to 2022, Google Earth Engine, and RStudio, we present a workflow to calculate stress days on MPAs and a coral vulnerability index based on sea surface temperature (SST) and Kd (490), a proxy of water clarity. The Corozal Bay, Swallow Caye, Port Honduras, and South Water Caye MPAs had the highest percentages of stress days and coral vulnerability stress index score based on these two parameters among the 24 MPAs analyzed. Additionally, SST in the warmest month of the year in Belize were seen to increase across all MPAs from 2002 to 2022 (p < 0.01). This GEE toolkit provides a straightforward and accessible tool to help governments monitor both water quality and risks to coral reefs in accordance with SDG 14.
1 Introduction
Coral reefs have substantial cultural, economic, and environmental value (Kenchington, 2018; Obura et al., 2019; Mason et al., 2020). These reefs provide a host of ecosystem services through tourism, biodiversity, fisheries, and coastal protection (Lazuardi et al., 2021). Coral reefs are estimated to have an asset value of approximately $1 trillion dollars, goods and services valued at over $375 billion dollars per year, with benefits reaching around 500 million people in at least 90 nations (Hoegh-Guldberg et al., 2017). International efforts must continue to conserve these unique habitats, in light of climate change. The 2030 United Nations Agenda for Sustainable Development set forth 17 Sustainable Development Goals (SDGs) which include the most recent international goals for the sustainability and protection of oceans (United Nations, 2016; Kenchington, 2018), succeeding the 2015 Millennium Development Goals. SDG 14 entitled “Life Below Water,” most closely outlines targets and indicators for the protection of coral reefs (Hedley et al., 2018). In particular, SDG indicators 14.1.1a, 14.2.1, 14.3.1, and 14.5.1 relate directly to the health of coral reefs and surrounding water, as well as coverage of marine protected areas (United Nations, 2022). Descriptions of these indicators can be found in Supplementary Table S1. In 2021, the United Nations Environment Programme (UNEP) published an updated manual on measuring various indicators of SDG 14 (United Nations Environment Programme, 2021). This manual provides a comprehensive guide to implementing indicators via a subsection of monitoring parameters and methods under each indicator. However, for many parameters, such as water and habitat quality, ecosystem health, microalgal growth, and management effectiveness of protected areas, the UNEP states that these measurements should be taken when “national capacity to do so exists,” but does not provide any available data or methods on the parameter (United Nations Environment Programme, 2021). Therefore, there is a need for further research addressing feasible tactics for measuring these SDG 14 indicators on a national scale. The health of coral reefs may also affect the other 16 SDGs through direct benefits to the economy, indirect benefits to society, and general governance (Obura, 2020). For example, SDG 12 entitled “Responsible Consumption and Production,” includes the consumption of ecosystem services such as tourism and fishing, which are both directly impacted by the health of coral reefs. SDG 8 entitled “Decent Work and Economic Growth” includes job incomes and economic sectors also relying on tourism and fishing. SDG 2, “Zero Hunger,” is impacted by communities that rely on fish catch, which in turn relies on coral reef health. Obura’s paper assesses the interactions between coral reefs and each SDG, determining that at least 11 of the 17 SDGs are potentially or strongly affected by coral reefs (Obura, 2020).
Earth observation data has been vital for assessing coral reef health and coverage (Hedley et al., 2018; Obura et al., 2019; Mason et al., 2020). Two important water quality parameters to monitor for coral reef health include sea surface temperature (SST) and turbidity (Mason et al., 2020). SST is important to measure since anomalous warm temperatures can lead to coral bleaching, coral disease, coral death, loss of coral cover, and shifts in biodiversity (Eakin et al., 2010; Hoegh-Guldberg et al., 2017; Obura et al., 2019; Helmuth et al., 2020). Aqua MODIS SST imagery has been used for coral reefs monitoring (de Oliveira Soares et al., 2019; Putra et al., 2019). Daily SST remote sensing products are used in nowcast prediction methods such as calculating HotSpot, Degree Heating Weeks, and ReefTemp (Mason et al., 2020). In the literature, Degree Heating Weeks (DHW) is often used for assessing heat stress on coral. The NOAA Coral Reef Watch DHW product is widely used (Eakin et al., 2010; Baumann et al., 2019; De et al., 2021a; Johnson et al., 2022), but some studies have utilized Aqua MODIS SST to calculate DHW as well (Wouthuyzen et al., 2018; Williamson et al., 2022).
Water clarity or a measure of the diffuse attenuation coefficient is also important to map since corals depend on light penetration to grow (Obura et al., 2019) among other water quality parameters such as turbidity, nutrients, and sedimentation (Déath and Fabricius, 2010). Kd (490) products are used as a proxy for water clarity (Doron et al., 2007; Zoffoli et al., 2013; Sommer et al., 2018). The use of water clarity is important to use in addition to thermal stress data, especially in places such as Belize, where thermally induced bleaching events may play a lesser role compared to anthropogenic causes (Baumann et al., 2019). The Aqua MODIS Kd (490) product using the NASA operational algorithm has been used in global reefs (Sully and van Woesik, 2020; Johnson et al., 2022), Brazil (Zoffoli et al., 2013; de Oliveira Soares et al., 2019; Freitas et al., 2019), and Colombian Caribbean (Vega Sequeda et al., 2017). DWH and Kd (490) have been used in combination for coral health (de Oliveira Soares et al., 2019; Muñiz-castillo and Mcfield, 2022).
Although literature on remote sensing applications for water quality monitoring is prevalent, there is a lack of research specifically using SST and Kd (490) to measure progress toward SDG 14 indicators. A systematic literature review of papers mentioning terms related to remote sensing, water quality monitoring, SDGs, Kd (490), and SST showed results for only six published papers (Supplementary Table S2). Of the six papers, only four were relevant to the criteria after closer analysis. In one of these studies, in situ samples validated Sentinel-2 MSI satellite data showing decreased water quality in Vembanad Lake, India, after the demolition of four high rise buildings on the shore of the lake (Menon et al., 2021). This study measures sea surface temperature along with other variables such as salinity, DO, and pH. It also emphasizes that its use of lake water quality monitoring has potential to support SDGs 3, 6, 10, and 14. However, no specific indicators are mentioned and SDGs are only mentioned briefly in the paper. Additionally, this paper focuses on the involvement of the public in water monitoring rather than advancing remote sensing applications. Another study used ArcGIS 10.3.1 to map the spatial distribution of in-situ groundwater quality in Thatta, Sindh, in support of SDG 6. The study collected samples from pumps within the district that were then analyzed for parameters such as pH and turbidity (Solangi et al., 2017). Variation for each parameter was then interpolated using the “Kriging” tool to visualize water quality indicators throughout the entire district. Although this study used spatial variation to monitor groundwater, no satellite data were used, and SDGs were only mentioned briefly once. A third study targeting Vembanad Lake compared in situ water quality measurements collected from scientists with samples and observations determined by citizens through a mobile application (George et al., 2021). The study suggests that the future use of community derived data could be used to validate satellite data, and emphasizes its potential for contribution to SDG indicator 6.3.2, “proportion of bodies of water with good ambient water quality.” A final study proposed a framework involving geo-spatial maps created via remote sensing data and GIS techniques to compare water quality parameters in 13 districts of the Uttarakhand state in India in support of SDG 6 (Sahoo et al., 2022). Satellite data were applied to machine learning methods such as the random forest model in support of a water quality index. Turbidity was among the water quality parameters observed in this study, and SDG 6 was mentioned briefly as a potential use for the water quality index proposed. None of the studies in the criteria-based literature search specifically targeted monitoring of both SST and Kd (490) through satellite data in support of particular SDG 14 parameters. Therefore, further research on the use remote sensing water quality indices in support of specific SDG parameters is necessary for the expansion of accessible water quality monitoring.
Monitoring coral health through the synthesis of SST and Kd (490) data can directly address indicator 14.1.1 (a), Index of coastal eutrophication, since coral decline is often a direct result of eutrophication (D’Angelo and Wiedenmann, 2014). This index can also address indicator 14.2.1, Proportion of countries using ecosystem-based approaches to managing marine areas, as it provides an accessible way of monitoring both water quality and ecosystem health that can be applied to other water systems. Additionally, because acidification reduces the skeletal density of corals and makes them more prone to deterioration, this index could also be used to validate ocean acidification, in relation with SDG indicator 14.3.1, Average marine acidity (pH) measured at agreed suite of representative sampling station (Mollica et al., 2018). Specifically, increasing SST increases the rate of benthic respiration while lowering the ratio of productivity to respiration, therefore increasing the rate of CaCO3 sediment dissolution and leading to a lower ocean pH (Trnovsky et al., 2016). Indicator 14.5.1, coverage of protected areas in relation to marine areas, can also be benefitted by a SST and Kd (490) index, as the remote assessment of coral health would allow less accessible and larger areas to be monitored. Therefore, this study provides an important, accessible workflow model for supplementing monitoring of water quality and coral reef habitat in support of at least four indicators of SDG 14 in data scarce areas.
In this study, we created a straightforward workflow based on Google Earth Engine (GEE), RStudio, and Aqua MODIS-derived SST, DHW, and Kd (490) from 2002 to early 2022 and applied it to Marine Protected Areas (MPAs) in Belize. Region-specific thresholds were used for both SST and Kd (490) data to indicate stress days for all MPAs. A coral vulnerability index was created based on SST and Kd (490) to indicate MPAs that have experienced both turbidity and temperature stress in the last 20 years. Statistical analysis was also performed on the warmest months in Belize and visualized as maps.
2 Data and methods
The overall workflow and accompanying code for each step is outlined in Figure 1.
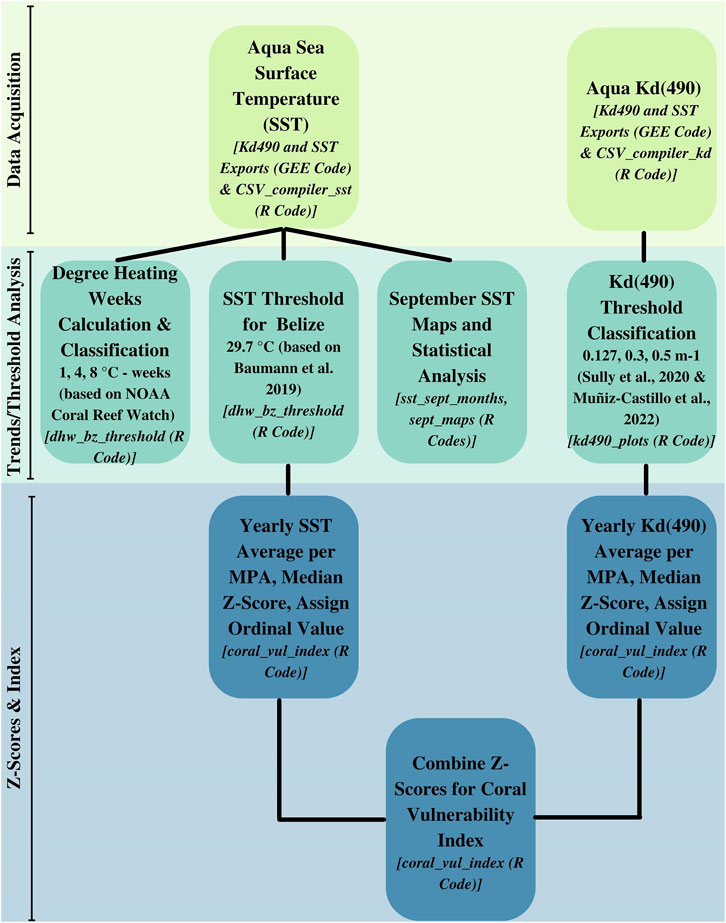
FIGURE 1. Schematic of workflow indicating data sources, processing steps, and final indices.
2.1 Study sites
Belize is a country located in Central America and home to the Belize Barrier Reef Reserve System (BBRRS). The BBRRS is the second largest barrier reef in the world and was inscribed as a UNESCO World Heritage Site in 1996 (UNESCO, 1996; Claudino-Sales, 2019). The reef system is around 250 km in length between Mexico and Guatemala. The distance between the reefs and the mainland ranges between 0.5 and 80 km (Claudino-Sales, 2019). The reef system contains reef patches, faros, fringing reefs, cays, and atolls (Perkins and Carr, 1985; Cho, 2005). Marine species within the reef include fish, manatees, invertebrates, and multiple species of sea turtles (Morales-Vela et al., 2000; Almada-Villela et al., 2002; Verutes et al., 2017). The coral reef needs clear water and consistent temperature regimes to thrive (Emrich et al., 2017; Helmuth et al., 2020). Global climate change (Martín-Arias et al., 2022), pollution (Emrich et al., 2017; Blanke et al., 2021), mining and dredging (Maidens and Burke, 2005), marine transportation (Callejas et al., 2021), algal blooms (Lapointe et al., 2021), and overfishing stand to threaten the reef ecosystems of the BBRRS (Gibson et al., 1998). Recreational tourism is also seen as a threat to the reef system (Diedrich, 2007) which accounts for over 40% of the nation’s GDP (Cheng et al., 2021).
MPAs are managed marine environments with the purpose of conserving biodiversity (Edgar et al., 2007). MPAs in Belize were established in the early 1980s beginning with the Half Moon Caye National Monument. Later through community lobbying, more areas were added to the MPA network, such as the Hol Chan Marine Reserve in 1987 (Cho, 2005). Eventually an integrated approach was necessary to account for land-based pollution from outside the bounds of the MPAs that threatened the health of the reef (Cho, 2005). Cox et al. (2017) showed that the MPA network alone had not been enough to promote the restoration of reefs in Belize. In this study, we analyzed 24 MPAs spanning the Belizean coastal lagoon as of 2020, comprising a total area of around 5,000 km2, as shown in Figure 2. Each MPA contains a variety of habitat designations, including fishing and spawning, general use, mangrove, marine and coral reefs, preservation, and special management, with some study areas becoming MPAs as early as 1982 and others as recently as 2020.
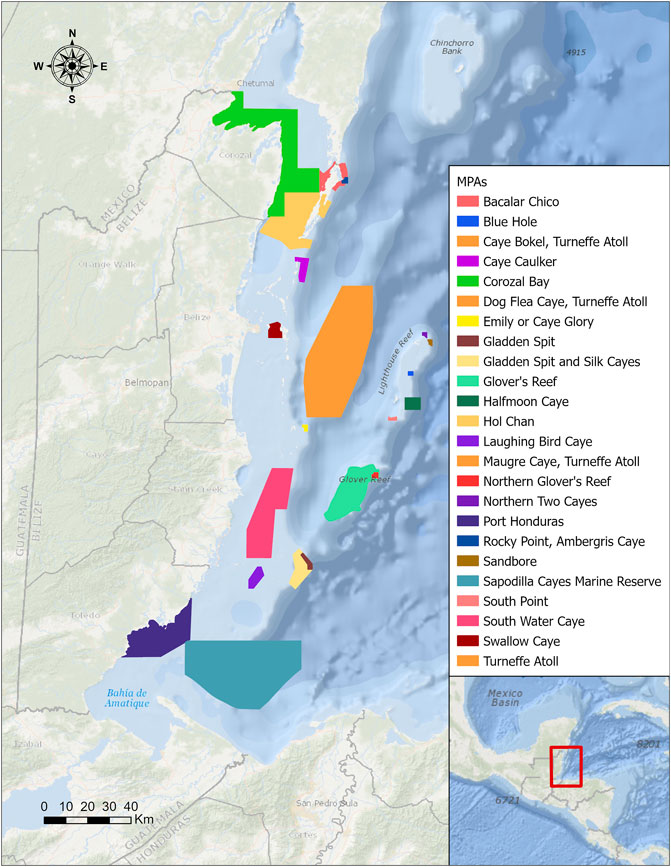
FIGURE 2. Map of Belize showing the 24 Marine Protected Areas (MPAs) created with the goal of conserving biodiversity. A variety of habitat designations are present, including fishing and spawning, general use, mangrove, marine and coral reefs, preservation, and special management.
2.2 Satellite imagery
Images from the Moderate Resolution Imaging Spectroradiometer (MODIS) on the Aqua satellite were accessed through GEE. Images included in the study are Level-3 daily data with a 4 km resolution spanning from 4 July 2002 to 28 February 2022. These images were used to calculate water clarity and sea surface temperature (SST), a combination of water quality parameters used to assess coral health (de Oliveira Soares et al., 2019).
The average vertical diffuse attenuation coefficient for downwelling irradiance at 490 nm, Kd (490), was used as a proxy for water clarity. The NASA operational algorithm was used to calculate Kd (490) (Werdell and Bailey, 2005), as we used in our previous study of water clarity in Belizean coastal waters (Callejas et al., 2021). This Kd (490) product has been used for coral health in Brazil (Zoffoli et al., 2013; de Oliveira Soares et al., 2019; Freitas et al., 2019), for an analysis of global corals (Sully and van Woesik, 2020), and corals in the Colombian Caribbean (Vega Sequeda et al., 2017).
Daily SST averages for each MPA were calculated using Aqua MODIS imagery. The MODIS SST product is commonly used to assess temperature stress on corals and impacts of SST anomalies. In addition, degree heating weeks (DHW) were calculated for all MPAs using the Aqua MODIS SST images. DHW is a common unit of measure to understand long-term thermal stress on corals (Baumann et al., 2019; Helmuth et al., 2020; De et al., 2021b). DHW calculates accumulated thermal stress over a 12-week (84 days) period. Units are in °C—weeks, where 1°C—weeks is a week of SST over the maximum monthly mean. Instead of using a maximum monthly mean, a region specific threshold for coral bleaching in Belize (29.7°C) was used instead (Aronson et al., 2002; Baumann et al., 2019). The region specific threshold was originally calculated for Channel Cay based on a 15 years record of NOAA/NASA AVHRR (Advanced Very High Resolution Radiometer) Oceans Pathfinder data (Aronson et al., 2002). Using this method, the DHW for a day is calculated over the 12-week running window including that day. The difference between the daily SST and Belizean threshold was calculated and retained for summation whenever the difference was greater or equal to 1°C, where it was then multiplied by 1/7 for the units to be in weeks. The factor of 1/7 is necessary since the development of coral bleaching occurs in the order of weeks (NOAA, 2020). DHW was calculated using the dbcaDHW package (https://github.com/dbca-wa/dbcaDHW/) in RStudio through the following formula:
2.3 Water clarity and sea surface temperature stress classifications
A literature review on Kd (490) thresholds and SST was conducted to find appropriate stress limits for corals in Belize and the Caribbean. A global coral study found that a Kd (490) value of 0.127 m−1 is too turbid for coral growth from performing a nonlinear least squares regression on the turbidity gradient within the inner Great Barrier Reef (Sully and van Woesik, 2020). For Kd (490), “turbid” months were classified based on a coral reef diversity study in the Mesoamerican Reef at 0.30 m−1 (Muñiz-castillo and Mcfield, 2022). Very turbid water was defined as Kd (490) values above 0.50 m−1 based on a Caribbean study that used this value to indicate Kd (490) anomalies (Chollett et al., 2012). The following was used for Kd (490) value classifications: 0–0.127 m−1 “Little/No Stress,” 0.127–0.3 m−1 “Turbidity Stress,” 0.3–0.5 m−1 “Turbid Month,” 0.5 m−1+ “Very Turbid.” The following are the DHW classifications: 0–1°C—weeks “Little/No Stress,” 1–4°C—weeks “Temperature stress,” 4–8°C—weeks “Bleaching Risk,” 8°C—weeks + “Mortality Risk.” Stress days are calculated as days where SST is greater than 29.7°C and Kd (490) is greater than 0.127 m−1.
2.4 Coral vulnerability index
Indices are often created in order to assess coral health (Lasagna et al., 2014; Pisapia et al., 2017) as well as overall habitat protection (Kumagai et al., 2022). Z-scores have also been used previously to normalize data for corals (Fabricius and De’ath, 2004; Guest et al., 2018). Here the SST and Kd (490) data were normalized and combined to create a coral vulnerability index which was calculated for each MPA (Guest et al., 2018; Yin et al., 2021). First, the z-score for each parameter was calculated for all MPAs through the following formula:
Here x is the mean per MPA per year, μ is the mean across all MPAs per year, and σ is the standard deviation across all MPAs per year. The median z-score was calculated for each MPA from all years. The median z-scores were then assigned an ordinal value from 1 to 6 based on the general distribution of parameters (Yin et al., 2021). The two variables were assumed to have equal weight and were added for each MPA in order to compute the coral vulnerability index from 2 to 12, where higher values indicate a higher vulnerability due to high SST and Kd (490). The following are the assigned values for the corresponding median z-score range: z > 0.4 to “6,” z = 0.2–0.4 to “5,” z = 0–0.2 to “4,” z = −0.2–0 to “3,” z = −0.4 to −0.2 to “2,” and z < −0.4 to “1.”
2.5 Statistical analysis
All subsequent visualization and calculations were performed in RStudio (R Core Team, 2020). To account for dependence between SST temperature values, or how dependent each day’s SST was on the SST of the prior day, the lme4 package was used in R to fit the September SST dataset into a linear mixed effect model (Kuznetsova et al., 2017). Linear fixed effect models can be favorable over linear regression in downscaling climate variables (Kokic et al., 2011), and have been successfully used by other studies analyzing climate trends such as warming sea temperatures (Fincham et al., 2013), decreasing sea ice cover (Johnston et al., 2012), and declining carbon sinks in the Amazon (Brienen et al., 2015).
3 Results
DHW was categorized based on the potential for accumulated temperature stress to impact corals. Figure 3A depicts SST and DHW where they were both plotted from 2002 to 2022 for select MPAs. Ten MPAs had most of their DHW measurements in the “Little/No Stress” category and occasionally have incidence with more severe risk. Around one-third of the MPAs had incidences of DHW values in the “Bleaching Risk” category and the remaining one-fourth had DHW values in the “Mortality Risk” classification. Port Honduras had the highest incidences of DHW values in the “Mortality Risk” category at 10% of all calculable DHW. In almost all MPAs, an increase in severity in DHW is found following 2016. For SST, seasonality is visible with September being the warmest month across all MPAs (Supplementary Figure S1). Higher SSTs are particularly shown in 2008, 2017, and 2020 (Figure 4). Box plots and linear regression of the September SSTs show increases with time (Supplementary Figure S2).
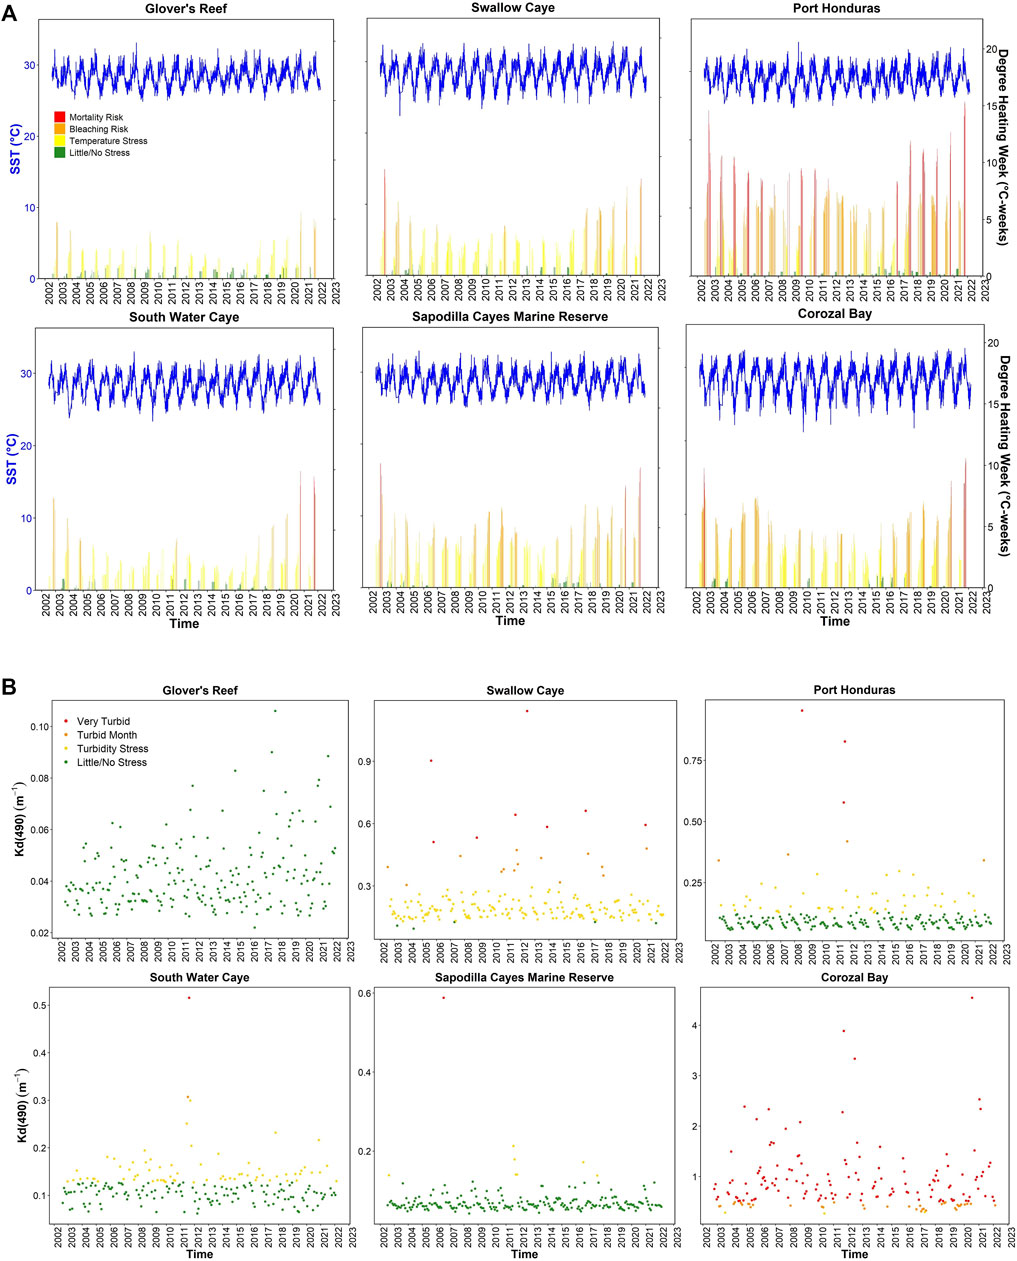
FIGURE 3. Sea surface temperature, degree heating weeks, and Kd (490) for select MPAs from 2002 to 2022. (A) Depicts SST and DHW weeks for six marine protected areas (Glover’s Reef, Swallow Caye, Port Honduras, South Water Caye, Sapodilla Cayes Marine Reserve, and Corozal Bay). (B) Shows Kd (490) values for the same MPAs from 2002 to 2022.
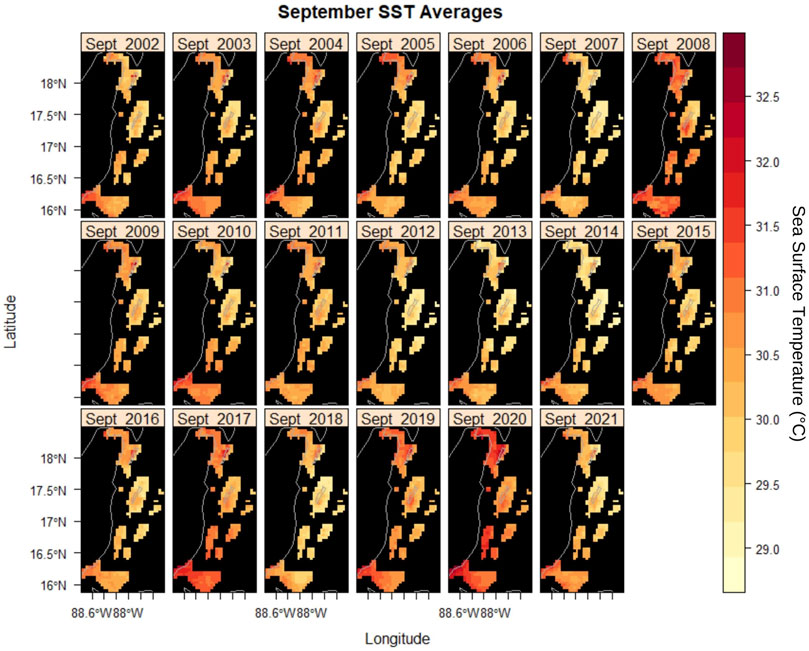
FIGURE 4. Maps show mean sea surface temperature for the month of September (hottest month) in Marine Protected Areas of Belize from 2002 to 2022.
Similarly to DHW, Kd (490) values were categorized based on thresholds and plotted as shown in Supplementary Figure S3 for all MPAs. Select plots of MPAs are in Figure 3B. In general, most MPA did not have water clarity stress, and few had consistently high values. Corozal Bay displays significantly higher Kd (490) values compared to all MPAs with most of their classifications as “Very Turbid” for the Caribbean region. Swallow Caye also had most of the Kd (490) values within the “Turbidity Stress” classification or higher and only a handful of days where average Kd (490) would have little stress on corals. Port Honduras and South Water Caye both display seasonal trends with their Kd (490) values where higher classifications of stress occur during Belize’s wet season. Other MPAs such as Laughing Bird Caye and Sapodilla Cayes Marine Reserve display seasonal trends in Kd (490) values, but all within the “Little/No Stress” category.
Using a z-score approach, sites were characterized for heat, turbidity, and a coral vulnerability index combining the two. Supplementary Table S3 lists the median z-scores and indices for SST and Kd (490) separately and the combined coral vulnerability index. Port Honduras and Sapodilla Cayes Marine Reserve have the highest SST index values while Swallow Caye and Corozal Bay have the highest Kd (490) index values. When the variables are combined for the overall index, Port Honduras is the most vulnerable, followed by Swallow Caye and Sapodilla Cayes Marine Reserve. Swallow Caye, Corozal Bay, Port Honduras, and South Water Caye had higher Kd (490) indices. Port Honduras, Sapodilla Cayes Marine Reserve, Glover’s Reef, Laughing Bird Caye, Hol Chan, Gladden Spit, and Gladden Spit and Silk Cayes had higher SST indices.
In accord with a linear fixed effect model (see Section 2.5), all 24 MPAs were assigned as random effects while year was assigned as a fixed effect in order to assess the temporal and regional effects on SST changes. Results depicted in Supplementary Tables S4, S5 show a highly significant SST increase over time (p < 0.0001) for the month of September and all data.
4 Discussion
There are international efforts being made toward the protection and conservation of coral reefs, including the “Life Below Water” goal outlined in UN SDG 14. As a result, scientists have created indices and use remote sensing to monitor environmental stressors impacting coral health. The accessible GEE toolkit presented in this work was applied to identify locations at risk for coral decline in Belize as a proof of concept for its use more broadly. Several locations in the region are shown to have multiple stressors for corals, as has been observed previously at other locations. In 2008, a coral susceptibility model was created using environmental stressors including SST, chlorophyll-a, solar radiation, and other parameters for corals in the western Indian Ocean (Maina et al., 2008). In this study, the north-western regions of the study area had high vulnerability which may be due to high SST and photosynthetically active radiation, where high solar irradiance at the surface indicates potential for heating and photochemical damage. A remote sensing coral stress index was created for corals in Saudi Arabia using the Quickbird satellite, environmental stressors, and water depth (Rowlands et al., 2012). The areas with higher coral stress index values were areas that were near large towns and cities with fishing pressure accounting for the majority of variation. Most recently, a Google Earth Engine based tool used a combination of stressors and reducers to find strong correlations between their stress exposure score and El Niño bleaching events for corals in the Red Sea, Chagos Archipelago, and Gilbert Islands (Williamson et al., 2022). While this tool extensively uses SST in their score along with other factors like wind, they do not include water clarity as the toolkit presented here.
Using our toolkit, we saw that nearshore MPAs such as Swallow Caye, Corozal Bay, Port Honduras, and South Water Caye had the highest z-scores based on Kd (490) alone. This is supported by previous studies that show physical connectivity as evidence through chlorophyll-a between land and the BBRRS (Soto et al., 2009), sewage plumes off Caye Caulker, Belize (Emrich et al., 2017), and excess nutrients near Belize City (Lapointe et al., 2021). Deviating from the typical use of thermal data for indices, Canto et al. created a light-based index for the Great Barrier Reef based on MODIS Kd data. Using a color-coded scoring system, similar to the methodology in our workflow, the study found strong correlations between “wet” years and discharge data with water clarity for inshore locations (Canto et al., 2021). If runoff and discharge indeed play a major role in water clarity patterns nearshore, then we may expect these patterns to change in the future as the southern region of Belize is projected to experience less precipitation and runoff by 2090 (Martín-Arias et al., 2022).
Arora et al. (2019) employed remotely sensed data in the calculation of coral stress indices including DHW for five major Indian coral reef regions from 1982 to 2018 (Arora et al., 2019). De et al. (2021) successfully integrated remotely sensed SST data into a coral health monitoring program in the Eastern Arabian Sea. Large scale bleaching events resulting from the marine heatwave associated with the 2014–2016 El Niño-Southern Oscillation were indicated by bleaching indices relying on remotely sensed data and corroborated with underwater coral health surveys. DHWs for this study site were 4.80, 5.09, and 6.92 for the years 2014, 2015, and 2016, respectively. These values are comparable with max DHW values for vulnerable Belizean MPAs such as Corozal Bay (3.17 in 2014 and 5.25 in 2015 and 2016) and Port Honduras (6.08 in 2014, 6.65 in 2015, and 8.34 in 2016). Baumann et al., 2019 found DHW ranged between 3.80 and 6.55 in Belize in 2015. The highest instances of Mortality and Bleaching Risk instances calculated with this workflow were greatest in 2002, 2003, 2006, 2011, 2012, and the years following 2017, which align well with years reported for having mass bleaching events in the Caribbean (Baumann et al., 2019). This shows that using Aqua MODIS-derived SST to calculate DHW is also comparable to NOAA Coral Reef Watch DHW. Future studies and uses of this workflow should verify these types of findings with coral bleaching data or El Niño-Southern Oscillation years.
The upward trend in September SST is in line with what is being observed globally due to climate change. SST has increased on average by 0.14°F each decade for the past 120 years (EPA, 2021). Additional studies have shown especially high temperature increases in September, such as a paper comparing coral reef bleaching and SST over a 30 years time period in La Parguera, Puerto Rico (Winter et al., 1998). This study demonstrated recurring severe coral bleaching in coincidence with sharp temperature rises in September, with an overall increasing trend throughout the assessed time period. SST has increased by at least 1.1°C since the pre-industrial area, and an estimated 60% of marine ecosystems have been degraded (United Nations). A SST increase of 1.5°C could threaten 70%–90% of coral reefs, while a 2°C increase is predicted to destroy nearly 100% of all coral reefs permanently (United Nations).
In 1998, the government of Belize passed the Coastal Zone Management Act to mitigate issues surrounding rapid development, overfishing, and rapid population growth. The Belize Coastal Zone Management Authority and Institute (CZMAI) is the leading authority in the nation’s management of coastal resources and is responsible for the development of the National Integrated Coastal Zone Management Plan (ICZMP). The goal of the ICZMP involves a set of recommended actions to ensure sustainable use of coastal resources with conservation and social and economic needs in mind (Coastal Zone Management Authority and Institute (CZMAI), 2016). The most recent plan released in 2016 developed projected scenarios for 2025 based on three approaches: conservation, informed management, and development. Since 2016, additional development activities such as dredging have occurred which may have effects on water clarity along with general climate change effects. CZMAI is currently looking to revise the 2016 ICZMP by looking at impacts of development on their coastline with specific interest on effects following the plan itself. This document is paving the way for the recently launched Marine Spatial Planning (MSP) process, renamed the Belize Sustainable Ocean Plan, which is a partnership between the Government of Belize and The Nature Conservancy. The MSP is part of a set of agreements that will enable the country’s debt conversion for marine conservation and will be legally enforceable. Under this plan, biodiversity protection zones will be increased from 15.9% to 30% of Belize’s open ocean (Government of Belize Press Office, 2022).
Through this work, we identified Port Honduras, Swallow Caye, Sapodilla Cayes Marine Reserve, and Corozal Bay as recommended MPAs for closer monitoring. In particular, Corozal Bay showed a high level of turbidity and heat stress consistently. Swallow Caye had turbidity stress most of the time, while Port Honduras and South Water Caye showed strong seasonal trends. This GEE workflow has the potential to be used in conjunction with in situ data to continue to monitor climatic and anthropogenic changes in water quality. The flexibility and dynamic nature of the toolkit will enable governmental entities to monitor new areas, especially with the expansion of protection zones under the new MSP.
For future research, it would be beneficial to add other potential variables as indicators of coral vulnerability that could be remotely detected such as chlorophyll-a measurements and toxic heavy metals concentrations. Chlorophyll-a is a key indicator of phytoplankton biomass, which can be used to assess the eutrophic status of water bodies, or the level of nutrients enriched within the water. Some papers have had success integrating chlorophyll-a as a variable among SST and turbidity to assess coral health (Otero and Carbery, 2005; Ennis et al., 2016). Coastal areas such as the MPAs of Belize assessed in this study are especially important for chlorophyll-a monitoring because of their vulnerable ecosystems. Toxic heavy metals are also a major threat to coral health and their existence in marine ecosystems indicates a major concern for marine life. Even at low concentrations, heavy metals released into the oceans via anthropogenic activity such as mercury, lead, and arsenic can kill corals (Goodchild van Hilten, 2015). Existent studies sample heavy metal concentrations in marine water with respect to coral health (Sabdono, 2009; Berry et al., 2013). Therefore, with further research, it should be possible to use remote sensing techniques such as those described in these studies to also map chlorophyll-a and heavy metal concentrations as additional indicators of coral health.
Prior to the creation of this workflow, coral indices and remote sensing products used to monitor water quality are mainly on thermal variables and geared toward well-studied reef systems such as the Great Barrier Reef. The workflow outlined here draws attention to certain Belizean MPAs in terms of conservation of coral health using freely-available data on SST and water clarity in Google Earth Engine and downstream analysis in RStudio. The accessibility of the data used and ability to replicate the analysis with ready to use tools and workflows is necessary to have robust management of coastal resources and understanding of climate impacts. Users are able to adapt thresholds to their own needs, add other stressors, and change the weights of the variable in the index. This toolkit is critical in areas that lack long-term measures of water quality parameters like Belize. Aside from the integration of additional coral stress indicators, future improvements of this toolkit could include comparisons of data with in situ samples for further validation. Because current marine sampling data is limited in Belize, it is necessary to collect more in situ data to assess water quality indicators, especially in the significant MPAs in this paper such as Port Honduras, Swallow Caye, Sapodilla Cayes Marine Reserve, and Corozal Bay.
5 Conclusion
The monitoring of water quality is extremely important for assessing the health of coral reefs and protecting coastal and marine resources. Remote sensing is a powerful tool for monitoring thermal stress and water clarity, two very important environmental stressors for coral. The work presented here used both Aqua MODIS-derived SST and Kd (490) with imagery from 2002 to 2022 to identify seasonal and long-term patterns in 24 of Belize’s MPAs. Coral stress was analyzed using two approaches, one based on previously identified thresholds for SST and Kd (490) for suitable conditions for corals, and one based on the distribution of these parameters among all sites in the study. With the use of this workflow, certain MPAs are revealed to suffer from either high SST, turbidity, or both, which was the case with Port Honduras. The hottest month in Belize is September, and an analysis of mean SST for that month over the time period of the study revealed statistically significant upward trends at all sites (p < 0.01). The easy accessibility and reproducibility of results for MPAs and corals in general can help other data scarce nations manage their coastal resources while striving to meet the UN SDGs. Future work should aim to involve other known environmental stressors such as chlorophyll-a as well as in situ data.
Data availability statement
The full workflow, codes, and data can be found on GitHub (https://github.com/iacallejas/belize-sdg).
Author contributions
IC, KO, JJ, DM, and CL wrote the manuscript. IC and KO developed the scripts and performed the data processing and analysis. CL, DM, RG, and EC conceived the study and CL, JJ, and DM co-advised the research. CL, RG, and JJ acquired funding. EC, AC, RG, NA, AR, and SR contributed to development of the project and manuscript editing.
Funding
This work was supported by the NASA RRNES (Grant #80NSSC20K1746) and NASA ROSES A.8 (cooperative agreement number #80NSSC19K0200), UCLA’s Center for Diverse Leadership in Science, the Joan Doren Family Foundation, NSF NRT: Graduate Traineeship in Integrated Urban Solutions for Food, Energy, and Water Management-DGE-1735325, and the California NanoSystems Institute. This work was performed in part at the Jet Propulsion Laboratory, California Institute of Technology, under contract with the National Aeronautics and Space Administration.
Acknowledgments
We would like to thank Wildlife Conservation Society Belize and Coastal Zone Management Authority and Institute for their support during the project.
Conflict of interest
The authors declare that the research was conducted in the absence of any commercial or financial relationships that could be construed as a potential conflict of interest.
Publisher’s note
All claims expressed in this article are solely those of the authors and do not necessarily represent those of their affiliated organizations, or those of the publisher, the editors and the reviewers. Any product that may be evaluated in this article, or claim that may be made by its manufacturer, is not guaranteed or endorsed by the publisher.
Supplementary material
The Supplementary Material for this article can be found online at: https://www.frontiersin.org/articles/10.3389/frsen.2022.1020184/full#supplementary-material
References
Almada-Villela, P., McField, M., Kramer, P. A., Richards, P., and Arias-Gonzalez, E. (2002). Status of coral reefs of mesoamerica – Mexico, Belize, Guatemala, Honduras, Nicaragua and El Salvador. Status Coral Reefs World 2002, 303–324.
Aronson, R. B., Precht, W. F., Toscano, M. A., and Koltes, K. H. (2002). The 1998 bleaching event and its aftermath on a coral reef in Belize. Mar. Biol. 1413 141, 435–447. doi:10.1007/S00227-002-0842-5
Arora, M., Gujrati, A., Chaudhury, N. R., Chauhan, P., and Patel, R. C. (2019). Assessment of coral reef thermal stress over India based on remotely sensed sea surface temperature. Geocarto Int. 36, 740–757. doi:10.1080/10106049.2019.1624983
Baumann, J. H., Ries, J. B., Rippe, J. P., Courtney, T. A., Aichelman, H. E., Westfield, I., et al. (2019). Nearshore coral growth declining on the mesoamerican barrier reef system. Glob. Chang. Biol. 25, 3932–3945. doi:10.1111/gcb.14784
Berry, K. L. E., Seemann, J., Dellwig, O., Struck, U., Wild, C., and Leinfelder, R. R. (2013). Sources and spatial distribution of heavy metals in scleractinian coral tissues and sediments from the Bocas del Toro Archipelago, Panama. Environ. Monit. Assess. 185, 9089–9099. doi:10.1007/S10661-013-3238-8
Blanke, J. M., Steinberg, M. K., and Donlevy, J. P. (2021). A baseline analysis of marine debris on southern islands of Belize. Mar. Pollut. Bull. 172, 112916. doi:10.1016/J.MARPOLBUL.2021.112916
Brienen, R. J. W., Phillips, O. L., Feldpausch, T. R., Gloor, E., Baker, T. R., Lloyd, J., et al. (2015). Long-term decline of the Amazon carbon sink. Nature 519, 344–348. doi:10.1038/nature14283
Callejas, I. A., Lee, C. M., Mishra, D. R., Felgate, S. L., Evans, C., Carrias, A., et al. (2021). Effect of COVID-19 anthropause on water clarity in the Belize coastal lagoon. Front. Mar. Sci. 8, 490. doi:10.3389/FMARS.2021.648522
Canto, M. M., Fabricius, K. E., Logan, M., Lewis, S., McKinna, L. I. W., and Robson, B. J. (2021). A benthic light index of water quality in the Great Barrier Reef, Australia. Mar. Pollut. Bull. 169, 112539. doi:10.1016/J.MARPOLBUL.2021.112539
Cheng, J., Zetina, Z., Cheng, J., and Zetina, Z. (2021). A study to investigate the impact of the COVID-19 pandemic on tourist arrivals in Belize. Open J. Soc. Sci. 9, 326–334. doi:10.4236/JSS.2021.97023
Cho, L. (2005). Marine protected areas: A tool for integrated coastal management in Belize. Ocean. Coast. Manag. 48, 932–947. doi:10.1016/J.OCECOAMAN.2005.03.007
Chollett, I., Mumby, P. J., Müller-Karger, F. E., and Hu, C. (2012). Physical environments of the caribbean sea. Limnol. Oceanogr. 57, 1233–1244. doi:10.4319/LO.2012.57.4.1233
Claudino-Sales, V. (2019). Belize barrier reef system, Belize. Dordrecht: Coastal Research Library, Springer, 451–456. doi:10.1007/978-94-024-1528-5_66
Coastal Zone Management Authority and Institute (Czmai) (2016). Belize integrated coastal zone management plan: The vision for our coast (ICZMP). Minsitry Agric. For. Fish. Environ. Sustain. Dev. 265.
Cox, C., Valdivia, A., McField, M., Castillo, K., and Bruno, J. F. (2017). Establishment of marine protected areas alone does not restore coral reef communities in Belize. Mar. Ecol. Prog. Ser. 563, 65–79. doi:10.3354/meps11984
D’Angelo, C., and Wiedenmann, J. (2014). Impacts of nutrient enrichment on coral reefs: New perspectives and implications for coastal management and reef survival. Curr. Opin. Environ. Sustain. 7, 82–93. doi:10.1016/J.COSUST.2013.11.029
De, K., Nanajkar, M., Arora, M., Nithyanandan, M., Mote, S., and Ingole, B. (2021a). Application of remotely sensed sea surface temperature for assessment of recurrent coral bleaching (2014-2019) impact on a marginal coral ecosystem. Geocarto Int. 37, 4483–4508. doi:10.1080/10106049.2021.1886345
de Oliveira Soares, M., Teixeira, C. E. P., Ferreira, S. M. C., Gurgel, A. L. A. R., Paiva, B. P., Menezes, M. O. B., et al. (2019). Thermal stress and tropical reefs: Mass coral bleaching in a stable temperature environment? Mar. Biodivers. 49, 2921–2929. doi:10.1007/s12526-019-00994-4
Déath, G., and Fabricius, K. (2010). Water quality as a regional driver of coral biodiversity and macroalgae on the Great Barrier Reef. Ecol. Appl. 20, 840–850. doi:10.1890/08-2023.1
Diedrich, A. (2007). The impacts of tourism on coral reef conservation awareness and support in coastal communities in Belize. Coral Reefs 26, 985–996. doi:10.1007/s00338-007-0224-z
Doron, M., Babin, M., Mangin, A., and Hembise, O. (2007). Estimation of light penetration, and horizontal and vertical visibility in oceanic and coastal waters from surface reflectance. J. Geophys. Res. 112, C06003. doi:10.1029/2006JC004007
Eakin, C. M., Morgan, J. A., Heron, S. F., Smith, T. B., Liu, G., Alvarez-Filip, L., et al. (2010). Caribbean corals in crisis: Record thermal stress, bleaching, and mortality in 2005. PLoS One 5, e13969. doi:10.1371/JOURNAL.PONE.0013969
Edgar, G. J., Russ, G. R., and Babcock, R. C. (2007). Marine protected areas. Chapter 19Available at: https://www.researchgate.net/profile/R_Babcock/publication/284222610_Marine_protected_areas/links/57eaf01508aeafc4e88a5864/Marine-protected-areas.pdf.
Emrich, K., Martinez-Colon, M., and Alegria, H. (2017). Is untreated sewage impacting coral reefs of Caye Caulker, Belize? J. Foraminifer. Res. 47, 20–33. doi:10.2113/gsjfr.47.1.20
Ennis, R. S., Brandt, M. E., Wilson Grimes, K. R., and Smith, T. B. (2016). Coral reef health response to chronic and acute changes in water quality in St. Thomas, United States Virgin Islands. Mar. Pollut. Bull. 111, 418–427. doi:10.1016/J.MARPOLBUL.2016.07.033
Epa, (2021). Climate change indicators: Sea surface temperature. U. S. Environ. Prot. Agency. Available at: https://www.epa.gov/climate-indicators/climate-change-indicators-sea-surface-temperature [Accessed August 3, 2022].
Fabricius, K. E., and De’ath, G. (2004). Identifying ecological change and its causes: A case study on coral reefs. Ecol. Appl. 14, 1448–1465. doi:10.1890/03-5320
Fincham, J. I., Rijnsdorp, A. D., and Engelhard, G. H. (2013). Shifts in the timing of spawning in sole linked to warming sea temperatures. J. Sea Res. 75, 69–76. doi:10.1016/J.SEARES.2012.07.004
Freitas, L. M., Oliveira, M. de D. M., Leão, Z. M. A. N., and Kikuchi, R. K. P. (2019). Effects of turbidity and depth on the bioconstruction of the Abrolhos reefs. Coral Reefs 38, 241–253. doi:10.1007/s00338-019-01770-3
George, G., Menon, N. N., Abdulaziz, A., Brewin, R. J. W., Pranav, P., Gopalakrishnan, A., et al. (2021). Citizen scientists contribute to real-time monitoring of lake water quality using 3D printed mini secchi disks. Front. Water 3, 40. doi:10.3389/frwa.2021.662142
Gibson, J., McField, M., and Wells, S. (1998). Coral reef management in Belize: An approach through integrated coastal zone management. Ocean. Coast. Manag. 39, 229–244. doi:10.1016/S0964-5691(98)00007-6
Goodchild van Hilten, L. (2015). How copying coral could help remove toxins from the ocean. Amsterdam, Netherlands: Elsevier. Available at: https://www.elsevier.com/connect/archive/how-copying-coral-could-help-remove-toxins-from-the-ocean [Accessed August 14, 2022].
Government of Belize Press Office (2022). Press release: Official launch of Belize’s marine spatial planning process. Belmopan, Belize: Government of Belize Press Office.
Guest, J. R., Edmunds, P. J., Gates, R. D., Kuffner, I. B., Andersson, A. J., Barnes, B. B., et al. (2018). A framework for identifying and characterising coral reef “oases” against a backdrop of degradation. J. Appl. Ecol. 55, 2865–2875. doi:10.1111/1365-2664.13179
Hedley, J. D., Roelfsema, C., Brando, V., Giardino, C., Kutser, T., Phinn, S., et al. (2018). Coral reef applications of Sentinel-2: Coverage, characteristics, bathymetry and benthic mapping with comparison to Landsat 8. Remote Sens. Environ. 216, 598–614. doi:10.1016/J.RSE.2018.07.014
Helmuth, B., Leichter, J. J., Rotjan, R. D., Castillo, K. D., Fieseler, C., Jones, S., et al. (2020). High resolution spatiotemporal patterns of seawater temperatures across the Belize Mesoamerican Barrier Reef. Sci. Data 7, 396–6. doi:10.1038/s41597-020-00733-6
Hoegh-Guldberg, O., Poloczanska, E. S., Skirving, W., and Dove, S. (2017). Coral reef ecosystems under climate change and ocean acidification. Front. Mar. Sci. 4, 158. doi:10.3389/fmars.2017.00158
Johnson, J. V., Dick, J. T. A., and Pincheira-Donoso, D. (2022). Marine protected areas do not buffer corals from bleaching under global warming. BMC Ecol. Evol. 22, 58. doi:10.1186/S12862-022-02011-Y
Johnston, D. W., Bowers, M. T., Friedlaender, A. S., and Lavigne, D. M. (2012). The effects of climate change on harp seals (pagophilus groenlandicus). PLoS One 7, e29158. doi:10.1371/JOURNAL.PONE.0029158
Kenchington, R. (2018). Science and the management of coral reefs. Mar. Pollut. Bull. 136, 508–515. doi:10.1016/J.MARPOLBUL.2018.09.046
Kokic, P., Crimp, S., and Howden, M. (2011). Forecasting climate variables using a mixed-effect state-space model. Environmetrics 22, 409–419. doi:10.1002/ENV.1074
Kumagai, J. A., Favoretto, F., Pruckner, S., Rogers, A. D., Weatherdon, L. V., Aburto-Oropeza, O., et al. (2022). Habitat Protection Indexes - new monitoring measures for the conservation of coastal and marine habitats. Sci. Data 91 (9), 203. doi:10.1038/s41597-022-01296-4
Kuznetsova, A., Brockhoff, P. B., and Christensen, R. H. B. (2017). lmerTest package: Tests in linear mixed effects models. J. Stat. Softw. 82, 1–26. doi:10.18637/JSS.V082.I13
Lapointe, B. E., Tewfik, A., and Phillips, M. (2021). Macroalgae reveal nitrogen enrichment and elevated N:P ratios on the Belize Barrier Reef. Mar. Pollut. Bull. 171, 112686. doi:10.1016/j.marpolbul.2021.112686
Lasagna, R., Gnone, G., Taruffi, M., Morri, C., Bianchi, C. N., Parravicini, V., et al. (2014). A new synthetic index to evaluate reef coral condition. Ecol. Indic. 40, 1–9. doi:10.1016/J.ECOLIND.2013.12.020
Lazuardi, W., Wicaksono, P., and Marfai, M. A. (2021). Remote sensing for coral reef and seagrass cover mapping to support coastal management of small islands. IOP Conf. Ser. Earth Environ. Sci. 686, 012031. doi:10.1088/1755-1315/686/1/012031
Maina, J., Venus, V., McClanahan, T. R., and Ateweberhan, M. (2008). Modelling susceptibility of coral reefs to environmental stress using remote sensing data and GIS models. Ecol. Modell. 212, 180–199. doi:10.1016/J.ECOLMODEL.2007.10.033
Martín-Arias, V., Evans, C., Grif, R., Cherrington, E. A., Lee, C. M., Mishra, D. R., et al. (2022). Modeled impacts of LULC and climate change predictions on the hydrologic regime in Belize. Front. Environ. Sci. 10, 1–16. doi:10.3389/fenvs.2022.848085
Mason, R. A. B., Skirving, W. J., and Dove, S. G. (2020). Integrating physiology with remote sensing to advance the prediction of coral bleaching events. Remote Sens. Environ. 246, 111794. doi:10.1016/J.RSE.2020.111794
Menon, N., George, G., Ranith, R., Sajin, V., Murali, S., Abdulaziz, A., et al. (2021). Citizen science tools reveal changes in estuarine water quality following demolition of buildings. Remote Sens. (Basel). 13, 1683. doi:10.3390/RS13091683
Mollica, N. R., Guo, W., Cohen, A. L., Huang, K. F., Foster, G. L., Donald, H. K., et al. (2018). Ocean acidification affects coral growth by reducing skeletal density. Proc. Natl. Acad. Sci. U. S. A. 115, 1754–1759. doi:10.1073/PNAS.1712806115
Morales-Vela, B., Olivera-Gómez, D., Reynolds, J. E., and Rathbun, G. B. (2000). Distribution and habitat use by manatees (Trichechus manatus manatus) in Belize and Chetumal Bay, Mexico. Biol. Conserv. 95, 67–75. doi:10.1016/S0006-3207(00)00009-4
Muñiz-castillo, A. I., and Mcfield, M. (2022). Additive influence of extreme events and local stressors on coral diversity in the Mesoamerican Reef during the last decade. Berlin, Germany: Springer, 1–25.
Noaa (2020). “NOAA coral reef Watch methodol,” in Methodology, product description, and data availability of NOAA coral reef watch's version 3.1 daily global 5km satellite coral bleaching heat stress monitoring products (Kundapur, India: Coral Reef Watch). Available at: https://coralreefwatch.noaa.gov/product/5km/methodology.php#dhw [Accessed July 25, 2022].
Obura, D. O., Aeby, G., Amornthammarong, N., Appeltans, W., Bax, N., Bishop, J., et al. (2019). Coral reef monitoring, reef assessment technologies, and ecosystem-based management. Front. Mar. Sci. 6, 580. doi:10.3389/fmars.2019.00580
Obura, D. O. (2020). Getting to 2030 - scaling effort to ambition through a narrative model of the SDGs. Mar. Policy 117, 103973. doi:10.1016/J.MARPOL.2020.103973
Otero, E., and Carbery, K. K. (2005). Chlorophyll a and turbidity patterns over coral reefs systems of La Parguera Natural Reserve, Puerto Rico. Rev. Biol. Trop. 53, 25–32. Available at: http://www.scielo.sa.cr/scielo.php?script=sci_arttext&pid=S0034-77442005000300007&lng=en&nrm=iso&tlng=en [Accessed August 14, 2022].
Perkins, J. S., and Carr, A. (1985). The Belize Barrier Reef: Status and prospects for conservation management. Biol. Conserv. 31, 291–301. doi:10.1016/0006-3207(85)90087-4
Pisapia, C., El Kateb, A., Hallock, P., and Spezzaferri, S. (2017). Assessing coral reef health in the north ari atoll (Maldives) using the FoRAM index. Mar. Micropaleontol. 133, 50–57. doi:10.1016/J.MARMICRO.2017.06.001
Putra, R. D., Suhana, M. P., Kurniawn, D., Abrar, M., Siringoringo, R. M., Sari, N. W. P., et al. (2019). Detection of reef scale thermal stress with Aqua and Terra MODIS satellite for coral bleaching phenomena. AIP Conf. Proc. 2094, 020024. doi:10.1063/1.5097493
R Core Team (2020). R: A language and environment for statistical computing. R. Found. Stat. Comput. Available at: https://www.r-project.org/.
Rowlands, G., Purkis, S., Riegl, B., Metsamaa, L., Bruckner, A., and Renaud, P. (2012). Satellite imaging coral reef resilience at regional scale. A case-study from Saudi Arabia. Mar. Pollut. Bull. 64, 1222–1237. doi:10.1016/J.MARPOLBUL.2012.03.003
Sabdono, A. (2009). Heavy metal levels and their potential toxic effect on coral galaxea fascicularis from java sea, Indonesia. Res. J. Environ. Sci. 3, 96–102. doi:10.3923/RJES.2009.96.102
Sahoo, K., Kimothi, S., Thapliyal, A., Akram, S. V., Singh, R., Gehlot, A., et al. (2022). Big data analysis framework for water quality indicators with assimilation of IoT and ML. Electronics 11, 1927. doi:10.3390/ELECTRONICS11131927
Solangi, G. S., Siyal, A. A., Babar, M. M., and Siyal, P. (2017). Groundwater quality mapping using geographic information system: A case study of district thatta, sindh. Mehran Univ. Res. J. Eng. Technol. 36, 1059–1072. doi:10.22581/muet1982.1704.30
Sommer, B., Beger, M., Harrison, P. L., Babcock, R. C., and Pandolfi, J. M. (2018). Differential response to abiotic stress controls species distributions at biogeographic transition zones. Ecography 41, 478–490. doi:10.1111/ECOG.02986
Soto, I., Andréfouët, S., Hu, C., Muller-Karger, F. E., Wall, C. C., Sheng, J., et al. (2009). Physical connectivity in the Mesoamerican Barrier Reef System inferred from 9 years of ocean color observations. Coral Reefs 28, 415–425. doi:10.1007/s00338-009-0465-0
Sully, S., and van Woesik, R. (2020). Turbid reefs moderate coral bleaching under climate-related temperature stress. Glob. Chang. Biol. 26, 1367–1373. doi:10.1111/GCB.14948
Trnovsky, D., Stoltenberg, L., Cyronak, T., and Eyre, B. D. (2016). Antagonistic effects of ocean acidification and rising sea surface temperature on the dissolution of coral reef carbonate sediments. Front. Mar. Sci. 3, 211. doi:10.3389/fmars.2016.00211
Unesco (1996). World heritage committee; 20th; convention concerning the protection of the world cultural and natural heritage, report (Paris, France: UNESCO).
United Nations Environment Programme, (2021). Understanding the state of the ocean: A global manual on measuring SDG 14.1.1, SDG 14.2.1 and SDG 14.5.1. Nairobi, Kenya: United Nations Environment Programme.
United Nations (2022). Goal 14. NY, USA: United Nations. Available at: https://sdgs.un.org/goals/goal14 [Accessed August 3, 2022].
United Nations How is climate change impacting the world’s ocean. NY, USA: United Nations. Available at: https://www.un.org/en/climatechange/science/climate-issues/ocean-impacts [Accessed August 3, 2022].
United Nations (2016). The 17 goals - sustainable development. NY, USA: United Nations. Available at: https://sdgs.un.org/goals [Accessed October 11, 2021].
Vega Sequeda, J. C., Zea, S., and Bernal, G. (2017). Effect of extreme oceanic events in the coral formations of Islas del Rosario, Colombian Caribbean. Cic. Ocea. 32, 25–38. doi:10.37543/oceanides.v32i1.194
Verutes, G. M., Arkema, K. K., Clarke-Samuels, C., Wood, S. A., Rosenthal, A., Rosado, S., et al. (2017). Integrated planning that safeguards ecosystems and balances multiple objectives in coastal Belize. Int. J. Biodivers. Sci. Ecosyst. Serv. Manag. 13, 1–17. doi:10.1080/21513732.2017.1345979
Werdell, P. J., and Bailey, S. W. (2005). An improved in-situ bio-optical data set for ocean color algorithm development and satellite data product validation. Remote Sens. Environ. 98, 122–140. doi:10.1016/j.rse.2005.07.001
Williamson, M. J., Tebbs, E. J., Dawson, T. P., Thompson, H. J., Head, C. E. I., and Jacoby, D. M. P. (2022). Monitoring shallow coral reef exposure to environmental stressors using satellite Earth observation: The reef environmental stress exposure toolbox (RESET). Remote Sens. Ecol. Conserv. doi:10.1002/RSE2.286
Winter, A., Appeldoorn, R. S., Bruckner, A., Williams, E. H., and Goenaga, C. (1998). Sea surface temperatures and coral reef bleaching off La Parguera, Puerto Rico (northeastern Caribbean Sea). Coral Reefs 17, 377–382. doi:10.1007/S003380050143
Wouthuyzen, S., Abrar, M., and Lorwens, J. (2018). A comparison between the 2010 and 2016 El-Ninō induced coral bleaching in the Indonesian waters. IOP Conf. Ser. Earth Environ. Sci. 118, 1–15. doi:10.1088/1755-1315/118/1/012051
Yin, Y., Grundstein, A., Mishra, D. R., Ramaswamy, L., Hashemi Tonekaboni, N., and Dowd, J. (2021). DTEx: A dynamic urban thermal exposure index based on human mobility patterns. Environ. Int. 155, 106573. doi:10.1016/J.ENVINT.2021.106573
Keywords: remote sensing, turbidity, Kd (490), Google Earth Engine, heat stress, coral vulnerability
Citation: Callejas IA, Osborn K, Lee C, Mishra DR, Auil Gomez N, Carrias A, Cherrington EA, Griffin R, Rosado A, Rosado S and Jay J (2022) A GEE toolkit for water quality monitoring from 2002 to 2022 in support of SDG 14 and coral health in marine protected areas in Belize. Front. Remote Sens. 3:1020184. doi: 10.3389/frsen.2022.1020184
Received: 15 August 2022; Accepted: 07 November 2022;
Published: 22 November 2022.
Edited by:
Abel Ramoelo, University of Pretoria, South AfricaReviewed by:
Kgabo Humphrey Thamaga, University of the Western Cape, South AfricaMahlatse Kganyago, University of Johannesburg, South Africa
Copyright © 2022 Callejas, Osborn, Lee, Mishra, Auil Gomez, Carrias, Cherrington, Griffin, Rosado, Rosado and Jay. This is an open-access article distributed under the terms of the Creative Commons Attribution License (CC BY). The use, distribution or reproduction in other forums is permitted, provided the original author(s) and the copyright owner(s) are credited and that the original publication in this journal is cited, in accordance with accepted academic practice. No use, distribution or reproduction is permitted which does not comply with these terms.
*Correspondence: Christine Lee, Y2hyaXN0aW5lLm0ubGVlQGpwbC5uYXNhLmdvdg==