 Thais Andrade Galvão Medeiros1*
 María Laura Zoffoli1,2
 Robert Frouin3
 Fábio Dall Cortivo1
 Gabriel Moiano Cesar1
 Milton Kampel1
- 1Earth Observation and Geoinformatics Division, National Institute for Space Research (INPE), São José dos Campos, Brazil
- 2Istituto di Scienze Marine (ISMAR), Consiglio Nazionale delle Ricerche (CNR), Rome, Italy
- 3Scripps Institution of Oceanography, University California San Diego, La Jolla, CA, United States
The Abrolhos Bank harbors the richest coral reef ecosystem in the South Atlantic Ocean. It exhibits unique geomorphologic structures, is localized in shallow depths, and is divided into two reef regions with an inner arc close to the coast (3–20 m depth) and an outer deeper arc (5–30 m depth). This study aims to describe some bio-optical properties of the Abrolhos Bank waters and to evaluate the performance of the inversion Hyperspectral Optimization Processing Exemplar (HOPE) model, developed to retrieve optical properties in shallow waters, in the region. To this end, measurements at 75 stations during two field campaigns conducted during the 2013 and 2016 wet seasons were analyzed, and the HOPE model was applied to both in situ remote sensing reflectance (Rrs) spectra and PRecursore IperSpettrale della Missione Applicativa (PRISMA) imagery. Significant differences in optical and biological properties were found between the two arcs. The empirical relationships between chlorophyll-a concentration (Chl-a) and absorption coefficient of phytoplankton at 440 nm (aphy(440)) diverged from Bricaud’s models, suggesting differences in phytoplankton diversity and cell size. In both arcs, total non-water absorption coefficient at 440 nm (aT-w(440)) was dominated by colored dissolved organic matter (CDOM) by ∼60%. Absorption coefficient by CDOM (acdom) presented a higher variability within the outer arc, with the lowest contribution from non-algal particles (NAPs), and the spectral slopes of aCDOM resembled those of the inner arc. The spectral slopes of the NAP absorption coefficient suggested a dominance by organic rather than mineral particles that probably originated from biological production. The HOPE model applied to in situ Rrs performed satisfactorily for depth in the Abrolhos Bank waters, although retrievals of aphy(440), CDOM plus NAP (adg(440)) and aT-w(440) were underestimated with a relative bias of −27.9%, −32.1% and −45.8%, respectively. The HOPE model retrievals from the PRISMA image exhibited low aphy(440) values over the whole scene and the highest adg(440) values in the Caravelas river plume. Very shallow depths (≤3 m), bottom substrate reflectance used as input in the HOPE model, model parametrization associated with the water complexity in the study site, and uncertainties associated to Rrs measurements used as input might be responsible for differences found when comparing HOPE retrievals with in situ measurements.
1 Introduction
The Abrolhos Bank region (ABR) located at the Eastern Brazilian Shelf encompasses the largest (>8,000 km2) and richest coral reef system in the Southwestern Atlantic Ocean (Laborel, 1969), and it is considered as a biodiversity hotspot (Francini-Filho et al., 2013; Moura et al., 2013; Simon et al., 2016; Ribeiro et al., 2018; Freitas et al., 2019). The ABR also houses the largest continuous rhodolith bed in the world, and its shelf includes diverse and complex habitats that support high biodiversity providing essential ecosystem services (Amado-Filho et al., 2012; Ferreira et al., 2020). Even with recent bleaching events, the coral reefs in the ABR have shown resilience to environmental and anthropogenic stressors during the last decade (Moura et al., 2013; Mazzei et al., 2017; Rudorff et al., 2018; Magris et al., 2019; Teixeira et al., 2019; Evangelista et al., 2021), keeping a stable coral cover at regional scale (Teixeira et al., 2021). Environmental water conditions are responsible for such functional capacity and it has been suggested that ABR and other Brazilian reefs might act as climate change refugia for a variety of species (Mies et al., 2020). The ABR is under the influence of the warm, salty, and nutrient-poor Brazil Current (BC), which flows southward from lower to higher latitudes along the upper continental slope and, together with the wind-driven and tidal currents, induces oligotrophic conditions to the system (Knoppers et al., 1999b; Lopes and Castro, 2013). The rivers responsible for the land runoff inputs to the ocean in this region are Caravelas, Peruíbe, Jequitinhonha, and Doce, but except the Doce River, they are characterized by low flows (average for the last 10 years <100 m3 s−1) (Moura et al., 2011; Coni et al., 2017). Thus, terrestrial inputs have some, yet limited influence on the inner arc (Knoppers et al., 1999b).
Like in other coral reef ecosystems, the water column in the ABR is optically considered as Case-2, i.e., the optical properties of the water column (absorption and backscattering coefficients) are not only controlled by biogenic content but also by the presence of non-algal particles (NAPs) and colored dissolved organic matter (CDOM) (Morel and Prieur, 1977). The sources of CDOM and suspended sediments are local, i.e., offshore advection and input from the terrestrial system (Knoppers et al., 1999b; Dutra et al., 2006). Even more, the shallow depths of the ABR introduce additional complexity to remote sensing studies in the region due to the contribution of bottom reflectance to the signal captured by satellite (Hedley et al., 2016), which demands additional steps in data processing (see e.g., IOCCG, 2000). Such bottom contribution usually results in overestimation of chlorophyll-a concentration (Schaeffer et al., 2012), diffuse attenuation (Zhao et al., 2013), and particulate backscattering coefficients (Carder et al., 2005) by remote sensing. Retrieving accurate water quality parameters in shallow coastal areas has remained one of the main challenges in ocean color remote sensing (e.g., Barnes et al., 2018; Garcia et al., 2020).
Two main types of inversion models have been proposed to derive water column optical properties: empirical and semi-analytical (SA). The empirical approach relates directly the remote sensing reflectance (Rrs) to optical properties through statistical relationships (IOCCG, 2006). However, due to the variability of optical properties and benthic substrates in shallow areas, empirical approaches face hurdles towards global application (Wei et al., 2020). Their performance is often dependent on the similarity between data used for the development of the model and those used in the applications and are usually applicable only at regional scales (Dekker et al., 2011). In contrast, SA models are based on approximations of the radiative transfer equation (Lee et al., 1999; Garcia et al., 2018). While SA models might have a wider temporal and spatial applicability when compared to empirical models, the radiative transfer equation is more complex to be solved in shallow than in optically deep waters (Wei et al., 2020). In the past 2 decades, several SA models have been developed, focused on complex and/or shallow waters (Maritorena et al., 1994; Lee et al., 1998; Albert and Mobley, 2003; Smyth et al., 2006). SA shallow water inversion models usually utilize optimization techniques to simultaneously retrieve bottom reflectance, depth, and optical properties from Rrs(λ) at the water surface.
The Hyperspectral Optimization Processing Exemplar (HOPE) model proposed by Lee et al. (1999) served as the basis for other adaptations proposed later such as the Bottom Reflectance Un-mixing Computation of the Environment model (BRUCE) (Klonowski et al., 2007), Semi-Analytical Model for Bathymetry Un-mixing and Concentration Assessment (SAMBUCA) (Brando et al., 2009), Bio-Optical Model Based tool for Estimating water quality and bottom properties from Remote sensing images (BOMBER) (Giardino et al., 2012), Shallow Water Inversion Model (SWIM) (McKinna et al., 2015), Shallow Water Optimization with Resolved Depth (SWORD) (Barnes et al., 2018) and those described in Jay et al. (2017) and Petit et al. (2017). These semi-analytical inversion models have been used in shallow waters of different areas worldwide (Cannizzaro and Carder, 2006; Dekker et al., 2011; Jay and Guillaume, 2016; Barnes et al., 2018; Dierssen et al., 2019; Wei et al., 2020). To better parameterize these models, it is important to have knowledge of the regional oceanographic conditions and optically-active substances in the water (Dorji et al., 2016).
In the present study, we compiled a dataset of bio-optical properties collected in March 2013 and February 2016 in the Abrolhos Bank region, Brazil, aiming to: 1) characterize the spatial bio-optical variability in the study region during the wet season; 2) examine the relationships between bio-optical properties; and 3) evaluate the applicability of the HOPE model to retrieve absorption coefficients from hyperspectral in situ data and satellite imagery in the Abrolhos shallow waters. Despite the ecological relevance of the ABR and the necessity of frequent environmental monitoring of its water column, the number of studies making use of remote sensing remains very scarce in the region. Previous studies mapped the coral reefs (Ilha, 2006; Moreira and Reuss-Strenzel, 2009), analyzed the performance of water column correction on a very high spatial resolution WordView-2 image (WV02) (Zoffoli, 2014), described the spatial and seasonal distributions of chlorophyll-a concentration (Ghisolfi et al., 2015), derived Kd(490) through MODIS data (Freitas et al., 2019) and mapped coral reef spatial patterns with WV02 (Zoffoli et al., 2022). However, the variability of the inherent optical properties of the water column has not yet been reported.
2 Materials and methods
2.1 Study area
The Abrolhos Bank region (16°40′S-19°40′S and 37°20′W-39°10′W) is a 46,000 km2 enlargement of the Eastern Brazilian shelf. The Abrolhos reefs are unique for the occurrence of isolated biogenic columnar structures called “Chapeirões” (a mushroom-like structure) built by coralline algae, bryozoans, and corals under a low storm disturbance regime (Laborel, 1969; Bastos et al., 2018; Freitas et al., 2019). Additionally, shaped pinnacles characterize the reef structure with diameters between 1 and 50 m with expanded and relatively flat, shallow tops (<10 m depth), and steep walls that reach up to 25 m depth (Bastos et al., 2018). Other unique features observed in ABR are the “Buracas,” similar to blueholes/sink and constituted by cup-shaped depressions in consolidated carbonate substrates (Land et al., 1995; Bastos et al., 2013). They are located at least 40 km offshore and occur over rhodoliths beds (Bastos et al., 2013). Furthermore, in the Abrolhos mid-shelf reefs there is a complex system of structuring organisms, dominated by bryozoans, representing up to 44% of the reef structure (Bastos et al., 2018).
This area is under the influence of the warm and salty Tropical Water (Emílsson, 1961) which is transported on the surface by the Brazil Current (BC), arising near the Brazilian coast between 13°S–17°S (Rodrigues et al., 2007) with a predominant NE-SW direction (Peterson and Stramma, 1991) until reaching the Subtropical Convergence at 33°S–38°S (Silveira et al., 2000). In its flow, the BC mixes with waters of coastal origin and low-salinity and colder water, resulting in salinities above 36 PSU and temperatures typically above 20°C (Silveira et al., 2000). The BC is characterized by low nutrients in ABR. The presence of shallow banks and seamounts influences the BC flow pattern creating vortices, meanders, and upwelling in the shelf break and seamount flanks (Knoppers et al., 1999a; Ekau, 1999). The occurrence of vortices on the edge of the Abrolhos Bank, as well as the northward alongshore drift driven by winds and the tides transporting Coastal Water, can lead to enhanced mixing of these waters and contribute to local nutrient enrichment, influencing the plankton community structure and dynamics (Ekau, 1999; Eça et al., 2014).
The ABR is separated from the coast by the Sueste Channel and is distributed in two reef arcs, the outer and the inner arcs, separated by the Abrolhos Channel, of about 15 km wide (Knoppers et al., 1999a) (Figure 1). The currents in these channels run southwards almost parallel to the shore. Along-channel current dominates on cross-channel current in the Sueste Channel (Knoppers et al., 1999b). The outer arc is located in the surroundings of the Abrolhos Archipelago, being ∼60 km offshore and with depths ranging from 20–35 m (Coutinho et al., 1993; Kikuchi et al., 2010). It is mainly composed of “Chapeirões” (Leão and Kikuchi, 2001), which remain submerged at low tide, with the presence of fringing reefs (at Abrolhos Archipelago Island) between the surface and ∼5 m depth. The outer arc also harbors rhodolith beds, widespread coralline algae, and transverse deep channels (Knoppers et al., 1999b; Moura et al., 2013). The inner arc is located between 10–20 km away from the coast, extending from north to south over 100 km, with depths ≤20 m (Coutinho et al., 1993; Freitas et al., 2019). It is formed by a series of bank reefs originated by the coalescence of coral pinnacles and rhodolith beds intermingle with unconsolidated sediments (Moura et al., 2013). The inner arc presents a higher light attenuation than the outer arc and the fringing reefs of the island, impacting on coral species distribution (Freitas et al., 2019).
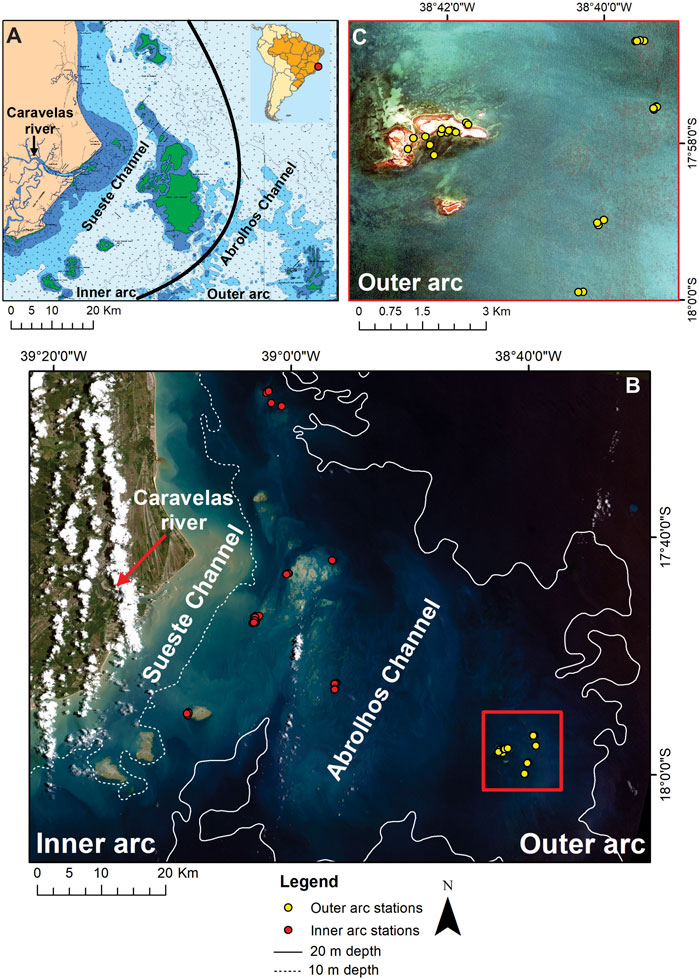
FIGURE 1. Location of the sampling stations in the Abrolhos Bank. (A) General geographical location of the study area, highlighting the Sueste and Abrolhos channels and the inner and outer arcs. Source: adapted from Brazilian Directory of Hydrography and Navigation (DHN), Navigation Chart: 1,310. (B) CBERS-4 image (true color composition) showing the location of the sampling sites in the inner (red dots) and outer (yellow dots) arcs. (C) WorldView-2 image (true color composition) showing the outer arc area and respective sampling points (yellow dots).
Reefs at the inner arc are impacted by terrigenous sediments transported by river discharge (Dutra et al., 2006). In addition, the geomorphological configuration of the inner arc, in association with strong permanent and alongshore tidal currents, acts as a barrier to offshore transport of land-derived material (Knoppers et al., 1999a). Thus, the outer arc is more protected from land-based stressors, and biogenic carbonate sediments from local sources predominate (Segal and Castro, 2011; Evangelista et al., 2021). As a result, the sedimentation rates in the inner arc can be twice higher than those in the outer arc (Dutra et al., 2006). The main rivers influencing this oceanic region are located at its northern (Rio Jequitinhonha) and southern extremes (Rio Doce) (Francini-Filho et al., 2013), with a yearly mean flow of 99 and 616 m3 s−1, respectively (ANA, 2022). Additionally, this area is under the influence of the Caravelas estuary, with ∼66 km2 that is connected to the mouth of the Peruípe River through small meandering channels located approximately 27 km to the south and under the influence of the Caravelas River (Pereira et al., 2010). These rivers are characterized by a low discharge with a monthly average of ∼5.5 and 40 m3 s−1, respectively, during austral summer (Andutta, 2014). Sedimentation regimes vary during the year with lower rates in summer than in winter due to the passage of cold fronts that increase the occurrence of stronger winds, intensifying wave action, and promoting the resuspension of sediments and therefore spawning more turbid waters (Segal et al., 2008; Segal and Castro, 2011; Castro et al., 2012).
2.2 Field work
Field sampling was performed along the ABR during two campaigns in March 2013 and February 2016, during austral summer (wet season, December to March). The bio-optical properties were sampled at 75 stations distributed in both the inner and outer arcs (Figure 1). Approximately 47% of the stations were in areas shallower than 5 m depth; 29% in areas between 5 and 10 m; and 23% in areas deeper than 10 m. At each station, water samples were collected to quantify chlorophyll-a concentration (Chl-a, in mg·m−3), and absorption coefficients by phytoplankton (aphy, in m−1), colored dissolved organic matter (aCDOM, in m−1), and non-algae particles (aNAP, in m−1) (Table 1). In addition, radiometric measurements were collected at 34 stations (63% in areas shallower than 5 m, 23% in areas 5–10 m deep, and 14% in areas deeper than 10 m).
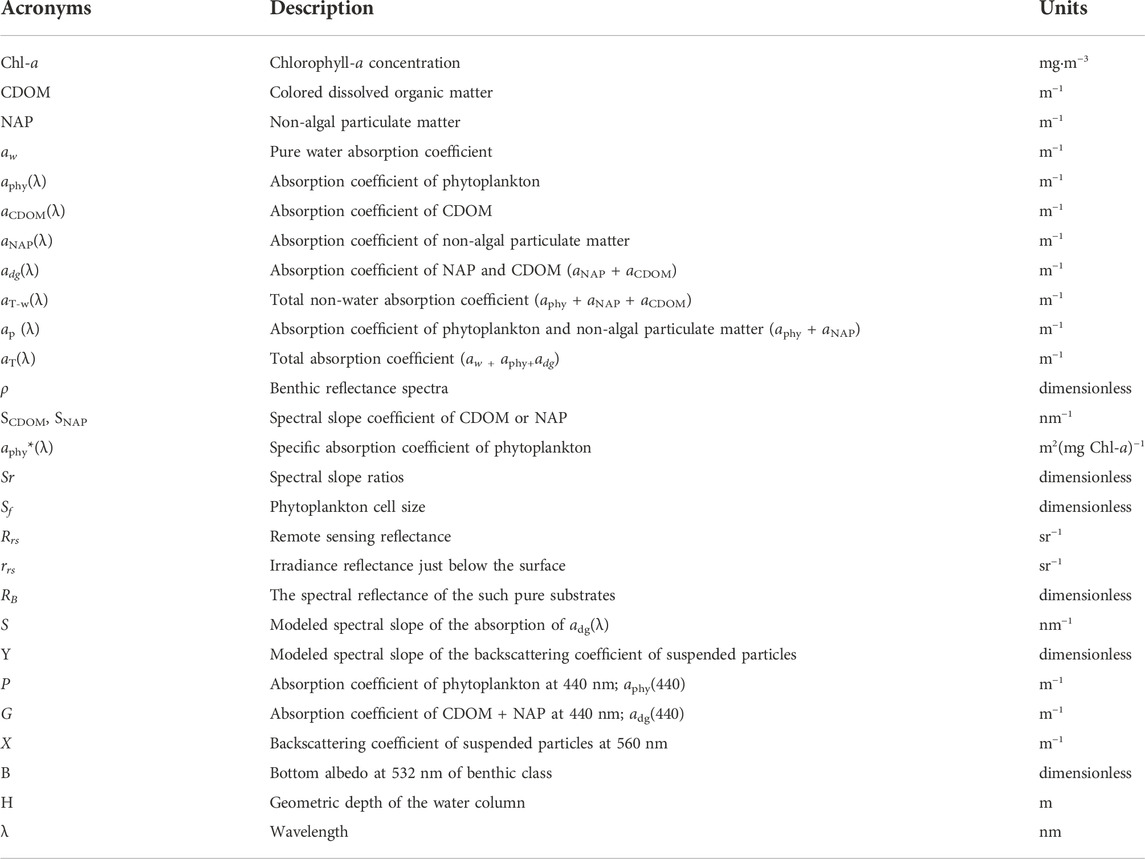
TABLE 1. Acronyms, units, and definitions of the parameters referred to in this study.
2.2.1 In situ chlorophyll-a concentration, absorption coefficients, and particle size
At each sampling site, seawater was collected at the surface and filtered on board within 3 h following the protocol described in Mitchell et al. (2000). For particles absorption (ap, in m−1), water samples were filtered using Whatman Glass Fiber Filters (GF/F) with a porosity of 0.7 µm, and the filters with retained material were stored in liquid nitrogen until further analysis in the laboratory. The ap(λ) spectra were calculated using the transmittance-reflectance (T-R) method (Tassan and Ferrari, 1995). The data were measured between 200 and 800 nm with 1 nm increments using a dual-beam Shimadzu UV-2450 spectrophotometer equipped with an integration sphere. After these measurements, the sample filters were soaked with Sodium Hypochlorite for 10 min and washed with distilled-deionized water. The absorption spectra were measured once again to obtain aNAP (Babin et al., 2003). Finally, aphy was estimated as the difference between ap and aNAP.
For aCDOM, water samples were filtered through membrane filters with 0.2 μm pore size and preserved in pre-combusted glass bottles (450°C, 6 h) wrapped in aluminum foil and kept under refrigeration (4°C) until further analysis in the laboratory. CDOM water samples were exposed to room temperature before the spectrophotometer readings to avoid bias due to the thermal differences between the samples and the reference water. The absorbance of the filtered water was measured in a 10 cm quartz cuvette between 220 and 800 nm with 1 nm increments using a dual beam Shimadzu UV-2450 spectrophotometer. The aCDOM(λ) was estimated from the absorbance measurements as: aCDOM(λ) = 2.303·A(λ)/L, where A(λ) is the absorbance of the sample water at the specific wavelength λ and L is the optical pathlength of the quartz cell in meters (0.1 m). A baseline correction was applied to each aCDOM spectrum by subtracting the average absorbance between 590–600 nm from the whole spectrum. Spectral slopes (SNAP and SCDOM) of aNAP and aCDOM were computed by fitting an exponential function between 350 and 750 nm. The SCDOM for the intervals of 350–500 nm (S350-500), 275–295 nm (S275–295) and 350–400 nm (S350–400) were also calculated. The (S275–295) and S350–400 were used to compute the spectral slope ratios (Sr, ratio of S275–295/S350–400), since Sr provides a fast and reproducible way for characterizing the CDOM quality according to the molecular weight (Helms et al., 2008; Valerio et al., 2018). For Chl-a, water samples (500–750 ml) were filtered using Whatman GF/F filters with 0.7 µm of porosity. Pigments were extracted from the filters after immersion in 10 ml of 90% acetone/dimethyl sulfoxide (DMSO) solution (60/40 by volume) (Shoaf and Lium, 1976) for 24h, in the dark at -10°C. The Chl-a analyses were performed using a Tuner AU-10 spectrofluorometer (Welschmeyer, 1994). The aphy(440) was normalized by Chl-a to estimate its absorption specific coefficient (a*phy).
The phytoplankton cell size (Sf) was estimated according to Ciotti et al. (2002). The aphy(λ) was normalized by the average of all values between 400 and 700 nm; the shape of normalized aphy(λ) was thus reconstructed with a linear combination of two spectra representing complementary contributions of the pico-phytoplankton (<2 μm) and micro-phytoplankton (>20 μm) fractions. A least-squares Levenberg-Marquardt algorithm was used to fit the observed normalized aphy(λ) spectrum to a linear model by adjusting the derived cell size parameter values. The Sf values varied from 0 to 1, with Sf closer to 0 when large phytoplankton cells (>20 µm) dominated, and Sf closer to 1 when small cells (<2 µm) were dominant.
A time series of MODIS-Aqua monthly 4 km aphy(443) and diffuse attenuation coefficient Kd(490) between January 2003 and February 2022 were analyzed to characterize the seasonal variability patterns in the outer and inner arcs. A monthly climatology (2003–2022) and the standard deviation were calculated for two boxes, one in each arc (Supplementary Figure S1).
2.2.2 In situ radiometry
Upwelling radiance, Lu (λ, in W·m−2·sr−1), sky radiance, Lsky (λ, in W·m−2·sr−1), and the radiance reflected by a white reference, Lplaque (λ, in W·m−2·sr−1), were measured by an ASD handheld Fieldspec spectroradiometer (Malvern Panalytical Ltd.), which collects radiance between 350 and 1,100 nm (bandwidth 1 nm) in a 25° field-of-view. The acquisition geometry followed Mobley (1999) recommendations to avoid shadows and sunglint contamination in the measurements. The Lu measurements were performed between 9:00 a.m. to 15:00 p.m. local time. Downwelling irradiance, Ed (λ, in W·m−2), was estimated from Lplaque as: Ed(λ) = π·Lplaque/ρplaque where ρplaque is the reflectance of the plaque (assumed Lambertian). The remote sensing reflectance spectrum, Rrs (λ, in sr−1), was then obtained as:
The ρ factor was adjusted for the wind speed, Sun at zenith, and sensor-viewing geometry (Mobley, 1999). At each station, ∼10 repetitions of the sequence Lu, Lsky, and Lplaque were acquired and Rrs(λ) at each station was calculated as the average of all individual estimates using Eq. 1 with a coefficient of variation (standard deviation/mean * 100) lower than 10%. An additional correction was performed for each spectrum following Rudorff et al. (2014) and Zoffoli et al. (2022) for turbid waters, which uses the average Rrs(λ) between 790 and 810 nm as a baseline to correct for the positive white offset. This residual adjustment corrects the spectra from biases and noises due to contaminations from the viewing geometry and environmental factors (Jiang et al., 2020; Zoffoli et al., 2022).
2.3 PRecursore IperSpettrale della Missione Applicativa (PRISMA) image
PRISMA is a hyperspectral Earth Observation sensor that acquires data at 30 m pixel size in 234 spectral bands from 400 to 2,500 nm, with 10 nm spectral resolution and a repetitive orbit each 29 days. A PRISMA (L1 and L2C) image acquired on 13 January 2022 over the ABR was downloaded from the PRISMA portal (https://prisma.asi.it). The PRISMA image was atmospherically corrected using ACOLITE package (released in 21 April 2021), designed specifically for coastal and inland waters applications, even with non-negligible turbidity (Vanhellemont, 2019), and with higher performance from coastal waters than standard L2D PRISMA products (Braga et al., 2022). The processor uses the dark spectrum fitting (DSF) algorithm to compensate for atmospheric and surface effects (Vanhellemont and Ruddick, 2018). Land areas were masked as having ρw values in the shortwave-infrared (SWIR) band at 1,606 nm greater than 0.0215. The specular reflection of solar radiation on non-flat water surfaces can be a severe confounding factor for shallow water remote sensing. Thus, a Sun glint correction was applied following Hedley et al. (2005) and Kay et al. (2009). Optically deep areas in the image showing Sun glint were selected. Using all the pixels from the selected regions, linear regressions were performed between each band in the visible region and the band in the near-infrared at 834 nm (NIR). Then, the reflectance of each pixel in the visible band i was deglinted according to the following equation:
where
2.4 Semi-analytical model
The semi-analytical HOPE model developed for shallow waters (Lee et al., 1998, 1999, 2001) was applied to each in situ Rrs(λ) spectra to retrieve water optical inherent properties (IOPs), bottom depth, and bottom reflectance (RB). In this model, absorption coefficients are described according to Lee (1994) and Lee et al. (1999):
where aT is the absorption coefficient (m−1), aw is the pure water absorption coefficient (m−1) obtained from (Pope and Fry 1997), a0 and a1 are coefficients empirically defined to describe the spectral shape of phytoplankton absorption (Lee, 1994), P is aphy at 440 nm, G is adg at 440 nm, and S represents Sadg (set here to 0.017 nm−1, according to in situ measurements). Additionally, backscattering coefficients are defined according to Carder et al. (1999) and Lee et al. (1999):
where, bb is the total backscattering coefficient (m−1), bbw is the backscattering coefficient for water molecules, bbp is the backscattering coefficient for particles, X is bbp at 532 nm, and Y represents a spectral shape parameter of particle backscattering (set to 0.5). The values for bbw(λ) are kept constant (Zhang and Hu, 2009). In the optimization, X is resolved as a scaling factor which defines the contributions of bbp to the modeled Rrs(λ).
The optical properties are used in a SA model for sub-surface remote sensing reflectance in shallow optical waters, rrs (Lee et al., 1999):
Here, rrs is the ratio of upwelling radiance to downwelling irradiance evaluated just below the surface, and
Within this model, there are two optical path-elongation factors: one for photons from the water column (
RB was quantified by a normalized bottom albedo spectrum at 550 nm, RBn(λ), and a scaling factor modulating contributions of the benthic albedo to modeled reflectance, Bn.
The bottom cover classes, i.e., sand, green algae, brown algae, coralline algae, and brown coral, were selected according to the substrates present in the Abrolhos Bank region (Villaça and Pitombo, 1997). The spectral reflectance of such pure substrates was taken from Medeiros et al. (2018) and Roelfsema and Phinn (2012) (Figure 2). The use of a linear mixture approach as the substrate for the SA model has already been tested in previous studies using the HOPE model (Klonowski et al., 2007; Brando et al., 2009; Garcia et al., 2018; Dierssen et al., 2019). Here, we run HOPE 10 times for each Rrs spectra and for the PRISMA image, and in each run, a different
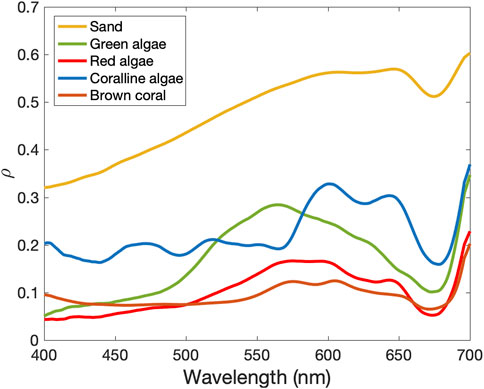
FIGURE 2. Benthic reflectance spectra (ρ, adimensional) of the five pure bottom cover classes: sand and mixture classifier which are: sand, green algae, red algae, coralline algae, and brown coral. Source: Adapted from Medeiros et al. (2018) and Roelfsema and Phinn (2012).
The constant values combined with the above described Rrs(λ) spectra can be modeled using the parameters: P, G, X, B, and H as:
The HOPE inversion model was run in MATLAB®. For the in situ dataset, Rrs(λ) from 400 to 750 nm was considered, and the constraints and initial values are given in Table 2. HOPE performance was evaluated by contrasting algorithm retrievals with IOPs and depth measured in situ concomitant to Rrs measurements. For the PRISMA image, only the bands 1 to 42 (402–749 nm) were considered to run the HOPE algorithm. In this case, two spatial subsets were selected for algorithm validation where the in situ depth data from 2013 were available (Figure 3). Constraints and initial values used for the PRISMA processing were slightly different from those used for in situ measurements (Table 2). The optimization process was designed to search for a minimum error solution through a cost function that quantifies the lowest relative error between
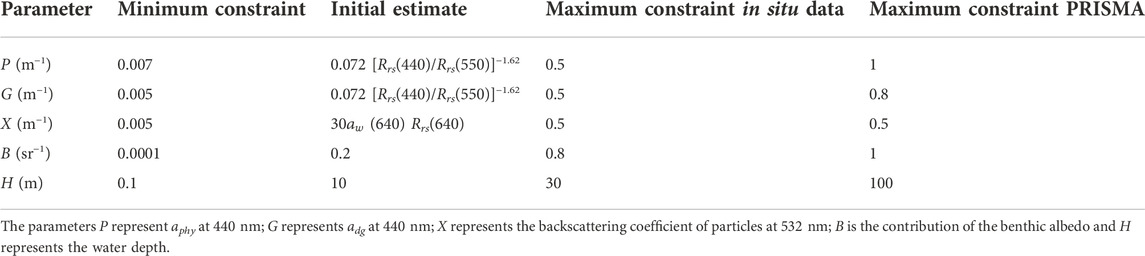
TABLE 2. Optimization constraints and initial estimates for the optimization process of the HOPE model on Rrs(λ) in situ and PRISMA data.
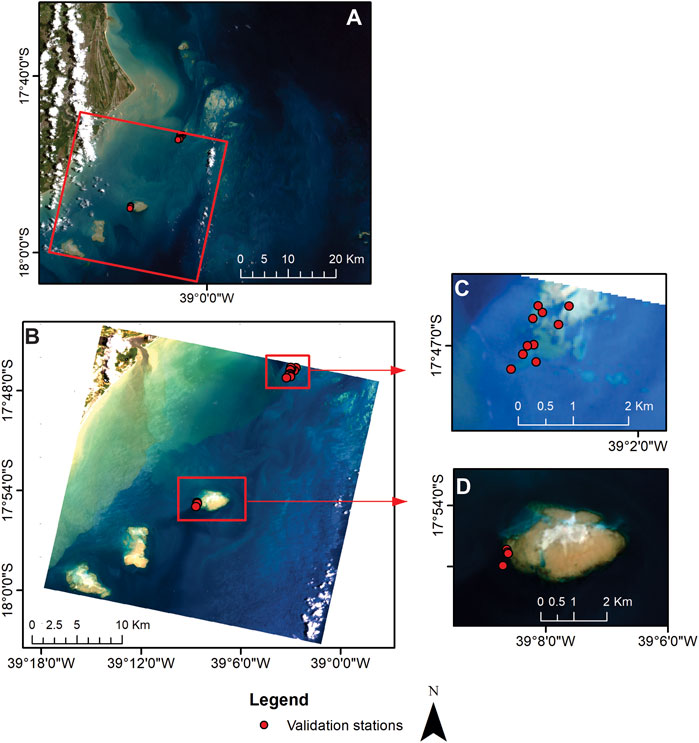
FIGURE 3. Abrolhos Bank Region (ABR). (A) CBERS-4 image (true color composition), red rectangle indicates the boundaries of the PRISMA image. (B) Sub-area of the PRISMA image (red box) showing the sampling stations visited during the 2013 field campaign within the inner arc and used for model validation. (C) Detail of the area of interest with the sampling stations at Pedra do Leste reef. (D) Detail of the area of interest with the sampling stations at Sebastião Gomes reef.
2.5 Statistical metrics
The Shapiro-Wilk test was applied to test the normality of the bio-optical samples. Then, a non-parametric test, Kruskal-Wallis one-way analysis of variance was performed to test whether samples originated from the same distribution. Once a significant difference among the tested parameters was found, a Tukey honestly significant difference (HSD) was performed to verify if there were significant differences between the arcs (p-value < 0.05). Finally, the strength of regression between bio-optical and biogeochemical parameters was evaluated through the coefficient of determination (R2). The performance of the HOPE model was evaluated through mean absolute error (MAE), relative and log bias, according to Seegers et al. (2018), R2, and absolute and relative root mean square error (RMSE and RRMSE). The MAE and log bias present multiplicative metrics (a MAE of 1.5 indicates that estimates observations are 1.5 × (50% greater) on average than the in situ observations). A log bias value lower than unity indicates a negative bias (O’Reilly and Werdell, 2019). In addition, the Pearson correlation (r) between the depth and bottom substrate reflectance versus the residuals (model - measured) for aphy(440), adg(440) and aT-w(440) were calculated to assess the major factor responsible for the retrieval error using the in situ Rrs(λ) data.
where SSres is the sum of squares of residuals, SStot is the total sum of squares, xi is the in situ data for a given parameter, yi is the estimated value for a given parameter and N is the sample size.
3 Results
3.1 Bio-optical properties characterization
Both arcs presented relatively low Chl-a and aphy(440) values, and similar mean values for SNAP, Sr, and Sf (Table 3). However, in the inner arc, a region with more terrestrial influence, the values of aNAP(440), and ratio of absorption due to NAP and total particulate matter at 440 nm (aNAP(440)/ap(440)), and a*phy(440) were significantly higher (p-value < 0.05) than those in the outer arc, while Chl-a and Sf were lower in the inner arc (p-value < 0.05). Additionally, a positive co-variation was observed between Chl-a and aphy(440) and Chl-a and ap(440), (Figures 4A,D; Table 4). At the same time, an exponential decrease was found between the slopes and absorption coefficients, and between Chl-a and a*phy(440) (Figure 5; Table 4).
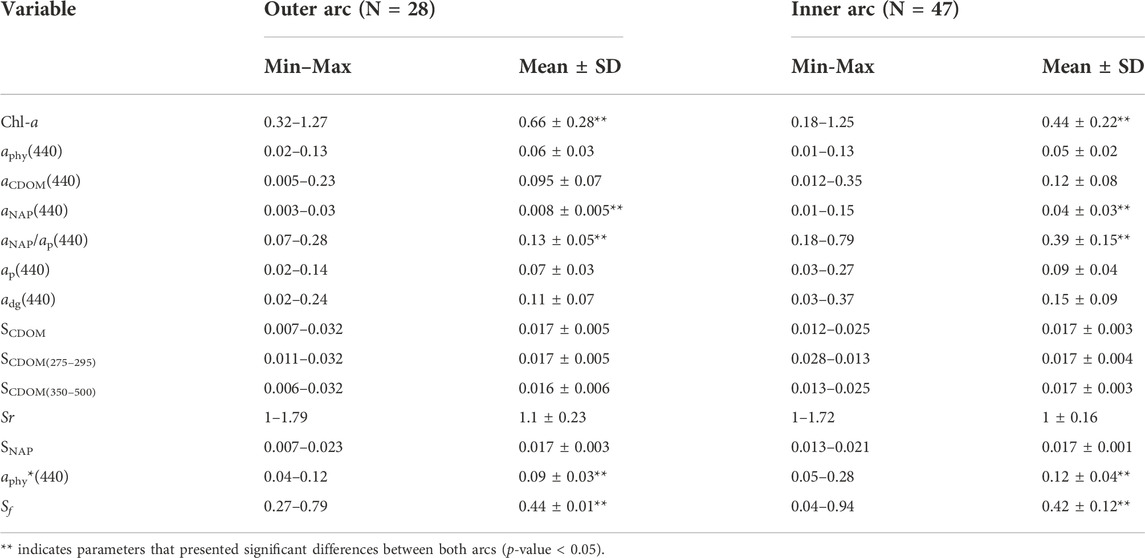
TABLE 3. Range (Mean and Standard Deviation) of the measured optical properties in the outer and the inner arcs for the Abrolhos Bank region during the 2013 and 2016 field campaigns. See Table 1 for acronyms.
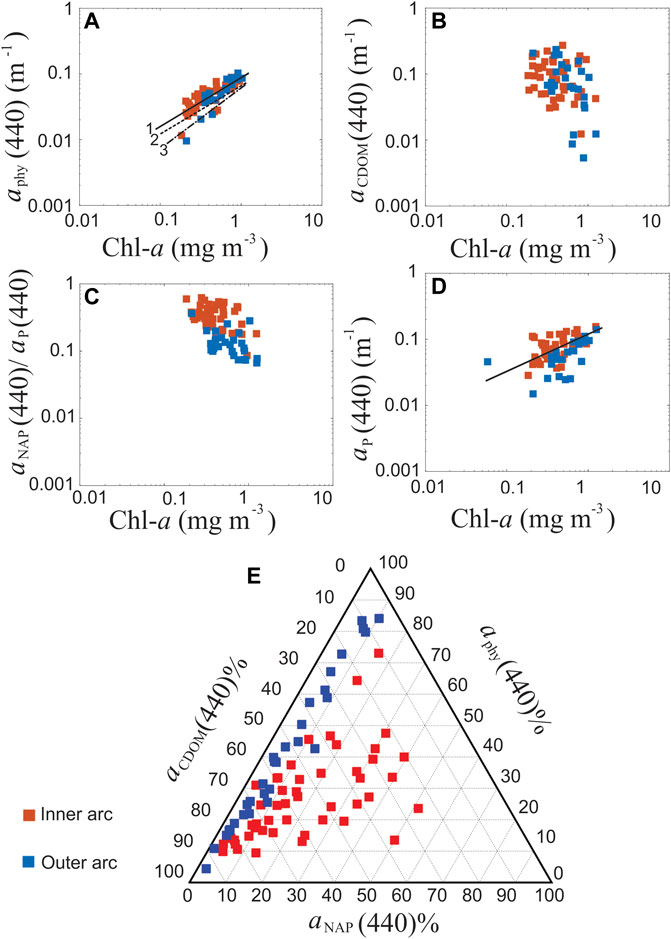
FIGURE 4. Relationship between measured bio-optical properties and Chl-a in the Abrolhos Bank region. In all panels, red squares represent samples in the inner arc, while blue squares in the outer arc. (A) aphy(440) as a function of Chl-a (n = 68) (log scale). The solid line (line 1) shows the linear regression found in this study, while the dashed line (line 2), and dashed-pointed line (line 3) represent the empirical relationships in Bricaud et al. (2004), and in Bricaud et al. (2010), respectively. (B) aCDOM(440) as a function of Chl-a (n = 71) (log scale). (C) aNAP(440)/ap(440) as a function of Chl-a (n = 71) (log scale). (D) ap(440) (n = 69) as a function of Chl-a (log scale). (E) Ternary plot showing the fraction of total non-water absorption dominated by colored dissolved organic matter (aCDOM), phytoplankton (aphy), non-algal particulate (aNAP) at 440 nm (n = 75).
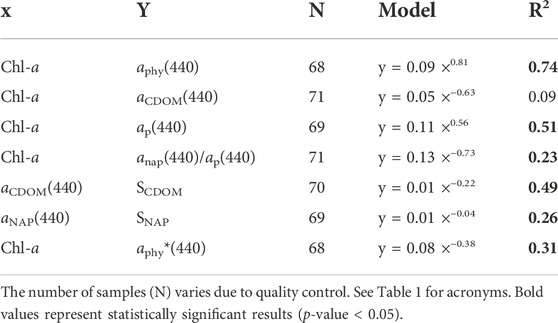
TABLE 4. Summary of selected optical properties relationships in the Abrolhos Bank region with their respective statistical performance.
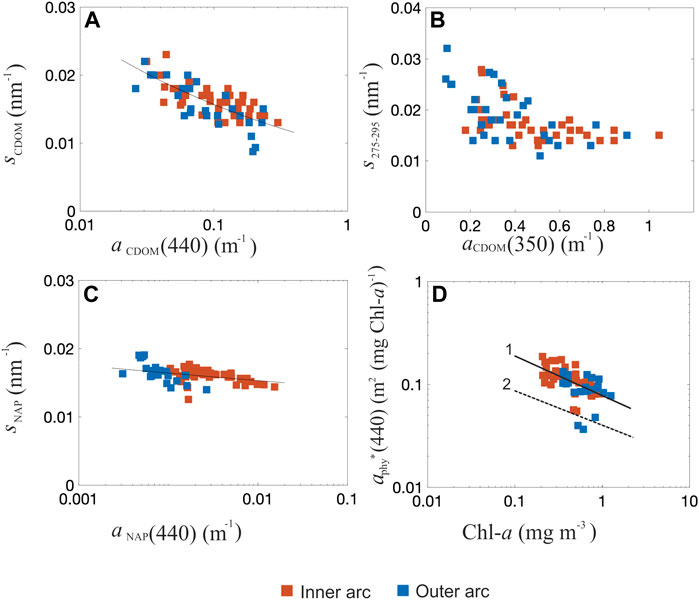
FIGURE 5. Slopes of bio-optical properties and aphy*. Regressions of (A) SCDOM(350–750) versus aCDOM(440). (B) SCDOM(275–295) versus aCDOM(350). (C) SNAP(350–750) versus aNAP(440) (n = 70). The plots A and C displayed in semi-log scale, with y axes are in slope units (nm−1). (D) Relationship between phytoplankton-specific absorption coefficient at 440 nm as a function of Chl-a (n = 68) (log scale). The solid (line 1) and dashed (line 2) lines are the regression models obtained in this study and from Bricaud et al. (1995) respectively.
A significant difference (p-value < 0.001) was also found in the relationship between Chl-a and aphy(440) derived from our dataset and that reported in Bricaud et al. (2010) (aphy(440) = 0.0617 (Chl-a)0.93) and Bricaud et al. (2004) (aphy(440) = 0.0654 (Chl-a)0.73). The aphy(440) values in this study were higher than the ones reported in these publications and the differences between a*phy(440) values of ABR and those from the Bricaud et al. (1995) parameterization are probably related to the biological composition of the phytoplankton communities (Figure 5D). More details will be discussed in Section 4. The partial contribution of aCDOM, aNAP, and aphy to the total non-water absorption at 440 nm (ap(440)), i.e., the sum of aphy, aNAP and aCDOM, for each area is shown in Figure 4E. Overall, non-water absorption in the Abrolhos Bank region was predominantly dominated by CDOM (59% of stations), which exhibited the highest variability in the outer arc, with the lowest NAP contribution. The outer arc presented ap dominated either by CDOM (57% of stations) or phytoplankton (36% of stations). The CDOM and phytoplankton contributions presented significant variability, and an inverse relationship was observed between them. In the inner arc, two patterns were present, one mainly dominated by CDOM (60% of the stations) and the other with a mixture of CDOM, NAP, and phytoplankton (32% of stations). The relative contribution of NAP to the ap increased from 10% in the outer arc to 50% in the inner arc, probably caused by the influence of river discharge. The phytoplankton contributions had higher variability in the outer arc, but their contributions achieved 50% of the ap in the inner arc (Figure 4E).
The time-series analyses of aphy(443) (Supplementary Figures S2, S3) and Kd(490) (Supplementary Figures S4, S5) showed a similar seasonal variation at both arcs, with overall lower values in the austral spring-summer (October-April) coincident with the wet season, and higher values in autumn-winter (May-September). The inner arc also showed higher values in both parameters compared to the outer arc, and a noisier pattern with some extraordinary decreases and increases out of the seasonal pattern. During the field work and PRISMA image acquisition periods, the mean values of aphy(443) and Kd(490) were relatively lower in both arcs than compared to other seasons.
3.2 Optical properties and depth retrieval from in situ Rrs(λ) data and PRISMA image
The in situ Rrs(λ) spectra revealed large variability in both magnitude and spectral shape (Figure 6). The Rrs(λ) variability was higher in the green bands, reflecting the stronger influence of the changing sea bottom composition. Stations comprised of corals and/or macroalgae had Rrs(λ) as low as 0.005 sr−1, while over stations dominated by sand, Rrs(λ) was as high as 0.053 sr−1. In the bands beyond 600 nm, values were close to zero due to the strong absorption by water molecules. The maxima of Rrs(λ) spectra varied between 475 and 575 nm depending on bottom type, water clarity, and depth.
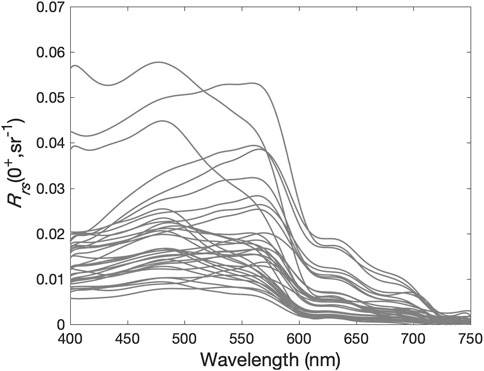
FIGURE 6. In situ hyperspectral remote sensing reflectance spectra (Rrs, sr−1) collected in Abrolhos Bank in March 2013 and February 2016.
The semi-analytical inversion was able to accurately retrieve the depth (Table 5). However, the model substantially underestimated absorption coefficient of NAP and CDOM (mean adg(440) = 0.05 ± 0.04 m−1 (HOPE); 0.13 ± 0.08 m−1 (in situ), log bias = 0.38), absorption coefficient of phytoplankton (mean aphy(440) = 0.04 ± 0.02 m−1 (HOPE); 0.05 ± 0.02 m−1 (in situ), log bias = 0.33) and total non-water absorption coefficient (mean aT-w(440) = 0.08 ± 0.06 (HOPE), mean aT-w(440) = 0.17 ± 0.08 m−1 (in situ), log bias = 0.48) (Figure 7). Since the sample Rrs(λ) size was relatively small (N = 34), all Rrs(λ) measurements were used, even for stations deeper than 15 m and shallower than 1.4 m. After the removal of the three deepest stations, only the depth retrieval was improved (R2 = 0.7, 0.45, 0.56, and 0.87 for aphy(440), adg(440), aT-w(440), and depth, respectively). The opposite was observed with the shallowest stations. After the three shallowest stations were removed, only the optical properties retrieval was improved (R2 = 0.75, 0.52, 0.58, and 0.79 for aphy(440), adg(440), aT-w(440), and depth, respectively). Residual analysis indicated significant partial correlation between residual aphy(440) and bottom substrate (r = 0.37, p-value < 0.05). No significant correlation was obtained between residual aphy(440) and depth (r = 0.21, p-value > 0.05), residual adg(440) and depth (r = 0.12, p-value > 0.05), residual adg(440) and bottom substrate (r = 0.29, p-value > 0.05), residual aT-w(440) and depth (r = 0.08, p-value > 0.05), and residual aT-w(440) and bottom substrate (r = 0.28, p-value > 0.05).
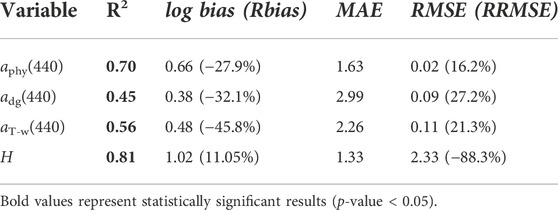
TABLE 5. Summary of statistical performance of the HOPE model for the retrieval of water optical properties and depth in the Abrolhos Bank region for all in situ stations (N = 34). See Table 1 for acronyms.
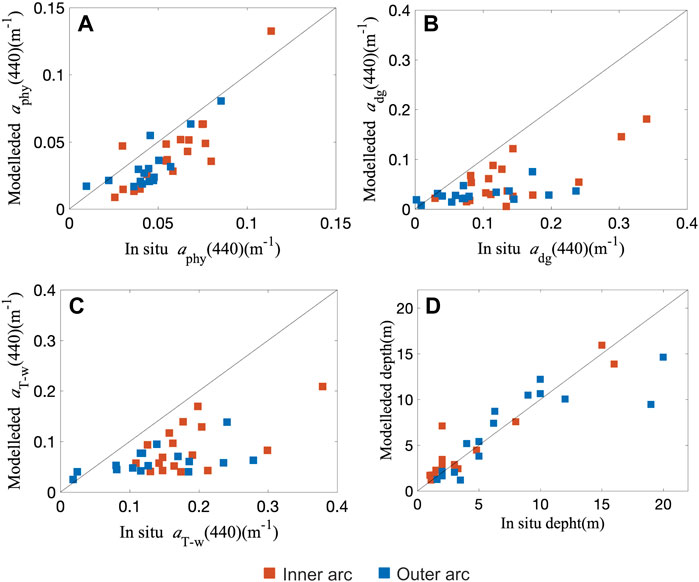
FIGURE 7. Comparison between in situ measured aphy, adg, aT-w and depth versus HOPE model retrievals performed on the in situ Rrs(λ) spectra. (A) aphy(440). (B) adg(440). (C) aT-w (440). (D) depth. Red squares represent the 18 samples of the inner arc, and blue squares represent the 16 samples of the outer arc. The diagonal lines represent the linear regression fit.
Overall, the HOPE model retrievals from the PRISMA image presented low values of aphy(440), adg(440), and bbp(532), except in the Caravelas river plume, which exhibited higher values for adg(440) and bbp(532) (Figure 8). Also, it was observed that some areas over the coral reefs had higher adg(440) values than surrounding deep waters. adg was the main contributor to aT-w (40%–99%), and both of them presented the same spatial pattern. HOPE aphy(440) retrievals were low in the whole scene (0.007–0.15 m−1). And as expected, the shallower areas were located on the coral reefs and close to the coast. The data used to validate the depth results were composed of 13 stations, with 10 of them shallower than 5 m depth. Although the validation dataset was collected in 2013, the model achieved good results for depth retrievals (R2 = 0.87, log bias = 0.76, Rbias = -12.31%, MAE = 2.46, RMSE = 1.66, and RRMSE = 2.29%).
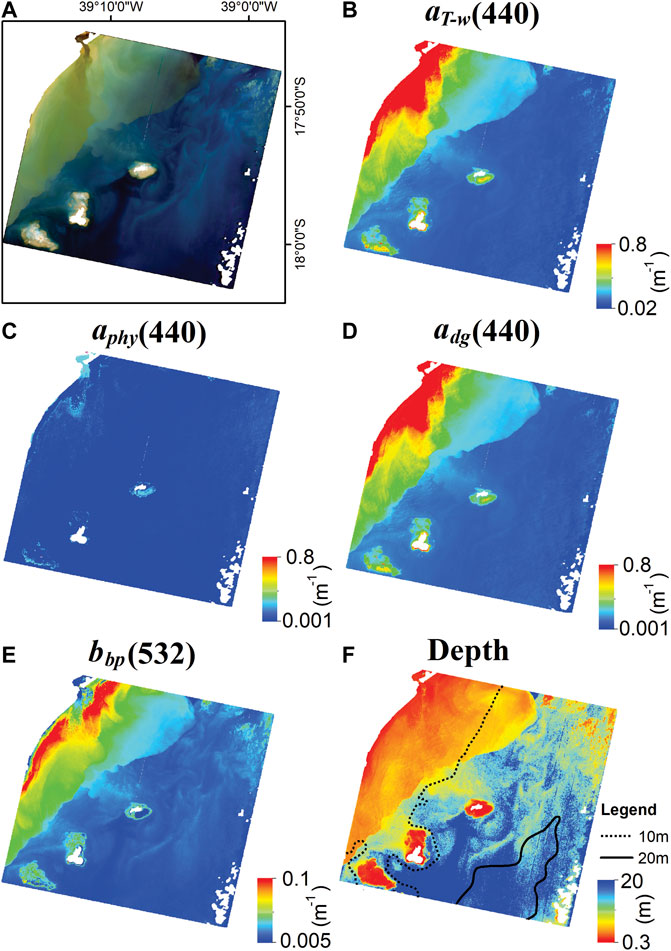
FIGURE 8. Optical properties and depth retrievals in ABR from PRISMA image using HOPE model with a linear mixture as substrate input. (A) PRISMA image (quasi-true color). (B) aT-w(440) (m−1). (C) aphy(440) (m−1). (D) adg(440) (m−1). (E) bbp (532) (m−1). (F) Depth (m). The land, exposed reef and clouds are masked in white color.
4 Discussion
4.1 Optical properties in the ABR the inner and outer arcs during summer
4.1.1 Regional influence on bio-optical variability
The Brazil Current is the main driving force in the region (Segal et al., 2008), and together with wave pattern, tidal regime, and wind patterns controls the bio-optical properties. The BC transports the oligotrophic Tropical Water on surface and its low nutrient concentration might limit phytoplankton growth (Knoppers et al., 1999b; Lopes and Castro, 2013). The BC also washes off nutrients from terrestrial runoff thus helping to mitigate its impact (Knoppers et al., 1999b; Segal et al., 2008). During the austral summer, the thermocline formation stratifies the water column, reducing even more nutrient inputs to the euphotic zone (Lopes and Castro, 2013; Teixeira et al., 2013; Ghisolfi et al., 2015). Runoff of rivers’ sediments is modulated by precipitation that is more abundant during summer. Also in summer, the wave energy coupled with north-northeast winds are responsible for the resuspension and transport southwards, by the coastal currents, of the nearshore material (Knoppers et al., 1999a). However, a hydrodynamic barrier is established in this season by strong southward-flowing nearshore currents. The inner arc topography acts as a barrier to seawards sediment transport, limiting the amount of terrestrial material reaching the outer arc (Segal et al., 2008). Therefore, the outer arc is more influenced by the BC and resuspended bioclastic sediments, while the inner arc also receives some contribution from the rivers’ discharge (Segal et al., 2008; Segal and Castro, 2011; Castro et al., 2012). These processes probably are responsible for the spatial and seasonal variability observed in the in situ dataset and in the aphy(443) and Kd(490) time-series analyses. Some noise observed in the time-series of the inner arc might be explained by the input of terrestrial discharges, which can incorporate organic matter and sediments to the water column during different periods (Zoffoli et al., 2013).
4.1.2 Phytoplankton
The Chl-a and aphy values observed in this study were lower than expected for coastal waters (Costa et al., 2006; Blondeau-Patissier et al., 2017; Russell et al., 2019), although comparable with average values reported for Case-1 waters (Bricaud et al., 2004, 2010). The distinctive oceanographic conditions in the study region might be responsible for such low phytoplankton biomass as the influence of the nutrient-poor Brazil Current, which also promotes a nutrient wash with its flow, and the water column stratification in summer. Our dataset showed an unexpected distribution pattern, with the outer arc presenting higher Chl-a values than the inner arc. Likely, the higher Chl-a values found in the outer arc should be promoted by the influence of sub-mixed-layer water upwelling triggered by small eddies and meanders that introduces nutrients and would not reach the surroundings of reefs within the inner arc (Ghisolfi et al., 2015).
As observed for the in situ data, the HOPE retrievals from satellite data also presented low aphy(440) values. Even though in situ aphy(440) was low for coastal ecosystems, it was still higher than those found by Bricaud et al. (2004, 2010) in open waters of the global ocean. Additionally, the a*phy(440) (i.e., aphy(440)/Chl-a) from ABR differed statistically from those parameterized by Bricaud et al. (1995) from water samples collected in oligotrophic, mesotrophic, and eutrophic waters of the global ocean. These differences may be associated with variations in the size of phytoplankton communities, in proportions of accessory phytoplankton pigments, or the intracellular concentrations of their various pigments. In the Abrolhos region, there have been scarce studies conducted on phytoplankton community, and it was reported a dominance of nanoplankton during winter (Souza, 2010), while Bricaud et al. (2004) observed a large variability in the dominance of the size phytoplankton group. Additional studies are required to characterize the phytoplankton community in the ABR. For a*phy(440), the differences might also be related to methodological aspects. Bricaud et al. (2010, 2004, 1995) quantified Chl-a by High Performance Liquid Chromatography (HPLC) but in this study, Chl-a was estimated by fluorescence, which could lead to Chl-a overestimation because it is not efficient to totally avoid contamination by other pigments and degradation products (Morel and Maritorena, 2001; Rudorff et al., 2014). It is important to highlight that in the ABR, Chl-a explained only 37% of the a*phy(440) variability, and this relatively weak correlation might have effects when attempting to derive Chl-a through ocean color models based on a*phy(λ) (e.g., Dall’Olmo et al., 2005). An increase in pigment packaging effect and/or a decrease in the proportion of accessory pigments are related to a decreased a*phy(440) (Bricaud et al., 1995, 2004, 2010). The Sf is considered a proxy for combined changes in pigment packaging effect due to increases in cell size and in the concentration of accessory pigments (Ferreira et al., 2020). Sf states that normalized absorption spectrum is a linear combination of two spectra corresponding to pure picophytoplankton (Sf = 1, phytoplankton cells <2 μm) and pure microphytoplankton (Sf = 0, phytoplankton cells <20 μm) (Ciotti et al., 2002; Bricaud et al., 2010; Ferreira et al., 2020). In the outer arc, the lowest (0.04) and highest (0.94) Sf values were observed, which might indicate the presence of phytoplankton with different cell size.
4.1.3 Non-algal particles and dissolved organic matter
The highest in situ values of aNAP(440) were found in the inner arc, possibly related to terrigenous inputs of particles and bottom resuspension in those shallower areas that are restricted to this arc due to the presence of a hydrodynamic barrier. Note that the aNAP(440) measured in ABR in this study might be underestimated due to the extraction method used, since using sodium hypochlorite to depigment the algae fraction could modify the organic fraction from NAP (Cremella et al., 2022). The adg(440) values retrieved from PRISMA data confirmed the higher values of aNAP(440) in the inner arc. The result shows higher values on the Caravelas river plume and in some areas over the coral reefs, which was expected since this ecosystem releases significant amounts of marine dissolved organic matter (DOM), therefore CDOM, directly into the waters (Kelly et al., 2022). The runoff of rivers’ sediments and the hydrodynamic and geomorphological barrier that separates both arcs in the ABR might explain the differences observed between both arcs, with a higher concentration of CDOM and NAP confined to the reefs closest to the coast. The continental influence is minimal in the outer arc and, thus, the low CDOM and NAP components found there might be originated from degradation of the benthic biota (Boss and Zaneveld, 2003; Mobley et al., 2005). A previous study on sediment type supports this explanation showing a dominance of siliciclastic sand and mud in the inner arc while pure carbonates dominate in the outer arc (Dutra et al., 2006). In the Pacific coral reefs, higher values of aCDOM(440) and aNAP(440) have been also reported in more coastal regions, while lower values were observed in more offshore regions (Russell et al., 2019).
4.1.4 Slopes of non-algal particles and dissolved organic matter
The SNAP provides information on the relative contribution of organic and mineral particles in the absorption of coastal waters (Babin et al., 2003). The higher SNAP, the higher the dominance of organic material over mineral particles (Babin et al., 2003; Bricaud et al., 2010), which gives further support to the influence of local production on this component. High SNAP were expected in ABR since the coral reefs may be the principal supply of the particles. While aCDOM magnitude indicates CDOM concentration, its spectral slope provides information about its characteristics (chemistry, source, diagenesis), and nature or composition (humic or fulvic acids) as well as its photooxidation state (Carder et al., 1989; Helms et al., 2008). In general, land-derived CDOM humic-dominated presents a lower spectral slope than marine-derived CDOM fulvic-dominated (Carder et al., 1989). For example, previous studies have reported mean SCDOM values higher than 0.02 nm−1 in open ocean areas and 0.013–0.018 nm−1 in coastal waters (Carder et al., 1989; Cherukuru et al., 2016). In this study, the mean SCDOM (350–500) was 0.017 nm−1 and 0.016 nm−1 for inner and outer arcs respectively, values typical of coastal environments. However, some stations in the outer arc presented SCDOM(350–500) values higher than 0.03 nm−1 comparable to open ocean areas. According to Helms et al. (2008), the S275–295 and the slope ratios (Sr = S275–295/S350–400) are potential indicators of photobleaching in the marine environment since they consistently increase with increasing solar irradiation. Also, Sr are inversely related to the molecular weight of CDOM (Helms et al., 2008). The results for the CDOM slopes, for both arcs, indicated the presence of a degraded dissolved organic matter (DOM) probably due to biological or photochemical processes (Helms et al., 2008; Fichot and Benner, 2012; Nelson and Siegel, 2013), while the Sr results suggested the presence of DOM with low molecular weight similarly to what was previously observed in coastal waters (Helms et al., 2008). Since all the stations presented Sr values higher than 1 (i.e., S275–295 ≥ S350–400), there is probably a dominance of low molecular weight CDOM. Additionally, the exponential decrease found between S275-295 and aCDOM(350) indicates possible effects of photobleaching for ABR samples (Fichot and Benner, 2012; Blondeau-Patissier et al., 2017). This study documented a spatial variability of the bio-optical properties in the Abrolhos Bank region but was limited by the relatively small number of in situ stations. To better understand the temporal dynamics of water bio-optical properties at the scale of the entire ABR, future studies should extend the analysis spatially (e.g., using satellite remote sensing and in situ data) and assess phenological changes. Also, studies should be further developed to increase the phytoplankton community knowledge in ABR and to confirm the hypothesis about the relationship between the sediment type and the organic matter based on a more robust set of in situ samples.
4.1.5 Differences with other reefs and coastal areas
Differences between the bio-optical properties were found when comparing to other coral reef waters worldwide, some of them with data collected in the same season as this study (Table 6), differences between the bio-optical properties were found. Overall, the ABR bio-optical properties exhibited higher values than those observed in the Kimberley Marine Region (KMR), and the Caribbean Sea. The relatively low volumes of river freshwater associated with the influence of warm and low salinity water from Holloway Current and Indo-Pacific through-flow (Cherukuru et al., 2016) are probably responsible for the lower Chl-a and aCDOM found in the KMR compared with the ones in the ABR. In the Caribbean Sea, low Chl-a would result from the water column stratification. And despite the terrestrial contributions to the Caribbean Sea coastal waters by local rivers discharges, the aCDOM(440) and aNAP(440) values are still lower than those observed in ABR. The opposite pattern was observed between the bio-optical data from ABR and Northern Australia (NA). The Chl-a, aCDOM(440) and aNAP(440) values in NA were higher than in ABR. The NA is influenced by a monsoonal climate, with the tidal currents driving the water dynamics (Blondeau-Patissier et al., 2017). During the wet season, the monsoon rainfall (∼1,700 mm yr−1) associated with six rivers is responsible for an increase in river discharge, which delivers a large amount of nutrients and land-sourced CDOM to the Northern Australia coastal water, enhancing primary productivity and increasing the number of particles in the water. Similar conditions were observed in the Great Barrier Reef World Heritage Area (GBRWHA), specifically Mossman Daintree. In this area, during the wet season, rainfall can reach up to 600 mm d−1 promoting a higher influence on the bio-optical properties and being responsible for the higher Chl-a, aphy(440), aCDOM(440) and aNAP(440) values. However, the ABR bio-optical variables had higher values than in reef waters from GBRWHA. According to Botha et al. (2020), the GBRWHA and NA has a wide range of water types which could explain the comparison results between ABR and these two different areas. The physical and biogeochemical oceanographic processes associated with inputs of land-derived material are responsible for the variation in the bio-optical properties of coral reef areas.
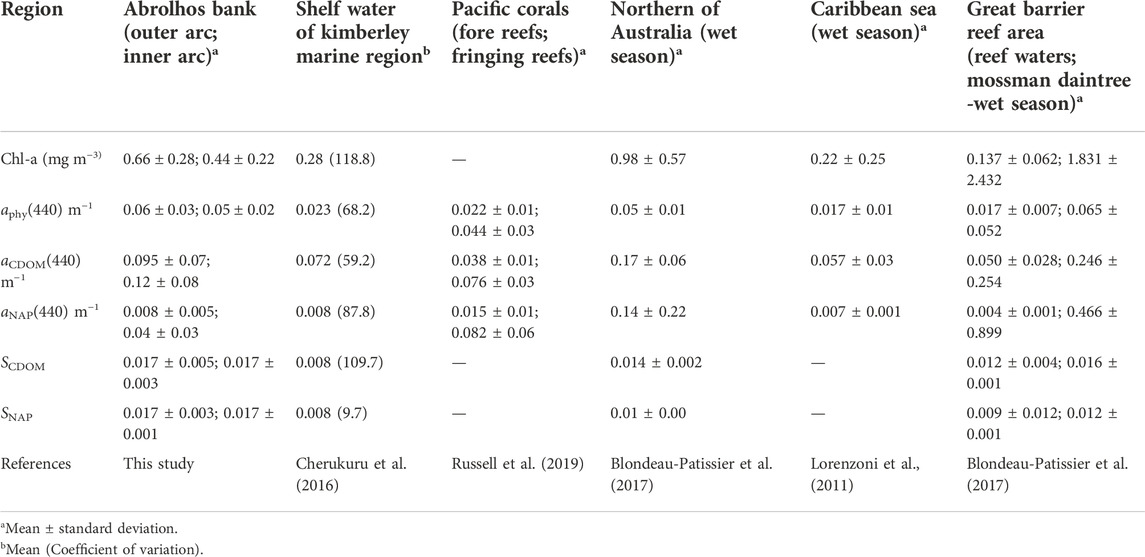
TABLE 6. Comparison between the optical properties of different coastal areas in the world.
4.2 HOPE retrievals: Performance, limitations, and recommendations for future studies
The HOPE model satisfactory retrieved the optical properties and depth in the coral reef areas in ABR, achieving R2 of 0.45 (for adg(440)), 0.7 (for aphy(440)), 0.56 (for aT-w(440)) and 0.81 (for depth) when contrasting to in situ data, and a value of 0.87 (for depth) using PRISMA image, even though in the last case the validation set was acquired with a temporal difference regarding satellite acquisition. Although there were no available data for a rigorous validation of the absorption and backscattering retrievals using PRISMA data, the HOPE model presented a general similar pattern as previously observed for bio-optical retrievals using semi-analytical inversion models in coastal and coral reef areas: low values for aT-w and bbp, except closer to the coast, values of adg > aphy and bbp, higher bbp in nearshore waters, and a decrease in all bio-optical data with increasing distance from the coast (Dekker et al., 2011; McKinna et al., 2015; Barnes et al., 2018; Garcia et al., 2020). However, there were some inconsistencies in the spatial pattern of retrievals, such as the low values of bbp and slightly higher values of aphy observed in the river mouth and the depth closely following the river plume. According to Lee et al. (2001), water turbidity can limit the performance of the semi-analytical models. Once the suspended particulate matter, the main contributor to turbidity and plume, interferes with the ray-path geometry of light, the plume can be confused with bottom reflectance creating false shoals and reducing drastically the sensible depth (Tripathi and Rao, 2002; Caballero et al., 2019). Also, in the presence of high turbidity the inversion problem can be simplified since the bottom depth signal may not be captured by the sensor. Using the HOPE model, Casal et al. (2020) showed that the effects of local turbidity caused underestimation in the bathymetric retrieval. They also recommended avoid retrieving bottom depth from remote sensing over high turbidity waters since they strongly influence the relationship between the depth and satellite signal. In addition, McKinnan et al. (2015) revealed a lower capacity of the SWIM to retrieve the IOPs during highly turbid events such as river flood plumes. Therefore, selecting images with optimal conditions (e.g., high water transparency) is important to achieve better optical properties and depth retrieval through semi-analytical models.
The atmospheric correction also could influence the bio-optical and depth retrieval. Most atmospheric correction methods (AC) assume that the water-leaving radiance is negligible in the near-infrared. However, in coastal waters, they are often not negligible (IOCCG, 2010; Bulgarelli et al., 2014; Sterckx et al., 2015). Alternatively, the short-wave infrared bands have been used in AC to improve the Rrs retrievals in turbid waters (Wang and Shi, 2007; Vanhellemont and Ruddick, 2014). In addition, the AC frequently uses maritime aerosols as the dominant aerosol type in coastal waters (IOCCG, 2010). However, in these areas, the marine- and terrestrial-source aerosols can produce mixed conditions and spatially variable, which may not be entirely represented in the aerosol models (Ahmad et al., 2010; Pahlevan et al., 2017). Therefore, the inaccurate aerosol model used in the atmospheric correction procedure or the imprecise estimation of aerosol optical thickness could introduce errors in the estimated atmospheric reflectance (Braga et al., 2022). Hence, correcting atmospheric effects is considered a critical step for these models and significantly impacts the retrieval results (Goodman et al., 2008; Hedley et al., 2012; Eugenio et al., 2017). According to Casal et al. (2020), the atmospheric correction choice had a major influence on the estimated depth. At the same time, Goodman et al. (2008) concluded that the robust model performance was impacted by differences in the atmospheric and sunglint corrections method. The ACOLITE, primarily designed for multispectral images for aquatic remote sensing, was recently modified to process PRISMA data (Braga et al., 2022). However, more studies are still required to evaluate ACOLITE performance on PRISMA images over shallow waters covering a larger range of water optical properties. The errors associated with the aphy retrieval using in situ data could be partially explained by the bottom substrate type since a significant partial correlation was observed between the residual aphy and bottom substrate. Nevertheless, due to the absence of a significant correlation between the bottom substrate and depth and residuals of adg and aT-w, it is difficult to affirm the reason for the errors in this retrieval. The relatively small sampling dataset could influence the level of significance observed in correlation. Besides turbidity, atmospheric correction, bottom reflectance and depth, the model parametrization and uncertainties associated with Rrs(λ) can also limit the HOPE model performance.
Issues in the retrieval of optical inherent properties and depth could be caused by assuming a wrong bottom reflectance (Dierssen et al., 2019; Garcia et al., 2020; Wei et al., 2020). Therefore, selecting the appropriate bottom reflectance spectra might be crucial to improving HOPE retrievals. Using different linear mixtures of five different substrates intended to reduce uncertainties caused by incorrect RB in the parameterization but still heterogeneity of benthic substrates in the region may be yet not well represented by the RB used in the model. Also, the reflectance of coral as a 3-D structure is usually incorrectly represented as a horizontal structure. The reflectance of a 3-D coral is generally much lower than that measured from a horizontal plane and can be related to an estimate of the true surface area divided by the planar surface area (Hedley et al., 2018). Dierssen et al. (2019) highlighted the possible effect of the incorrect horizontal representation of seagrass to water optical retrieval using the HOPE model in a shallow water area. These authors suggested that the measurement and representation of more realistic benthic reflectance incorporating the canopy architecture and rugosity should reduce the uncertainty in retrieving the water column parameters. In this study, even when using a more representative bottom reflectance of the reef environment, the model still markedly underestimated absorption coefficients from the in situ data, and overestimated the depth derived from the PRISMA image. Note that there was a difference of 9 years between the in situ sampling and the PRISMA image acquisition, but the time period was stable in terms of the benthic assemblages (Teixeira et al., 2021). Although some local changes in bottom substrate must have occurred during the 9 years, either by physical drivers, bleaching processes, or biological succession of species (Duarte et al., 2020; Teixeira et al., 2021, 2019), depth retrieval from the PRISMA image still performs well with a high R2 of 0.87.
Previous studies showed that the inherent optical properties and depth retrieval were associated to higher uncertainties for very shallow clear waters (<3 m). For example, Dekker et al. (2011) compared different SA models (HOPE, Comprehensive Reflectance Inversion based on Spectrum matching and Table Lookup-CRISTAL, BRUCE, and SAMBUCA) in Moreton Bay, Australia, using a hyperspectral image Compact Airborne Spectrographic Imager (CASI) image. They observed a limitation of the models in depths between 0 and 3 m. In contrast, the inversion methods worked well to about 10 m deep. McKinna et al. (2015), using a shallow water inversion model based on the HOPE model, showed an uncertainty increase for waters shallower than 5 m using MODIS imagery. Therefore, they recommended excluding the retrievals in waters shallower than 5 m. In addition, Barnes et al. (2018) observed large positive errors in adg(440) for depths smaller than ∼12 m and slight underestimations for aphy(440) when the water column varied from 2 to 15 m deep using MERIS images. In our study, 88% of stations were in areas shallower than 12 m, 66% in shallower than ∼5 m, and from stations used for the image results validation, 85% were in areas shallower than 5 m. Nevertheless, the optical retrieval had uncertainty for ABR waters only in depths shallower than 1.4 m and was not capable of retrieving with good accuracy when water depth was higher than 10 m in the PRISMA image and 15 m in the in situ Rrs(λ) data. There is no consensus about the depth at which the model uncertainties become significant. However, as the water column becomes shallower, the influence of the substrate becomes more important than the contribution of the water column and vice versa. Thus, as the water column becomes shallower, the benthic reflectance contribution makes the retrieved water column absorption and backscattering coefficients less trustworthy, thus highly depending on the substrate type used as input (Dekker et al., 2011). Also, the methodological aspects such as problems in GPS positioning and inaccurate tide correction could influence the retrievals.
Another factor that limits the model performance is using general assumptions within HOPE model parameterization that may not be appropriate for the region. The HOPE model uses fixed values for the slope of adg and spectral shape parameter of particle backscattering (S and Y, respectively), which can affect the derived optical properties (Garcia et al., 2020; Wei et al., 2020; Werdell et al., 2013). Barnes et al. (2018) highlighted that some retrieval errors might be attributed to fixing Y to a generally incorrect value and observed better results in stations where Y corresponded to in situ measurements. Kostadinov et al. (2007) showed that the assumption of constant spectral shapes could hamper an optimum retrieval of bio-optical constituents, even with a regionally tuned optical model. Blondeau-Patissier et al. (2017) concluded that using constant mean values for Y and the spectral slopes of CDOM and NAP, often the case in global models, will limit their application in some tropical regions of the world. Instead of using a fixed value of Y and optimizing the depth, Barnes et al. (2018) used the real depth values and optimized the Y, finding significant improvement in optical properties errors relative to most depths. In addition, McKinna et al. (2015) increased the number of valid pixels by up to 20% varying S and Y values, and indicated based on previous reports (Antoine et al., 2011; Blondeau-Patissier et al., 2017; Twardowski et al., 2004) that smaller values of S and Y are more suitable for modeling optically complex waters. In our study, the slope of adg varied between 0.009 and 0.024 nm−1, and the mean value (0.017 nm−1) was used as a fixed value for S, whereas for Y, the default value (0.5 m−1) was used due to the lack of in situ data. Therefore, assuming a fixed value for Y and S possibly influenced the optical properties retrieval once it is known that these spectral slopes may vary spatially and temporally (Garcia et al., 2020), and could not be correctly represented by the mean. In some models, the spectral shapes of internal optical properties can vary, as in the Generalized Inherent Optical Property (GIOP) (Werdell et al., 2013) and Quasi-Analytical Algorithm (QAA) (Lee et al., 2001). However, those models use band ratios to adjust the internal optical spectral shapes and then are not suitable for application in shallow waters (McKinna et al., 2015). In addition, as the range of optical properties values is provided as input data, it is important to define ranges consistent with the known ranges in the study area (Casal et al., 2020). Therefore, it is important to obtain information about the optical properties’ potential range in the study area to be used in the model.
Finally, uncertainties in Rrs(λ) used as input might be also related to the HOPE model’s low performance. The accuracy of the optimization scheme depends on uncertainties in measured or satellite-derived Rrs (λ), which propagate (and may be amplified) to retrieved products (Werdell and Bailey, 2005). The acquisition, processing methods, and environmental conditions during the above-water in situ measurement of Rrs (λ) can promote high uncertainties, i.e., >30% (Hooker and Maritorena, 2000; Toole et al., 2000). Also, it is recognized that the satellite Rrs(λ) data are subject to errors caused by insufficient calibration or/and atmospheric correction over shallow waters (Garcia et al., 2018; Wei et al., 2020). Furthermore, uncertainties in the optical properties may also be consequential because they are determined by the concentration of each constituent and instrument (Röttgers et al., 2016; Twardowski et al., 2007). Further studies should associate uncertainties to the retrieved variables, which the HOPE model does not do, and use quality indices such as the Substratum Detectability Index (SDI) proposed by Brando et al. (2009), allowing users to identify questionable pixels that could be masked to produce reliable maps of those variables.
The optical properties of ABR certainly changed during the in-water sampling and the image acquisition (9 years), limiting the utilization of optical data (collected in 2013) as a base to specify the limits for the model performed on the PRISMA image (acquired in 2022). And, even using few validation data acquired with years of difference and the lack of knowledge about the optical properties at the moment of image acquisition (to help defining the parameterization range), the model obtained qualitatively good results. Previous studies have showed the potential of PRISMA data for optical bathymetry retrieval (Alevizos et al., 2022), seabed mapping (Borfecchia et al., 2021), and retrieval of water quality parameters in inland waters (Niroumand-Jadidi et al., 2020; Bresciani et al., 2022). Together with the results presented in our present analysis, these studies indicate the potential of the hyperspectral PRISMA sensor for monitoring aquatic systems.
5 Conclusion
The bio-optical properties of the ABR are influenced by oceanographic processes and by continental terrigenous input. Along with the bottom characteristics, waves, and Sun light penetration in the water column, they imprint the remote sensing reflectance. The Brazil Current can reduce the potential effect caused by terrigenous sediments input in the ABR and even the input of nutrients from local rivers. However, these inputs associated with the geomorphological and hydrodynamic barrier present in the region are essential in controlling the differences observed in the water column between the ABR’s inner and outer arcs, especially in relation to chlorophyll-a and non-algal particulate matter. The coral reefs are probably the primary source of CDOM and may be responsible for the dominant contribution of CDOM to total non-water absorption in both arcs. The SCDOM, Sr, and SNAP values suggested that degraded dissolved organic matter with relatively low molecular weight and organic rather than mineral particles dominated the absorption coefficient.
The bio-optical properties of ABR can be considered unique compared to those of other coastal and coral reef areas worldwide. The Chl-a, aphy, and aCDOM values were higher than those previously reported for shelf water of Kimberley Marine Region, Pacific reefs, and Caribbean waters, while the aNAP values were lower than those of the GBRWHA (wet season), Northern Australia, and fringing Pacific reefs. The warm and nutrients-poor Brazil Current, the land-derived material inputs, and the geomorphological characteristics of the bottom substrate control the bio-optical properties in ABR. In KMR, the bio-optical properties are controlled by the Holloway Current and Indo-Pacific through-flow associated with the low river discharge. In the Caribbean Sea, the water column stratification and the river discharge are responsible for the values of Chl-a, aphy and aCDOM. In Northern Australia and GBRWHA, the monsoonal climate associated with the presence of several rivers and the tidal currents that drive the water dynamics control their bio-optical properties, especially in the wet season. Thus, the physical and biogeochemical oceanographic processes, the geomorphology, and inputs of land-derived material are probably responsible for the differences in the bio-optical properties among those regions.
The HOPE model retrieved the optical properties and depth in ABR from in situ Rrs with acceptable uncertainties (R2 = 0.7, 0.45, 0.56 and 0.81 for aphy(440), adg(440), aT-w(440) and depth, respectively). It also provided satisfactory depth retrievals when applied to the PRISMA image (R2 = 0.87). However, the influence of turbidity, atmospheric correction (Rrs errors), shallow depths (bottom substrate), and model uncertainties hampered the correlation between measurements and estimates, and made it difficult to restitute spatial patterns properly. Further studies should associate uncertainties and use quality indices enabling users to mask questionable pixels producing more accurate maps of retrieved variables. When bottom influence becomes small, the retrieval of water depth and bottom substrate begins to be problematic, but one expects the retrieval of IOPs to improve (since bottom contamination is less an issue). It is crucial to further improve ocean color models considering all the above challenges, so that actual changes, not model artifacts, are captured and, therefore, bio-optical variability of the ABR (and similar optically shallow and complex water bodies) are correctly described in the context of environmental and climate change. The PRISMA image processing indicated a potential in retrieving bathymetry and optical properties in shallow water environments based upon a physics-based inversion model. The use of images with low turbidity and an improved atmospheric correction should yield better retrievals of water column and bottom properties. The results are promising, but additional matchups between satellite and in situ measurements are required for more robust analyses.
Data availability statement
The raw data supporting the conclusion of this article will be made available by the authors, without undue reservation.
Author contributions
Conceptualization, TAGM, MLZ, RF, MK; Methodology, TAGM, MLZ, RF, FDC, and MK; Formal analysis, TAGM; Data curation, TAGM, MLZ, RF, FDC, GMC, and MK; Writing—original draft preparation, TAGM; Writing—review and editing, TAGM, MLZ, RF, FDC, GMC, and MK; Supervision, MK; Project administration, MK; Funding acquisition, MK. All authors have read and agreed to the published version of the manuscript.
Funding
This study is a contribution from the Abrolhos Network (www.abrolhos.org) and was co-funded by Brazil's National Research Council (CNPq) through the Abrolhos Long Term Ecological Monitoring Program (PELD-Site ABRS). The work was financed in part by the Coordenação de Aperfeiçoamento de Pessoal de Nível Superior—Brazil (CAPES)—Finance Code 001, Agencia Espacial Brasileira (AEB) and Instituto Nacional de Pesquisas Espaciais (INPE). TM and FC were supported by CNPq/PCI-D fellowships. MK acknowledges grants from FAPESP (2021/04128-8) and FUSP (2017/00686-0). RF was supported by National Aeronautics and Space Administration (NASA) under various grants.
Acknowledgments
This study was carried out using PRISMA Products © of the Italian Space Agency (ASI), delivered under an ASI License to use. We thank Aline de Matos Valerio and Andrea Oliveira from National Institute for Space Research (INPE) for providing valuable comments that improved the manuscript. We especially thank Dr. Rodrigo Garcia from University of Western Australia for his helpful feedback regarding the HOPE model. We also thank the reviewers for their constructive comments.
Conflict of interest
The authors declare that the research was conducted in the absence of any commercial or financial relationships that could be construed as a potential conflict of interest.
Publisher’s note
All claims expressed in this article are solely those of the authors and do not necessarily represent those of their affiliated organizations, or those of the publisher, the editors and the reviewers. Any product that may be evaluated in this article, or claim that may be made by its manufacturer, is not guaranteed or endorsed by the publisher.
Supplementary material
The Supplementary Material for this article can be found online at: https://www.frontiersin.org/articles/10.3389/frsen.2022.986013/full#supplementary-material
References
Ahmad, Z., and Fraser, R. S. (1982). An iterative radiative transfer code for ocean-atmosphere systems. J. Atmos. Sci. 39, 656–665. doi:10.1175/1520-0469(1982)039<0656:airtcf>2.0.co;2
Albert, A., and Mobley, C. (2003). An analytical model for subsurface irradiance and remote sensing reflectance in deep and shallow case-2 waters. Opt. Express 11, 2873. doi:10.1364/oe.11.002873
Alevizos, E., Le Bas, T., and Alexakis, D. (2022). Assessment of PRISMA Level-2 hyperspectral imagery for large scale satellite-derived bathymetry retrieval. Mar. Geod. 45, 251–273. doi:10.1080/01490419.2022.2032497
Agência Nacional de Águas (ANA) (2022). HIDROWEB. Available at: www.ana.gov.br (Accessed January, 2022).
Amado-Filho, G. M., Moura, R. L., Bastos, A. C., Salgado, L. T., Sumida, P. Y., Guth, A. Z., et al. (2012). Rhodolith beds are major CaCO3 bio-factories in the tropical south west atlantic. PLoS One 7, e35171. doi:10.1371/journal.pone.0035171
Andutta, F. P. (2014). O Sistema Estuarino dos rios Caravelas e Peruípe (Bahia): Observações, simulações, tempo de residência e processos difusivo e advectivo. Doctorate's thesis (São Paulo (SP): Universidade de São Paulo).
Antoine, D., Siegel, D. A., Kostadinov, T., Maritorena, S., Nelson, N. B., Gentili, B., et al. (2011). Variability in optical particle backscattering in contrasting bio-optical oceanic regimes. Limnol. Oceanogr. 56, 955–973. doi:10.4319/lo.2011.56.3.0955
Babin, M., Stramski, D., Ferrari, G. M., Claustre, H., Bricaud, A., Obolensky, G., et al. (2003). Variations in the light absorption coefficients of phytoplankton, nonalgal particles, and dissolved organic matter in coastal waters around Europe. J. Geophys. Res. 108, 1–20. doi:10.1029/2001JC000882
Barnes, B. B., Garcia, R., Hu, C., and Lee, Z. (2018). Multi-band spectral matching inversion algorithm to derive water column properties in optically shallow waters: An optimization of parameterization. Remote Sens. Environ. 204, 424–438. doi:10.1016/j.rse.2017.10.013
Bastos, A. C., Moura, R. L., Amado-Filho, G. M., D'Agostini, D. P., Secchin, N. A., Francini-Filho, R. B., et al. (2013). Buracas: Novel and unusual sinkhole-like features in the Abrolhos Bank. Cont. Shelf Res. 70, 118–125. doi:10.1016/j.csr.2013.04.035
Bastos, A. C., Moura, R. L., Moraes, F. C., Vieira, L. S., Braga, J. C., Ramalho, L. V., et al. (2018). Bryozoans are major modern builders of South Atlantic oddly shaped reefs. Sci. Rep. 8, 1–11. doi:10.1038/s41598-018-27961-6
Blondeau-Patissier, D., Schroeder, T., Clementson, L. A., Brando, J., Purcell, N., Ford, M., et al. (2017). Bio-optical properties of two neigboring coastal regions of tropical northern Australia: The van diemen gulf and Darwin harbour. Front. Mar. Sci. 4, 1–27. doi:10.3389/fmars.2017.00114
Borfecchia, F., Micheli, C., De Cecco, L., Sannino, G., Struglia, M. V., Di Sarra, A. G., et al. (2021). Satellite multi/hyper spectral HR sensors for mapping the Posidonia oceanica in south mediterranean islands. Sustainability 13, 13715. doi:10.3390/su132413715
Boss, E., and Zaneveld, J. R. V. (2003). The effect of bottom substrate on inherent optical properties: Evidence of biogeochemical processes. Limnol. Oceanogr. 48, 346–354. doi:10.4319/lo.2003.48.1_part_2.0346
Botha, E. J., Anstee, J. M., Sagar, S., Lehmann, E., and Medeiros, T. A. G. (2020). Classification of Australian waterbodies across a wide range of optical water types. Remote Sens. 12, 6–8. doi:10.3390/RS12183018
Braga, F., Fabbretto, A., Vanhellemont, Q., Bresciani, M., Giardino, C., Scarpa, G. M., et al. (2022). Assessment of PRISMA water reflectance using autonomous hyperspectral radiometry. ISPRS J. Photogrammetry Remote Sens. 192, 99–114. doi:10.1016/j.isprsjprs.2022.08.009
Brando, V. E., Anstee, J. M., Wettle, M., Dekker, A. G., Phinn, S. R., and Roelfsema, C. (2009). A physics based retrieval and quality assessment of bathymetry from suboptimal hyperspectral data. Remote Sens. Environ. 113, 755–770. doi:10.1016/j.rse.2008.12.003
Bresciani, M., Giardino, C., Fabbretto, A., Pellegrino, A., Mangano, S., Free, G., et al. (2022). Application of new hyperspectral sensors in the remote sensing of aquatic ecosystem health: Exploiting PRISMA and DESIS for four Italian lakes. Resources 11, 8. doi:10.3390/resources11020008
Bricaud, A., Babin, M., Claustre, H., Ras, J., and Tièche, F. (2010). Light absorption properties and absorption budget of Southeast Pacific waters. J. Geophys. Res. 115. doi:10.1029/2009JC005517
Bricaud, A., Babin, M., Morel, A., and Claustre, H. (1995). Variability in the chlorophyll-specific absorption coefficients of natural phytoplankton: Analysis and parameterization. J. Geophys. Res. 100 (13), 13321332. doi:10.1029/95JC00463
Bricaud, A., Claustre, H., Ras, J., and Oubelkheir, K. (2004). Natural variability of phytoplanktonic absorption in oceanic waters: Influence of the size structure of algal populations. J. Geophys. Res. 109, 1–12. doi:10.1029/2004JC002419
Bulgarelli, B., Kiselev, V., and Zibordi, G. (2014). Simulation and analysis of adjacency effects in coastal waters: A case study. Appl. Opt. 53, 1523–1545. doi:10.1364/ao.53.001523
Caballero, I., Stumpf, R. P., and Meredith, A. (2019). Preliminary assessment of turbidity and chlorophyll impact on bathymetry derived from sentinel-2A and sentinel-3A satellites in South Florida. Remote Sens. 11, 645. doi:10.3390/rs11060645
Cannizzaro, J. P., and Carder, K. L. (2006). Estimating chlorophyll a concentrations from remote-sensing reflectance in optically shallow waters. Remote Sens. Environ. 101, 13–24. doi:10.1016/j.rse.2005.12.002
Carder, K. L., Cannizzaro, J. P., and Lee, Z. (2005). ocean color algorithms in optically shallow waters: Limitations and improvements. Remote Sens. Coast. Ocean. Environ. 5885, 588506. doi:10.1117/12.615039
Carder, K. L., Chen, F. R., Lee, Z. P., Hawes, S. K., and Kamykowski, D. (1999). Semianalytic Moderate-Resolution Imaging Spectrometer algorithms for chlorophyllaand absorption with bio-optical domains based on nitrate-depletion temperatures. J. Geophys. Res. 104, 5403–5421. doi:10.1029/1998jc900082
Carder, K. L., Steward, R. G., Harvey, G. R., and Ortner, P. B. (1989). Marine humic and fulvic acids: Their effects on remote sensing of ocean chlorophyll. Limnol. Oceanogr. 34, 68–81. doi:10.4319/lo.1989.34.1.0068
Casal, G., Hedley, J. D., Monteys, X., Harris, P., Cahalane, C., and McCarthy, T. (2020). Satellite-derived bathymetry in optically complex waters using a model inversion approach and Sentinel-2 data. Estuar. Coast. Shelf Sci. 241, 106814. doi:10.1016/j.ecss.2020.106814
Castro, C. B., Segal, B., Negrão, F., and Calderon, E. N. (2012). Four-year monthly sediment deposition on turbid southwestern atlantic coral reefs, with a comparison of benthic assemblages. Braz. J. Oceanogr. 60, 49–63. doi:10.1590/s1679-87592012000100006
Cherukuru, N., Davies, P. L., Brando, V. E., Anstee, J. M., Baird, M. E., Clementson, L. A., et al. (2016). Physical oceanographic processes influence bio-optical properties in the Tasman Sea. J. Sea Res. 110, 1–7. doi:10.1016/j.seares.2016.01.008
Ciotti, Á. M., Lewis, M. R., and Cullen, J. J. (2002). Assessment of the relationships between dominant cell size in natural phytoplankton communities and the spectral shape of the absorption coefficient. Limnol. Oceanogr. 47, 404–417. doi:10.4319/lo.2002.47.2.0404
Coni, E. O. C., Ferreira, C. M., Meirelles, P. M., Menezes, R., Santana, E. F. C., Moreira, A. P. B., et al. (2017). Modeling abundance, growth, and health of the solitary coral Scolymia wellsi (Mussidae) in turbid SW Atlantic coral reefs. Mar. Biol. 164, 1–15. doi:10.1007/s00227-017-3090-4
Costa, O. S., Attrill, M. J., and Nimmo, M. (2006). Seasonal and spatial controls on the delivery of excess nutrients to nearshore and offshore coral reefs of Brazil. J. Mar. Syst. 60, 63–74. doi:10.1016/j.jmarsys.2005.11.006
Coutinho, R., Villaça, R. C., Magalhães, C. A., Guimaraens, M. A., Apolinário, M., and Muricy, G. (1993). Influencia antropica nos ecossistemas coralinos da região de Abrolhos, Bahia, Brasil. Acta Biol. Leopoldensia 15, 133–144. doi:10.1364/AO.36.008710
Cremella, B., Bélanger, S., and Huot, Y. (2022). Aquatic particulate absorption coefficient combining extraction and bleaching optimized for inland waters. Limnol. Ocean Methods 20, 451–465. doi:10.1002/lom3.10497
Dall'Olmo, G., Gitelson, A. A., Rundquist, D. C., Leavitt, B., Barrow, T., and Holz, J. C. (2005). Assessing the potential of SeaWiFS and MODIS for estimating chlorophyll concentration in turbid productive waters using red and near-infrared bands. Remote Sens. Environ. 96, 176–187. doi:10.1016/j.rse.2005.02.007
de Medeiros, T., Seoane, J. C., Jonck, C. C., Barbosa, C., Baptista, G., and Nolasco, M. (2018). Caracterização espectral de corais do Sudoeste do Atlântico. Rev. Bras. Cartogr. 70, 997–1032. doi:10.14393/rbcv70n3-45709
Dekker, A. G., Phinn, S. R., Anstee, J., Bissett, P., Brando, V. E., Casey, B., et al. (2011). Intercomparison of shallow water bathymetry, hydro-optics, and benthos mapping techniques in Australian and Caribbean coastal environments. Limnol. Oceanogr. Methods 9, 396–425. doi:10.4319/lom.2011.9.396
Dierssen, H. M., Bostrom, K. J., Chlus, A., Hammerstrom, K., Thompson, D. R., and Lee, Z. (2019). Pushing the limits of seagrass remote sensing in the turbid waters of Elkhorn Slough, California. Remote Sens. 11, 1664. doi:10.3390/rs11141664
Dorji, P., Fearns, P., and Broomhall, M. (2016). A semi-analytic model for estimating total suspended sediment concentration in turbid coastal waters of northern Western Australia using MODIS-Aqua 250 m data. Remote Sens. 8, 33–38. doi:10.3390/rs8070556
Duarte, G. A. S., Villela, H. D. M., Deocleciano, M., Silva, D., Barno, A., Cardoso, P. M., et al. (2020). Heat Waves Are a Major Threat to Turbid Coral Reefs in Brazil. Front. Mar. Sci. 7, 1–8. doi:10.3389/fmars.2020.00179
Dutra, L., Kikuchi, R., and Leão, Z. (2006). Effects of sediment accumulation on reef corals from Abrolhos, Bahia, Brazil. J. Coast. Res. 2006, 633–638.
Eça, G. F., Lopes, J. B. de B. S., Souza, M. F. L., and Belém, A. L. (2014). Dissolved inorganic nutrients and chlorophyll on the narrow. Braz. J. Od. Oceanogr. 62, 11–21. Available at: http://www.scielo.br/pdf/bjoce/v62n1/02.pdf.
Ekau, W. (1999). Topographical and hydrographical impacts on zooplankton community structure in the Abrolhos bank region, East Brazil. Arch. Fish. Mar. Res. 47, 307–320.
Emílsson, I. (1961). The shelf and coastal waters off southern Brazil. Bol. Inst. Oceanogr. 11, 101–112. doi:10.1590/s0373-55241961000100004
Eugenio, F., Marcello, J., Martin, J., and Rodríguez-Esparragón, D. (2017). Benthic habitat mapping using multispectral high-resolution imagery: Evaluation of shallow water atmospheric correction techniques. Sensors 17, 2639. doi:10.3390/s17112639
Evangelista, H., Valeriano, C. de M., Paravidini, G., Gonçalves Junior, S. J., Sodré, E. D., Neto, C. C. A., et al. (2022). Using Nd Sr isotopes in suspended sediments in the Abrolhos coral-reef (SW Atlantic, Brazil) to assess potential contamination from the 2015 Fundão dam collapse. Sci. Total Environ. 807, 151231. doi:10.1016/j.scitotenv.2021.151231
Ferreira, L. C., Bastos, A. C., Amado Filho, G. M., Leite, M. D., C. Boni, G., C. Moraes, F. C., et al. (2020). “Submerged reefs in the abrolhos shelf: Morphology and habitat distribution,” in Seafloor geomorphic features and benthic habitats: GeoHab atlas of seafloor geomorphic features and benthic habitats. Editors P. T. Harris, and E. K. Baker (Amsterdam, Netherlands: Elsevier Publisher), 519–532. doi:10.1016/B978-0-12-814960-7.00030-0
Fichot, C. G., and Benner, R. (2012). The spectral slope coefficient of chromophoric dissolved organic matter (S 275-295 ) as a tracer of terrigenous dissolved organic carbon in river-influenced ocean margins. Limnol. Oceanogr. 57, 1453–1466. doi:10.4319/lo.2012.57.5.1453
Francini-Filho, R. B., Coni, E. O. C., Meirelles, P. M., Amado-Filho, G. M., Thompson, F. L., Pereira-Filho, G. H., et al. (2013). Dynamics of coral reef benthic assemblages of the Abrolhos Bank, eastern Brazil: Inferences on natural and anthropogenic drivers. PLoS One 8, 542600. doi:10.1371/journal.pone.0054260
Freitas, L. M., Oliveira, M. de D. M., Leão, Z. M. A. N., and Kikuchi, R. K. P. (2019). Effects of turbidity and depth on the bioconstruction of the Abrolhos reefs. Coral Reefs 38, 241–253. doi:10.1007/s00338-019-01770-3
Garcia, R. A., Lee, Z., Barnes, B. B., Hu, C., Dierssen, H. M., and Hochberg, E. J. (2020). Benthic classification and IOP retrievals in shallow water environments using MERIS imagery. Remote Sens. Environ. 249, 112015. doi:10.1016/j.rse.2020.112015
Garcia, R. A., Lee, Z., and Hochberg, E. J. (2018). Hyperspectral shallow-water remote sensing with an enhanced benthic classifier. Remote Sens. 10, 147. doi:10.3390/rs10010147
Ghisolfi, R. D., Pereira da Silva, M. P., Thomaz dos Santos, F. T., Servino, R. N., Cirano, M., and Thompson, F. L. (2015). Physical forcing mechanisms controlling the variability of chlorophyll-a over the royal-charlotte and abrolhos banks-eastern brazilian shelf. PLoS One 10, e0117082. doi:10.1371/journal.pone.0117082
Giardino, C., Candiani, G., Bresciani, M., Lee, Z., Gagliano, S., and Pepe, M. (2012). Bomber: A tool for estimating water quality and bottom properties from remote sensing images. Comput. Geosciences 45, 313–318. doi:10.1016/j.cageo.2011.11.022
Goodman, J. A., Lee, Z., and Ustin, S. L. (2008). Influence of atmospheric and sea-surface corrections on retrieval of bottom depth and reflectance using a semi-analytical model: A case study in kaneohe Bay, Hawaii. Appl. Opt. 47, F1–F11. doi:10.1364/AO.47.0000F1
Hedley, J. D., Harborne, A. R., and Mumby, P. J. (2005). Technical note: Simple and robust removal of sun glint for mapping shallow-water benthos. Int. J. Remote Sens. 26, 2107–2112. doi:10.1080/01431160500034086
Hedley, J. D., Roelfsema, C. M., Chollett, I., Harborne, A. R., Heron, S. F., Weeks, S. J., et al. (2016). Remote sensing of coral reefs for monitoring and management: A review. Remote Sens. 8, 118–140. doi:10.3390/rs8020118
Hedley, J., Roelfsema, C., Koetz, B., and Phinn, S. (2012). Capability of the Sentinel 2 mission for tropical coral reef mapping and coral bleaching detection. Remote Sens. Environ. 120, 145–155. doi:10.1016/j.rse.2011.06.028
Hedley, J. D., Mirhakak, M., Wentworth, A., and Dierssen, H. M. (2018). Influence of three-dimensional coral structures on hyperspectral benthic reflectance and water-leaving reflectance. Appl. Sci. 8. doi:10.3390/app8122688
Helms, J. R., Stubbins, A., Ritchie, J. D., Minor, E. C., Kieber, D. J., and Mopper, K. (2008). Absorption spectral slopes and slope ratios as indicators of molecular weight, source, and photobleaching of chromophoric dissolved organic matter. Limnol. Oceanogr. 53, 955–969. doi:10.4319/lo.2008.53.3.0955
Hooker, S. B., and Maritorena, S. (2000). An evaluation of oceanographic radiometers and deployment methodologies. J. Atmos. Ocean. Technol. 17, 811–830. doi:10.1175/1520-0426(2000)017<0811:AEOORA>2.0.CO;2
Ilha, H. H. (2006). “National marine park of abrolhos,” in Atlas of coral reefs protected areas in Brazil. Editor A. P. Prates (Brasilia, Distrito Federal: MMA).
IOCCG (2000). “Remote sensing of ocean colour in coastal and other optically-complex waters,” in Reports of the international ocean-colour coordinating group, No. 3. Editor S. Sathyendranath (Dartmouth: IOCCG).
IOCCG (2006). “Remote sensing of inherent optical properties : Fundamentals, tests of algorithms, and applications,” in Reports of the international ocean-colour coordinating group, No 5. Editor Z. Lee (Dartmouth: IOCCG).
IOCCG (2010). “Atmospheric correction for remotely-sensed ocean-colour products,” in Reports of the international ocean-colour coordinating group, No. 10. Editor M. Wang (Dartmouth: IOCCG).
Jay, S., Guillaume, M., Minghelli, A., Deville, Y., Chami, M., Lafrance, B., et al. (2017). Hyperspectral remote sensing of shallow waters: Considering environmental noise and bottom intra-class variability for modeling and inversion of water reflectance. Remote Sens. Environ. 200, 352–367. doi:10.1016/j.rse.2017.08.020
Jay, S., and Guillaume, M. (2016). Regularized estimation of bathymetry and water quality using hyperspectral remote sensing. Int. J. Remote Sens. 37, 263–289. doi:10.1080/01431161.2015.1125551
Jiang, D., Matsushita, B., and Yang, W. (2020). A simple and effective method for removing residual reflected skylight in above-water remote sensing reflectance measurements. ISPRS J. Photogrammetry Remote Sens. 165, 16–27. doi:10.1016/j.isprsjprs.2020.05.003
Kay, S., Hedley, J. D., and Lavender, S. (2009). Sun glint correction of high and low spatial resolution images of aquatic scenes: A review of methods for visible and near-infrared wavelengths. Remote Sens. 1, 697–730. doi:10.3390/rs1040697
Kikuchi, R. K. P., Leão, Z. M. A. N., and Oliveira, M. D. M. (2010). Conservation status and spatial patterns of AGRRA vitality indices in Southwestern Atlantic reefs. Rbt 58, 1–31. doi:10.15517/rbt.v58i1.20021
Klonowski, W. M., Fearns, P. R. C. S., and Lynch, M. (2007). Retrieving key benthic cover types and bathymetry from hyperspectral imagery. J. Appl. Remote Sens. 1, 011505. doi:10.1117/1.2816113
Kostadinov, T. S., Siegel, D. A., Maritorena, S., and Guillocheau, N. (2007). Ocean color observations and modeling for an optically complex site: Santa Barbara Channel, California, United States. J. Geophys. Res. Ocean. 112, 1–44. doi:10.1029/2006JC003526
Knoppers, B., Meyerhöfer, M., Marone, E., Dutz, J., Lopes, R., Leipe, T., et al. (1999b). Compartments of the pelagic system and material exchange at the Abrolhos bank coral reefs, Brazil. Arch. Fish. Mar. Res. 47, 285–306.
Laborel, J. (1969). Les peuplements de Madréporaires des côtes tropicales du Brésil. Ann. L’Université D’Abidjan, Ser. E, Ecol. 2, 1–261.
Land, L. A., Paull, C. K., and Hobson, B. (1995). Genesis of a submarine sinkhole without subaerial exposure: Straits of Florida. Geol 23, 949–951. doi:10.1130/0091-7613(1995)023<09410.1130/0091-7613(1995)023<0949:goassw>2.3.co;2
Leão, Z. M. A. N., and Kikuchi, R. K. P. (2001). “The Abrolhos reefs of Brazil,” in Coastal marine ecosystems of Latin America. Editors U. Seeliger, and B. Kjerfve (Berlin, Heidelberg: Springer), 83–96.
Lee, Z., Carder, K. L., Chen, R. F., and Peacock, T. G. (2001). Properties of the water column and bottom derived from Airborne visible infrared imaging spectrometer (AVIRIS) data. J. Geophys. Res. 106, 11639–11651. doi:10.1029/2000jc000554
Lee, Z., Carder, K. L., Mobley, C. D., Steward, R. G., and Patch, J. S. (1998). Hyperspectral remote sensing for shallow waters I A semianalytical model. Appl. Opt. 37, 6329. doi:10.1364/ao.37.006329
Lee, Z., Carder, K. L., Mobley, C. D., Steward, R. G., and Patch, J. S. (1999). Hyperspectral remote sensing for shallow waters: 2 deriving bottom depths and water properties by optimization. Appl. Opt. 38, 3831. doi:10.1364/ao.38.003831
Lee, Z. (1994). Visible-infrared remote-sensing model and applications for ocean waters. Doctorate's thesis (St Petersburg (FL): University of South Florida).
Leipe, B., Knoppers, E., Marone, R., and Camargo, R. (1999a). Suspended matter transport in coral reef waters of the Abrolhos Bank, Brazil. Geo-Marine Lett. 19, 186–195. doi:10.1007/s003670050108
Lopes, R. M., and Castro, B. M. (2013). Oceanography, ecology and management of Abrolhos Bank. Cont. Shelf Res. 70, 1–2. doi:10.1016/j.csr.2013.11.008
Lorenzoni, L., Hu, C., Varela, R., Arias, G., Guzmán, L., and Muller-Karger, F. (2011). Bio-optical characteristics of Cariaco Basin (Caribbean Sea) waters. Cont. Shelf Res. 31, 582–593. doi:10.1016/j.csr.2010.12.013
Magris, R. A., Marta-Almeida, M., Monteiro, J. A. F., and Ban, N. C. (2019). A modelling approach to assess the impact of land mining on marine biodiversity: Assessment in coastal catchments experiencing catastrophic events (SW Brazil). Sci. Total Environ. 659, 828–840. doi:10.1016/j.scitotenv.2018.12.238
Maritorena, S., Morel, A., and Gentili, B. (1994). Diffuse reflectance of oceanic shallow waters: Influence of water depth and bottom albedo. Limnol. Oceanogr. 39, 1689–1703. doi:10.4319/lo.1994.39.7.1689
Mazzei, E. F., Bertoncini, A. A., Pinheiro, H. T., Machado, L. F., Vilar, C. C., Guabiroba, H. C., et al. (2017). Newly discovered reefs in the southern Abrolhos Bank, Brazil: Anthropogenic impacts and urgent conservation needs. Mar. Pollut. Bull. 114, 123–133. doi:10.1016/j.marpolbul.2016.08.059
McKinna, L. I. W., Fearns, P. R. C., Weeks, S. J., Werdell, P. J., Reichstetter, M., Franz, B. A., et al. (2015). A semianalytical ocean color inversion algorithm with explicit water column depth and substrate reflectance parameterization. J. Geophys. Res. Oceans 120, 1741–1770. doi:10.1002/2014JC010224
Mies, M., Francini-Filho, R. B., Zilberberg, C., Garrido, A. G., Longo, G. O., Laurentino, E., et al. (2020). South Atlantic coral reefs are major global warming refugia and less susceptible to bleaching. Front. Mar. Sci. 7, 1–13. doi:10.3389/fmars.2020.00514
Mitchell, B. G., Bricaud, A., Carder, K., Cleveland, J., Ferrari, G., Gould, R., et al. (2000). “Determination of spectral absorption coefficients of particles, dissolved material and phytoplankton for discrete water samples,” in Ocean optics protocols for satellite ocean color sensor validation - revision 2. Editors G. S. Fargion, and J. L. Mueller (Greenbelt, Maryland: NASA), 125–153.
Mobley, C. D. (1999). Estimation of the remote-sensing reflectance from above-surface measurements. Appl. Opt. 38, 7442–7455. doi:10.1364/ao.38.007442
Mobley, C. D., Sundman, L. K., Davis, C. O., Bowles, J. H., Downes, T. V., Leathers, R. A., et al. (2005). Interpretation of hyperspectral remote-sensing imagery by spectrum matching and look-up tables. Appl. Opt. 44, 3576–3592. doi:10.1364/AO.44.003576
Moreira, P. de P., and Reuss-Strenzel, G. (2009). Mapeamento de habitats do recife de coral Pedra de Leste, Abrolhos, utilizando uma imagem multiespectral Landsat7 ETM. Marte. Dpi. Inpe. Br. 2009, 6595–6602. Available at: http://marte.dpi.inpe.br/col/dpi.inpe.br/sbsr@80/2008/11.17.21.38/doc/6595-6602.
Morel, A., and Maritorena, S. (2001). Bio-optical properties of oceanic waters: A reappraisal. J. Geophys. Res. 106, 7163–7180. doi:10.1029/2000jc000319
Morel, A., and Prieur, L. (1977). Analysis of variations in ocean color1. Limnol. Oceanogr. 22, 709–722. doi:10.4319/lo.1977.22.4.0709
Moura, R. L., Francini-Filho, R. B., Chaves, E. M., Minte-Vera, C. V., and Lindeman, K. C. (2011). Use of riverine through reef habitat systems by dog snapper (Lutjanus jocu) in eastern Brazil. Estuar. Coast. Shelf Sci. 95, 274–278. doi:10.1016/j.ecss.2011.08.010
Moura, R. L., Secchin, N. A., Amado-Filho, G. M., Francini-Filho, R. B., Freitas, M. O., Minte-Vera, C. V., et al. (2013). Spatial patterns of benthic megahabitats and conservation planning in the Abrolhos Bank. Cont. Shelf Res. 70, 109–117. doi:10.1016/j.csr.2013.04.036
Nelson, N. B., and Siegel, D. A. (2013). The global distribution and dynamics of chromophoric dissolved organic matter. Annu. Rev. Mar. Sci. 5, 447–476. doi:10.1146/annurev-marine-120710-100751
Niroumand-Jadidi, M., Bovolo, F., and Bruzzone, L. (2020). Water quality retrieval from PRISMA hyperspectral images: First experience in a turbid lake and comparison with sentinel-2. Remote Sens. 12, 3984. doi:10.3390/rs12233984
O'Reilly, J. E., and Werdell, P. J. (2019). Chlorophyll algorithms for ocean color sensors - OC4, OC5 & OC6. Remote Sens. Environ. 229, 32–47. doi:10.1016/j.rse.2019.04.021
Pahlevan, N., Roger, J.-C., and Ahmad, Z. (2017). Revisiting short-wave-infrared (SWIR) bands for atmospheric correction in coastal waters. Opt. Express 25, 6015–6035. doi:10.1364/oe.25.006015
Pereira, M. D., Siegle, E., de Miranda, L. B., and Schettini, C. A. F. (2010). Hidrodinâmica e transporte de material particulado em suspensão sazonal em um estuário dominado por maré: Estuário de Caravelas (BA). Rev. Bras. Geof. 28, 427–444. doi:10.1590/s0102-261x2010000300008
Peterson, R. G., and Stramma, L. (1991). Upper-level circulation in the south Atlantic Ocean. Prog. Oceanogr. 26, 1–73. doi:10.1016/0079-6611(91)90006-8
Petit, T., Bajjouk, T., Mouquet, P., Rochette, S., Vozel, B., and Delacourt, C. (2017). Hyperspectral remote sensing of coral reefs by semi-analytical model inversion - comparison of different inversion setups. Remote Sens. Environ. 190, 348–365. doi:10.1016/j.rse.2017.01.004
Pope, R. M., and Fry, E. S. (1997). Absorption spectrum (380-700 nm) of pure water II Integrating cavity measurements. Appl. Opt. 36, 8710–8723. doi:10.1364/ao.36.008710
Ribeiro, F. V., Sá, J. A., Fistarol, G. O., Salomon, P. S., Pereira, R. C., Souza, M. L. A. M., et al. (2018). Long-term effects of competition and environmental drivers on the growth of the endangered coral Mussismilia braziliensis (Verril, 1867). PeerJ 6, e5419. doi:10.7717/peerj.5419
Rodrigues, R. R., Rothstein, L. M., and Wimbush, M. (2007). Seasonal variability of the south equatorial current bifurcation in the Atlantic Ocean: A numerical study. J. Phys. Oceanogr. 37, 16–30. doi:10.1175/JPO2983.1
Roelfsema, C., and Phinn, S. (2012). Spectral reflectance library of selected biotic and abiotic coral reef features in Heron Reef. Pangaea. Data Collection. doi:10.1594/PANGAEA.804589
Röttgers, R., Doxaran, D., and Dupouy, C. (2016). Quantitative filter technique measurements of spectral light absorption by aquatic particles using a portable integrating cavity absorption meter (QFT-ICAM). Opt. Express 24., A1. doi:10.1364/oe.24.0000a1
Rudorff, N. D. M., Frouin, R., Kampel, M., Goyens, C., Meriaux, X., Schieber, B., et al. (2014). Ocean-color radiometry across the southern atlantic and southeastern pacific: Accuracy and remote sensing implications. Remote Sens. Environ. 149, 13–32. doi:10.1016/j.rse.2014.03.029
Rudorff, N., Rudorff, C. M., Kampel, M., and Ortiz, G. (2018). Remote sensing monitoring of the impact of a major mining wastewater disaster on the turbidity of the Doce River plume off the eastern Brazilian coast. ISPRS J. Photogrammetry Remote Sens. 145, 349–361. doi:10.1016/j.isprsjprs.2018.02.013
Russell, B. J., Dierssen, H. M., and Hochberg, E. J. (2019). Water column optical properties of Pacific coral reefs across geomorphic zones and in comparison to offshore waters. Remote Sens. 11, 1757. doi:10.3390/rs11151757
Schaeffer, B. A., Hagy, J. D., Conmy, R. N., Lehrter, J. C., and Stumpf, R. P. (2012). An approach to developing numeric water quality criteria for coastal waters using the SeaWiFS satellite data record. Environ. Sci. Technol. 46, 916–922. doi:10.1021/es2014105
Seegers, B. N., Stumpf, R. P., Schaeffer, B. A., Loftin, K. A., and Werdell, P. J. (2018). Performance metrics for the assessment of satellite data products: An ocean color case study. Opt. Express 26, 7404. doi:10.1364/oe.26.007404
Segal, B., and Castro, C. B. (2011). Coral community structure and sedimentation at different distances from the coast of the Abrolhos Bank, Brazil. Braz. J. Oceanogr. 59, 119–129. doi:10.1590/s1679-87592011000200001
Segal, B., Evangelista, H., Kampel, M., Gonçalves, A. C., Polito, P. S., and dos Santos, E. A. (2008). Potential impacts of polar fronts on sedimentation processes at Abrolhos coral reef (South-West Atlantic Ocean/Brazil). Cont. Shelf Res. 28, 533–544. doi:10.1016/j.csr.2007.11.003
Shoaf, W. T., and Lium, B. W. (1976). Improved extraction of chlorophyll a and b from algae using dimethyl sulfoxide. Limnol. Oceanogr. 21, 926–928. doi:10.4319/LO.1976.21.6.0926
Silveira, I. C. A., Schmidt, A. C. K., Campos, E. J. D., Godoi, Su. Su., and Ikeda, Y. (2000). A Corrente do Brasil ao Largo da Costa Leste Brasileira. Rev. Bras. Oceanogr. 48, 171–183. doi:10.1136/bmj.j356710.1590/s1413-77392000000200008
Simon, T., Pinheiro, H. T., Moura, R. L., Carvalho-Filho, A., Rocha, L. A., Martins, A. S., et al. (2016). Mesophotic fishes of the abrolhos shelf, the largest reef ecosystem in the south atlantic. J. Fish. Biol. 89, 990–1001. doi:10.1111/jfb.12967
Smyth, T. J., Moore, G. F., Hirata, T., and Aiken, J. (2006). Semianalytical model for the derivation of ocean color inherent optical properties: Description, implementation, and performance assessment. Appl. Opt. 45, 8116–8131. doi:10.1364/AO.46.00042910.1364/ao.45.008116
Sterckx, S., Knaeps, S., Kratzer, S., and Ruddick, K. (2015). SIMilarity environment correction (SIMEC) applied to MERIS data over inland and coastal waters. Remote Sens. Environ. 157, 96–110. doi:10.1016/j.rse.2014.06.017
Tassan, S., and Ferrari, G. M. (1995). An alternative approach to absorption measurements of aquatic particles retained on filters. Limnol. Oceanogr. 40, 1358–1368. doi:10.4319/lo.1995.40.8.1358
Teixeira, C. D., Chiroque-Solano, P. M., Ribeiro, F. V., Carlos-Júnior, L. A., Neves, L. M., Salomon, P. S., et al. (2021). Decadal (2006-2018) dynamics of Southwestern Atlantic's largest turbid zone reefs. PLoS One 16, e0247111–e0247119. doi:10.1371/journal.pone.0247111
Teixeira, C. D., Leitão, R. L. L., Ribeiro, F. V., Moraes, F. C., Neves, L. M., Bastos, A. C., et al. (2019). Sustained mass coral bleaching (2016-2017) in Brazilian turbid-zone reefs: Taxonomic, cross-shelf and habitat-related trends. Coral Reefs 38, 801–813. doi:10.1007/s00338-019-01789-6
Teixeira, C. E. P., Lessa, G. C., Cirano, M., and Lentini, C. A. D. (2013). The inner shelf circulation on the Abrolhos Bank, 18°S, Brazil. Cont. Shelf Res. 70, 13–26. doi:10.1016/j.csr.2013.09.003
Tripathi, N. K., and Rao, A. M. (2002). Bathymetric mapping in Kakinada Bay, India, using IRS-1D LISS-III data. Int. J. Remote Sens. 23, 1013–1025. doi:10.1080/01431160110075785
Toole, D. A., Siegel, D. A., Menzies, D. W., Neumann, M. J., and Smith, R. C. (2000). Remote-sensing reflectance determinations in the coastal ocean environment: impact of instrumental characteristics and environmental variability. Appl. Opt. 39, 456. doi:10.1364/ao.39.000456
Twardowski, M. S., Boss, E., Sullivan, J. M., and Donaghay, P. L. (2004). Modeling the spectral shape of absorption by chromophoric dissolved organic matter. Mar. Chem. 89, 69–88. doi:10.1016/j.marchem.2004.02.008
Twardowski, M. S., Claustre, H., Freeman, S. A., Stramski, D., and Huot, Y. (2007). Optical backscattering properties of the “clearest” natural waters. Biogeosciences Discuss. 4, 2441. doi:10.5194/bgd-4-2441-2007
Valerio, A. de M., Kampel, M., Vantrepotte, V., Ward, N. D., Sawakuchi, H. O., Less, D. F. D. S., et al. (2018). Using CDOM optical properties for estimating DOC concentrations and pCO2 in the Lower Amazon River. Opt. Express 26, A657. doi:10.1364/oe.26.00a657
Vanhellemont, Q. (2019). Adaptation of the dark spectrum fitting atmospheric correction for aquatic applications of the Landsat and Sentinel-2 archives. Remote Sens. Environ. 225, 175–192. doi:10.1016/j.rse.2019.03.010
Vanhellemont, Q., and Ruddick, K. (2018). Atmospheric correction of metre-scale optical satellite data for inland and coastal water applications. Remote Sens. Environ. 216, 586–597. doi:10.1016/j.rse.2018.07.015
Vanhellemont, Q., and Ruddick, K. (2014). Turbid wakes associated with offshore wind turbines observed with Landsat 8. Remote Sens. Environ. 145, 105–115. doi:10.1016/j.rse.2014.01.009
Villaça, R., and Pitombo, F. B. (1997). Benthic communities of shallow-water reefs of Abrolhos, Brazil. Rev. Bras. Oceanogr. 45, 35–43. doi:10.1590/S1413-77391997000100004
Wang, M., and Shi, W. (2007). The NIR-SWIR combined atmospheric correction approach for MODIS Ocean color data processing. Opt. Express 15, 15722–15733. doi:10.1364/oe.15.015722
Wegley Kelly, L. W., Nelson, C. E., Petras, D., Koester, I., Quinlan, Z. A., Arts, M. G. I., et al. (2022). Distinguishing the molecular diversity, nutrient content, and energetic potential of exometabolomes produced by macroalgae and reef-building corals. Proc. Natl. Acad. Sci. U.S.A. 119. doi:10.1073/PNAS.2110283119
Wei, J., Wang, M., Lee, Z., Briceño, H. O., Yu, X., Jiang, L., et al. (2020). Shallow water bathymetry with multi-spectral satellite ocean color sensors: Leveraging temporal variation in image data. Remote Sens. Environ. 250, 112035. doi:10.1016/j.rse.2020.112035
Welschmeyer, N. A. (1994). Fluorometric analysis of chlorophyll a in the presence of chlorophyll b and pheopigments. Limnol. Oceanogr. 39, 1985–1992. doi:10.4319/lo.1994.39.8.1985
Werdell, P. J., and Bailey, S. W. (2005). An improved in-situ bio-optical data set for ocean color algorithm development and satellite data product validation. Remote Sens. Environ. 98, 122–140. doi:10.1016/j.rse.2005.07.001
Werdell, P. J., Franz, B. A., Bailey, S. W., Feldman, G. C., Boss, E., and Brando, V. E. (2013). Generalized ocean color inversion model for retrieving marine inherent optical properties.pdf. Appl. Opt. 52, 2019–2037.
Zhang, X., and Hu, L. (2009). Scattering by pure seawater at high salinity. Opt. Express 17, 12685. doi:10.1364/oe.17.012685
Zhao, J., Barnes, B., Melo, N., English, D., Lapointe, B., Muller-Karger, F., et al. (2013). Assessment of satellite-derived diffuse attenuation coefficients and euphotic depths in south Florida coastal waters. Remote Sens. Environ. 131, 38–50. doi:10.1016/j.rse.2012.12.009
Zoffoli, L. M., Kampel, M., and Frouin, R. (2013). “Temporal characterization of the diffuse attenuation coefficient in abrolhos coral reef bank, Brazil,” in An. XVI simp. Bras. Sensoriamento remoto - SBSR, foz do iguaçu, PR, bras. 13 a 18 abril 2013, INPE (São José dos Campos, State of São Paulo, Brazil: INPE), 6917–6922.
Zoffoli, M. L. (2014). Analysis of the potential of in situ hyperspectral optical data and high spatial resolution satellite imagery to map bottom types in the Abrolhos coral reef bank ( Brazil ). Doctorate's thesis (São José dos Campos (SP): Instituto Nacional de Pesquisas Espaciais).
Keywords: bio-optical properties, coral reef waters, shallow water model, HOPE, hyperspectral data, PRISMA
Citation: Medeiros TAG, Zoffoli ML, Frouin R, Cortivo FD, Cesar GM and Kampel M (2022) Bio-optical properties of the Brazilian Abrolhos Bank’s shallow coral-reef waters. Front. Remote Sens. 3:986013. doi: 10.3389/frsen.2022.986013
Received: 04 July 2022; Accepted: 30 September 2022;
Published: 24 October 2022.
Edited by:
Igor Ogashawara, Leibniz-Institute of Freshwater Ecology and Inland Fisheries (IGB), GermanyReviewed by:
Luis A. Conti, University of São Paulo, BrazilSimon Bélanger, Université du Québec à Rimouski, Canada
Copyright © 2022 Medeiros, Zoffoli, Frouin, Cortivo, Cesar and Kampel. This is an open-access article distributed under the terms of the Creative Commons Attribution License (CC BY). The use, distribution or reproduction in other forums is permitted, provided the original author(s) and the copyright owner(s) are credited and that the original publication in this journal is cited, in accordance with accepted academic practice. No use, distribution or reproduction is permitted which does not comply with these terms.
*Correspondence: Thais Andrade Galvão Medeiros, dGhhaXMubWVkZWlyb3NAaW5wZS5icg==