 Guy J-P. Schumann
- 1RSS-Hydro, Research and Education Department, Kayl, Luxembourg
- 2School of Geographical Sciences, University of Bristol, Bristol, United Kingdom
Flooding is among the top-ranking disasters worldwide, evident through frequent and devastating events causing significant localized impacts and broader repercussions. Floods lead to substantial insured and uninsured losses, with a few hundred billions of $US in flood-related losses over the last 5 years, only a moderate amount of which were insured. Remote sensing, especially via satellite technology, has great potential for flood mapping and monitoring. Although many initiatives utilize satellites for flood response, few have resulted in operational protocols for mandated response organizations. Historic breakthroughs in satellite remote sensing have occurred since the 1970s, with six major milestones enhancing flood monitoring over the last half century. This article looks back at these technological development breakthroughs and the barriers to progress they lifted. Advancements in machine learning, cloud computing, and increased satellite missions promise more developments. Anticipated innovations include satellite constellations with various sensors and self-learning processing models to relay real-time insights for disaster response. Looking forward, a transformative shift in flood mapping from space may be expected as early as 2025, driven by enhanced orbital computing for predictive capabilities, improving disaster preparedness and response.
1 Introduction
The world is undoubtedly experiencing clear signals of a changing climate, causing much devastation almost everywhere. Floods are among the most frequent and most damaging hazards with very localized impacts but far-reaching consequences. On an annual basis, floods account for most of all insured and uninsured losses, and the spatial coverage of single events is reaching unprecedented scales, far beyond those measurable and manageable using traditional ground-based observing networks. According to Munich Re (2023), in the last 5 years alone, losses from flooding worldwide amounted to US$ 300bn, of which roughly only US$ 45bn were insured.
It has been argued in many research studies and literature review papers that remote sensing, particularly satellite remote sensing has a lot to offer when it comes to flood mapping and monitoring (Smith, 1997; Schumann and Moller, 2015; Schumann et al., 2018; Domeneghetti et al., 2019; Landuyt et al., 2019; Albertini et al., 2022). In fact, Schumann (2022) argued and illustrated in a review article that many activities, initiatives and programmes exist that use satellite capabilities either in a research or operational setting to assist flood disaster response at the global level. However, what is also clear is that, to date, hardly any of those efforts have produced a satellite flood map product that made it into an operational protocol of a mandated organization, such as the Federal Emergency Management Agency (FEMA) in the U.S. or any other national response or search and rescue authority. The main reason for this is that it is still extremely difficult to generate flood maps from satellite data at the required operational readiness level.
This said, there have clearly been a number of historic breakthroughs in satellite remote sensing of floods since the 1970s. In fact, it can be stated and clearly demonstrated that there have been six such groundbreaking milestones in the history of satellite remote sensing (Table 1), where a historic milestone is defined as an undeniable development breakthrough which helps to improve a situation or provide an answer to a problem that has been a barrier to significant progress.
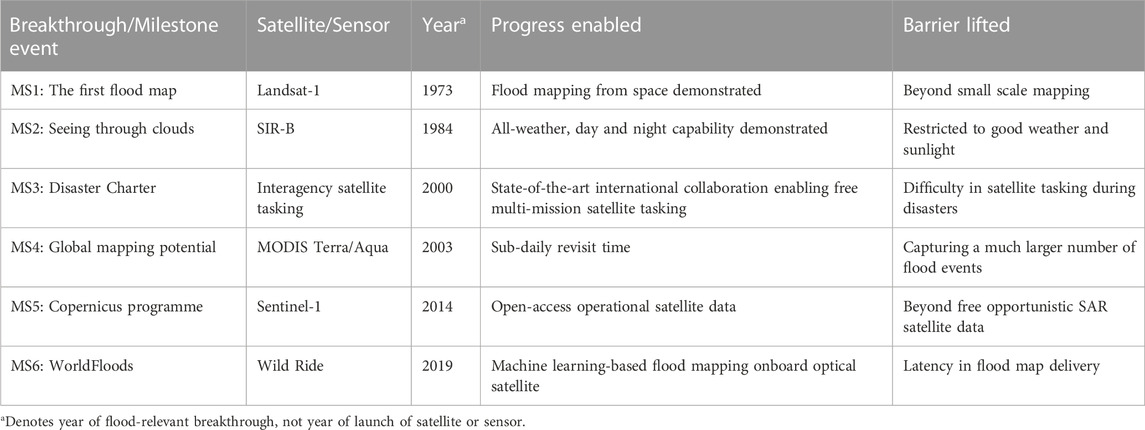
Table 1. Six historic milestones in satellite remote sensing of floods. For each development breakthrough, the progress enabled as well as the barrier lifted are highlighted.
Figure 1 shows a timeline of the six historic breakthroughs listed in Table 1 with a brief description of each event. The sections that follow describe each breakthrough as a development milestone. Each section describing a milestone also reflects on innovative applications enabled by the respective breakthrough. Then to conclude, the article looks at the future of Earth observation for flood mapping.
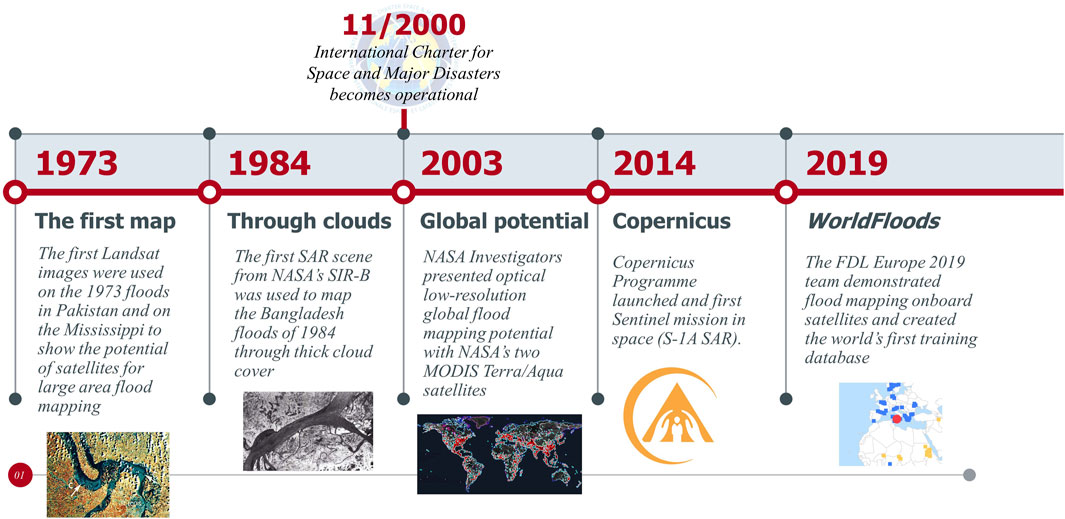
Figure 1. Timeline of the six historic breakthroughs in satellite remote sensing of floods. Each milestone (MS) includes a short description of the actual breakthrough at that point in time.
2 MS 1: The first historic milestone in satellite flood mapping
The Landsat series of satellites is undoubtedly one of the best known and longest Earth-observing satellite series still in operation today. The Landsat satellite series, spanning 50 years, has been instrumental in Earth observation since its inception in 1972. Developed by the National Aeronautics and Space Administration (NASA) and the United States Geological Survey (USGS), it has provided invaluable data on our planet’s changing landscape, climate, and ecosystems. Continuously capturing high-resolution images, it has helped monitor deforestation, urbanization, agricultural patterns, and natural disasters. Landsat’s consistent global coverage, achieved through multiple missions, enabled the creation of long-term data records critical for scientific research, resource management, and environmental policymaking. Its enduring legacy includes fostering a deeper understanding of Earth’s dynamic processes and aiding in the preservation and sustainable use of its natural resources. According to the most recent USGS report on the economic valuation of Landsat imagery (Straub et al., 2019), the immense value Landsat imagery provided to domestic and international users has been estimated to $3.45 billion (for 2017), albeit the recognized difficulty to quantify the exact cascading benefits to society.
The 50th-anniversary celebration was July 2022, with its first satellite launched on 23 July 1972. Since then, satellite observations have been successfully used for a variety of mapping and monitoring applications, with the greatest successes in the civil applications undoubtedly in the fields of land cover classification, Earth surface change monitoring, and in more recent years, disaster event mapping, with the Mississippi March and May 1973 floods (Figure 2) being one of the first events mapped from space (Deutsch and Ruggles, 1974). The imaging of this flood from space clearly showed the potential of satellites for large area flood mapping and paved the way for much more innovation yet to come.
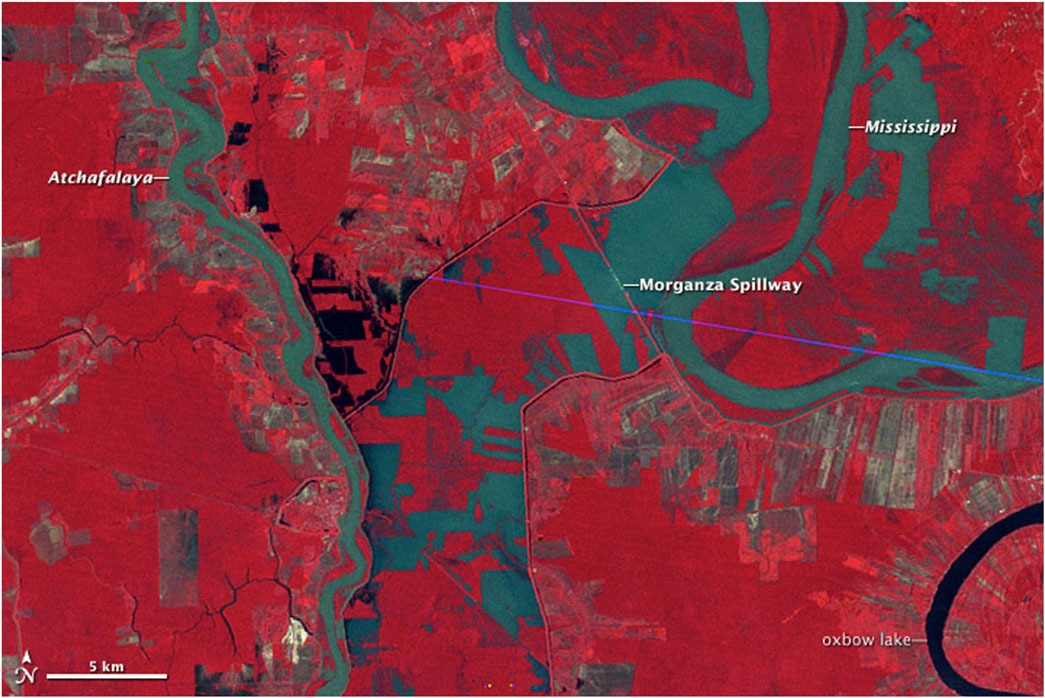
Figure 2. Morganza Floodway, 1973. The image shows water flowing through the floodway on 5 May 1973, as observed by Landsat 1. The image composite includes near-infrared, red, and green wavelengths of light. Vegetation appears red, muddy water is greenish brown, clear water is blue-black, and bare soil is gray to tan. Red areas within the floodway may include vegetation (red) tall enough to stand above the flood water. The floodway lies on the west side of the Mississippi, about 56 km north of Baton Rouge, Louisiana. Completed in 1954, the flood control structure, or spillway, was built to relieve stress on levees further downstream by diverting excess water from the river into the Atchafalaya River Basin. © NASA Earth Observatory.
Putting this historic mapping capability in perspective, according to the World Meteorological Organization (WMO), in the period from 1970 to 2012, so during the first 40 years of the Landsat series, storms and floods caused over one million deaths. After about 40 years of Landsat providing uninterrupted high quality satellite image data across the entire Earth land surface, Google launched its open-access Earth Engine (EE) platform to scientists and NGOs in 2010. Earth Engine (https://earthengine.google.com) is a planetary-scale platform for Earth Science data and analysis that hosts petabytes of satellite data, allows anyone to develop and run algorithms for free through an easy-to-use API and visualize as well as share the results directly with other users or stakeholders (Gorelick et al., 2017). It is only with big data cubes and open data analysis platforms, such as EE, that utilizing the full potential of all Landsat image data, rather than just a fraction of it, has become possible. This technological innovation has enabled scientific studies of global significance, including as notable examples the global forest cover analysis led by Hansen et al. (2013), the global surface water mapping project by Pekel et al. (2016) or the global flood risk study led by Tellman et al. (2021).
3 MS2: The advent of synthetic aperture radar
Over a decade later, an all-weather capable synthetic aperture radar (SAR) onboard NASA’s Shuttle Challenger mapped the floods in Bangladesh in 1984 during a cyclone (Imhoff et al., 1987; Figure 3). Despite some technical problems with the mission, the immense advantages of this type of sensor to observe the Earth and its diverse processes during day and night as well as in all weather conditions were without a doubt demonstrated. In fact, The SAR image data were used for delineating flood boundaries, mapping land use, and determining flood damage. The experiment was designed to demonstrate the rapid assessment survey potential of spaceborne SAR by providing an immediate source of flood and flood-damage survey data.
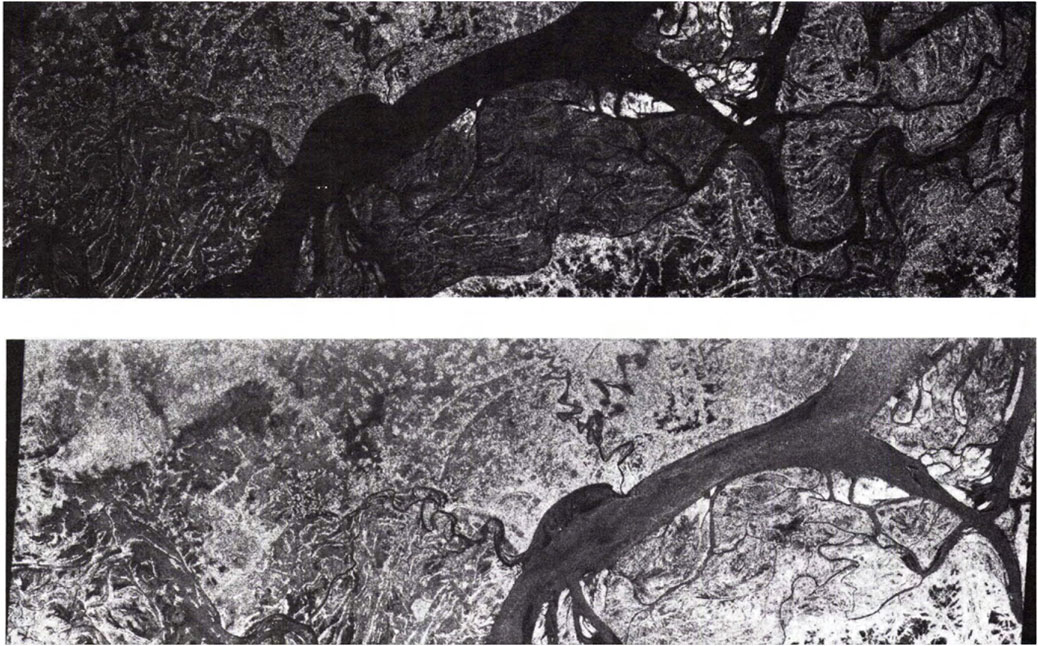
Figure 3. The area selected for analysis is located on the Ganges River centered on the town of Chandpur in the Comilla District of Bangladesh and includes the eastern part of the Barisal District at the confluence of the Meghna and Padma rivers (Padma is the Bengladeshi name for the Ganges south of the Ganges/Brahamputra convergence). The area consists entirely of river and densly populated river flood plain under heavy rice cultivation. (modified from Imhoff et al., 1987).
Generally speaking, a SAR sensor acquires radar signals by emitting microwave pulses towards the Earth’s surface and recording the backscattered signals that return to the satellite. SAR backscatter plays a vital role in flood mapping due to its ability to penetrate cloud cover and acquire data regardless of weather conditions. Typically, smooth open water surfaces, i.e., calm large inundated areas, are depicted as very dark regions in a single SAR grayscale image.
With high-resolution SAR imagery becoming more readily available with the launches of the TerraSAR-X mission in 2007 and the first generation of COSMO-SkyMed satellites between 2007 and 2010, flood mapping and associated algorithm development saw a big rise, and SAR for flood mapping quickly became the favorite. Obviously, the high spatial resolution, the ability to see through clouds and independent of daylight makes SAR technology extremely appealing for mapping and monitoring floods, as the events happen during adverse weather conditions and can be very localized in nature.
During the last 5 years, the new space economy, i.e., the private space industry, has been growing at an unprecedented pace. Although commercial optical satellites have been launched and operated for over two decades, it was only in 2018 that commercial SAR missions were put in orbit, with Iceye and, shortly after, Capella Space launching their first very high-resolution SAR satellite that year. With constellations of commercial small SAR satellites now in orbit, offering sub meter spatial resolution at sub-daily revisits, the opportunities for new applications are increasing and high-value commercial partnerships are formed in growing numbers between commercial satellite operators and the financial risk industry, including small and medium-sized enterprises as well as large corporates. Global high-resolution near real-time flood monitoring is one of many new bespoke solutions being developed in such partnerships. In the context of floods, the general aim is to advance flood risk management, assist disaster response or expedite insurance claims payments globally (Swiss Re, 2021).
Although SAR has undoubtedly key advantages over optical sensors when it comes to monitor floods, the relatively recent availability of an operational SAR missions with the launch of Sentinel-1 in 2014 (see MS5 for details) make it difficult to develop long-term flood records, let alone essential climate variables (ECV) from SAR. However, routinely and operationally available satellite images spanning a long time period are vital for studies of global importance (e.g., Mueller et al., 2015; Pekel et al., 2016; Tellman et al., 2021). Such long big data records are at present only provided by optical sensors onboard legacy missions such as Landsat or the Moderate Resolution Imaging Spectrometer (MODIS) onboard NASA’s Terra and Aqua satellites (see also MS3 for more details on global flood mapping).
4 MS3: The potential of satellites to monitor floods at the global level
It took another 15 years for NASA researchers to demonstrate global flood monitoring and mapping capabilities with MODIS onboard the Terra and Aqua satellites. Albeit hampered by frequent cloud cover, this has provided, to date, a quasi-operational daily mapping capability of impactful flood events at the global level. This global near real-time flood product is generated using NASA’s Land, Atmosphere Near real-time Capability for EOS (LANCE). The product provides a daily, nearly global view with a resolution of approximately 250 m, revealing detected floods and surface water. It utilizes data from the MODIS optical sensors on both the Terra and Aqua satellites, which pass over twice a day. While identifying water at this scale is generally uncomplicated using MODIS’s red and near-infrared bands, issues like clouds and terrain shadows can sometimes lead to incorrect identifications. To mitigate these inaccuracies, multiple observations are combined, typically requiring more than one water detection to confirm the presence of water in a pixel.
Among many organizations all around the world, the widely known DFO Flood Observatory at the University of Colorado Boulder uses the LANCE data feed to include the global near real-time flood map products from MODIS in their global atlas of space-based measurement, mapping, and modeling of surface water (Figure 4). The DFO Flood Observatory maintains this global atlas particularly for research, humanitarian, and water resources applications.
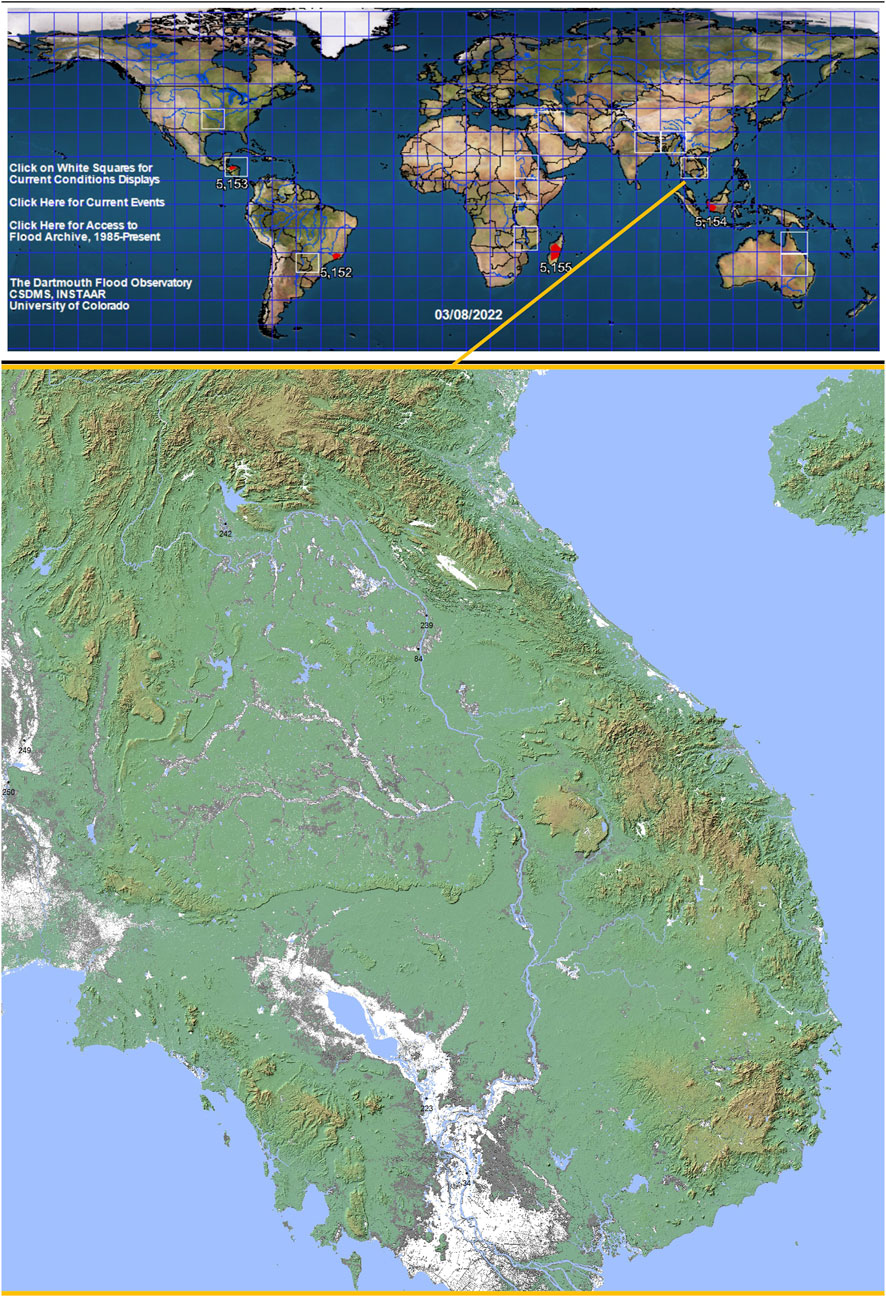
Figure 4. DFO Glob Observatory flood hazard map of the Mekong River basin (world tile 100E020N). The map shows in blue permanent surface water and in very light gray an estimate of mean annual flood using MODIS and Landsat time series data. The maximum observed flooding during the period 1993 to present is shown in gray (source: https://floodobservatory.colorado.edu/).
However, the satellites carrying MODIS are nearing their end of life. The inevitable end of satellite missions creates a challenge for not only the NASA research and applications communities that have relied on the continuous availability of mission data for process studies, application development, and the detection of long-term trends, but for any organization in charge of satellite missions. Fortunately. in this particular case, the Visible Infrared Imaging Radiometer Suite (VIIRS) instrument aboard the joint NASA/NOAA Suomi National Polar-orbiting Partnership (Suomi NPP) and NOAA-20 satellites is also delivering images in near real-time, thus providing continuity from the MODIS sensor.
The satellite-derived flood extent product named VIIRS Flood Detection Map is created using Suomi-NPP/VIIRS imagery taken during the day. The map shows floodwater fractions in 375 m resolution pixels. The process involves a water detection decision-tree algorithm, cloud and terrain shadow removal algorithms, and a water fraction retrieval method. Flood extent is compared against a reference map from MODIS and National Land Cover Dataset. The VIIRS flood system produces near real-time flood maps at the global level with a 1-h delay.
It is worth noting that mapping floods twice daily and at global coverage has also been achieved with passive microwave signals from satellite instruments such as the Advanced Microwave Scanning Radiometer for EOS (AMSR-E) and several others. Despite the lower spatial resolution of passive microwave sensors, the signal can penetrate cloud cover and is very sensitive to changes in surface water much smaller than the ground resolution. The DFO Flood Observatory makes use of this technology and, for over two decades now, tracks water availability changes in watersheds, reservoirs and rivers, indicative of floods and droughts.
5 MS4: The disaster charter: a true milestone in inter-agency collaboration
Fortunately, MS3 was not the only significant milestone that took place in the early 2000s in the context of global flood disaster mapping from space. In 1999, the European Space Agency (ESA) and the Centre National d’Etudes Spatiales (CNES, the French space agency) initiated the International Charter for Space and Major Disasters, which became operational in November 2000, and now counts many satellite-operating agencies worldwide among its members. The Charter takes advantage of the many satellites and delivers many types of images during an event to support disaster management. The strength of the Charter lies in its ability to mobilize agencies globally and benefit from their satellites through a single access point that operates at no cost to the user. Until quite recently, members of the Charter providing satellite images were exclusively national or intergovernmental agencies, but in 2016 Planet Labs adhered to the Charter in an unofficial capacity and since 2018 has been a formal provider (Zolli, 2018). Planet’s capability to provide high-resolution images of any location every day represents undoubtedly a great addition to the Charter.
On 11 February 2023, the Charter registered its 800th activation across all disaster types. Extensive flooding in Eswatini (formerly named Swaziland) in southern Africa triggered this Charter activation. More than half of the 800 activations for all types of disasters since November 2000 have been for floods alone (428). When examining all flood activations, it is obvious that some individual years in the past two decades have been particularly flood-rich (experiencing a significantly higher than normal number of flood events over a given time period), such as 2010 for instance, but no clear trend can be observed. This said, the past 2 years have seen an excessively high number of flood activations (>30 per year) and 2023 is already registering as many as 18 at end of July.
Even though it may be near to impossible to state how many lives and dollars have been saved by making timely flood maps readily available thanks to the Charter, it is fair to assume that with over 400 activations for floods, the Charter contributed to countless lives and livelihoods being saved.
6 MS5: The Copernicus Programme
About 15 years on since the milestone of the International Charter, it certainly was the launch of the European Commission’s Copernicus Programme and the ESA’s Sentinel missions that marked another historic milestone for Earth Observation. Its Emergency Management Service (EMS) provides several operational services during disasters, including flood mapping from satellite images, in particular from the Sentinel-1 SAR mission.
ESA’s growing Sentinel missions, alongside the constant increase in EO data from many other space agencies around the world in recent years, have led to a proliferation of free satellite data. In the current era of the new space economy, many companies building and operating commercial constellations of small satellites, in both the optical and radar spectra, are adding a massive volume of geospatial images to this data-rich EO landscape literally every hour. This big EO data world is enabling much faster and notable progress, particularly when combining online computing platforms with the recent advances made in machine learning (ML).
Probably one of the most significant innovation developments with the aim to unlock the full potential of artificial intelligence when facing massive amounts of open-access EO data has been achieved this year with the release of the largest geospatial AI foundation model on the Hugging Face open source AI platform (https://huggingface.co) through a. NASA and IBM partnership. Foundation models can identify underlying patterns without explicit instructions. By pre-training such a model, it can be adapted to new tasks with limited labeled examples. Traditional limitations in using machine learning for remote sensing data due to insufficient training examples (see also MS6) could be mitigated with transformer-based models. With NASA’s 70 petabytes of earth science data, expected to reach 600 petabytes by 2030, these foundation models could greatly enhance data utility. The collaboration aims to create two models: one for organizing earth science literature and another for processing land-use change data captured by satellites. The second model will be trained on USGS and NASA’s popular dataset, Harmonized Landsat Sentinel-2 (HLS), a record of land-use changes captured by Earth-orbiting satellites (IBM, 2023). Expected downstream applications include detecting natural hazards, such as floods, and inferring impact and exposure of associated risks as well as tracking changes to ecosystem services for more sustainable resource management.
7 MS6: Machine learning onboard satellites and the age of artificial intelligence
In recent years, the scientific community has shown how remotely sensed variables have the potential to provide flood mapping and monitoring applications for assisting humanitarian disaster response. Although the number of state-of-the-art and innovative research studies in those areas is increasing, the full potential of remotely sensed data to enhance flood mapping has yet to be unlocked, especially the latency issue is not being sufficiently well addressed. Latency, i.e., the time between image acquisition to the flood map delivery to the person that actually needs it, is not at all in line with disaster response requirements, whether humanitarian, emergencies or insurances needs, and is, to a large extent, responsible for the slow uptake of EO-based products, such as flood maps, into an operational timeline or disaster response protocols of various potential user organizations, such as those active in emergency management.
With the objective to overcome this latency bottleneck, one of the most remarkable technological breakthroughs in the field of satellite-based flood mapping was achieved in 2019 when a team of young researchers in an ESA-sponsored ML challenge run by Frontier Development Lab (FDL) demonstrated the possibility of an onboard ML-based flood mapping algorithm, which was successfully tested in orbit within a record amount of time of just under a year later on the experimental mission “Wild Ride” launched by D-Orbit (Unibap, 2021).
The Wild Ride mission in 2021 has clearly demonstrated that GPU processing of ML algorithms onboard a satellite is feasible and clearly has the potential to lift the latency barrier for flood maps during disaster relief and search and rescue operations.
ML clearly has the potential to revolutionize flood mapping from space and provide, at present, valuable information that is at least as accurate as traditional band ratio indices but much timelier and with much less computing power. Labels for training represent however a non-trivial bottleneck especially when dealing with extreme, infrequent events such as floods. Obtaining or creating accurate flood extent or area labels from satellite imagery is very challenging because, in the context of training a ML model, floods are still relatively rare and are not always observable by a satellite. Furthermore, floods are highly varying in nature depending on the underlying hydrological processes, regional to local topographic variations and changes in land use. This makes labeling as well as the geographic transferability of a ML model for floods difficult but not impossible (Figure 5). As argued by Gaffinet et al. (2023), efforts to create a benchmark dataset for floods from different climates, topographies and land uses, would be highly impactful to both the EO and ML communities. In this sense, Mateo-Garcia et al. (2021) collated an open-access global dataset called WorldFloods for training ML models for flood segmentation in optical satellite images. WorldFloods (https://spaceml-org.github.io/ml4floods/content/worldfloods_dataset.html) consists of vetted and validated flood area labels based on as many as 119 events from a number of trusted sources, such as Copernicus Emergency Management Services (EMS) and UNOSAT. In a similar effort but for SAR image segmentation, Bonafilia et al. (2020) published an open-access database called Sen1Floods11, which is a georeferenced dataset to train and test deep learning flood algorithms for Sentinel-1 SAR images. Sen1Floods11 (https://github.com/cloudtostreet/Sen1Floods11) is based on 11 flood events identified from the DFO Flood Observatory (see MS3 for details). For direct validation, event selection required that the flood event had coverage from Sentinel-1, as well as coincident Sentinel-2 imagery on the same day or within 2 days of the Sentinel-1 image.
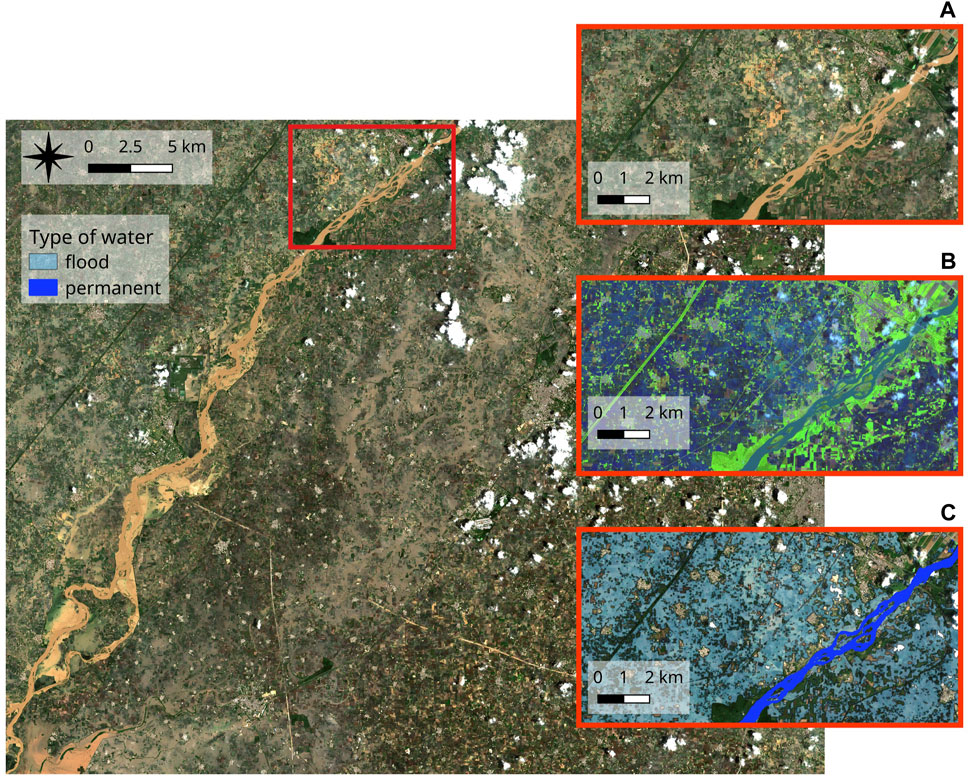
Figure 5. A Sentinel-2 image capturing the flood of the Beas River NW of New Delhi on 11 July 2023. Note the difficulty in clearly identifying the patchy floodplain inundation inside the red box zoomed in and depicted as (A) a true color composite, (B) a false color composite showing the flooding in shades of blue, and (C) the extracted labels expertly mapped using a manually corrected NDWI threshold.
Clearly WorldFloods and Sen1Floods11 are notable efforts but these or other ML training databases need to be populated with many more flood area labels from different types of events across diverse geographies in order to ensure robust transferability of ML models that can map any flood in any location with consistent levels of accuracy.
8 The future of satellite Earth Observation for flood mapping
Despite some major breakthroughs in flood mapping from satellites, to date uptake of satellite flood maps into emergency or humanitarian response protocols is still rather slow or not happening at all. A lot of it has to do with the fact that the typical latency of delivery of actionable information from satellites is not in phase with the operational real-time requirements to respond to floods and save lives in search and rescue operations. Furthermore, useable satellite data are still not always available for an event when responders in the field need it to be, in terms of either coverage (e.g., Munasinghe et al., 2023) or real-time accessibility. Continuing challenges in mapping floods in urban areas (e.g., Chini et al., 2019; Li et al., 2019), where most people and assets at risk are located, are also responsible for the slow uptake by emergency response organizations.
This said, pushing innovation leads to technological advances that enable breakthroughs like the ones described in this article. For flooding and EO, an exciting future lies ahead, with many new groundbreaking developments still to come, enabled by advances in machine learning coupled with ever-growing online cloud computing power and many more satellite missions delivering enormous amounts of insightful EO images.
In an online published special report, Schumann (2022) argues that in the immediate upcoming years, we could witness the deployment of satellite constellations equipped with diverse sensor types. These satellites might feature self-learning, evolutionary processing models, which would analyze captured image data and promptly convey valuable insights to the relevant individuals or teams on the ground. This communication could be facilitated within minutes using geostationary or Earth-orbiting satellites as data relay systems. Additionally, these “intelligent” satellite constellations could engage in information exchange, collaborating to enhance task allocation for upcoming image captures, particularly in regions affected by flooding or other types of disasters.
Looking back at the historic technology breakthroughs in satellite remote sensing of floods and looking at the new technologies and application opportunities that lie ahead, it is fair to conclude that we should be expecting a step change in flood mapping from space by 2025, most likely a breakthrough in orbital computing optimized toward self-learning and predictive capabilities onboard spaceborne platforms. Consequentially, such a technological step change would enable much better disaster preparedness, more efficient resource allocation and much faster response times.
Author contributions
GJ-PS: Conceptualization, Investigation, Resources, Visualization, Writing–original draft, Writing–review and editing.
Funding
The author(s) declare financial support was received for the research, authorship, and/or publication of this article. The author declares no direct funding source.
Acknowledgments
The opinions and ideas published herein are the author’s own reflections from over 20 years of working with satellite data for flood mapping. It is the result of collaborating on many research projects with friends and colleagues to whom I am extremely grateful for the many inspiring discussions around this topic. Special thanks go to Lou Léonard for producing Figure 5.
Conflict of interest
The author declares that the research was conducted in the absence of any commercial or financial relationships that could be construed as a potential conflict of interest.
The author(s) declared that they were an editorial board member of Frontiers, at the time of submission.
Publisher’s note
All claims expressed in this article are solely those of the authors and do not necessarily represent those of their affiliated organizations, or those of the publisher, the editors and the reviewers. Any product that may be evaluated in this article, or claim that may be made by its manufacturer, is not guaranteed or endorsed by the publisher.
References
Albertini, C., Gioia, A., Iacobellis, V., and Manfreda, S. (2022). Detection of surface water and floods with multispectral satellites. Remote Sens. 14 (23), 6005. doi:10.3390/rs14236005
Bonafilia, D., Tellman, B., Anderson, T., and Issenberg, E. (2020). “Sen1Floods11: a georeferenced dataset to train and test deep learning flood algorithms for Sentinel-1,” in 2020 IEEE/CVF Conference on Computer Vision and Pattern Recognition Workshops (CVPRW), Seattle, WA, USA, 835–845. doi:10.1109/CVPRW50498.2020.00113
Brakenridge, G. R., Anderson, E., Nghiem, S. V., Caquard, S., and Shabaneh, T. B. (2003). “Flood warnings, flood disaster assessments, and flood hazard reduction: the roles of orbital remote sensing,” in Proceedings of the 30th International Symposium on Remote Sensing of Environment, Honolulu, Hawaii, USA, November 10-14, 2003.
Chini, M., Pelich, R., Pulvirenti, L., Pierdicca, N., Renaud, H., and Matgen, P. (2019). Sentinel-1 InSAR coherence to detect floodwater in urban areas: Houston and hurricane harvey as A test case. Remote Sens. 11 (2), 107. doi:10.3390/rs11020107
Cimino, J., Elachi, C., and Settle, M. (1986). SIR-B-The second Shuttle imaging radar experiment. IEEE Trans. Geoscience Remote Sens. 24 (4), 445–452. doi:10.1109/TGRS.1986.289658
Deutsch, M., and Ruggles, F. (1974). Optical data processing and projected applications of the ERTS-1 imagery covering the 1973 Mississippi river valley floods. JAWRA J. Am. Water Resour. Assoc. 10, 1023–1039. doi:10.1111/j.1752-1688.1974.tb00622.x
Domeneghetti, A., Schumann, G. J.-P., and Tarpanelli, A. (2019). Preface: remote sensing for flood mapping and monitoring of flood dynamics. Remote Sens. 11 (8), 943. doi:10.3390/rs11080943
Gaffinet, B., Hagensieker, R., Loi, L., and Schumann, G. (2023). “Supervised machine learning for flood extent detection with optical satellite data,” in IEEE Proceedings of the International Geoscience and Remote Sensing Symposium, Pasadena, CA, USA, 16–21.
Gorelick, N., Hancher, M., Dixon, M., Ilyushchenko, S., Thau, D., and Moore, R. (2017). Google earth engine: planetary-scale geospatial analysis for everyone. Remote Sens. Environ. 202, 18–27. doi:10.1016/j.rse.2017.06.031
Hansen, M. C., Potapov, P. V., Moore, R., Hancher, M., Turubanova, S. A., Tyukavina, A., et al. (2013). High-resolution global maps of 21st-century forest cover change. Science 342, 850–853. doi:10.1126/science.1244693
IBM (2023). IBM and NASA team up to spur new discoveries about our planet. Available at: https://research.ibm.com/blog/ibm-nasa-foundation-models (Accessed August 14, 2023).
Imhoff, M. L., Vermillion, C., Story, M. H., Choudhury, A. M., Gafoor, A., and Polcyn, F. (1987). Monsoon flood boundary delineation and damage assessment using space borne imaging radar and Landsat data. Photogrammetric Eng. Remote Sens. 53 (4), 405–413.
Landuyt, L., Van Wesemael, A., Schumann, G. J.-P., Hostache, R., Verhoest, N. E. C., and Van Coillie, F. M. B. (2019). Flood mapping based on synthetic aperture radar: an assessment of established approaches. IEEE Trans. Geoscience Remote Sens. 57 (2), 722–739. doi:10.1109/TGRS.2018.2860054
Li, Y., Martinis, S., Wieland, M., Schlaffer, S., and Natsuaki, R. (2019). Urban flood mapping using SAR intensity and interferometric coherence via bayesian network fusion. Remote Sens. 11, 2231. doi:10.3390/rs11192231
Mateo-Garcia, G., Veitch-Michaelis, J., Smith, L., Oprea, S. V., Schumann, G., Gal, Y., et al. (2021). Towards global flood mapping onboard low cost satellites with machine learning. Sci. Rep. 11, 7249. doi:10.1038/s41598-021-86650-z
Mueller, N., Lewis, A., Roberts, D., Ring, S., Melrose, R., Sixsmith, J., et al. (2015). Water observations from space: mapping surface water from 25 Years of Landsat imagery across Australia. Remote Sens. Environ. 174, 341–352. doi:10.1016/j.rse.2015.11.003
Munasinghe, D., Frasson, R. P., Bonnema, M., Schumann, G., and Brakenridge, G. R. (2023). Global datasets to evaluate a multi-sensor approach for observation of floods. Zenodo. doi:10.5281/zenodo.8164503
Munich Re (2023). Flood risks on the rise. Available at: https://www.munichre.com/en/risks/natural-disasters/floods.html (Accessed November 11, 2023).
Pekel, J. F., Cottam, A., Gorelick, N., and Belward, A. S. (2016). High-resolution mapping of global surface water and its long-term changes. Nature 540, 418–422. doi:10.1038/nature20584
Schumann, G. (2022). A look at historic breakthroughs in flood mapping from space. Congleton, Cheshire, England: Innovation News Network, Special Reports. Available at: https://www.innovationnewsnetwork.com/historic-breakthroughs-in-flood-mapping-from-space/24369/ (Accessed August 20, 2023).
Schumann, G. J. P. (2023). Oxford research encyclopedia of natural hazard science. Available at: https://oxfordre.com/naturalhazardscience/view/10.1093/acrefore/9780199389407.001.0001/acrefore-9780199389407-e−265 (Accessed August 5, 2023).Remote sensing of floods
Schumann, G. J.-P., Brakenridge, G. R., Kettner, A. J., Kashif, R., and Niebuhr, E. (2018). Assisting flood disaster response with earth observation data and products: a critical assessment. Remote Sens. 10 (8), 1230. doi:10.3390/rs10081230
Schumann, G. J.-P., and Moller, D. K. (2015). Microwave remote sensing of flood inundation. Phys. Chem. Earth 83-84, 84–95. 83–84. doi:10.1016/j.pce.2015.05.002
Smith, L. C. (1997). Satellite remote sensing of river inundation area, stage, and discharge: a review. Hydrol. Process. 11, 1427–1439. doi:10.1002/(SICI)1099-1085(199708)11:10<1427::AID-HYP473>3.0.CO;2-S
Song, X. P., Hansen, M. C., Stehman, S. V., Potapov, P. V., Tyukavina, A., Vermote, E. F., et al. (2018). Global land change from 1982 to 2016. Nature 560, 639–643. doi:10.1038/s41586-018-0411-9
Straub, C. L., Koontz, S. R., and Loomis, J. B. (2019). Economic valuation of Landsat imagery. U.S. Geol. Surv. Open-File Rep. 2019– 1112, 13. doi:10.3133/ofr20191112
Swiss Re (2021). Swiss Re announces strategic partnership with radar satellite-based flood monitoring provider ICEYE. Available at : https://www.swissre.com/media/press-release/nr-20210302-swiss-re-strategic-partnership-with-flood-monitoring-provider-iceye.html (Accessed August 18, 2023).
Tellman, B., Sullivan, J. A., Kuhn, C., Kettner, A. J., Doyle, C. S., Brakenridge, G. R., et al. (2021). Satellite imaging reveals increased proportion of population exposed to floods. Nature 596, 80–86. doi:10.1038/s41586-021-03695-w
Unibap (2021). Wild Ride mission. Available at: https://unibap.com/en/our-offer/space/projects/wild-ride-mission/(Accessed August 16, 2023).
Zolli, A. (2018). Planet becomes first private-sector data provider to directly support the international charter on space and major disasters. Available at: https://www.planet.com/pulse/planet-international-charter-space-and-major-disasters/(Accessed November 11, 2023).
Keywords: floods, optical, SAR, Landsat, MODIS, disaster charter, copernicus, machine learning
Citation: J-P. Schumann G (2024) Breakthroughs in satellite remote sensing of floods. Front. Remote Sens. 4:1280654. doi: 10.3389/frsen.2023.1280654
Received: 21 August 2023; Accepted: 21 November 2023;
Published: 29 April 2024.
Edited by:
Ailong Ma, Wuhan University, ChinaReviewed by:
C. M. Bhatt, Indian Institute of Remote Sensing, IndiaMark Trigg, University of Leeds, United Kingdom
Copyright © 2024 J-P. Schumann. This is an open-access article distributed under the terms of the Creative Commons Attribution License (CC BY). The use, distribution or reproduction in other forums is permitted, provided the original author(s) and the copyright owner(s) are credited and that the original publication in this journal is cited, in accordance with accepted academic practice. No use, distribution or reproduction is permitted which does not comply with these terms.
*Correspondence: Guy J-P. Schumann, Z2pwc2NodW1hbm5AZ21haWwuY29t