 Lucas P. Gaspar1*
 Marina D. A. Scarpelli2
 Eliziane G. Oliveira3
 Rafael Souza-Cruz Alves1
 Arthur Monteiro Gomes1Rafaela Wolf1
 Rafaela Vitti Ferneda1Silvia Harumi Kamazuka1
 Carlos O. A. Gussoni1Milton Cezar Ribeiro1,4
- 1Spatial Ecology and Conservation Lab (LEEC), Department of Biodiversity, São Paulo State University (Unesp), Institute of Biosciences, Rio Claro, Brazil
- 2Ecoacoustics Research Group—Queensland University of Technology, Brisbane, QLD, Australia
- 3Bioacoustic Laboratory (LaB), Department of Physiology and Behavior, Federal University of Rio Grande do Norte, Natal, Brazil
- 4Environmental Studies Center (CEA), São Paulo State University—UNESP, SãoPaulo, Brazil
The increasing conversion of natural areas for anthropic land use has been a major cause of habitat loss, destabilizing ecosystems and leading to a biodiversity crisis. Passive acoustic sensors open the possibility of remotely sensing fauna on large spatial and temporal scales, improving our understanding of the current state of biodiversity and the effects of human influences. Acoustic indices have been widely used and tested in recent years, with an aim towards understanding the relationship between indices and the acoustic activity of several taxa in different types of environments. However, studies have shown divergent relationships between acoustic indices and the vocal activity of most soniferous taxa. A combination of indices has, in turn, been reported as a promising tool for representing biodiversity in different contexts. We used uni- and bivariate models to test different combinations of 8 common indices in relation to bird assemblage metrics. We recorded twenty-two study sites in Brazil’s Atlantic Forest and three different types of environments in each site (forest, pasture, and swamp). Our results showed that 1) the best acoustic indices for explaining bird richness, abundance, and diversity were Bioacoustic and Acoustic Complexity; 2) the type of environment (forest, pasture, and swamp) influenced the performance of acoustic indices in explaining bird biodiversity, with the highest score model (biggest R2 value) being a combination between Acoustic Diversity and Bioacoustic indices. Our results do support the use of acoustic indices in monitoring the acoustic activity of birds, but combining indices is encouraged since it provided the best results. However, given the divergence we found across environments, we recommend that sets of indices are tested to determine which of them best describe the biodiversity pattern models for a specific habitat. Based on our results, we propose that biodiversity patterns can be predicted through acoustic patterns. However, the level of confidence will depend on the acoustic index used and on focal taxa of interest (i.e., birds, amphibians, insects, and mammals).
Introduction
The accelerated conversion of natural areas for anthropic land use is causing local and regional wildlife declines and species extinction (Fahrig, 1997). These changes affect biodiversity and related ecosystem services (Butchart et al., 2010; Johnson et al., 2017) and have severe impacts on important ecological functions that maintain the integrity of ecosystems, such as seed dispersal and pollination (Duarte et al., 2018). To understand how humans affect biodiversity, ecosystem functions, and services, we must expand biological monitoring both in time and space, using wider taxonomic coverage and more cost-efficient methods (Schmeller et al., 2017). Remote sensing techniques, including environmental recordings, have been widely used to increase temporal and spatial sampling coverage while decreasing sampling costs (Sueur et al., 2008; Wrege et al., 2017).
Acoustic data is usually collected through Passive Acoustic Monitoring (PAM) and autonomous recording units (ARU) (Shonfield and Bayne, 2017). ARUs can be used in both terrestrial and marine environments and might record data from a wide spatial range. The units may be set to record continuously and unattended for long periods of time and can capture signals from all directions with a radius of more than 100 m (Stowell and Sueur, 2020). These devices not only capture biophony (sounds produced by animals), but they also capture all soniferous components of a soundscape, like geophony (abiotic components of a landscape) and anthrophony (sounds produced by human activities and machines) (Pijanowski et al., 2011). On the downside, acoustic recordings generate a large amount of data, and therefore computational tools and algorithms are necessary to analyze this data (Ulloa et al., 2018).
Acoustic Indices (AI) allow us to analyze soundscapes and build a summary of biological patterns for each monitored region. Different indices have different mathematical properties that are linked to varied soundscape components (Sueur et al., 2014a). They consist of mathematical functions that are calculated using several spectral and temporal parameters of the recordings (Towsey et al., 2014; Eldridge et al., 2018), and aim to evaluate certain aspects of acoustic biodiversity (Gaspac, 2021). Since the development of AI, their effectiveness for predicting biodiversity activity patterns from environmental recordings has been tested (Sugai et al., 2019; Alcocer et al., 2022) in areas with different vegetation structures (Buxton et al., 2018), climate (Eldridge et al., 2018), and species composition (Depraetere et al., 2012). More recently, they have also been used to evaluate ecological conditions (Izaguirre Retamosa et al., 2021; Alcocer et al., 2022), but its explanatory power varies across studies.
The variability of AI across studies can be explained by acoustic signatures that are habitat specific. Soundscape signatures are composed of biological components specific to the region, the seasonality influence on geophony and the presence of anthropic activities in the vicinity (Farina et al., 2011). Different types of environments can also influence the performance of acoustic indices in measuring biodiversity. The bird community differs according to the types of environments, with species exclusive to certain types of habitats, while others, more generalist, occur in different types of environments (Carrara et al., 2015). Because of the variability in AI and the difficulty in relating patterns to biodiversity, there are still limitations and concerns regarding the broad use of acoustic indices as a biodiversity proxy (Mammides et al., 2017). In this way, an appropriate and more consistent AI for measuring biodiversity needs to be better explored so that the biodiversity focus does not suffer from the influence of non-biological acoustic characteristics on their environments.
In terrestrial environments, AI are being used in several contexts, such as: rapid assessment of biodiversity (e.g., Sueur et al., 2008), describing habitat type and spatial heterogeneity (e.g., Bormpoudakis et al., 2013), characterizing soundscapes (e.g., Towsey et al., 2014), quantifying anthrophony (e.g., Buxton et al., 2017), assessing environmental impact (Ribeiro et al., 2017), monitoring protected areas (e.g., Campos et al., 2021), characterizing landscapes (e.g., Oliveira et al., 2021), assessing the composition of vocally active species and behavior (Farina et al., 2011), and assessing the quality and integrity of habitats (Gómez et al., 2018). It is generally expected that better preserved environments will maintain higher levels of biophony and that those signals will be spread across different frequency bands (Krause, 1987; Farina et al., 2011; Araújo et al., 2020). Knowing that the AI summarizes characteristics of audio data, the divergent results of previous studies could also be related to differences in recording methods and data treatment (Bradfer-Lawrence et al., 2020). However, in some studies the relative contribution of the explanatory power of the models between AI and biodiversity are increased when a combination of indices are used (Towsey et al., 2014; Eldridge et al., 2018; Buxton et al., 2018; Lawrence et al., 2019). This led to the conclusion that the combination of different AIs can capture different aspects of sounds and therefore are better to summarize soundscape information more accurately (Sueur et al., 2014a; Mammides et al., 2017; Eldridge et al., 2018; Retamosa et al., 2018).
Acoustic indices have been more extensively tested in birds (Alcocer et al., 2022), the second most studied group in acoustic ecology (second only to bats) (Sugai et al., 2019). Birds are a great model group for studying acoustics, as they are omnipresent and adaptive with representatives adapted to the most diverse types of environments, have intense acoustic activity (Gasc et al., 2017), and are highly sensitive to environmental changes, thus being a promising proxy for broader patterns of biodiversity (Lewandowski et al., 2010). If places that have a greater number of bird species reflect this richness in the acoustic environments, indices that aim to measure acoustic diversity could be used as biodiversity proxies (Sueur et al., 2014a) in addition to possibly enabling the association of other biological diversity metrics with the recordings.
A recent meta-analysis, which discusses the evolution of research that employs acoustic indices to measure biodiversity, highlights significant issues related to the discrepancies and limitations of studies examining the direct correlation of acoustic indices with biodiversity (Alcocer et al., 2022). The study also discusses important issues regarding divergences and limitations of studies that test the direct correlation of acoustic indices with biodiversity. One of the conclusions is that the indices would be more correlated with the total amount of acoustic activity rather than with the richness or diversity of vocalizations. Acoustic Diversity Index (ADI) and BIO were frequently correlated with bird vocalizations in the studies reviewed by Alcocer et al., 2022.
ADI and BIO both use amplitude variability (a striking feature of bird vocalizations) and the different frequency bands occupied, and have been showing better performance in recent studies (reflecting different species) (e.g., Buxton et al., 2018; Myers et al., 2019; Eldridge et al., 2018; Shamon et al., 2021). However, research still shows some divergences in the relationship between acoustic indices and the vocal activity of birds (Mammides et al., 2017). As an example, studies that tested the correlation between bird richness and the ADI have been presenting moderate correlations (Machado et al., 2017; Mammides et al., 2017; Eldridge et al., 2018). In environments with medium or high levels of bird acoustic activity, such as breeding seasons in tropical forests, ADI may have a better performance in predicting bird diversity (Zhao et al., 2019). On the other hand, studies that tested the correlation between ADI and bird acoustic activity showed low correlations (Ferreira et al., 2011; Fuller et al., 2015; Jorge et al., 2018; Bicudo et al., 2023).
Given the great disparity found in the soundscape literature concerning acoustic indices and bird biodiversity, we sought to understand the relative contribution of AI commonly used to measure bird diversity in different types of environments. We used eight common acoustic indices (Table 1) in order to measure biodiversity and to answer three questions: 1) What is the relative contribution of acoustic indices in explaining acoustic proxies for richness, quantity, and diversity of vocalizations? 2) How much does the explanatory power increase by combining two acoustic indices (i.e., bivariate models) when compared to single indices (univariate models)? 3) Are these correlations influenced by the type of environment? We hypothesized that 1) bivariate models perform significantly better than univariate models, independent of response variables (Figures 1A,B); 2) Of all the indices, ACI will have the higher explanatory power in univariate models followed by BIO (Figure 1C); 3) The correlations will vary according to the type of environment, considering that in swamps there could be greater masking effects caused by water noise, while in pastures the presence of anthropogenic noise is greater than swamp environments (Figure 1D), and due to the presence of dense vegetation causing sound attenuation, the forested areas are expected to have less influence from external noise sources.
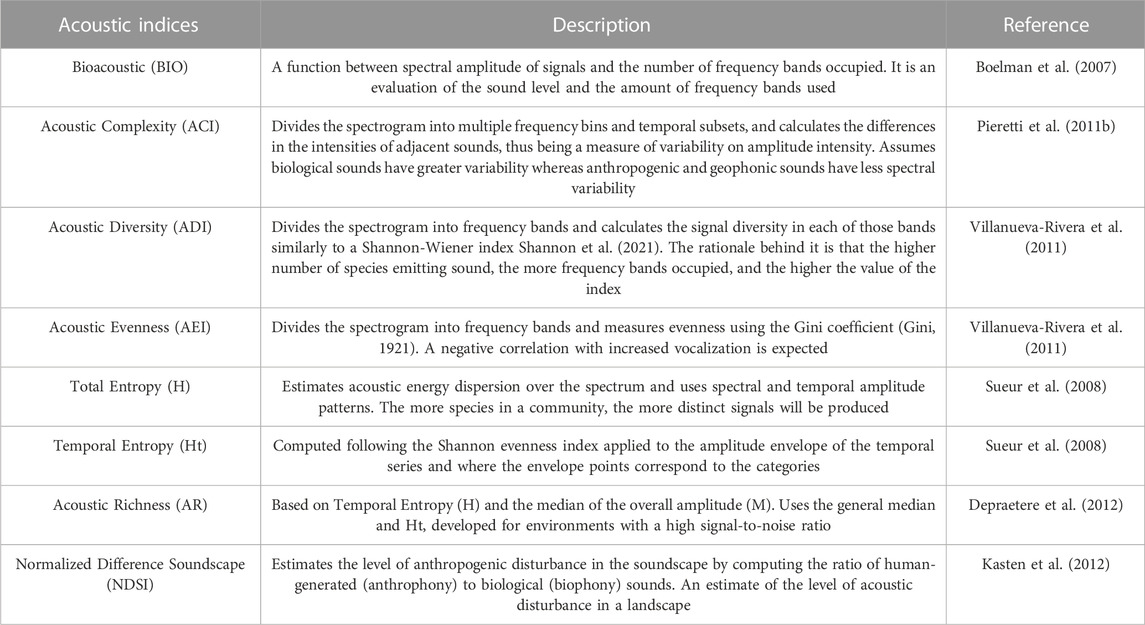
TABLE 1. Description of the acoustic indices used for the correlation test with acoustic diversity of diurnal birds in the context of Long-Term Ecological Research within the ecological Corridor of Cantareira-Mantiqueira (LTER CCM), Atlantic Forest, São Paulo, Brazil.
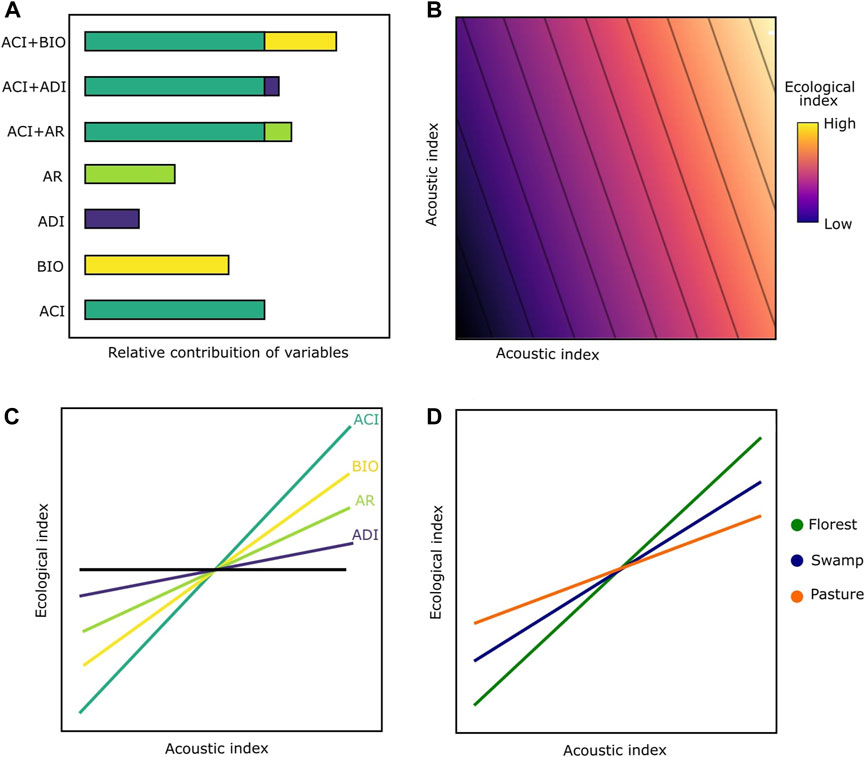
FIGURE 1. Expected patterns for acoustic predictions to understand bird diversity. (A) explanatory power for single and combined acoustic indices; (B) expected patterns between bird diversity and bivariate acoustic models, where an AI would be a more explanatory contribution than others. ; (C) expected slopes between bird diversity and acoustic indices (the steeper the slope, the higher the relationship between bird diversity and the indices). To simplify, only some examples are presented here; (D) Models with greater predictive power in a forest environment, followed by swamps and pastures.
Materials and methods
Study area
The study was conducted in the northeastern portion of the state of São Paulo and the southern portion of the state of Minas Gerais, Brazil (Figure 2). This region is the focus of the Long-Term Ecological Research within the ecological corridor of Cantareira-Mantiqueira (LTER CCM). The main land cover types of the study area consist of forest, pasture, agriculture, forestry (mainly Eucalyptus plantation), and swamps, as well as urban and rural buildings (Boscolo et al., 2017; Barros et al., 2019). The Atlantic Forest is a biodiversity hotspot despite being highly degraded (Myers et al., 2000). The biome presents high levels of bird richness (620 species, Myers et al., 2000) and endemism (223 species, Vale et al., 2018), and it has been highly deforested and fragmented (Ribeiro et al., 2009), reduced to about 28% of its original size (Rezende et al., 2018). In 2009, the remaining patches were isolated (average distance is 1,440 m), small in size (84% has less than 50 ha), and under severe edge effects (half of the remnants are less than 100 m from the forest edges (Ribeiro et al., 2009) and its status has only worsened since then. The Cantareira-Mantiqueira Corridor is of great ecological importance as it connects two large Atlantic Forest remnants: the Cantareira State Park and the Serra da Mantiqueira Mountain range (Boscolo et al., 2017).
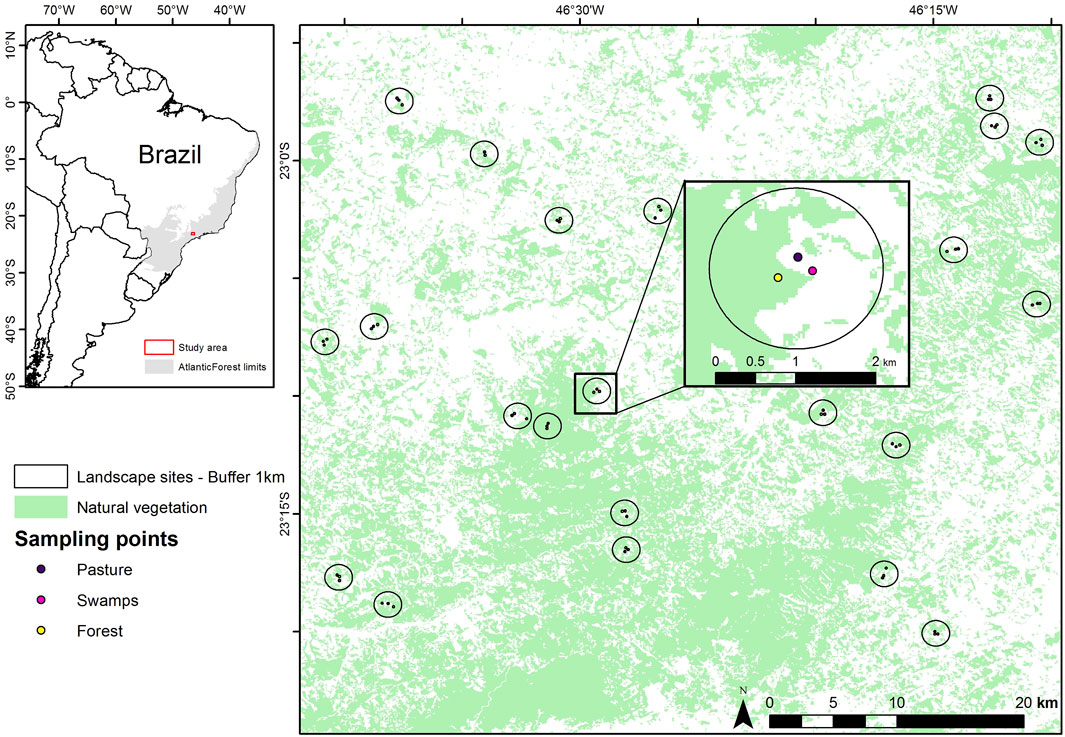
FIGURE 2. Sampling landscapes in the Cantareira-Mantiqueira ecological corridor, located in an Atlantic Forest biodiversity hotspot in southeastern Brazil. The inset map shows the three different environments (forest, swamp, and pasture) sampled in each of the 22 landscapes varying in forest cover gradient (1%–97%) in a 1-km radius buffer.
Experimental design
We collected audio data in 22 landscapes (Figure 2). For each landscape we sampled three different habitat types: forest, pasture, and swamp. Habitats were sampled for 30 days each between October 2016 to January 2017 with the following sampling scheme: forests (October to November), swamps (November to December), and pastures (December to January). The sampling period refers to the rainy season (October-January) and precipitation in this region, and it matches with the reproductive period of most birds within the Atlantic Forest (Develey and Peres, 2000). During the sampling period, the average temperature and precipitation were similar between landscapes. Regarding sunrise time, due to the relatively low variation in sunrise between the collection months, we assume that this factor did not affect the data. Using a reference from a meteorological site for sunrise in São Paulo, the average for the month of Oct/16 was 6:04 h, Nov/16 was 6:15 h, Dec/16 was 6:16 and Jan/17 was 6:35 h. With an overall mean of 6:17 h and standard deviation of −18 min (sunrise-and-sunset.com, oct/2016-jan/2017). Despite this, we extracted presence and absence data from the vocalizations in the audio files and verified their correlations with the acoustic indices. Therefore, seasonality differences do not affect our results. The forest sites were at least 50 m away from the border to the interior of the forest to avoid edge effects; the pastures were mainly designated for cattle raising and the swamps consisted of wetlands in the lower portions of the relief.
Soundscape recordings
We used Song Meter Digital Field Recorders (SM3; Wildlife Acoustics. Inc. Massachusetts) fixed on tree trunks 1.5 m above the ground. The recorders were equipped with two omnidirectional microphones (frequencies 20 Hz to 20 kHz), and the sampling rate was 44.1 kHz, 16 bits and mono mode. We subsampled the dataset to include only the period between 05:00a.m. to 08:25a.m., when birds are in peak activity (Metcalf et al., 2020a), because this study focused only on diurnal birds. During this period, 25-min files were recorded with 25-min breaks (to save storage space and battery). Complete information regarding the sampling effort at each site (i.e., habitat type) can be found in Supplementary Appendix 1.
Audio subset and species labeling
We sent the recordings to specialists in order to identify which bird species were present. To randomize the data analyzed by each specialist and split the recordings evenly among them, we created a subset of recordings following 4 steps: 1) we selected five 25-min files at given periods (05:00a.m., 05:45a.m., 06:30a.m., 07:15a.m., and 08:00a.m.) per day; 2) we extracted two random minutes from each file 3) we grouped those minutes into nine “packages” (compacted files) of 300-random-minutes each (i.e. 2,700 min), of which each “package” contained 100 min of forests, 100 min of swamps, and 100 min of pastures; 4) the “packages” of minutes were sent to bird experts, who labeled the occurrence of bird species for each minute (see scheme in Supplementary Appendix 2). It is known that the number of vocalizations in the same minute can influence the value of acoustic indices (Zhao et al., 2019). However, even before several vocalizations of the same species in the audio, we annotated one label per specie per 1-min file for each bird species that vocalized so as not to inflate the index with an erroneous quantitative measurement of the individuals actually present in the environment (Figure 3). We annotated the species events (a.k.a. species labeling) in the software Raven Pro v.1.5 (Center for Conservation Bioacoustics, 2014), and recordings of unidentified calls were disregarded from the analysis.
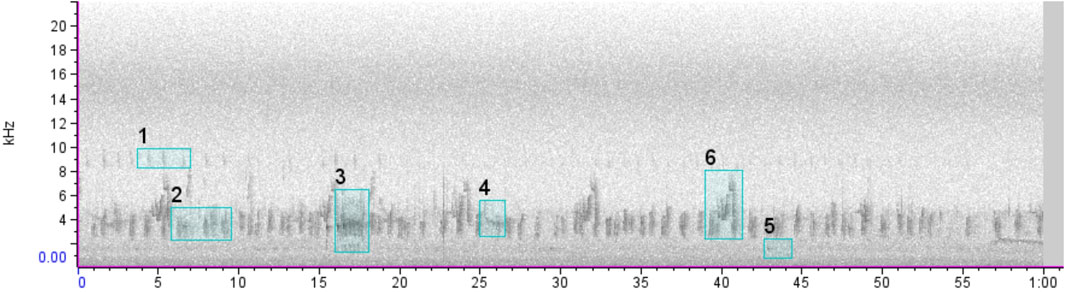
FIGURE 3. Example of a 1-min spectrogram containing one label for each bird vocalization used for the analyses also used to calculate acoustic indices.
Acoustic indices
For each minute, we calculated eight Acoustic Indices (AI) that have been commonly used to measure bird diversity: 1) Acoustic Diversity Index (ADI); 2) Acoustic Evenness Index (AEI); 3) Acoustic Complexity Index (ACI); 4) Entropy Index (H); 5) Bioacoustic Index (BIO); 6) Acoustic Richness index (AR); 7) Temporal Entropy index (Ht); and 8) Normalized Difference Soundscape Index (NDSI). Sueur et al. (2008) and Villanueva-Rivera et al. (2016) have summarized the descriptions and have provided appropriate references for the indices. We did not apply any pre-processing techniques prior to the calculation of indices as it is important to test how the AIs perform in different environmental conditions.
Signal masking can have a negative impact on the calculation of acoustic indices (Metcalf et al., 2020a). Signals from other sources such as anthrophonies or geophonies can overlap the vocalization signals and cause changes in the values of the indices. We wanted to test the acoustic indices in real field recording situations, and in our database a portion of the recordings contained the sound of rainfall. Sound files with light rain were used, while files with heavy rain were disregarded when they hindered the visualization of vocalizations. To minimize the impact of rain sound on correlations, we applied different frequency and amplitude thresholds to our recordings. More details are shown in Supplementary Appendix 3. The thresholds were chosen based on the following information: 1) direct observation of the vast majority of bird species vocalizing between 1,000 Hz and 12,000 Hz; 2) the minimum of 300 Hz chosen was based on of its use by other authors, and the likelihood that no bird would be vocalizing below this, being mostly noise and; 3) the maximum limit was chosen using all the recording frequencies, which consisted of the range of human acoustic perception. Knowing that human noise is in the lower frequency range and that 93% of bird calls in our data are below 12 kHz, we calculated the acoustic indices using different combinations of parameters.
We used Rstudio v.1.414 (R Development Core Team 2016) and Seewave (Sueur et al., 2008) to calculate ACI, AR, and Ht. Likewise, we used Soundecology packages (Villanueva-Rivera et al., 2016) to calculate ADI, AEI, BIO, H and NDSI.
Models and statistical analyses
We used Linear Mixed-Effects Models (LMM) to test the relationship between bird diversity and AI, considering Poisson distribution and the landscape as a random factor. In addition, we also used Generalized Linear Models (GLM) in order to verify the behavior of the models in each environment separately (forest, pasture and swamp). For this purpose, we used 20 randomly drawn 1-min samples from each collection site (same landscape and type of environment). Three response variables were considered for each of the 20 1-min samples: 1) amount of bird species (named by us as “richness of labels”); 2) frequency of occurrence within (“number of labels”) and; 3) inverse of Simpson’s diversity, considering the two previous measures (“diversity of labels”) (Chao et al., 2010). Mean AI were the explanatory variables. Therefore, we used a bootstrap procedure to standardize the sampling effort and randomize the sampling points (n = 65). To do that, we pooled 100 * 20 random minutes (within reposition) out of the annotated files from each sampling point. This created a total of 130,000 random minutes, totaling 6,500 groups of 20 min each to evaluate. These were used to calculate the predictor and response variables. The same groups of minutes (20 1-min) were used for calculating the average of each acoustic index.
All the final models were tested for multicollinear variance inflation factors (VIF), considering a VIF <3 (Zuur et al., 2010). We performed VIF analyses for each group of models, considering models with the response variables 1) “richness of labels”; 2) “number of labels” and 3) “diversity of labels”. Thus, in the first round of VIF, all models for that response variable were considered. Since we were removing the model with the highest VIF value in each round, one model remained for each of the acoustic indices and for each combination of two tested indices.
After that, we evaluated the models according to values of deltaAIC, weightAIC (Akaike, 1973; Aho et al., 2014), R2, and correlation plots. Supplementary Appendix 7 contains the analyses of the residues of each evaluated model.
Results
We analyzed a total of 2,563 min comprising 294.8 h of recordings. In total, we had 9,629 labels: 9,278 at the bird species level (199 species of 52 families), 351 at the genus level (complete list of bird species in Supplementary Appendix 4), and 808 not identified (distant signals or dubious calls). The species with the highest frequency of detection were Vireo chivi (781 min), Zonotrichia capensis (631 min), Basileuterus culicivorus (533 min), Cyclarhis gujanensis (427 min), and Pitangus sulphuratus (371 min). We detected 137 corrupted, blank minutes that were excluded from the analysis, which resulted in 2,563 min analyzed.
Selection of variables
The analyses of VIFs selected the same set of acoustic indices (Table 2) for three response variables (richness, number, and diversity labels).
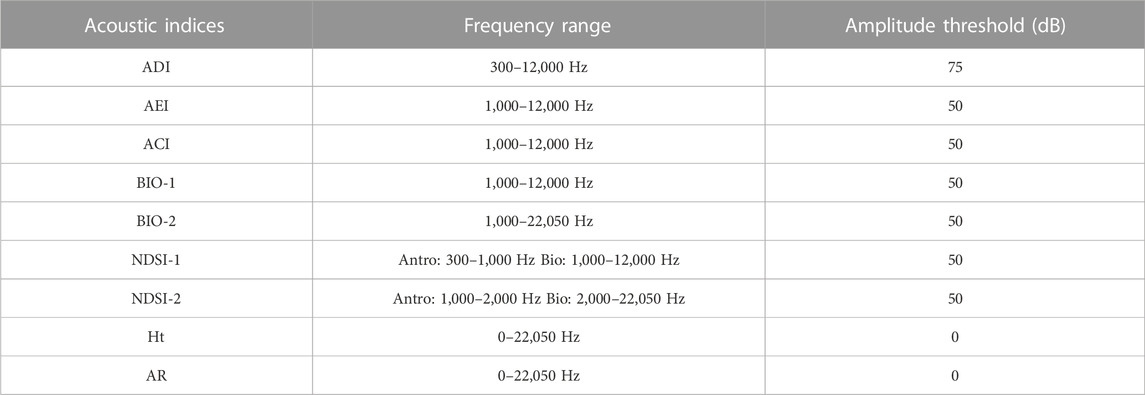
TABLE 2. Sets of acoustic indices selected over VIFs. These were used in final indices and parameters to test the correlation with bird richness, number, and diversity of labels in the context of Long-Term Ecological Research within the ecological Corridor of Cantareira-Mantiqueira (LTER CCM), Atlantic Forest, São Paulo, Brazil. A “0” indicates the absence of an amplitude threshold. The amplitude threshold is the minimum dB value used in the acoustic index reading.
Generalizations of environments
When performing the analysis using data without distinction among environments, for models using a single acoustic index in correlations with richness, number of tags, and diversity of birds, the BIO and ACI indices had the best performance (Figure 4). The correlations are lower than the results of the bivariate models, in which we use two acoustic indices.
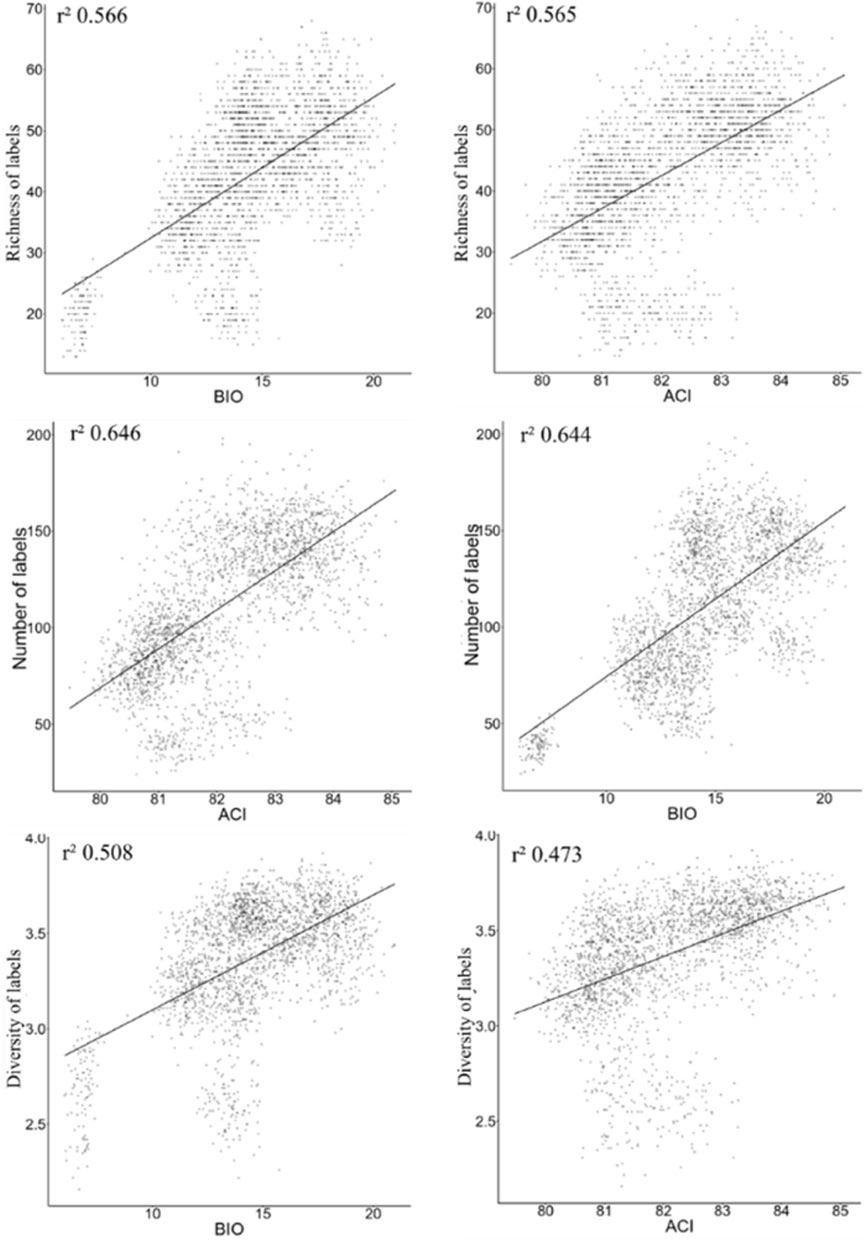
FIGURE 4. The best models from LM analysis using data generalized among all environments together, in the context of Long-Term Ecological Research within the ecological Corridor of Cantareira-Mantiqueira (LTER CCM), Atlantic Forest, São Paulo, Brazil.
In all available data, the bivariate models that considered the environment type were an important part of explaining the patterns. For each variable response, a different model returned better performance (Figure 5).
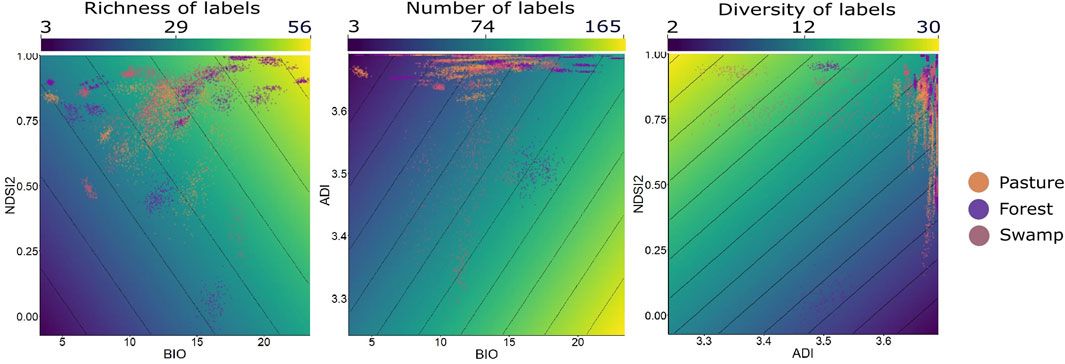
FIGURE 5. The best models from LMM analysis using data generalized among all environments together, within the context of Long-Term Ecological Research within the ecological Corridor of Cantareira-Mantiqueira (LTER CCM), Atlantic Forest, São Paulo, Brazil. Each point in the cloud of points represents a set of 20 min randomly grouped within each type of environment. The color gradient expresses the results of the different metrics (richness, number, and diversity of labels) within each sample. The y and x-axes express the results of each of the acoustic indices tested for each sample.
For the variable “number of labels,” the bivariate model BIO1+ADI presented R2 = 0.71, while for “richness of labels” the model used was BIO1+NDSI2 (R2 = 0.66), and lastly “diversity of labels” was presented as R2 = 0.58. The correlations using only one acoustic index were the lowest. The four main models and NULL model are presented in Table 3, and the rest of the results are presented in Supplementary Appendix 5.
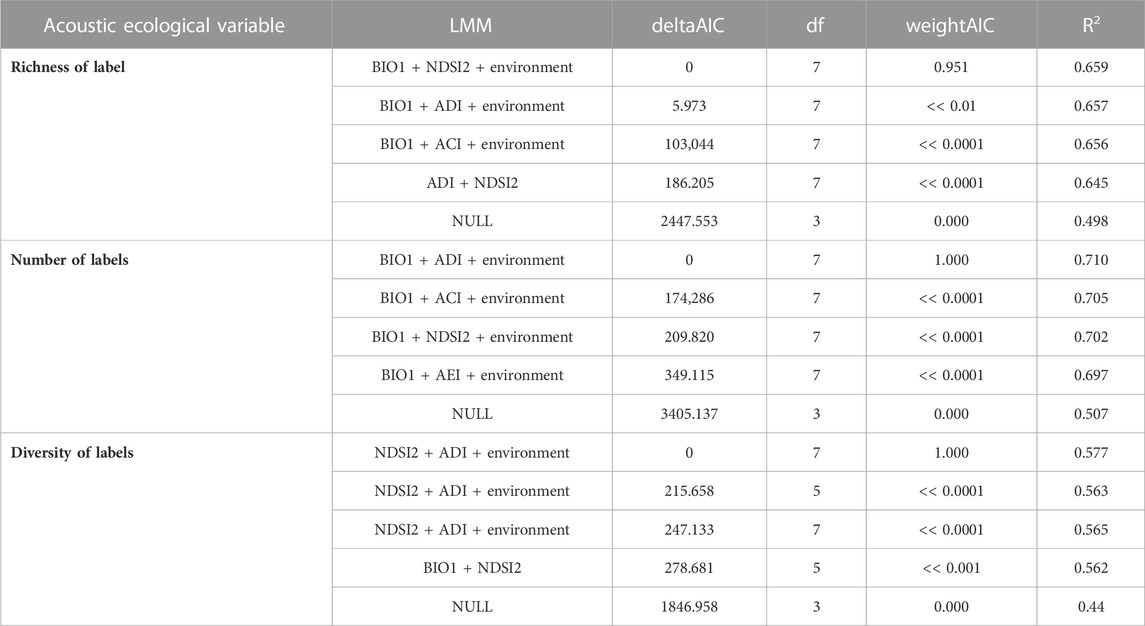
TABLE 3. The best models for each response variable and null model. Model variables, deltaAICc, df (degrees of freedom), 304 weightAIC, and Explanatory power (R2) of acoustic indices for explaining bird responses in the context of Long-Term Ecological Research within the ecological Corridor of Cantareira-Mantiqueira (LTER CCM), Atlantic Forest, São Paulo, Brazil. Detailed results are available in Supplementary Appendix 6. Column LMM (Linear Mixed Models) are presented with the response variable as a function (∼) of the predictor variables (xx + xx) of the model.
Environment types
Considering each type of environment (forest, pasture, and swamp) separately, among the environments, the correlations were stronger in the swamp. For the pasture environment, the highest correlation found was R2 = 0.43 (BIO1+AR). While in the forest environment, BIO1+NDSI2 (R2 = 0.5) showed the highest correlation. For the purpose of comparison, Table 4 presents the two models with the highest correlations in each type of environment. Also, we found that the acoustic indices are better correlated with the number label than the richness or diversity labels.
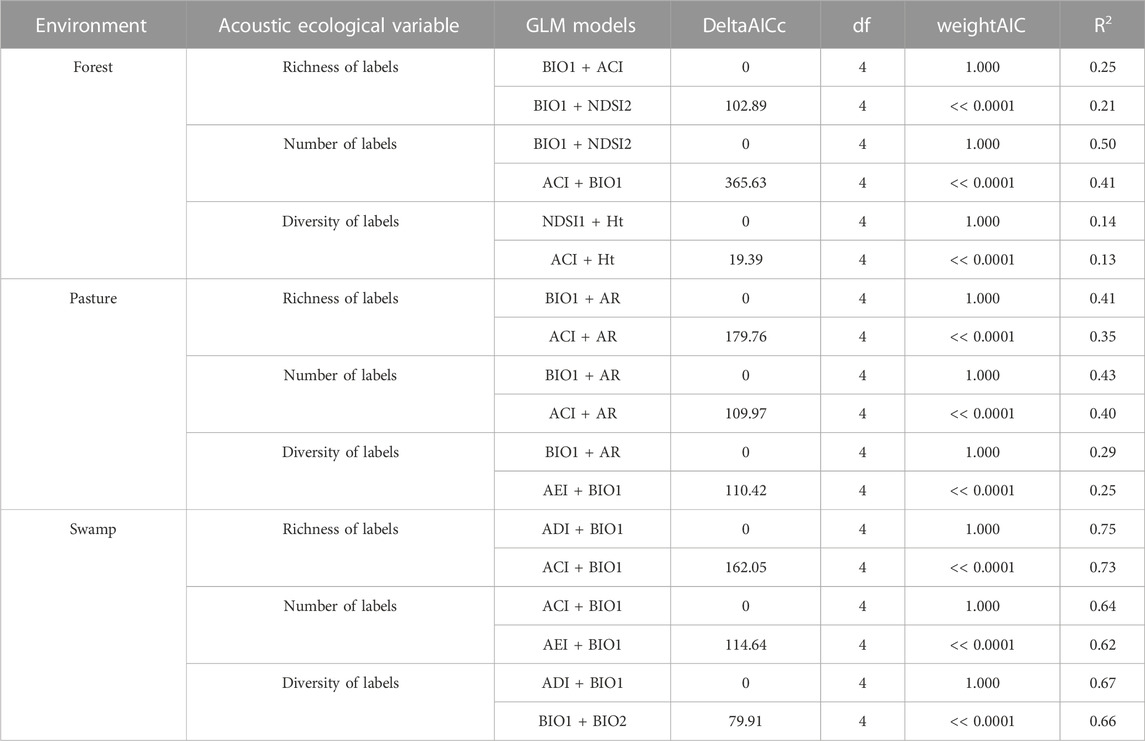
TABLE 4. Mainly models from GLM results to response variables from each environment’s data. Model variables, dAICc, df (degrees of freedom), wAIC, and Explanatory power (R2) of acoustic indices on explaining bird responses in the context of Long-Term Ecological Research within the ecological Corridor of Cantareira-Mantiqueira (LTER CCM), Atlantic Forest, São Paulo, Brazil. Bird responses are bird richness, number of bird labels, and bird label diversity. The acoustic indices after the “∼” symbol were used in the models, which were ranked from the higher dAICc and R2 values (top) to the lowest (bottom) within bird responses. Detailed results are available in Supplementary Appendix 16.
In contrast to the best model when considering data from all environments without distinction, for each environment a different bivariate model had greater explanatory power. For forest data, there is moderate correlation between the BIO1+NDSI2 model (Figure 6).
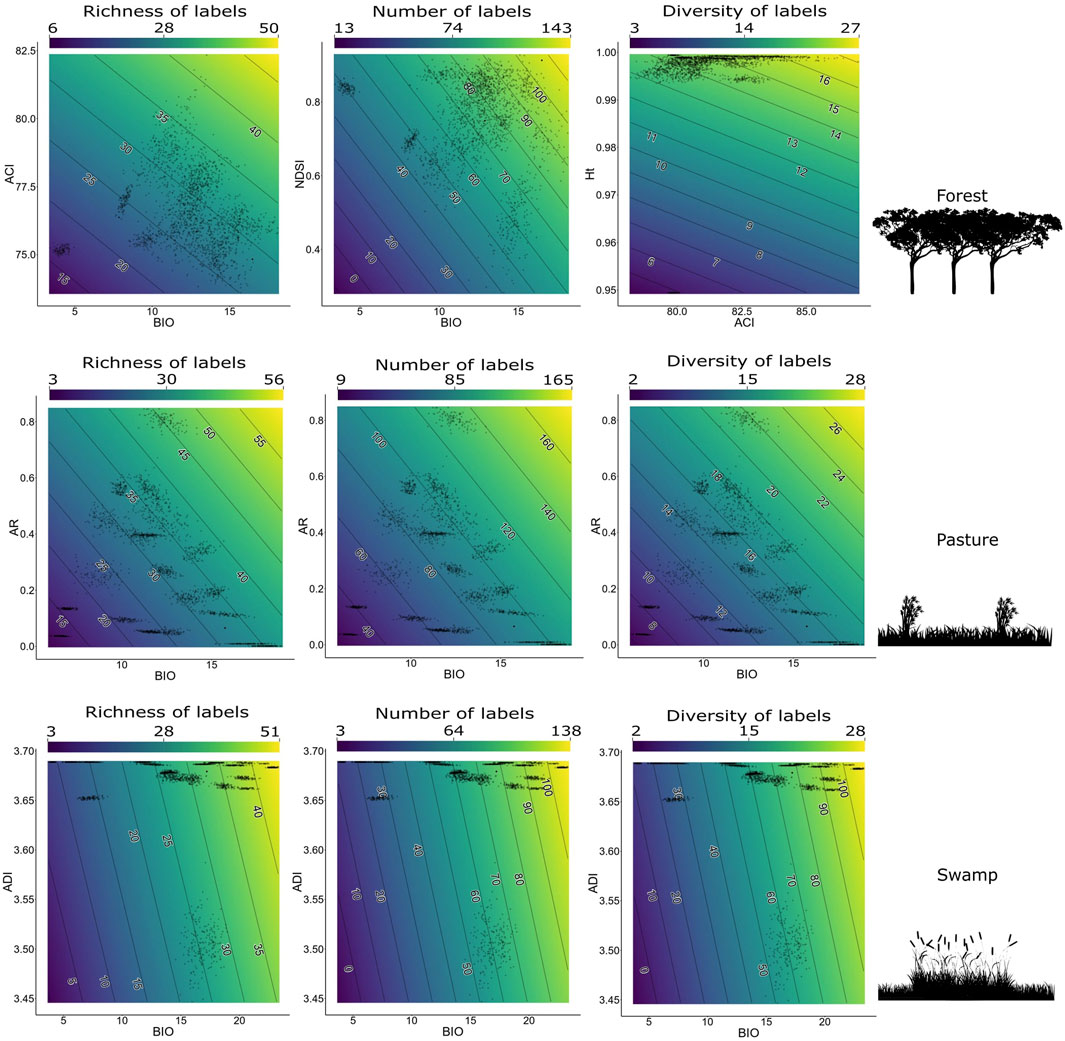
FIGURE 6. The best models to each response variable (bird richness, number of labels, and label diversity) for each separate environment in the context of the Long-Term Ecological Research within the ecological Corridor of Cantareira-Mantiqueira (LTER CCM), Atlantic Forest, São Paulo, Brazil. Bird responses are bird richness, number of bird labels, and bird label diversity. All BIOs correspond to the BIO1 parameters.
Discussion and conclusion
We investigated how eight of the most used acoustic indices relate to the bird acoustic community in different environments of the Atlantic Forest. Our results showed that bivariate models of acoustic indices were better correlated with all tested aspects of recorded bird biodiversity than single-index models. Different models presented better performance for each variable of acoustic diversity tested, and also showed differences for each type of environment. For data without distinction between environments, the highest correlations found were between the acoustic indices and the number of labels (R2 = 0.71). While in the data tested for each type of separate environment, the highest correlation was with the richness of labels (R2 = 0.75) in swamp areas. Of the models analyzed in the general dataset, the bivariate model combining BIO and ADI correlated the best with number of labels. In addition, we demonstrate that the type of environment influences the explanatory power and thus has a direct influence on the best index set to be used as a measure of biodiversity in each context.
Some studies found that correlations between acoustic indices and bird biodiversity indices vary from low to moderate (Alcocer et al., 2022). We demonstrated that the predictive power of the models is increased with the use of more than one acoustic index. The predictive power is still low in most cases (as shown by the R2 values) and it is known that a combination of indices performs better to represent biodiversity than a single index approach (Towsey et al., 2014; Mammides et al., 2017; Scarpelli et al., 2021). The idea of a single index being unable to capture all facets of the diversity of vocalizations has already been discussed by Sueur et al. (2014b). Other studies have explored this relationship in tropical and temperate environments with low bird richness (Towsey et al., 2014; Buxton et al., 2018; Eldridge et al., 2018), but we did so by testing this relationship with a large volume of data, high bird richness, and different types of environments.
The soundscape is a complex environment formed by several variable elements that often overlap with each other (Pijanowski et al., 2011). Biophony have variations in patterns, frequency, and modulation according to the emitting animal and period; geophony can vary among hours or seasons, often cover all spectrograms, causing masking of vocalizations; and lastly anthrophony are usually in the lower frequencies (Pijanowski et al., 2011). These and other elements make soundscapes a complex environment to study, therefore it is logical to postulate that a combination of indices would be more efficient to represent such a diverse multidimensional space. Therefore, our results corroborate with previous research in that multiple acoustic indices are more suitable to be used as a proxy for the representation of bird biodiversity in soundscapes (e.g., Buxton et al., 2018; Bradfer-Lawrence et al., 2020; Alcocer et al., 2022).
The best performing models considered the categorical variable “environment.” Demonstrating, in this way, that acoustic activity varies in each environment. This is why the following analyses were carried out considering each type of environment (forest, swamp, and pasture) separately perceiving that the models performed differently depending on the type of environment. Here, due to the limitation of the amount of equipment, we first collected data in forests (October-November), then swamps (November-December), and pastures (December-January). All in the birds’ breeding season (Develey and Peres, 2000). However, it is possible that there are differences in the acoustic activity of the birds between the beginning and the end of the breeding season, thus affecting the data, data collection in some months showed greater or lesser vocal activity of birds. For this reason, our conclusions regarding the differences between the effectiveness of biodiversity prediction by acoustic indices across environments is that there is variation in the use of single index or combination between two indices, as well as in the parameters used according to the type of environment. It is difficult to say whether the indices that had higher correlations are more suitable for these types of environments.
Previous research suggests that studies that present data sets from different types of environments should find stronger correlations overall (e.g., Mammides et al.,2017). When we consider the analyses carried out for each environment separately, the highest correlations were in the swamp, while the correlations in the forest and pasture were relatively low. The highest correlation in the swamp was from BIO-ADI, the same model that performed best for general data without distinction between environments, with similar correlation power. This pattern was already expected, mainly due to changes in the signal-to-noise ratio, especially between open and closed environments (Ey and Fischer, 2009). This suggests that the BIO + ADI model is more consistent for use in data obtained between heterogeneous environments. Besides, there will be differences in acoustic transmission between areas with different land uses and vegetation structure (Darras et al., 2016) and acoustic communities will also vary among environments. Despite this, the AI proved to be insensitive in capturing the variation between landscapes with different levels of fragmentation in the Atlantic Forest hotspot (Scarpelli et al., 2021).
Some researchers have found strong and weak correlations depending on the use of acoustic indices in monitoring different aspects of soundscapes, including the acoustic activity of birds. They have presented results that were often divergent in relation to which AI had the highest correlations with each evaluated acoustic component. Bird sounds have many modulations and variations among hundreds of species, and the distance of the animal to the microphone can affect the acoustic indices (Lellouch et al., 2014). All these different patterns can be due to several reasons, such as differences in the land uses (e.g., Buxton et al., 2018), climate (e.g., Eldridge et al., 2018), vocalization patterns (Zhao et al., 2019), lower number of recorded hours per site than recommended for acoustic studies (Bradfer-Lawrence et al., 2020), and acoustic signal diversity, like anthropogenic noise types (e.g., Ross et al., 2020). Given these variations inherent to the acoustic landscapes, the divergence in the results of the indices depend on the distance from the emitting source to the microphone, added to the high modulation and diversity of types of bird vocalization (Lellouch et al., 2014). Also, the divergences among the studies that tested them demonstrate the variation of results in each dataset. This indicates that in each study site there are previous tests like those demonstrated in our research to verify the strength of the correlation and the best set of indices that describe the acoustic biodiversity of birds in the subset of study sites.
In the present study, we considered ecological measures of species richness, abundance, and Simpson diversity of labels from each subset of 20 random 1-min samples from each sampling point. We tested the models’ correlation with the average of the results of each acoustic index. We found that in almost all situations the highest correlation of acoustic indices was with the number of labels and correlation was lower with richness or diversity, except for the swamp data, where the strongest correlations were with richness. This is an indication that the indices are more representative of the birds’ vocal activity level than their own diversity. As we considered 1 min as the minimum sample unit, we did not mark all vocalizations present in the recordings.
The application of acoustic indices in the measurement of biodiversity in large databases becomes more accurate in the selection of data from the time of greatest vocal activity of the interest group and, as we demonstrate, from the selection of specific frequency bands, amplitude filters, and the use of bivariate models. The BIO-ADI bivariate model is the most suitable for measuring bird biodiversity, and we recommend its application in monitoring natural and heterogeneous soundscapes that have high species richness. We advocate for the use of acoustic indices in monitoring areas, especially using the vocal activity of birds as an important factor to consider. However, for its direct and large-scale application, future studies are needed to define methodological routines for the treatment and analysis of acoustic data from the field, as well as models with greater accuracy for measuring biophonies, geophonies, and anthropophonies.
Data availability statement
The original contributions presented in the study and the original database metadata are included in the article/Supplementary Material, further inquiries can be directed to the corresponding author.
Author contributions
LG: Conceptualization, Data curation, Formal Analysis, Investigation, Methodology, Software, Supervision, Writing–original draft, Writing–review and editing. MD: Writing–review and editing. EO: Writing–review and editing. RA: Data curation, Methodology, Writing–review and editing. AG: Methodology, Writing–review and editing. RW: Methodology, Writing–review and editing. RF: Methodology, Writing–review and editing. SK: Methodology, Writing–review and editing. CG: Methodology, Writing–review and editing. MR: Conceptualization, Funding acquisition, Investigation, Methodology, Project administration, Writing–review and editing.
Funding
The author(s) declare financial support was received for the research, authorship, and/or publication of this article. LG thanks the Coordination for the Improvement of Social Demand Program (CAPES processes #88882.434132/2019-01; #88887.513964/2020-00). MR thanks the São Paulo Research Foundation—FAPESP (processes #2013/50421-2; #2020/01779-5; #2021/08322-3; #2021/08534-0; #2021/10195-0; #2021/10639-5; #2022/10760-1) and National Council for Scientific and Technological Development—CNPq (processes #442147/2020-1; #440145/2022-8; #402765/2021-4; #313016/2021-6; #440145/2022-8), and Sao Paulo State University—UNESP for their financial support. The content of this article was partially published in the lead author’s master’s thesis (Gaspar, 2021). This study had the collaboration of infrastructure and support from the Pierre Kaufmann Observatory Radio, located in the city of Atibaia, Sao Paulo. The Pierre Kaufmann Radio Observatory is an institution maintained and operated by the Mackenzie Presbyterian University through its Mackenzie Radio Astronomy and Astrophysics Center (CRAAM) in collaboration with the National Institute for Space Research (INPE). We kindly thank Guilherme Alaia for all the support that he gives to the LTER CCM team. This study is also part of the Center for Research on Biodiversity Dynamics and Climate Change, which is financed by the Sao Paulo Research Foundation—FAPESP.
Conflict of interest
The authors declare that the research was conducted in the absence of any commercial or financial relationships that could be construed as a potential conflict of interest.
Publisher’s note
All claims expressed in this article are solely those of the authors and do not necessarily represent those of their affiliated organizations, or those of the publisher, the editors and the reviewers. Any product that may be evaluated in this article, or claim that may be made by its manufacturer, is not guaranteed or endorsed by the publisher.
Supplementary material
The Supplementary Material for this article can be found online at: https://www.frontiersin.org/articles/10.3389/frsen.2023.1283719/full#supplementary-material
Supplementary Datasheet 1 | Matrix showing the presence/absence of each birds species in each sound file.
Supplementary Datasheet 2 | Results of models considering the complete database, including the collection point (landscape and environment = “env”) as a random variable.
Supplementary Datasheet 3 | Results of models considering only audio collected in a forest environment.
Supplementary Datasheet 4 | Results of models considering only audio collected in a cattle pasture environment.
Supplementary Datasheet 5 | Results of models considering only audio collected in a swamp environment.
Supplementary Datasheet 6 | Metadata with the geographical coordinates of each collection point and the amount of multiscale forest cover for each point.
Supplementary Datasheet 7 | Raw data of the results of all acoustic indices calculated for each minute of the dataset used.
References
Aho, K., Derryberry, D., and Peterson, T. (2014). Model selection for ecologists: the worldviews of AIC and BIC. Ecology 95 (3), 631–636. doi:10.1890/13-1452.1
Akaike, H. (1973). Maximum likelihood identification of Gaussian autoregressive moving average models. Biometrika 60, 255–265. doi:10.1093/biomet/60.2.255
Alcocer, I., Lima, H., Sugai, L. S. M., and Llusia, D. (2022). Acoustic indices as proxies for biodiversity: a meta-analysis. Biol. Rev. 97 (6), 2209–2236. doi:10.1111/brv.12890
Araújo, C.B. de, Furtado, S. N. M., Vieira, G. H. C., and Simões, C. R. (2020). O nicho acústico: integrando a física, ecologia E teoria da comunicação. Oecologia Aust. 24, 762–769. doi:10.4257/oeco.2020.2404.01
Barros, F. M., Peres, C. A., Pizo, M. A., and Ribeiro, M. C. (2019). Divergent flows of avian-mediated ecosystem services across forest-matrix interfaces in human-modified landscapes. Landsc. Ecol. 34, 879–894. doi:10.1007/s10980-019-00812-z
Bicudo, T., Llusia, D., Anciães, M., and Gil, D. (2023). Poor performance of acoustic indices as proxies for bird diversity in a fragmented Amazonian landscape. Ecol. Inf. 77, 102241. doi:10.1016/j.ecoinf.2023.102241
Boelman, N. T., Asner, G. P., Hart, P. J., and Martin, R. E. (2007). Multi-trophic invasion resistance in Hawaii: Bioacoustics, field surveys, and airborne remote sensing. Source: Ecological Applications.
Bormpoudakis, D., Sueur, J., and Pantis, J. D. (2013). Spatial heterogeneity of ambient sound at the habitat type level: ecological implications and applications. Landsc. Ecol. 28, 495–506. doi:10.1007/s10980-013-9849-1
Boscolo, D., Tokumoto, P. M., Ferreira, P. A., Ribeiro, J. W., and Santos, J.S. dos. (2017). Positive responses of flower visiting bees to landscape heterogeneity depend on functional connectivity levels. Perspect. Ecol. Conserv. 15, 18–24. doi:10.1016/j.pecon.2017.03.002
Bradfer-Lawrence, T., Bunnefeld, N., Gardner, N., Willis, S. G., and Dent, D. H. (2020). Rapid assessment of avian species richness and abundance using acoustic indices. Ecol. Indic. 115, 106400. doi:10.1016/j.ecolind.2020.106400
Bradfer-Lawrence, T., Gardner, N., Bunnefeld, L., Bunnefeld, N., Willis, S. G., and Dent, D. H. (2019). Guidelines for the use of acoustic indices in environmental research. Methods Ecol. Evol. 10 (10), 1796–1807. doi:10.1111/2041-210x.13254
Butchart, S. H. M., Walpole, M., Collen, B., Van Strien, A., Scharlemann, J. P. W., Almond, R. E. A., et al. (2010). Global biodiversity: indicators of recent declines. Science 328, 1164–1168. doi:10.1126/science.1187512
Buxton, R. T., Agnihotri, S., Robin, V. V., Goel, A., and Balakrishnan, R. (2018). Acoustic indices as rapid indicators of avian diversity in different land-use types in an Indian biodiversity hotspot. J. Ecoacoustics 2, 1. GWPZVD. doi:10.22261/jea.gwpzvd
Buxton, R. T., McKenna, M. F., Mennitt, D., Fristrup, K., Crooks, K., Angeloni, L., et al. (2017). Noise pollution is pervasive in U.S. protected areas. Sci. (80- 356, 531–533. doi:10.1126/science.aah4783
Campos, I. B., Fewster, R., Truskinger, A., Towsey, M., Roe, P., Vasques Filho, D., et al. (2021). Assessing the potential of acoustic indices for protected area monitoring in the Serra do Cipó National Park, Brazil. Ecol. Indic. 120, 106953. doi:10.1016/j.ecolind.2020.106953
Carrara, E., Arroyo-Rodríguez, V., Vega-Rivera, J. H., Schondube, J. E., de Freitas, S. M., and Fahrig, L. (2015). Impact of landscape composition and configuration on forest specialist and generalist bird species in the fragmented Lacandona rainforest, Mexico. Biol. Conserv. 184, 117–126. doi:10.1016/j.biocon.2015.01.014
Center for Conservation Bioacoustics (2014). Raven Pro: interactive sound analysis software. Ithaca, NY: The Cornell Lab of Ornithology. Available at https://ravensoundsoftware.com.
Chao, A., Chiu, C. H., and Jost, L. (2010). Phylogenetic diversity measures based on Hill numbers. Philos. Trans. R. Soc. B Biol. Sci. 365, 3599–3609. doi:10.1098/rstb.2010.0272
Darras, K., Pütz, P., Rembold, K., and Tscharntke, T. (2016). Measuring sound detection spaces for acoustic animal sampling and monitoring. Biol. Conserv. 201, 29–37. doi:10.1016/j.biocon.2016.06.021
Depraetere, M., Pavoine, S., Jiguet, F., Gasc, A., Duvail, S., and Sueur, J. (2012). Monitoring animal diversity using acoustic indices: implementation in a temperate woodland. Ecol. Indic. 13, 46–54. doi:10.1016/j.ecolind.2011.05.006
Develey, P. F., and Peres, C. A. (2000). Resource seasonality and the structure of mixed species bird flocks in a coastal Atlantic forest of southeastern Brazil. J. Trop. Ecol. 16, 33–53. doi:10.1017/S0266467400001255
Dröge, S., Martin, D. A., Andriafanomezantsoa, R., Burivalova, Z., Fulgence, T. R., Osen, K., et al. (2021). Listening to a changing landscape: acoustic indices reflect bird species richness and plot-scale vegetation structure across different land-use types in north-eastern Madagascar. Ecol. Indic. 120, 106929. doi:10.1016/j.ecolind.2020.106929
Duarte, G. T., Santos, P. M., Cornelissen, T. G., Ribeiro, M. C., and Paglia, A. P. (2018). The effects of landscape patterns on ecosystem services: meta-analyses of landscape services. Landsc. Ecol. 33, 1247–1257. doi:10.1007/s10980-018-0673-5
Eldridge, A., Guyot, P., Moscoso, P., Johnston, A., Eyre-Walker, Y., and Peck, M. (2018). Sounding out ecoacoustic metrics: avian species richness is predicted by acoustic indices in temperate but not tropical habitats. Ecol. Indic. 95, 939–952. doi:10.1016/j.ecolind.2018.06.012
Ey, E., and Fischer, J. (2009). The “acoustic adaptation hypothesis”—a review of the evidence from birds, anurans and mammals. Bioacoustics 19 (1-2), 21–48. doi:10.1080/09524622.2009.9753613
Fahrig, L. (1997). Relative effects of habitat loss and fragmentation on population extinction. J. Wildl. Manag. 61, 603–610. doi:10.2307/3802168
Farina, A., Lattanzi, E., Malavasi, R., Pieretti, N., and Piccioli, L. (2011). Avian soundscapes and cognitive landscapes: theory, application and ecological perspectives. Appl. Ecol. Perspect. 26, 1257–1267. doi:10.1007/s10980-011-9617-z
Ferreira, L. M., Oliveira, E. G., Lopes, L. C., Brito, M. R., Baumgarten, J., Rodrigues, F. H., et al. (2018). What do insects, anurans, birds, and mammals have to say about soundscape indices in a tropical savanna. J. Ecoacoustics 2 (1), 1. doi:10.22261/jea.pvh6yz
Fox, J., and Weisberg, S. (2019). An R companion to applied regression. Third edition. Thousand Oaks CA: Sage. Available at https://socialsciences.mcmaster.ca/jfox/Books/Companion/.
Fuller, S., Axel, A. C., Tucker, D., and Gage, S. H. (2015). Connecting soundscape to landscape: which acoustic index best describes landscape configuration? Ecol. Indic. 58, 207–215. doi:10.1016/j.ecolind.2015.05.057
Gaspar, L. P. (2021). Predicting bird diversity using acoustic indices within the Atlantic Forest biodiversity hotspot. [master’s thesis]. [Rio Claro (SP), Brazil, São Paulo State University (UNESP)]. Available at: http://hdl.handle.net/11449/204710.
Gasc, A., Francomano, D., Dunning, J. B., and Pijanowski, B. C. (2017). Future directions for soundscape ecology: the importance of ornithological contributions. Auk Ornithol. Adv. 134 (1), 215–228. doi:10.1642/auk-16-124.1
Gómez, W. E., Isaza, C. V., and Daza, J. M. (2018). Identifying disturbed habitats: a new method from acoustic indices. Ecol. Inf. 45, 16–25. doi:10.1016/j.ecoinf.2018.03.001
Izaguirre Retamosa, M., Barrantes-Madrigal, J., Segura Sequeira, D., Spínola-Parallada, M., and Ramírez-Alán, O. (2021). It is not just about birds: what do acoustic indices reveal about a Costa Rican tropical rainforest? Neotropical Biodivers. 7 (1), 431–442. doi:10.1080/23766808.2021.1971042
Izaguirre Retamosa, M. I., and Ramírez-Alán, O. (2018). Acoustic indices applied to biodiversity monitoring in a Costa Rica dry tropical forest. J. Ecoacoustics 2, 1. doi:10.22261/jea.tnw2np
Johnson, C. N., Balmford, A., Brook, B. W., Buettel, J. C., Galetti, M., Guangchun, L., et al. (2017). Biodiversity losses and conservation responses in the Anthropocene. Sci. (80-. ) 356, 270–275. doi:10.1126/science.aam9317
Jorge, F. C., Machado, C. G., da Cunha Nogueira, S. S., and Nogueira-Filho, S. L. G. (2018). The effectiveness of acoustic indices for forest monitoring in Atlantic rainforest fragments. Ecol. Indic. 91, 71–76. doi:10.1016/j.ecolind.2018.04.001
Kasten, E. P., Gage, S. H., Fox, J., and Joo, W. (2012). The remote environmental assessment laboratory’s acoustic library: an archive for studying soundscape ecology. Ecol. Inf. 12, 50–67. doi:10.1016/j.ecoinf.2012.08.001
Krause, B. L. (1987). Bioacoustics, habitat ambience in ecological balance, whole earth review. Wild Sanctuary 57, 14–18.
Laurance, W. F. (2009). Conserving the hottest of the hotspots. Biol. Conserv. 142, 1137. doi:10.1016/j.biocon.2008.10.011
Lellouch, L., Pavoine, S., Jiguet, F., Glotin, H., and Sueur, J. (2014). Monitoring temporal change of bird communities with dissimilarity acoustic indices. Methods Ecol. Evol. 5 (6), 495–505. doi:10.1111/2041-210x.12178
Lewandowski, A. S., Noss, R. F., and Parsons, D. R. (2010). The effectiveness of surrogate taxa for the representation of biodiversity. Conserv. Biol. 24 (5), 1367–1377. doi:10.1111/j.1523-1739.2010.01513.x
Machado, R. B., Aguiar, L., and Jones, G. (2017). Do acoustic indices reflect the characteristics of bird communities in the savannas of Central Brazil? Landsc. Urban Plan. 162, 36–43. doi:10.1016/j.landurbplan.2017.01.014
Mammides, C., Goodale, E., Dayananda, S. K., Kang, L., and Chen, J. (2017). Do acoustic indices correlate with bird diversity? Insights from two biodiverse regions in Yunnan Province, south China. Ecol. Indic. 82, 470–477. doi:10.1016/j.ecolind.2017.07.017
Metcalf, O. C., Barlow, J., Devenish, C., Marsden, S., Berenguer, E., and Lees, A. C. (2020a). Acoustic indices perform better when applied at ecologically meaningful time and frequency scales. Methods Ecol. Evol. 12 (3), 421–431. doi:10.1111/2041-210X.13521
Montgomery, D. C., and Peck, E. A. (1992). Introduction to linear regression analysis. New York, USA: Wiley.
Moreno-Gómez, F. N., Bartheld, J., Silva-Escobar, A. A., Briones, R., Márquez, R., and Penna, M. (2019). Evaluating acoustic indices in the Valdivian rainforest, a biodiversity hotspot in South America. Ecol. Indic. 103, 1–8. doi:10.1016/j.ecolind.2019.03.024
Myers, D., Berg, H., and Maneas, G. (2019). Comparing the soundscapes of organic and conventional olive groves: a potential method for bird diversity monitoring. Ecol. Indic. 103, 642–649. doi:10.1016/j.ecolind.2019.04.030
Myers, N., Mittermeier, R. A., Mittermeier, C. G., Da Fonseca, G. A., and Kent, J. (2000). Biodiversity hotspots for conservation priorities. Nature 403 (6772), 853–858. doi:10.1038/35002501
Oliveira, E. G., Ribeiro, M. C., Roe, P., and Sousa-Lima, R. S. (2021). The Caatinga Orchestra: acoustic indices track temporal changes in a seasonally dry tropical forest. Ecol. Indic. 129, 107897. doi:10.1016/j.ecolind.2021.107897
Padoa-Schioppa, E., Baietto, M., Massa, R., and Bottoni, L. (2006). Bird communities as bioindicators: the focal species concept in agricultural landscapes. Ecol. Indic. 6, 83–93. doi:10.1016/j.ecolind.2005.08.006
Pieretti, N., Farina, A., and Morri, D. (2011a). A new methodology to infer the singing activity of an avian community: the Acoustic Complexity Index (ACI). Ecol. Indic. 11, 868–873. doi:10.1016/j.ecolind.2010.11.005
Pijanowski, B. C., Farina, A., Gage, S. H., Dumyahn, S. L., and Krause, B. L. (2011). What is soundscape ecology? An introduction and overview of an emerging new science. Landsc. Ecol. 26, 1213–1232. doi:10.1007/s10980-011-9600-8
Rezende, C. L., Scarano, F. R., Assad, E. D., Joly, C. A., Metzger, J. P., Strassburg, B. B. N., et al. (2018). From hotspot to hopespot: an opportunity for the Brazilian Atlantic Forest. Perspect. Ecol. Conserv. 16, 208–214. doi:10.1016/j.pecon.2018.10.002
Ribeiro, J. W., Sugai, L. S. M., and Campos-Cerqueira, M. (2017). Passive acoustic monitoring as a complementary strategy to assess biodiversity in the Brazilian Amazonia. Biodivers. Conservation 26 (12), 2999–3002. doi:10.1007/s10531-017-1390-0
Ribeiro, M. C., Metzger, J. P., Martensen, A. C., Ponzoni, F. J., and Hirota, M. M. (2009). The Brazilian Atlantic Forest: how much is left, and how is the remaining forest distributed? Implications for conservation. Biol. Conserv. 142, 1141–1153. doi:10.1016/j.biocon.2009.02.021
Ross, S. R. P. J., Friedman, N. R., Yoshimura, M., Yoshida, T., Donohue, I., and Economo, E. P. (2020). Utility of acoustic indices for ecological monitoring in complex sonic environments. Ecol. Indic. 121, 107114. doi:10.1016/j.ecolind.2020.107114
Scarpelli, M. D., Ribeiro, M. C., and Teixeira, C. P. (2021). What does Atlantic Forest soundscapes can tell us about landscape? Ecol. Indic. 121, 107050. doi:10.1016/j.ecolind.2020.107050
Schmeller, D. S., Böhm, M., Arvanitidis, C., Barber-Meyer, S., Brummitt, N., Chandler, M., et al. (2017). Building capacity in biodiversity monitoring at the global scale. Biodivers. Conserv. 26, 2765–2790. doi:10.1007/s10531-017-1388-7
Shamon, H., Paraskevopoulou, Z., Kitzes, J., Card, E., Deichmann, J. L., Boyce, A. J., et al. (2021). Using ecoacoustics metrices to track grassland bird richness across landscape gradients. Ecol. Indic. 120, 106928. doi:10.1016/j.ecolind.2020.106928
Shonfield, J., and Bayne, E. M. (2017). Autonomous recording units in avian ecological research: current use and future applications. Avian Conserv. Ecol. 12, art14. doi:10.5751/ACE-00974-120114
Stowell, D., and Sueur, J. (2020). Ecoacoustics: acoustic sensing for biodiversity monitoring at scale. Remote Sens. Ecol. Conserv. 6, 217–219. doi:10.1002/rse2.174
Sueur, J., Aubin, T., and Simonis, C. (2008). Sound analysis and synthesis with the package Seewave. Bioacoustics 18, 213–226. doi:10.1080/09524622.2008.9753600
Sueur, J., Farina, A., Gasc, A., Pieretti, N., and Pavoine, S. (2014a). Acoustic indices for biodiversity assessment and landscape investigation. Acta Acust. united Acust. 100, 772–781. doi:10.3813/AAA.918757
Sueur, J., Pavoine, S., Hamerlynck, O., and Duvail, S. (2008). Rapid acoustic survey for biodiversity appraisal. PLoS One 3, e4065. doi:10.1371/journal.pone.0004065
Sugai, L. S. M., Silva, T. S. F., Ribeiro, J. W., and Llusia, D. (2019). Terrestrial passive acoustic monitoring: review and perspectives. BioScience 69 (1), 15–25. doi:10.1093/biosci/biy147
Sunrise-and-sunset (2023). Sunrise-and-sunset.com. Available at: https://www.sunrise-and-sunset.com/pt/sun/brasil/sao-paulo/2016/outubro (acessed 10, 2023).
Towsey, M., Wimmer, J., Williamson, I., and Roe, P. (2014). The use of acoustic indices to determine avian species richness in audio-recordings of the environment. Ecol. Inf. 21, 110–119. doi:10.1016/j.ecoinf.2013.11.007
Ulloa, J. S., Aubin, T., Llusia, D., Bouveyron, C., and Sueur, J. (2018). Estimating animal acoustic diversity in tropical environments using unsupervised multiresolution analysis. Ecol. Indic. 90, 346–355. doi:10.1016/j.ecolind.2018.03.026
Vale, M. M., Tourinho, L., Lorini, M. L., Rajão, H., and Figueiredo, M. S. L. (2018). Endemic birds of the Atlantic Forest: traits, conservation status, and patterns of biodiversity. J. F. Ornithol. 89, 193–206. doi:10.1111/jofo.12256
Villanueva-Rivera, L. J., Pijanowski, B. C., Doucette, J., and Pekin, B. (2011). A primer of acoustic analysis for landscape ecologists. Landsc. Ecol. 26, 1233–1246. doi:10.1007/s10980-011-9636-9
Villanueva-Rivera, L. J., Pijanowski, B. C., Luis, M., and Villanueva-Rivera, J. (2016). Package “soundecology” title soundscape ecology. Available at: http://cran.r-project.org/web/packages/soundecology/soundecology.pdf.
Wimmer, J., Towsey, M., Roe, P., and Williamson, I. (2013). Sampling environmental acoustic recordings to determine bird species richness. Ecol. Appl. 23, 1419–1428. doi:10.1890/12-2088.1
Wrege, P. G., Rowland, E. D., Keen, S., and Shiu, Y. (2017). Acoustic monitoring for conservation in tropical forests: examples from forest elephants. Methods Ecol. Evol. 8, 1292–1301. doi:10.1111/2041-210X12730
Zhao, Z., Xu, Z. yong, Bellisario, K., Zeng, R. wen, Li, N., Zhou, W. yang, et al. (2019). How well do acoustic indices measure biodiversity? Computational experiments to determine effect of sound unit shape, vocalization intensity, and frequency of vocalization occurrence on performance of acoustic indices. Ecol. Indic. 107, 105588. doi:10.1016/j.ecolind.2019.105588
Keywords: passive acoustic monitoring, ecoacoustics, acoustic surveys, long-term monitoring, long-term ecological research, acoustic remote sensing, Atlantic Forest, tropical ecology
Citation: Gaspar LP, D. A. Scarpelli M, Oliveira EG, Alves RS-C, Gomes AM, Wolf R, Ferneda RV, Kamazuka SH, Gussoni COA and Ribeiro MC (2023) Predicting bird diversity through acoustic indices within the Atlantic Forest biodiversity hotspot. Front. Remote Sens. 4:1283719. doi: 10.3389/frsen.2023.1283719
Received: 26 August 2023; Accepted: 10 November 2023;
Published: 07 December 2023.
Edited by:
Alex Kenneth Piel, University College London, United KingdomReviewed by:
Thiago Bicudo, Rainforest Connection, BrazilZhao Zhao, Nanjing University of Science and Technology, China
Copyright © 2023 Gaspar, D. A. Scarpelli, Oliveira, Alves, Gomes, Wolf, Ferneda, Kamazuka, Gussoni and Ribeiro. This is an open-access article distributed under the terms of the Creative Commons Attribution License (CC BY). The use, distribution or reproduction in other forums is permitted, provided the original author(s) and the copyright owner(s) are credited and that the original publication in this journal is cited, in accordance with accepted academic practice. No use, distribution or reproduction is permitted which does not comply with these terms.
*Correspondence: Lucas P. Gaspar, bHVjYXMucGFjY2l1bGxpb0B1bmVzcC5icg==