 Guoliang Wang
 Min Liu1
 Hongtao Xue
 Erhu Guo
 Aiying Zhang
- 1Millet Research Institute, Shanxi Agricultural University, Changzhi, China
- 2College of Agriculture, Shanxi Agricultural University, Jinzhong, China
The levels of amylose and amylopectin in foxtail millet are important factors that influence grain quality. The application of organic fertilizers can affect the ratio of amylose and amylopectin components. These components are typically determined using chemical analysis methods, which are difficult to apply on a large scale for nutrient deficiency diagnosis and do not meet the original intention of precise agricultural development. This study set up five different gradient treatments for organic fertilizer (sheep manure) application. Hyperspectral imaging combined with chemometrics was employed to achieve rapid and non-destructive detection of the content of amylose and amylopectin in foxtail millet flour. The aim of this study was to determine the optimal dosage of organic fertilizers for application. Spectral data preprocessing used multiplicative scatter correction (MSC), and the combined algorithm of competitive adaptive reweighted sampling (CARS), random frog (RF), and iterated retaining informative variables (IRIVs) was employed for key band extraction. Partial least squares regression (PLSR) was then used to establish the prediction model and regression equation, which was used to visualize the two components. Results demonstrated that the key band extraction combined algorithm effectively reduced data dimension without compromising the accuracy of the prediction model. The prediction model for amylose using MSC–RF–IRIV–PLSR exhibited good performance, with the correlation coefficient (R) and root mean square error (RMSE) predicted to be 0.73 and 1.23 g/(100 g), respectively. Similarly, the prediction model for amylopectin using MSC–CARS–IRIV–PLSR also demonstrated good performance, with the R and RMSE values predicted to be 0.59 and 7.34 g/(100 g), respectively. The results of visualization and physicochemical determination showed that the amount of amylopectin accumulation was highest, and the amount of amylose was lowest, under the application of 22.5 t/ha of organic fertilizer. The experimental results offer valuable insights for the rapid detection of nutritional components in foxtail millet, serving as a basis for further research.
1 Introduction
Foxtail millet (Setaria italica) is recognized as one of the world’s oldest cultivated crops, with a history spanning over two millennia (Shi et al., 2019; Lv et al., 2023). This cereal is particularly significant in northern China due to its short reproductive cycle, strong storage capability, drought resistance, and tolerance to saline-alkaline soils (Wang FX. et al., 2022; Hou et al., 2022). As a valuable crop, foxtail millet is ideally suitable for cultivation in arid and semi-arid regions (Arora et al., 2023). Compared to staple cereals such as rice, wheat, and corn, foxtail millet is not only rich in various health-promoting nutrients, dietary fiber, antioxidants, macronutrients, and micronutrients but it is also a gluten-free grain with a low glycemic index (Sachdev et al., 2021). The primary edible component of foxtail millet is starch, which constitutes approximately 70% of its total content (Kumar et al., 2022; Mahajan et al., 2021; Kaimal et al., 2021). This starch is composed of two polysaccharides, namely, amylose and amylopectin (Lv et al., 2023). The ratio of these components significantly influences the quality of foxtail millet (Xing et al., 2023; Annor et al., 2014), with a lower amylose proportion contributing to increased stickiness and glossiness, while a higher proportion leads to dryness, darker coloration, and diminished palatability (Aprodu and Banu, 2021). Consequently, the sensory attributes and quality of foxtail millet directly affect its market pricing and sales volume. To optimize the yield and quality of foxtail millet, it is crucial to implement appropriate cultivation strategies, considering factors such as variety genetics, growing environment, and agronomic practices (Sun et al., 2021). Among these, fertilization practices play a vital role in regulating the quality of foxtail millet. The application of organic fertilizers, as sustainable alternatives to chemical fertilizers, can mitigate the adverse effects of soil acidification on crop quality while also enhancing the appearance and palatability of foxtail millet (Sun et al., 2022). Furthermore, the development of rapid detection methods for amylose and amylopectin content in foxtail millet is of significant practical importance for product processing and quality evaluation.
With the sustainable development of modern agriculture, organic fertilizers have garnered increasing attention from researchers in agricultural production (Wang et al., 2020a). The appropriate application of organic fertilizers enhances soil fertility, improves soil structure, increases microbial populations, mitigates soil pollution, and bolsters crop resilience (Das et al., 2017). Compared to chemical fertilizers, organic fertilizers provide a more balanced nutrient profile, facilitating optimal nutritional balance in crops and improving their overall quality (He et al., 2022; Seufert et al., 2012). Crops cultivated with organic fertilizers yield products that are not only more nutritious and flavorful but also healthier and more environmentally friendly. This aligns with the increasing consumer demand for healthy food and the overarching trends in modern agricultural development. Recent studies have demonstrated the positive effects of organic fertilizers on the quality of foxtail millet. Tao et al. (2023) investigated the influence of varying proportions of organic fertilizers on the physicochemical properties and in vitro digestibility of buckwheat starch, revealing that a combined application of chemical fertilizers, organic fertilizers, and biochar enhances the quality of common buckwheat grains. Zhao et al. (2023a) found that varying proportions of organic fertilizers affect the appearance quality of foxtail millet and the content of major nutrients and trace elements. This highlights the potential of organic fertilizers to enhance the nutritional quality of foxtail millet. Currently, traditional chemical detection methods, such as titration (Liu and Liu, 2020), spectrophotometry (Wang et al., 2010), chromatography (Weng et al., 2018), optical rotation (Zhou et al., 2016), and thermogravimetric analysis (Tian et al., 2011), are predominantly employed for the compositional analysis of foxtail millet starch (Li KH. et al., 2019; Abedin et al., 2022; Verma et al., 2015). Although these methods are reliable, they are often cumbersome and costly, limiting their applicability for rapid detection. In contrast, hyperspectral imaging has emerged as a rapid detection technology that merges imaging and spectral analysis (Wu and Sun, 2013; Xia et al., 2019; Saha and Manickavasagan, 2021; Pu et al., 2019). This technique has been extensively utilized for the qualitative classification and quantitative detection of components in agricultural products (Tsai et al., 2007; Zou et al., 2010; Bonah et al., 2019; Huang et al., 2016; Kong et al., 2013; Gao et al., 2013). Hyperspectral imaging technology can reflect the growing conditions, physiological and ecological parameters, and nutritional quality of crops through the reflected spectral information. Zhang et al. (2022) employed hyperspectral imaging combined with chemometric analysis to identify selenium-sensitive wavelengths, enabling rapid and non-destructive detection of selenium-rich foxtail millet. Wang et al. (2022b) established a predictive model correlating spectral data with the grain starch content and leaf water content using an intersection method. Zhao et al. (2023b) conducted visual monitoring of the nitrogen content in tomato leaves under different fertilizer ratios, demonstrating the potential of hyperspectral imaging technology for fertilizer ratio diagnosis and rapid component estimation. Hyperspectral imaging technology can also provide information on foxtail millet quality, such as crude fat, crude protein, starch, and trace elements. Such information allows for the assessment of different fertilizer strategies for foxtail millet quality. Hyperspectral data comprise a vast array of narrow-band spectral information, resulting in high dimensionality. Additionally, the spectral reflectance signals produced by functional groups of substances may overlap within individual bands, complicating data analysis (Wang et al., 2016). To reduce the dimensionality of the variables and enhance the predictive accuracy of the model, the key band extraction combination algorithms are typically employed to select the important spectral bands from the target variable dataset. Zhao et al. (2019) utilized the competitive adaptive reweighted sampling (CARS) method to extract key bands from full spectral data on two types of whole wheat flour and established partial least squares regression (PLSR) models for adulteration testing, achieving high prediction accuracies with coefficients of determination (R2) of 0.993 and 0.991, respectively. Yang et al. (2023) applied the MSC–IRIV–RSEL model to select optimal hyperspectral wavelengths for maize seed and purity detection, presenting a novel method for maize seed quality assessment using hyperspectral technology. Currently, combined algorithms for key band extraction are being increasingly adopted. Yu et al. (2021) proposed a three-step combined strategy for selecting near-infrared spectral wavelengths, enhancing model prediction accuracy while leveraging the strengths of various algorithms and addressing their limitations.
In this work, we conducted a gradient experiment to investigate the effects of different organic fertilizer application rates on the contents of amylose and amylopectin in foxtail millet flour. A total of 358 foxtail millet flour samples were collected, along with their corresponding hyperspectral data. Traditional chemical methods were employed to determine the amylose and amylopectin contents in the samples, enabling the identification of the optimal organic fertilizer application rate. To mitigate the impact of data redundancy, we proposed a “coarse-to-fine” key band extraction strategy and developed predictive models for the amylose and amylopectin contents in foxtail millet flour based on this approach. By integrating hyperspectral imaging information, detection models, and chemical measurements, we achieved a visual representation of the component distribution in foxtail millet flour. This work aims to establish a predictive model for amylose and amylopectin contents using an optimized combination of key band extraction algorithms, providing a theoretical basis for rapid detection. Figure 1 illustrates the workflow of this work.
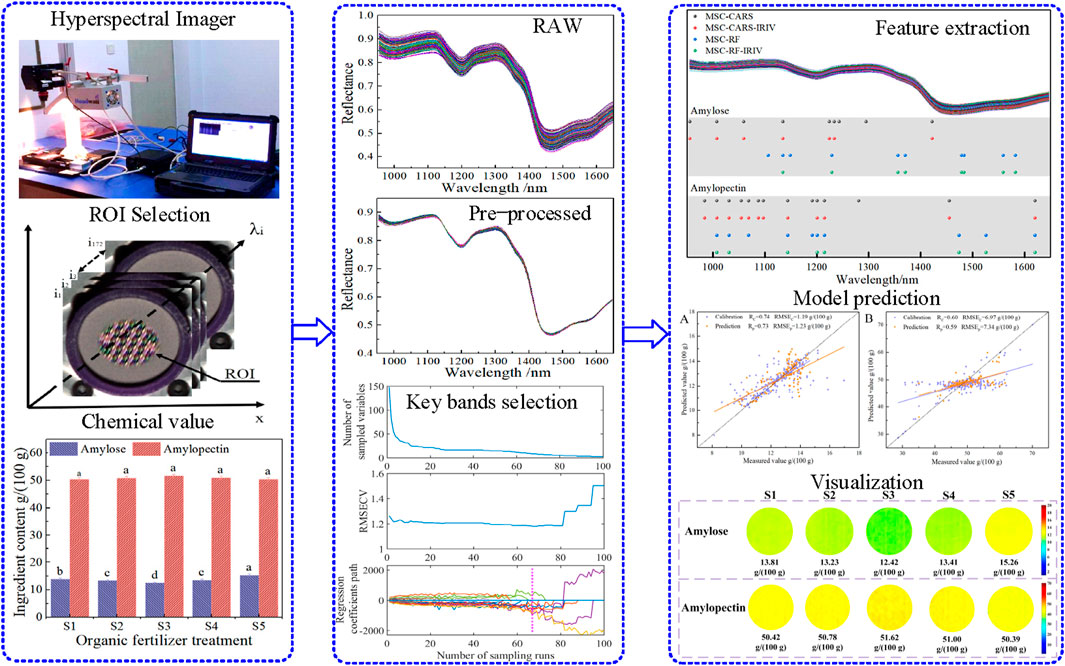
Figure 1. Analysis process flow chart.
2 Materials and methods
2.1 Experimental materials
The experimental variety of foxtail millet selected for this study is Changsheng 13, which was bred by the foxtail millet team at the Foxtail Millet Research Institute of Shanxi Agricultural University. The experimental area spans 3,000 m2 and is situated in Puzhang village, Wuxiang County, Shanxi Province, China (36°45′48.66″N, 112°55′59.57″E). The area boasts an average elevation of 953 m above sea level and features a warm, temperate, continental climate. It has an annual average temperature of 9.3°C and a frost-free period of 150 days. The mean annual precipitation is 580 mm. The soil type in the area is classified as red soil, possessing a pH value of 7.4. Prior to conducting the experiment, the basic fertility of the soil was assessed. The soil moisture content at the pre-planting stage for the basal fertility soil was recorded as 15.9%. The soil contained 58.67 mg/kg of available nitrogen, 15.54 mg/kg of available phosphorus, 95.20 mg/kg of available potassium, and 10.75 g/kg of organic matter. Based on these measurements, the soil fertility is deemed to be at a moderate level. Concurrently, the composition of the organic fertilizer (sheep manure) was analyzed. The results showed that the organic fertilizer contained 42.7% organic matter, 1.86% nitrogen, 1.47% phosphorus, and 2.02% potassium. Five different treatments were established for the application of organic fertilizers: S1 with 15 t/ha of organic fertilizer, S2 with 18.75 t/ha, S3 with 22.5 t/ha, S4 with 26.25 t/ha, and S5 served as the blank control without any organic fertilizer application. Sampling was carried out using the chessboard sampling method, where each processing batch encompassed 72 zones, with each zone covering 2 m2 (Berndt, 2020). Following sun-drying, cleaning, and polishing of the experimental samples, a total of 358 foxtail millet flour samples were obtained. These samples were then sieved through an 80-mesh screen, sealed, and numbered for proper documentation and record-keeping.
2.2 Hyperspectral imaging system
Hyperspectral data acquisition was conducted using a starter kit-type hyperspectral imager supplied by Headwall Photonics (Bolton, MA, United States). This imager comprises a scanning stage, a hyperspectral camera with an aperture of 1.4 and a focal length of 25 mm, a light source, and a portable computer. It offers a spectral range of 900–1700 nm and a spectral resolution of 4.715 nm, capturing a total of 172 spectral bands. The acquisition parameters were configured as follows: the sample surface was positioned 25 mm away from the lens, the stage translation speed was set to 16 mm/s, and the time exposure for the camera was adjusted to 0.9 m.
2.3 Data acquisition
2.3.1 Hyperspectral data acquisition of foxtail millet flour
The experimental samples were placed in vessels with a diameter of 5 cm and a depth of 1 cm to ensure a flat and compact surface for testing. Each sample was measured three times for hyperspectral data collection, and the results were sequentially numbered and saved. Prior to collecting hyperspectral data, a black-and-white correction was applied using Equation 1, with the correction process repeated every three images collected (Wang et al., 2020b). This correction is essential for eliminating noise caused by dark current and uneven light intensity in the hyperspectral camera. By performing the black and white plate correction on the hyperspectral imaging device, the spectrum of the external reference light source can be calibrated, ensuring accurate and reliable hyperspectral data acquisition.
Here, X refers to the corrected hyperspectral images; I refers to the original hyperspectral image; B represents the dark background image with the lens cap closed (<0% reflectance); and W represents the white background image with the standard white calibration plate (>99.9% reflectance).
2.3.2 Measurement of amylose and amylopectin contents in foxtail millet flour
Following the collection of hyperspectral data from the samples, the content of amylose and amylopectin was determined. To minimize errors associated with the single-wavelength spectrophotometry method for starch content determination, the samples underwent a defatting treatment prior to analysis (Sampaio and Lycarião, 2021). Subsequently, the dual-wavelength spectrophotometry method was employed to determine the amylose and amylopectin content (Zhu et al., 2008). The statistical results of the content measurements are presented in Figure 2.

Figure 2. Statistics of the amylose and amylopectin content based on organic fertilizers. Note: Lowercase letters indicate significant differences at the different organic fertilizer application levels, P < 0.05.
2.4 Hyperspectral data analysis
The collected hyperspectral images encompass both spectral and imaging information about the experimental samples. Utilizing ENVI 5.1 software, we extracted spectral data from the regions of interest (ROIs) within these images and computed the average reflectance of each pixel, forming the original dataset for subsequent analyses. Spectral stability can be affected by factors such as grain luster, light scattering, background interference, and baseline drift. To mitigate the discrepancies arising from these influences, we preprocessed the hyperspectral dataset of foxtail millet powder using the Savitzky–Golay (S-G) convolutional filter, standard normalized variable transformation (SNV), and multiplicative scatter correction (MSC). Specifically, these preprocessing methods—S-G, SNV, and MSC—were applied to the foxtail millet flour hyperspectral dataset (Xie et al., 2022).
For the hyperspectral data processing of foxtail millet, the Kennard–Stone algorithm was employed to split the spectral data into training and prediction sets in a 2:1 ratio (Li et al., 2021). Subsequently, a combined algorithm for key band extraction was utilized to identify key spectral bands and establish PLSR models for predicting the amylose and amylopectin content in the samples. The optimal model was selected to develop regression equations and visualize the results. The model evaluation was conducted using the correlation coefficient (R), root mean square error (RMSE), and relative percent deviation (RPD) as performance metrics.
By employing key band extraction, one can effectively mitigate the risk of diminished model prediction capability that arises from redundant variables while simultaneously enhancing variable interpretability (Yun et al., 2019). In our study, a combined key band extraction algorithm is proposed, aiming to minimize the number of variables while maintaining model accuracy and enhancing computational efficiency. This is achieved through a “coarse-to-fine” extraction process. Consequently, CARS–IRIV and RF–IRIV were chosen for key band extraction in this research. Following this, PLSR prediction models were developed to forecast the amylose and amylopectin content in foxtail millet flour.
The CARS method, which simulates Darwin’s theory of evolution’s “survival of the fittest” concept, employs an adaptive reweighted sampling technique to select wavelengths. This selection is based on the absolute regression coefficients calculated by partial least squares regression. Additionally, cross-validation is utilized to identify the combination set with the lowest root mean square error. Given the algorithm’s stochastic nature, multiple iterations are necessary to retain the most frequently selected wavelengths, thereby enhancing the stability of subsequent regression models (Wang et al., 2019).
The computational principle of the CARS algorithm is as follows:
ⅰ) Using the Monte Carlo method, 80% of the samples are randomly selected from the calibration set to form the modeling set, and the remaining samples are used to establish the PLS model. The absolute values of the weights of the regression coefficients are recorded for each sampling. In the Equation 2, ∣bi∣ represents the absolute value of the regression coefficient for the ith variable, and wi represents the absolute value of the weight of the regression coefficient for the ith variable. M represents the number of remaining variables for each sampling.
ⅱ) Using the exponentially decreasing function (EDF), the wavelengths with relatively small absolute value weights of the regression coefficients are forcefully eliminated. When establishing the PLS model based on the Monte Carlo sampling for the ith time, the retained wavelength proportion Ri is obtained according to the EDF.
In the Equation 3, μ and k are constants, which can be calculated in the following two cases:
1) When a single sampling is performed for calculation, all bands participate in the modeling analysis, and Ri = 1.
2) When the last sampling (the Nth time) is completed and calculated, only two bands are left to participate in the modeling. At this time, Ri = 2/n, where n is the original number of bands. Therefore, from the initial and final sampling conditions, In the Equations 4, 5, we can know that μ and k are, respectively, as follows:
3) During each sampling, adaptive reweighted sampling (ARS) is used to select Ri*n bands from the variables in the previous sampling for modeling and calculation of the root mean square error of cross-validation (RMSECV).
4) The sampling number is set to N, the operation is executed, and the variable corresponding to the minimum RMSECV is the selected band.
RF is an intelligent optimization algorithm capable of utilizing a limited number of variables for iterative modeling in high-dimensional data, thereby achieving variable selection. It is characterized by its swift running time and straightforward process. RF calculates the probability of variable selection by simulating a Markov chain that conforms to a steady distribution. This process facilitates the extraction of key bands (He et al., 2017). The computational principle of the RF algorithm is as follows:
ⅰ) Initialize a subset V0 of variables containing Q elements;
ⅱ) Generate a candidate subset V* of Q* variables from the original subset V0 and choose V* by calculating RMSECV between V* and V0. Assign the value of V1 to V* so that ultimately V0 = V1. Iterate the calculation N times to complete the operation;
ⅲ) Calculate the probability of each variable being selected. Variables with high selection probabilities will be selected.
The IRIV algorithm is grounded in the concept of model cluster analysis, taking into full account the combined effect of variables. It randomly combines variables to create a binary matrix, where rows signify variable combinations and columns denote the count of variables. For each row, a PLS model is constructed, and the efficacy of these combined models is assessed using RMSECV. Subsequently, variables are categorized into four types, namely, strong information variables, weak information variables, no information variables, and interference information variables. The determination of retained variables hinges on the difference between mean values (DMEAN) and P-value. DMEAN represents the mean value difference in root mean square error when the wavelength variable is included versus excluded, while the P-value stems from the Mann–Whitney U test. By repeatedly executing the algorithm, invalid and interference variables are eliminated. Through reverse elimination, the optimal feature bands are extracted from the strong and weak information variables (Silva et al., 2022).
3 Results and analysis
3.1 Analysis of physicochemical results of amylose and amylopectin
Current research indicates that foxtail millet with low amylose and high amylopectin content possesses a soft and sticky texture, which translates to higher quality and of significant commercial value (Xie et al., 2022). As depicted in Figure 2, the variations in the quantities of organic fertilizer applied result in discernible differences in the component content of the samples. Notably, the average amylose content was lowest in S3 at 12.42 g/(100 g), exhibiting significant differences compared to the other four treatments. Although there was minimal variation between S2 and S4, both demonstrated significant differences compared to S1 and S5. Despite the average amylopectin content peaking at 51.62 g/(100 g) in S3, no significant difference was observed among the five treatments. The findings reveal that the starch content of foxtail millet undergoes systematic changes under different organic fertilizer treatments, with a more pronounced difference observed in the amylose content compared to the relatively smaller difference in amylopectin content.
3.2 Results of data preprocessing and dataset partitioning
The average spectral curves were plotted by collecting samples under five treatments. Due to the large reflectance error at both ends of the range of a hyperspectral imaging instrument, the spectral data in the range of 950–1,650 nm from each sample are selected as the base spectral data. In this spectral range, the spectral data on the material to be tested contain rich chemical functional group information. It can be observed from Figure 3A that the curves show basically the same trend. The average spectral curves of different organic fertilizer application rates show different reflectance values in each wavelength. The reflectance in the regions of 950–980 nm, 1,100–1,250 nm, and 1,300–1,450 nm shows a decreasing trend. After 1,450 nm, the curves change smoothly. In this wavelength range, the samples’ spectral reflectance is greatly affected by the moisture content. According to Xia et al. (2019), the range of 950–980 nm corresponds to the O-H-combined frequency absorption, 1,100–1,250 nm is the C-H double frequency absorption, and 1,300–1,450 nm is the O-H-combined frequency absorption and N-H single-frequency absorption. These absorption peaks can all reflect the contents of amylose and amylopectin in the samples.
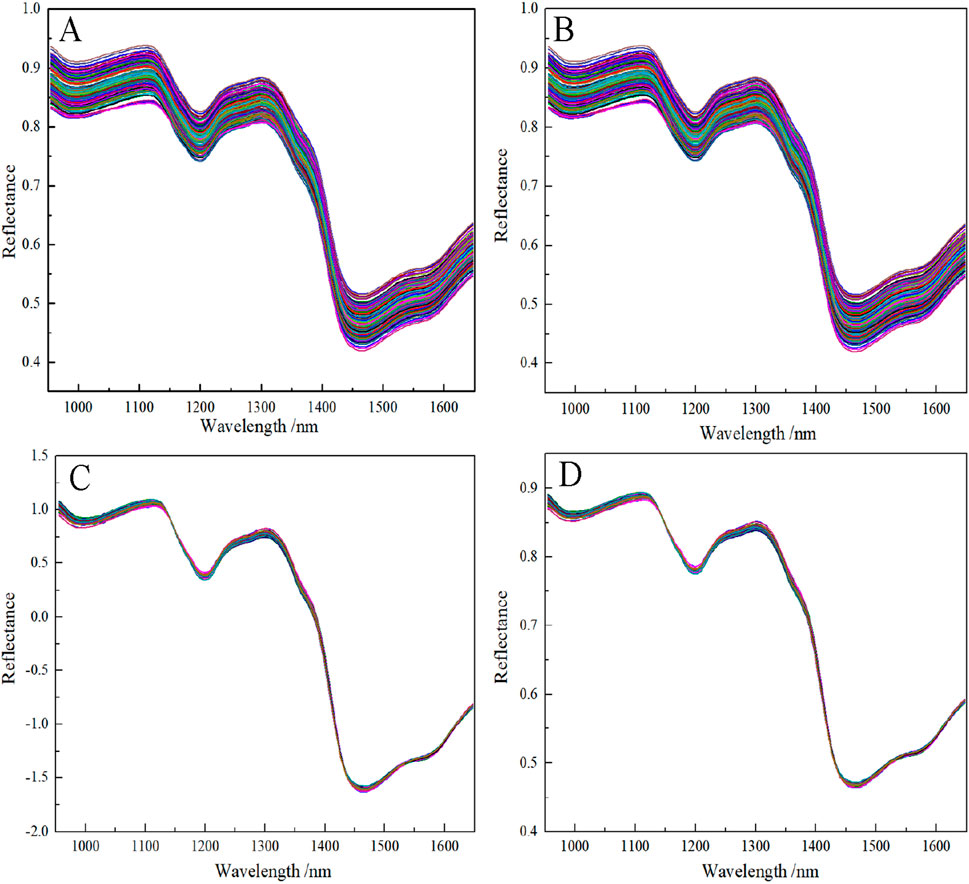
Figure 3. Average spectral curves of foxtail millet flour; (A) the average spectral curve of all samples; (B) S-G preprocessed spectral curve of all samples; (C) SNV preprocessed spectral curve of all samples; (D) MSC preprocessed spectral curve of all samples.
Figures 3B–D display the spectral curves obtained after preprocessing the dataset using S-G, SNV, and MSC, respectively. The results of the PLSR simultaneous detection model are provided in Table 1. Among the methods evaluated, the PLSR model established for amylose and amylopectin exhibits the best performance with MSC preprocessing. For the amylose prediction set, the R and RMSE values were 0.68 and 1.13 g/(100 g), respectively. For the amylopectin prediction set, the R and RMSE values were 0.58 and 7.97 g/(100 g), respectively. The results of the sample dataset partitions using the K-S algorithm are provided in Table 2, where the mean values of the components in both the calibration and prediction sets were close. This indicated that the data division was reasonable.
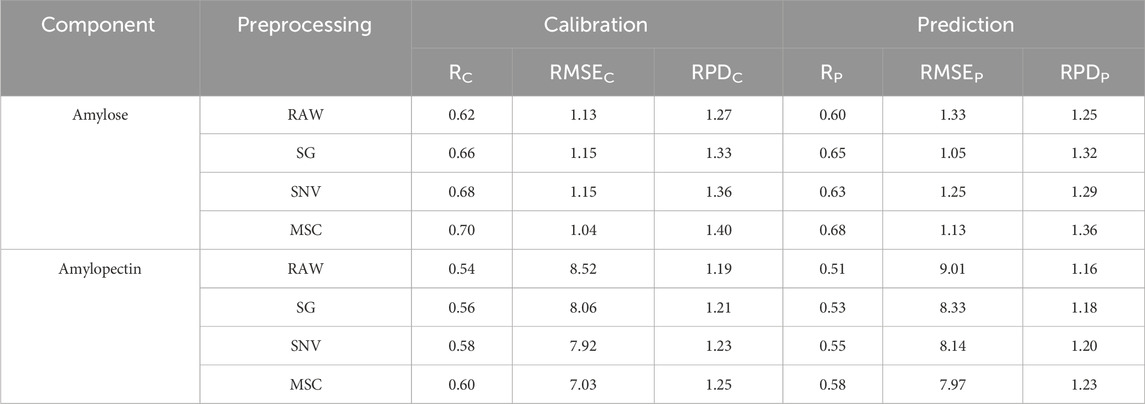
Table 1. PLSR of preprocessing from amylose and amylopectin of foxtail millet flour.
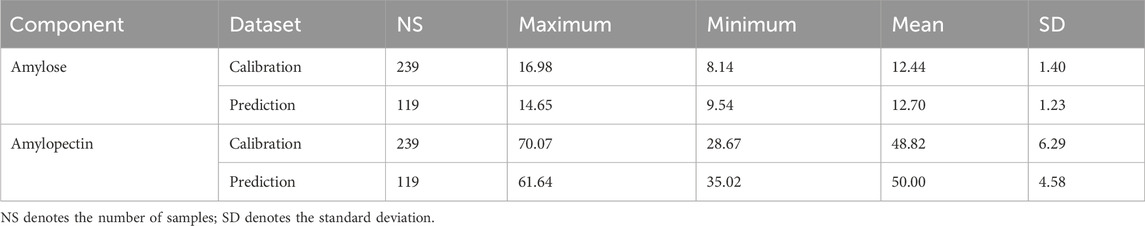
Table 2. Partition results of the dataset for the content (g/(100 g) of amylose and amylopectin using the K-S algorithm.
3.3 PLSR model for key band extraction
Figures 4A–F describe the process of key band extraction for amylose and amylopectin using the CARS algorithm. As the number of MCS runs increases, the number of sampled variables, the RMSECV, and the regression coefficient pathway exhibit changes. Initially, the selected variables demonstrated an exponential decrease, which then stabilized. The trend of RMSECV, which first decreased and then increased, subsequently indicated that the variables initially eliminated during the selection process were unrelated to the component of interest, followed by the inclusion of irrelevant variables. By retaining more effective wavelengths at the marked positions, RMSECV reached its minimum, leading to the formation of the optimal variable set. For amylose, when the sampling frequency was 68, the minimum RMSECV was 1.19 g/(100 g), and at this point, a detection model was established using nine variables in the subset. For amylopectin, when the sampling frequency was 52, the minimum RMSECV was 9.18 g/(100 g), and at this point, a detection model was established using 14 variables in the subset.
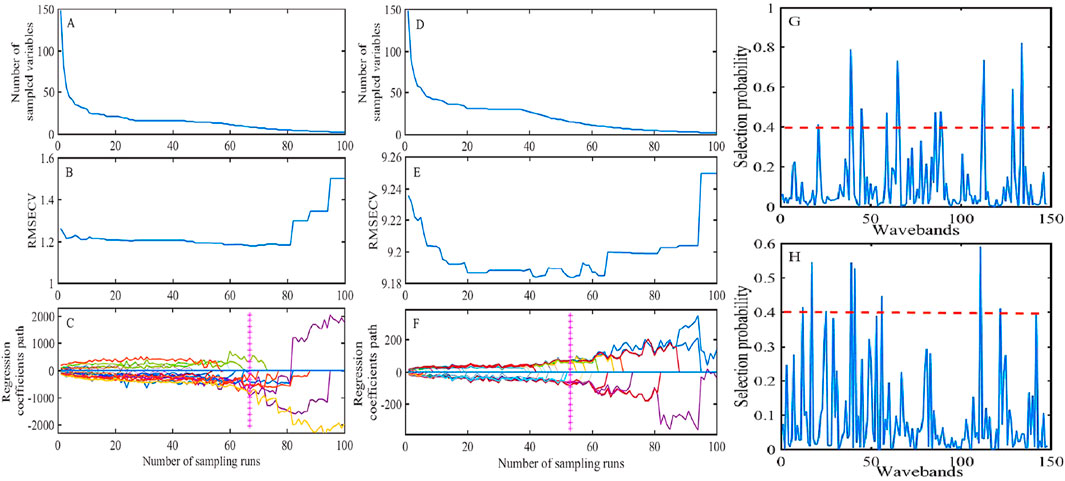
Figure 4. Key band extraction using the CARS and RF algorithm; (A–F) key band extraction by RF; (G, H) key band extraction by CARS; (A–C, G) key band extraction for amylose; (D–F, H) key band extraction for amylopectin; (A, D) changing trend of the number of sampled variables; (B, E) variation in the root-mean-square error of cross-validation values; and (C, F) regression coefficients of each variable with increasing sampling runs.
Figures 4G, H depict the key band extraction process for amylose and amylopectin using the RF algorithm, respectively. The RF algorithm selected 0.4 as the threshold for key band extraction. The selection probability (SP) was used as the criterion to evaluate the likelihood of each wavelength being chosen. As a result, nine key bands were selected for amylose, while 10 key bands were selected for amylopectin.
The IRIV was applied for fine key band extraction, following the coarse extraction with CARS and RF. The results indicated that the coarse extracted band set comprised only strong and weak informative variables, without any non-informative or interfering variables. This underscores the advantages of CARS and RF in key band extraction, further emphasizing the crucial role of weak informative variables in model construction. By applying IRIV to reverse the elimination of strong and weak information variables, the optimal subset of key bands was obtained. For amylose, after coarse extraction with CARS and RF, two wavelengths were removed from the variable set. For amylopectin, one wavelength and two wavelengths were removed, respectively. Notably, the removed key bands were all weak informative variables. Based on the combined algorithm of key band extraction, the spectral data extraction was carried out using MSC–CARS, MSC–CARS–IRIV, MSC–RF, and MSC–RF–IRIV algorithms, and Figure 5 shows the extraction results.
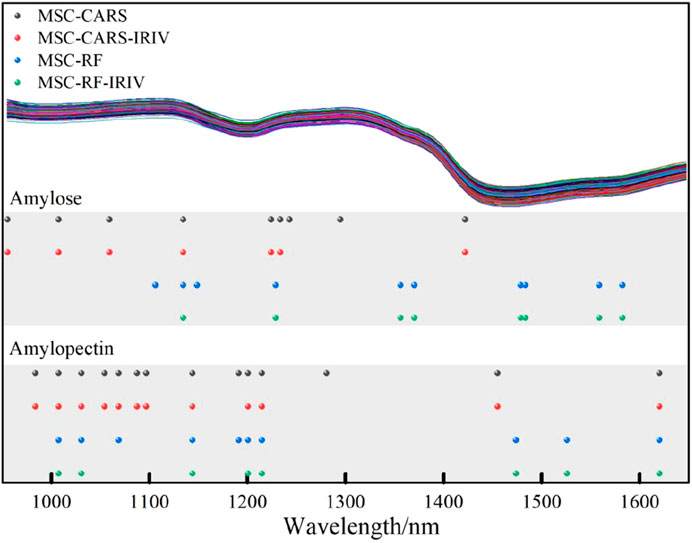
Figure 5. Key band extraction by the key band extraction-combined algorithm.
The amylose models using MSC–CARS–IRIV and MSC–RF–IRIV retained seven and eight feature bands, respectively. For amylopectin, the models retained 12 and 8 key bands, respectively. The number of variables was less than that extracted without the combined algorithm of key band extraction. Under the condition of ensuring the accuracy of the prediction model, this approach also simplifies the modeling process. For the extracted key bands, PLSR models were established separately. Table 3 shows the PLSR models established by the combined algorithm of key band extraction.
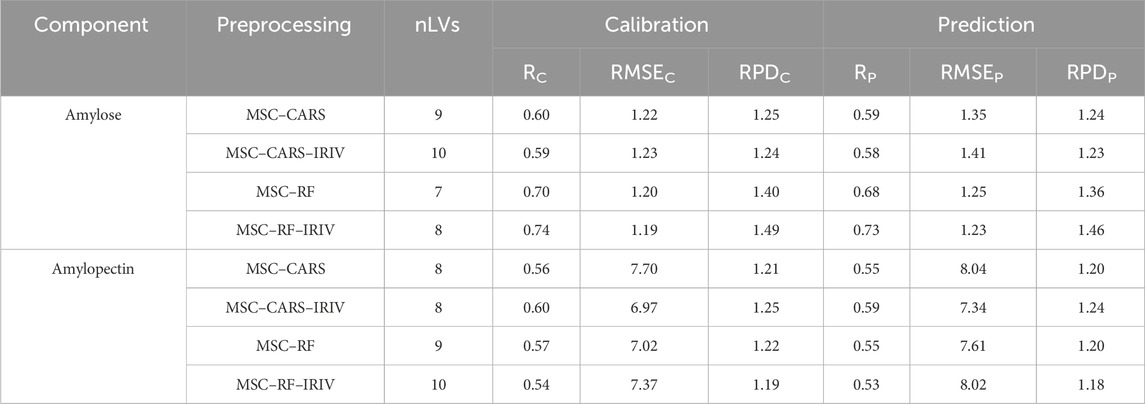
Table 3. PLSR of key band extraction from amylose and amylopectin of foxtail millet flour.
The PLSR model established after applying the combined algorithm of the key band extraction demonstrated slightly improved performance compared to those obtained through the individual algorithm of key band extraction. Overall, the prediction accuracy for amylose was better than that for amylopectin. Specifically, the MSC–RF–IRIV–PLSR model for amylose exhibited a predicted RP value of 0.73 and an RMSEP value of 1.23 g/(100 g). In contrast, the MSC–CARS–IRIV–PLSR model for amylopectin achieved an RP value of 0.59 and an RMSEP value of 7.34 g/(100 g). The comparison of the predicted and measured values of the model for both amylose and amylopectin is shown in Figure 6. The regression equation for amylose is shown in Equation 6, and the regression equation for amylopectin is presented in Equation 7. In the following, the regression equations will be utilized to visualize the changes in the content of amylose and amylopectin in foxtail millet flour under different organic fertilizer application rates.
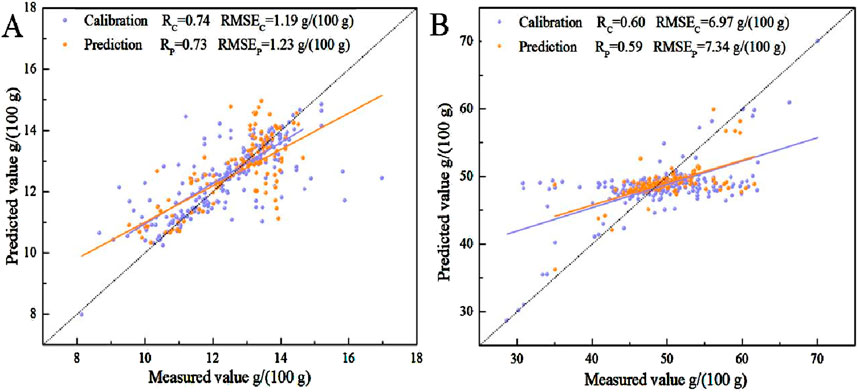
Figure 6. Calibration and prediction results of the detection model; (A) amylose and (B) amylopectin.
3.4 Visualization of amylose and amylopectin content in foxtail millet flour
Using the regression equations, the visualization of the changes in the contents of amylose and amylopectin in foxtail millet flour was expressed. Figure 7 shows the visualization images of the content of amylose and amylopectin in foxtail millet flour under different organic fertilizer application rates. Overall, it can be observed from the figure that the visualization of the content of amylose shows a gradual change among the treatments, while the visualization of the content of amylopectin was slightly higher only in S3. Among them, S3 has the lowest content of amylose and the highest content of amylopectin, while S5 has the highest content of amylose and the lowest content of amylopectin.
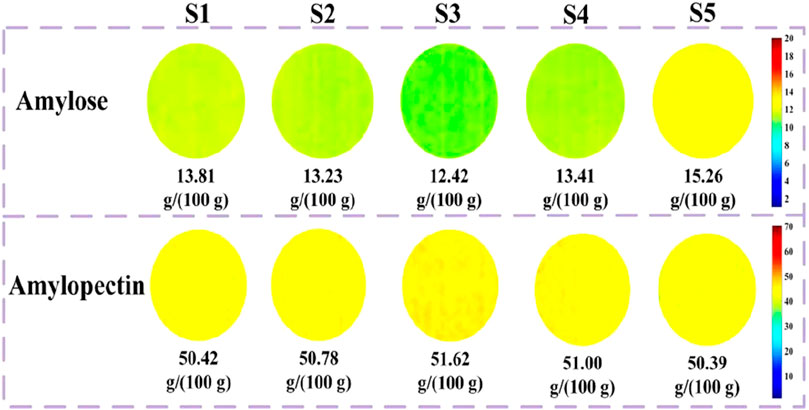
Figure 7. Comparison of amylose and amylopectin content by visualization.
4 Conclusion
Organic fertilizers significantly enhance the grain quality, as evidenced by studies such as that conducted by Sun et al. (2022), which found that substituting chemical fertilizers with organic fertilizers boosts the nutrient content and palatability of foxtail millet. In our research, hyperspectral imaging and chemometrics were integrated to establish various rates of organic fertilizer application. Consequently, 358 samples of foxtail millet flour were collected to assess the amylose and amylopectin content. The CARS algorithm leveraged the EDF to eliminate wavelength coefficients with minimal regression coefficients, thus refining the key band extraction process (Wang et al., 2019). Specifically, the key bands for amylose and amylopectin represented 6.08% (9/148) and 9.46% (14/148) of the total wavelengths, respectively. On the other hand, the RF algorithm employed a global search strategy within the feature space to explore diverse feature combinations (He et al., 2017). It executed multiple random selections, focusing on highly correlated features, thereby exhibiting robustness and adaptability. Consequently, the key bands for amylose and amylopectin constituted 6.08% (9/148) and 6.76% (10/148) of the total wavelengths, respectively. The IRIV algorithm utilizes the Mann–Whitney U test to discern variable characteristics (Li GY. et al., 2019), ensuring that the optimal variable set excludes non-informative and interfering variables. This suggests that both CARS and RF algorithms possess certain advantages in key band extraction. Through the reverse elimination of the variable set, the optimal variable combination was identified, leading to the establishment of a PLSR detection model. The optimal model for amylose was MSC–RF–IRIV–PLSR, with the key band accounting for 5.41% (8/148) of the total wavelengths. Conversely, the best model for amylopectin was MSC–CARS–IRIV–PLSR, with the key band comprising 8.11% (12/148) of the total wavelengths. Additionally, the study revealed that weakly informative variables played a pivotal role in the combination, effectively enhancing the model’s predictive performance. This underscores the reliability of the “coarse-to-fine” key band extraction strategy proposed in this research.
In the past, researchers primarily utilized hyperspectral imaging for classifying foxtail millet varieties and detecting nutritional components (Zhang et al., 2022; Ji et al., 2019; Zhang et al., 2023). The detection model for amylose identifies key bands at wavelengths 1,134 and 1,228 nm, which are situated within the C-H secondary harmonic absorption region. The bands at 1,355 and 1,370 nm belong to the combined frequency absorption region. Additionally, the bands at 1,478, 1,483, 1,558, and 1,582 nm are within the N-H primary harmonic absorption region. On the other hand, the detection model for amylopectin highlights a key band at 983 nm, which is located in the free O-H secondary harmonic absorption region. The bands at 1,007, 1,030, 1,054, 1,068, 1,087, and 1,096 nm are part of the combined O-H secondary harmonic absorption. Furthermore, the bands at 1,143, 1,200, and 1,214 nm are within the C-H secondary harmonic absorption, while the band at 1,454 falls into the combined frequency absorption range, and the band at 1,619 nm is within the N-H primary harmonic absorption (Wang et al., 2022a). This conclusion aligns with the findings of Zhang et al. (2022) and Wang et al. (2022a), who used spectroscopic techniques to screen spectral wavelengths related to foxtail millet nutrient components. All these selected key bands correspond to chemical groups associated with amylose and amylopectin content. The combined key band extraction algorithm effectively eliminates redundant bands and reduces data dimensions while preserving as much spectral information related to amylose and amylopectin as feasible.
The visualization results have demonstrated the accumulation of amylose and amylopectin in foxtail millet flour under various organic fertilizer application rates. This is attributed to the good adaptability of the chosen experimental variety, where amylopectin serves as the primary nutritional component, with its content varying based on the stable expression of genes. The detection model has successfully achieved accurate prediction results for amylose content, and the visualization of its accumulation reveals notable differences under various organic fertilizer treatments, which correlate well with the results obtained through physical and chemical measurements. Although the prediction performance for amylopectin content is less ideal, with some deviation in visualizing its accumulation, qualitative judgments regarding the accumulation of both amylose and amylopectin in foxtail millet can still be made through visualizations. The visualizations shown in Figure 7 further confirm the good stress resistance of the experimental samples. When combined with the detection results of amylose and amylopectin content in foxtail millet flour shown in Figure 2, it can be concluded that under the optimal organic fertilizer application rate, the content of amylose is relatively low, while the content of amylopectin is high, as visually reflected in the visualizations. By integrating physicochemical analysis with visualizations, it can be qualitatively determined that S3 (22.5 t/ha) treatment represents the best organic fertilizer application.
5 Discussion
This study examines foxtail millet flour under various organic fertilizer application rates, utilizing hyperspectral technology combined with chemometric methods to predict and visualize the amylose and amylopectin content with the flour. Spectral data preprocessing involved employing the MSC method alongside a combined algorithm for key band extraction, specifically tailored for sample spectral data, to establish PLSR models. The optimal algorithms for extracting key bands from the spectral data of amylose and amylopectin were identified as MSC–RF–IRIV–PLSR and MSC–CARS–IRIV–PLSR, respectively. The predictive performance of these models was evaluated, with the predicted RP values reaching 0.73 for amylose and 0.59 for amylopectin. Meanwhile, the RMSEP values were 1.23 g/(100 g) for amylose and 7.34 g/(100 g) for amylopectin. Using the regression equations derived from these models, visualization expressions were developed. The results revealed that the amylose content undergoes significant changes in response to different organic fertilizer application rates. In contrast, the amylopectin content was best represented under S3 treatment. These findings offer valuable insights into the impact of organic fertilizer application on the nutritional composition of foxtail millet flour.
In conclusion, this data analysis approach offers a viable solution for multidimensional reduction and visualization component content. The research findings provide theoretical backing for the simultaneous and rapid hyperspectral detection of nutritional components in foxtail millet flour. Organic fertilizers, serving as alternatives to chemical fertilizers, possess characteristics such as nutrient richness, soil structure improvement, and environmental friendliness. They not only furnish crops with vital nutrients but also elevate grain quality. Hyperspectral imaging technology holds the advantage of non-destructive testing, furnishing abundant chemical information conducive to multi-parameter analysis. Thus, by integrating hyperspectral imaging technology, it becomes feasible to diagnose the abundance or deficiency of nutrient components in crops and deduce their quality. Notably, the accuracy of visualization is intricately linked to the quantitative detection model, thereby rendering the establishment of a high-precision detection model a prerequisite and cornerstone for precise visualization.
Data availability statement
The raw data supporting the conclusions of this article will be made available by the authors, without undue reservation.
Author contributions
GW: conceptualization, data curation, investigation, methodology, writing–original draft, and writing–review and editing. ML: data curation, formal analysis and writing–original draft. HX: investigation, resources, and writing–original draft. EG: conceptualization, formal analysis, and writing–original draft. AZ: conceptualization, funding acquisition, methodology, and writing–review and editing.
Funding
The author(s) declare that financial support was received for the research, authorship, and/or publication of this article. This study was funded by Shanxi Agricultural University “Talent Introduction Research Start-up Project,” grant number 2023BQ127; the National Key Research and Development Program Project, grant number 2023YFD1202704; the Construction Project of National Modern Agricultural Industry Technology System, grant number CARS-06-14.5-A21; and the Construction Project of Shanxi Province Modern Agricultural Industry Technology System for Millet, grant number 2024CYJSTX04-04.
Conflict of interest
The authors declare that the research was conducted in the absence of any commercial or financial relationships that could be construed as a potential conflict of interest.
Publisher’s note
All claims expressed in this article are solely those of the authors and do not necessarily represent those of their affiliated organizations, or those of the publisher, the editors and the reviewers. Any product that may be evaluated in this article, or claim that may be made by its manufacturer, is not guaranteed or endorsed by the publisher.
References
Abedin, M. J., Abdullah, A. M., Satter, M. A., and Farzana, T. (2022). Physical, functional, nutritional and antioxidant properties of foxtail millet in Bangladesh. HELIYON 8, e11186. doi:10.1016/j.heliyon.2022.e11186
Annor, G. A., Marcone, M., Bertoft, E., and Seetharaman, K. (2014). Physical and molecular characterization of millet starches. CEREAL Chem. 91, 286–292. doi:10.1094/CCHEM-08-13-0155-R
Aprodu, I., and Banu, I. (2021). Impact of brown foxtail millet (Setaria italica) flour on thermo-mechanical properties of flours from different rice varieties. Int. J. FOOD Sci. Tech. 56, 3227–3234. doi:10.1111/ijfs.14925
Arora, L., Aggarwal, R., Dhaliwal, I., Gupta, O. P., and Kaushik, P. (2023). Assessment of sensory and nutritional attributes of foxtail millet-based food products. Front. Nutr. 10, 1146545. doi:10.3389/fnut.2023.1146545
Berndt, A. E. (2020). Sampling methods. J. Hum. Lactation 36 (2), 224–226. doi:10.1177/0890334420906850
Bonah, E., Huang, X., Aheto, J. H., and Osae, R. (2019). Application of hyperspectral imaging as a nondestructive technique for foodborne pathogen detection and characterization. FOODBORNE PATHOG. Dis. 16, 712–722. doi:10.1089/fpd.2018.2617
Das, A., Patel, D. P., Kumar, M., Ramkrushna, G. I., Mukherjee, A., Layek, J., et al. (2017). Impact of seven years of organic farming on soil and produce quality and crop yields in eastern Himalayas. India. Agric. Ecosyst. Environ. 236, 142–153. doi:10.1016/j.agee.2016.09.007
Gao, J. F., Li, X. L., Zhu, F. L., and He, Y. (2013). Application of hyperspectral imaging technology to discriminate different geographical origins of Jatropha curcas L.seeds. Comput. ELECTRON Agr. 99, 186–193. doi:10.1016/j.compag.2013.09.011
He, H., Peng, M., Lu, W., Hou, Z., and Li, J. (2022). Commercial organic fertilizer substitution increases wheat yield by improving soil quality. Sci. Total Environ. 851, 158132. doi:10.1016/j.scitotenv.2022.158132
He, J., Zhang, C., and He, Y. (2017). Application of Near-Infrared hyperspectral imaging to detect sulfur dioxide residual in the fritillaria thunbergii bulbus treated by sulfur fumigation. Appl. Sci. 7, 77–87. doi:10.3390/app7010077
Hou, S. Y., Men, Y. H., Wei, M., Zhang, Y., Li, H., Sun, Z., et al. (2022). Total protein content, amino acid composition and eating-quality evaluation of foxtail millet (Setaria italica (L.) P. Beauv). FOODS 12, 31–15. doi:10.3390/foods12010031
Huang, M., He, C. J., Zhu, Q. B., and Qin, J. (2016). Maize seed variety classification using the integration of spectral and image features combined with feature transformation based on hyperspectral imaging. Appl. Sci. 6, 183–186. doi:10.3390/app6060183
Ji, H. Y., Ren, Z. Q., and Rao, Z. H. (2019). Discriminant analysis of millet from different origins based on hyperspectral imaging technology. Spectrosc. Spect. Anal. 39, 2271–2277. doi:10.3964/j.issn.1000-0593(2019)07-2271-07
Kaimal, A. M., Mujumdar, A. S., and Thorat, B. N. (2021). Resistant starch from millets: recent developments and applications in food industries. TRENDS FOOD Sci. Tech. 111, 563–580. doi:10.1016/j.tifs.2021.02.074
Kong, W. W., Zhang, C., Liu, F., Nie, P., and He, Y. (2013). Rice seed cultivar identification using Near-Infrared hyperspectral imaging and multivariate data analysis. SENSORS-BASEL 13, 8916–8927. doi:10.3390/s130708916
Kumar, R. R., Singh, N., Singh, S., Vinutha, T., Krishnan, V., Goswami, S., et al. (2022). Nutritional supremacy of pearl- and foxtail millets: assessing the nutrient density, protein stability and shelf-life of flours in millets and cereals for developing nutri-stable foods. J. PLANT Biochem. Biot. 31, 837–852. doi:10.1007/s13562-021-00761-2
Li, C., Zhao, J., Li, Y., Meng, Y., and Zhang, Z. (2021). Modeling and prediction of soil organic matter content based on visible-near-Infrared spectroscopy. FORESTS 12, 1809. doi:10.3390/f12121809
Li, G. W., Gao, X. H., Xiao, N. W., and Xiao, Y. F. (2019b). Estimation of soil organic matter content based on characteristic variable selection and regression methods. ACTA Opt. SIN. 39, 361–371. doi:10.3788/AOS201939.0930002
Li, K. H., Zhang, T. Z., Sui, Z. Q., Narayanamoorthy, S., Jin, C., Li, S., et al. (2019a). Genetic variation in starch physicochemical properties of Chinese foxtail millet (Setaria italica Beauv.). Int. J. Biol. Macromol. 133, 337–345. doi:10.1016/j.ijbiomac.2019.04.022
Liu, K., and Liu, Q. (2020). Enzymatic determination of total starch and degree of starch gelatinization in various products. FOOD HYDROCOLLOID 103, 105639. doi:10.1016/j.foodhyd.2019.105639
Lv, P., Liu, J. L., Wang, Q., Zhang, D., Duan, X., and Sun, H. (2023). Influence of accelerating storage of foxtail millet on the edible and cooking quality of its porridge: an insight into the structural alteration of the in-situ protein and starch and physicochemical properties. Int. J. Biol. Macromol. 240, 124375. doi:10.1016/j.ijbiomac.2023.124375
Mahajan, P., Bera, M. B., Panesar, P. S., and Chauhan, A. (2021). Millet starch: a review. Int. J. Biol. Macromol. 180, 61–79. doi:10.1016/j.ijbiomac.2021.03.063
Pu, H. B., Lin, L., and Sun, D. W. (2019). Principles of hyperspectral microscope imaging techniques and their applications in food quality and safety detection: a review. Compr. Rev. FOOD Sci. F. 18, 853–866. doi:10.1111/1541-4337.12432
Sachdev, N., Goomer, S., and Sing, L. R. (2021). Foxtail millet: a potential crop to meet future demand scenario for alternative sustainable protein. J. Sci. Food Agric. 101, 831–842. doi:10.1002/jsfa.10716
Saha, D., and Manickavasagan, A. (2021). Machine learning techniques for analysis of hyperspectral images to determine quality of food products: a review. CRFS 4, 28–44. doi:10.1016/j.crfs.2021.01.002
Sampaio, R. C., and Lycarião, D. (2021). Análise de conteúdo categorial: manual de aplicação. Available at: http://repositorio.enap.gov.br/handle/1/6542.
Seufert, V., Ramankutty, N., and Foley, J. A. (2012). Comparing the yields of organic and conventional agriculture. Nature 485, 229–232. doi:10.1038/nature11069
Shi, J. Y., Shan, S. H., Zhou, G. F., Li, H., Song, G., Li, Z., et al. (2019). Bound polyphenol from foxtail millet bran exhibits an antiproliferative activity in HT-29 cells by reprogramming miR-149-mediated aerobic glycolysis. J. Funct. FOODS 56, 246–254. doi:10.1016/j.jff.2019.03.021
Silva, R. P. C., Vergara, C. M. A. C., Sampaio, H. A. C., Vasconcelos Filho, J. E., Strozberg, F., Ferreira Neto, J. F. R., et al. (2022). Food and Nutrition Surveillance System: temporal trend of coverage and nutritional status of adults registered on the system, Brazil, 2008-2019. Epidemiol. Serviços Saúde 31 (1), e2021605. doi:10.1590/S1679-49742022000100019
Sun, M., Kang, X., Wang, T., Fan, L., Wang, H., Pan, H., et al. (2021). Genotypic diversity of quality traits in Chinese foxtail millet (Setaria italica L.) and the establishment of a quality evaluation system. Food Chem. 353, 129421. doi:10.1016/j.foodchem.2021.129421
Sun, M. J., Chao, Y., He, W., Kang, X. R., Yang, Q. G., Wang, H., et al. (2022). Changes in foxtail millet (Setaria italica L.) yield, quality, and soil microbiome after replacing chemical nitrogen fertilizers with organic fertilizers. SUSTAINABILITY-BASEL 14, 16412. doi:10.3390/su142416412
Tao, J. C., Wan, C. X., Leng, J. J., Dai, S., Wu, Y., Lei, X., et al. (2023). Effects of biochar coupled with chemical and organic fertilizer application on physicochemical properties and in vitro digestibility of common buckwheat (Fagopyrum esculentum Moench) starch. Int. J. Biol. Macromol. 246, 125591. doi:10.1016/j.ijbiomac.2023.125591
Tian, Y. Q., Li, Y., Xu, X. M., and Jin, Z. (2011). Starch retrogradation studied by thermogravimetric analysis (TGA). CARBOHYD Polym. 84, 1165–1168. doi:10.1016/j.carbpol.2011.01.006
Tsai, F., Lin, E.-K., and Yoshino, K. (2007). Spectrally segmented principal component analysis of hyperspectral imagery for mapping invasive plant species. Int. J. REMOTE Sens. 28, 1023–1039. doi:10.1080/01431160600887706
Verma, S., Srivastava, S., and Tiwari, N. (2015). Comparative study on nutritional and sensory quality of barnyard and foxtail millet food products with traditional rice products. J. FOOD Sci. Tech. MYS 52, 5147–5155. doi:10.1007/s13197-014-1617-y
Wang, F. X., Wang, C. G., and Song, S. Y. (2022a). Origin identification of foxtail millet (Setaria italica) by using green spectral imaging coupled with chemometrics. INFRARED Phys. TECHN 123, 104179. doi:10.1016/j.infrared.2022.104179
Wang, J. J., Tian, X., Chen, L., Wang, H. G., Cao, X., Qin, H., et al. (2022b). Grain starch estimation using hyperspectral data and its relationship with leaf water contents for broomcorn millet (Panicum miliaceum L.). Appl. Ecol. Env. Res. 20, 431–445. doi:10.15666/aeer/2001_431445
Wang, J. P., Li, Y., Tian, Y. Q., Xu, X., Ji, X., Cao, X., et al. (2010). A novel triple-wavelength colorimetric method for measuring amylose and amylopectin contents. STARCH-STARKE 62, 508–516. doi:10.1002/star.200900242
Wang, M., Ellsworth, P. Z., Zhou, J. F., Cousins, A. B., and Sankaran, S. (2016). Evaluation of water-use efficiency in foxtail millet (Setaria italica) using visible-near infrared and thermal spectral sensing techniques. TALANTA 152, 531–539. doi:10.1016/j.talanta.2016.01.062
Wang, Q. Q., Liu, Y. H., Gao, X. W., Xie, A., and Yu, H. (2019). Potential of hyperspectral imaging for nondestructive determination of chlorogenic acid content in Flos Lonicerae. J. FOOD Meas. Charact. 13, 2603–2612. doi:10.1007/s11694-019-00180-x
Wang, X., Li, Z., Zheng, D., and Wang, W. (2020b). Nondestructive identification of millet varieties using hyperspectral imaging technology. J. Appl. SPECTROSC+ 87, 54–61. doi:10.1007/s10812-020-00962-y
Wang, X., Yang, Y., Zhao, J., Nie, J., Zang, H., Zeng, Z., et al. (2020a). Yield benefits from replacing chemical fertilizers with manure under water deficient conditions of the winter wheat—summer maize system in the North China Plain. Eur. J. Agron. 119, 126118. doi:10.1016/j.eja.2020.126118
Weng, C. H., Chen, X. Z., Lin, W. X., Wu, X., and Jin, Z. Y. (2018). Determination of starch content in meat floss by high performance liquid chromatography. Food Sci. 39, 280–285. doi:10.7506/spkx1002-6630-201818043
Wu, D., and Sun, D. W. (2013). Advanced applications of hyperspectral imaging technology for food quality and safety analysis and assessment: a review — Part II: applications. Innov. FOOD Sci. Emerg. 19, 15–28. doi:10.1016/j.ifset.2013.04.016
Xia, Y., Xu, Y. F., Li, J. B., Zhang, C., and Fan, S. (2019). Recent advances in emerging techniques for non-destructive detection of seed viability: a review. AIIA 5, 35–47. doi:10.1016/j.aiia.2019.05.001
Xie, L. H., Tang, S. Q., Wei, X. J., Sheng, Z. H., Shao, G. N., Jiao, G. A., et al. (2022). Simultaneous determination of apparent amylose, amylose and amylopectin content and classification of waxy rice using near-infrared spectroscopy (NIRS). FOOD Chem. 388, 132944. doi:10.1016/j.foodchem.2022.132944
Xing, B., Yang, X. S., Zou, L., Liu, J., Liang, Y., Li, M., et al. (2023). Starch chain-length distributions determine cooked foxtail millet texture and starch physicochemical properties. CARBOHYD Polym. 320, 121240. doi:10.1016/j.carbpol.2023.121240
Yang, H., Wang, C., Zhang, H., Zhou, Y., and Luo, B. (2023). Recognition of maize seed varieties based on hyperspectral imaging technology and integrated learning algorithms. PEERJ Comput. Sci. 9, e1354. doi:10.7717/peerj-cs.1354
Yu, H. D., Qing, L. W., Yan, D. T., Xia, G., Zhang, C., Yun, Y. H., et al. (2021). Hyperspectral imaging in combination with data fusion for rapid evaluation of tilapia fillet freshness. FOOD Chem. 348, 129129. doi:10.1016/j.foodchem.2021.129129
Yun, Y. H., Bin, J., Liu, D. L., Xu, L., Yan, T. L., Cao, D. S., et al. (2019). A hybrid variable selection strategy based on continuous shrinkage of variable space in multivariate calibration. Anal. Chim. ACTA 1058, 58–69. doi:10.1016/j.aca.2019.01.022
Zhang, F., Cui, X. H., Zheng, C. C., Cao, W., Wang, X., Fu, S., et al. (2022). Rapid non-destructive identification of selenium-enriched millet based on hyperspectral imaging technology. CZECH J. FOOD Sci. 40, 445–455. doi:10.17221/129/2022-CJFS
Zhang, J., Guo, Z., Ren, Z. S., Wang, S., Yue, M., Zhang, S., et al. (2023). Rapid determination of protein, starch and moisture content in wheat flour by near-infrared hyperspectral imaging. J. FOOD COMPOS Anal. 117, 105134. doi:10.1016/j.jfca.2023.105134
Zhao, J., Chen, N., Zhu, T., Zhao, X., Yuan, M., Wang, Z., et al. (2023b). Simultaneous quantification and visualization of photosynthetic pigments in Lycopersicon esculentum Mill. under different levels of nitrogen application with Visible-Near Infrared Hyperspectral Imaging Technology. PLANTS-BASEL 12, 2956. doi:10.3390/plants12162956
Zhao, L. J., Zhao, H. Y., Han, G. L., Wang, J., Nie, M. E., and Du, H. L. (2023a). Effects of nitrogen fertilizer combined with organic fertilizer on quality of millet. Crops 6, 224–232. doi:10.16035/j.issn.1001-7283.2023.06.031
Zhao, X., Wang, W., Ni, X. Z., Chu, X., Li, Y. F., and Lu, C. (2019). Utilising near-infrared hyperspectral imaging to detect low-level peanut powder contamination of whole wheat flour. Biosyst. Eng. 184, 55–68. doi:10.1016/j.biosystemseng.2019.06.010
Zhou, X. M., Lei, B. L., Zhang, F. P., Liu, Y. M., and Fan, X. L. (2016). Uncertainty evaluation for the determination of starch content in Manihot esculenta by polarimetric method. Food Sci. 37, 144–147. doi:10.7506/spkx1002-6630-201612025
Zhu, T., Jackson, D. S., Wehling, R. L., and Geera, B. (2008). Comparison of amylose determination methods and the development of a dual wavelength iodine binding technique. CEREAL Chem. 85, 51–58. doi:10.1094/CCHEM-85-1-0051
Keywords: hyperspectral imaging, foxtail millet, amylose and amylopectin, chemometrics, visualization
Citation: Wang G, Liu M, Xue H, Guo E and Zhang A (2025) Simultaneous determination of the amylose and amylopectin content of foxtail millet flour by hyperspectral imaging. Front. Remote Sens. 6:1460523. doi: 10.3389/frsen.2025.1460523
Received: 06 July 2024; Accepted: 15 January 2025;
Published: 13 February 2025.
Edited by:
Tika Adhikari, North Carolina State University, United StatesReviewed by:
Rituraj Khound, University of Nebraska-Lincoln, United StatesPedro Sampaio, Lusofona University, Portugal
Copyright © 2025 Wang, Liu, Xue, Guo and Zhang. This is an open-access article distributed under the terms of the Creative Commons Attribution License (CC BY). The use, distribution or reproduction in other forums is permitted, provided the original author(s) and the copyright owner(s) are credited and that the original publication in this journal is cited, in accordance with accepted academic practice. No use, distribution or reproduction is permitted which does not comply with these terms.
*Correspondence: Aiying Zhang, emF5MTAxMkAxMjYuY29t