 Thomas Bossy1,2,3*
 Philippe Ciais2,4
 Solène Renaudineau3
 Liang Wan2
 Bertrand Ygorra3
 Elhadi Adam5Nicolas Barbier6
 Marijn Bauters7Nicolas Delbart8,9
 Frédéric Frappart3Tawanda Winmore Gara10
 Eliakim Hamunyela11
 Suspense Averti Ifo12
 Gabriel Jaffrain13Philippe Maisongrande14Maurice Mugabowindekwe15,16
 Theodomir Mugiraneza17,16
 Cassandra Normandin3Conan Vassily Obame18
 Marc Peaucelle3
 Camille Pinet13Pierre Ploton6
 Le Bienfaiteur Sagang19
 Martin Schwartz2Valentine Sollier3Bonaventure Sonké20,21Paul Tresson6
 Aurélien De Truchis22
 An Vo Quang13
 Jean-Pierre Wigneron3
- 1Université de Versailles Saint-Quentin-en-Yvelines, Versailles, France
- 2UMR8212 Laboratoire des Sciences du Climat et de l’Environnement (LSCE), Gif-surYvette, Île-deFrance, France
- 3Interactions Sol-Plante Végétale (ISPA UMR), Villenaved’Ornon, France
- 4CEA Saclay, Gif-surYvette, Île-deFrance, France
- 5School of Geography, Archaeology and Environmental Studies, University of the Witwatersrand, Johannesburg, South Africa
- 6UMR5120 Botanique et Modélisation de l’Architecture des Plantes et des Végétations (AMAP), Montpellier, Languedoc-Roussillon, France
- 7Q-ForestLab, Laboratory of Quantitative Forest Ecosystem Science, Department of Environment, Ghent, Belgium
- 8Geography Department, Université Paris Cité, Paris, Île-deFrance, France
- 9UMR8236 Laboratoire Interdisciplinaire des Energies de Demain (LIED), Paris, Île-deFrance, France
- 10Department of Environmental Science and Management, California State Polytechnic University Humboldt, Arcata, CA, United States
- 11Department of Environmental Science, School of Science, Faculty of Agriculture, Engineering and Natural Sciences, University of Namibia, Windhoek, Namibia
- 12Life and Earth Sciences Department, Marien Ngouabi University, Brazzaville, Republic of Congo
- 13IGN FI, Institut National de l’Information Géographique et Forestière (IGN), ParisSaintMandé, France
- 14Direction de la Stratégie, Centre National d’Etudes Spatiales (CNES), Paris, France
- 15Department of Geosciences and Natural Resource Management, University of Copenhagen, Copenhagen, Denmark
- 16Centre for Geographic Information Systems and Remote Sensing, College of Science and Technology, University of Rwanda, Kigali, Rwanda
- 17Cadasta Foundation, Washington, DC, United States
- 18Agence Gabonaise d’Etudes et d’Observations Spatiales (AGEOS), Libreville, Gabon
- 19Institute of the Environment and Sustainability, College of Physical Sciences, University of California, Los Angeles, Los Angeles, CA, United States
- 20Biology Department, Higher Teacher Training College (HTTC), Yaounde, Cameroon
- 21Plant Systematics and Ecology Laboratory, University of Yaoundé, Yaoundé, Cameroon
- 22Kayrros SAS, Paris, France
African tropical forests play a crucial role in global carbon dynamics, biodiversity conservation, and climate regulation, yet monitoring their structure, diversity, carbon stocks and changes remains challenging. Remote sensing techniques, including multi-spectral data, lidar-based canopy height and vertical structure detection, and radar interferometry, have significantly improved our ability to map forest composition, estimate height and biomass, and detect degradation and deforestation features at a finer scale. Machine learning approaches further enhance these capabilities by integrating multiple data sources to produce improved maps of forest attributes and track changes over time. Despite these advancements, uncertainties remain due to limited ground-truth validation, and the structural complexity and large spatial heterogeneity of African forests. Future developments in remote sensing should examine how multi-sensor integration of high-resolution data from instruments such as Planet, Tandem-X, SPOT and improved AI methods can refine forest composition, carbon storage and function maps, enhance large-scale monitoring of tree height and biomass dynamics, and improve forest degradation and deforestation detection down to tree level. These advancements will be essential for supporting science-based decision-making in forest conservation and climate mitigation.
1 Introduction
Forests cover 31% of the Earth’s surface, with tropical regions accounting for about half of this area (The State of the World’s Forests, 2020). Forests are essential for sustainability and ecosystem services, such as mitigating greenhouse gas emissions, regulating regional climate through evaporative cooling, producing biomass, mitigating extreme surface runoff, and hosting biodiversity (Brockerhoff et al., 2017; Jenkins and Schaap, 2018; Nunes et al., 2020). African forests fall into two broad categories: moist tropical forest which cover 2.19 Mkm2 and store approximately 36 PgC of carbon and tropical and subtropical dry forest, which cover 3.67 Mkm2 and store approximately 21 PgC of carbon (Xu et al., 2021).
The carbon cycle of tropical forests plays an essential role in regulating atmospheric CO2 and climate (Mitchard, 2018; Pan et al., 2024). Intact tropical rainforests act as carbon sinks, with the South American sink declining (Brienen et al., 2011), while Africa (Hubau et al., 2020) and East Asia (Qie et al., 2017) show more stable carbon uptake. In the case of Africa, this is possibly due to intact African forests’ resistance to drought (Bennett et al., 2017; Brienen et al., 2011; Hubau et al., 2020). Tropical forests include various vegetation types, such as swamps, dry forests, mountain forests, and woodlands such as the Miombo forests in semi-arid regions (Ahlström et al., 2015). However, the carbon dynamics of dry forests and woodlands are less well understood than those of evergreen forests due to limited data (Williams et al., 2007), and African forests overall are less well studied than those of South America (White et al., 2021). The African tropical forest biome is singular compared to Asia and America. It is characterised by a lower tree species diversity both in terms of density (Sullivan et al., 2017) and absolute numbers (Slik et al., 2015) but a higher density in large trees storing more above-ground biomass per individual (AGB) (Slik et al., 2013). Further, the structure of African forests seem to have been deeply affected by elephants while Neotropical and Asian forests do not host large herbivores (Berzaghi et al., 2019). The reason for the difference in tree diversity is not clearly explained (Parmentier et al., 2007; Zhang-Zheng et al., 2024).
Despite their central role in ecological integrity and economic development, forest resources are affected by disturbances resulting in negative changes of their structure, function and spatial extent. Among these disturbances, deforestation and degradation are the main ones in tropical forests (Bourgoin et al., 2024; Feng et al., 2024). These disturbances, together with natural disturbances like fires, drought-induced dieback and windthrown events lead to habitat fragmentation and biodiversity loss, threatening the unique diversity of flora and fauna (Bennett et al., 2017; Giam, 2017). Disturbances are also causing significant forest carbon emissions (Assede et al., 2023; Masolele et al., 2024; Shapiro et al., 2023). In particular, fire disturbance impacting forests is underestimated by medium-resolution satellites (Khairoun et al., 2024). According to bookkeeping models, deforestation contributes to net emissions of about 1 Gt CO2 per year in Africa (Grassi et al., 2022; Tubiello et al., 2021), with rising deforestation in the Congo basin. Contrary to bookkeeping models, remote sensing (RS) methods estimate the forest carbon loss in Africa to approximately 4 Gt CO2 per year (Feng et al., 2022). Uncertainties in carbon sink estimates remain high due to discrepancies between national inventories and atmospheric inversions or modelling approaches, as well as challenges in estimating emissions from land use change (Ernst et al., 2023; Grassi et al., 2022; Mostefaoui et al., 2024).
Effective conservation of tropical forests would be greatly facilitated by accurate, near real-time monitoring of forest disturbance, carbon stocks, and biodiversity. The remote sensing community has struggled to quantify tropical forest degradation and estimate carbon stocks.
Recent advances in remote sensing, Earth observation, and artificial intelligence (AI) now enable detailed mapping and modelling of forest land cover, biomass, and carbon stocks (Lang et al., 2023; Reiner et al., 2023; Santoro et al., 2021). These models provide high-resolution multi-temporal data that revolutionize forest dynamics monitoring (Liu et al., 2021; Zhu et al., 2022), in particular the production of global canopy height maps that are now at a 10 or 30 m resolution with a continuous spatial coverage and potentially reproducible every year (Lang et al., 2023; Pauls et al., 2024; Potapov et al., 2021; Schwartz et al., 2024). Various remote sensing techniques, based on optical, radar and LiDAR (Light Detection and Ranging) observations, offer detailed and complementary insights into forest structure. Moreover, recent developments in AI-driven analysis are helping to process and combine large amounts of data to detect changes and predict trends in vegetation features (Li et al., 2023). AI algorithms based on Machine Learning (ML) or Deep Learning (DL) methods are improving land cover classification and biomass estimation, enabling more comprehensive and near real-time forest monitoring (Fayad et al., 2024; Pauls et al., 2024; Schwartz et al., 2024). This review explores the methods for forest mapping, biomass monitoring, and carbon stock quantification using these advanced techniques, with a focus on African tropical forests.
2 State of the art of remote sensing methods and results for monitoring tropical forests in Africa
A variety of airborne and spaceborne Earth observation sensors are used, not only for forest land cover mapping, but also for forest biomass and carbon stocks quantification (Figure 1 illustrates some of the existing products). A growing body of literature illustrates that both optical, active sensors and digital elevation models are used to map and model forest composition and function in West-Central Africa (Viennois et al., 2013), to monitor tree height globally (Lang et al., 2022) or at the country level in Democratic Republic of Congo (DRC) (Waldeland et al., 2022) or Gabon (Carcereri et al., 2024; Takougoum Sagang et al., 2024), forest biomass in Rwanda (Mugabowindekwe et al., 2023) and forest land cover over Africa (Reiner et al., 2023). Time series analysis based on dense satellite images and classic machine learning algorithms such as Random Forest (RF) (Karlson et al., 2015), decision trees (Phiri et al., 2020), regression analysis, and Support Vector Machine (SVM) (Adugna et al., 2022) were largely used to map forest cover change through unitemporal and bi-temporal data analysis, multi-temporal post-classification comparison, and change detection analysis. In the last decade, the use of advanced deep learning techniques such as Convolutional Neural Networks (CNNs) have improved the accuracy of remote sensing based forest detection and mapping of tree cover, canopy height, biomass or crown segmentation (see table 2). There is a substantial amount of comprehensive review on the aboveground forest biomass estimation using remote sensing and big data processing in cloud computing environments (Abbas et al., 2020; Brandt et al., 2024a; Hansen et al., 2013; Tian et al., 2023).
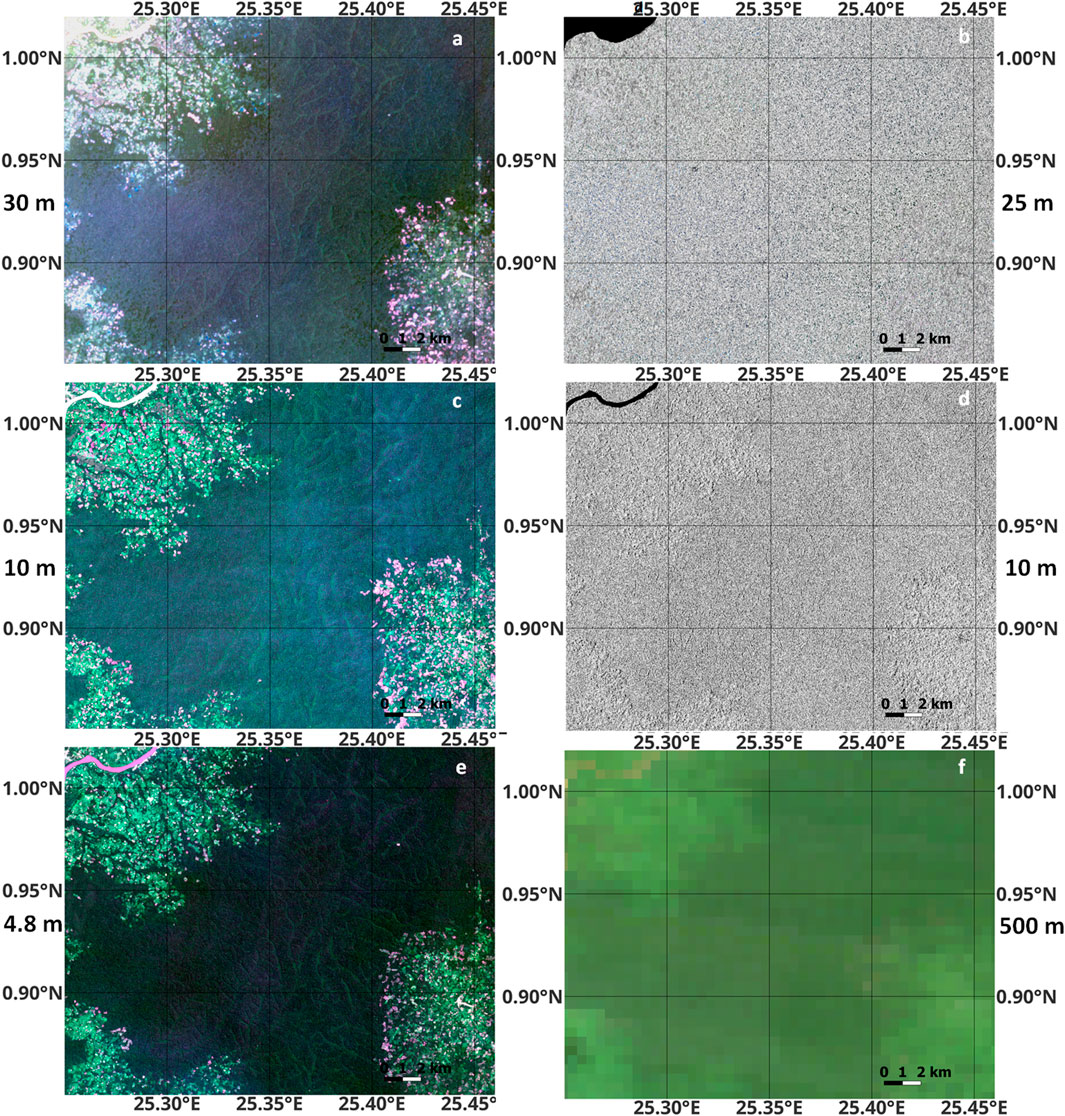
Figure 1. Differences of resolution between optical sensors ((a) Landsat-8 30 m acquired on 14/12/2020 (c), Sentinel-2 10 m dated 31/08/2020; (e) PlanetScope monthly mosaic 4.8 m acquired on 08/2020; and (f), Terra-Aqua/MODIS 500 m acquired on 16/12/2020) and SAR sensors ((b) ALOS/PALSAR-2 30 m acquired on 31/08/2020 and (d), Sentinel-1 10 m acquired on 03/09/2020) over tropical rainforest in Democratic Republic of Congo (DRC).
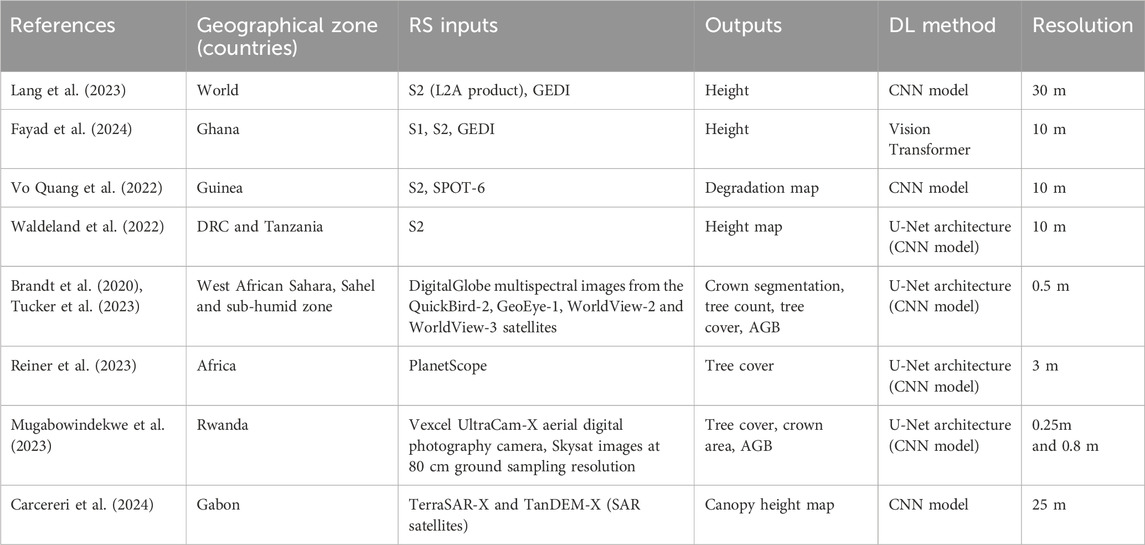
Table 2. Existing remote sensing studies using deep learning over African forests/savannas.
Satellite observations offer global coverage and repeated measurements in time but none of them directly measure biomass. To estimate biomass density from remote sensing products, allometric equations relating biomass to the retrieved vegetation features (e.g., tree height) are required. These equations are derived from in situ datasets, but unfortunately, observation sites and plots are particularly scarce in African forests compared to the Amazon Basin (Cooper et al., 2024) despite new projects such as GEO-TREES (Chave et al., 2019). Even though it is negligible in comparison to the noise on deriving biomass from remote sensing, the conversion of biomass to carbon stock is not straightforward either as it is a function of the wood carbon concentration which depends on the type of tree and forest (Heinrich et al., 2023; Martin et al., 2018). Lastly, the performance of optical or microwave sensors in monitoring Above-Ground Biomass (AGB) is affected by saturation effects in moderately or highly dense tree canopies (Wigneron et al., 2024).
Accurate maps of forest composition and vertical structure, including canopy height, can be used as proxies to infer biomass volumes. They are therefore important for monitoring forest carbon stocks and biodiversity. However, current accuracy and spatial and temporal resolution are insufficient to produce annual estimates of biomass and calculate carbon fluxes. Improving such features will be beneficial to estimate yearly carbon budgets at the scale of the Congo Basin and for mapping tree cover and monitoring deforestation and degradation.
2.1 Mapping forest composition and function
Detailed mapping of vegetation types is a fundamental prerequisite both for biodiversity- and carbon-oriented questions and applications, this involves distinguishing different vegetation types such as swamp vegetation (edaphic forests), more or less open forests (e.g., Marantaceae forests), monodominant stands (e.g., Gilbertiodendron or Aucoumea-dominated forests), regenerating forests or more or less degraded vegetation. According to Dalimier et al. (2022), the term “edaphic forests” encompasses a variety of forest types, including those that are permanently flooded (with flooding persisting for more than 9 months), periodically flooded (with flooding occurring for four to 9 months), and riparian forests, as in the Cuvette Centrale du Congo, the world’s second largest wetland area hosting the largest tropical peatland complex (Betbeder et al., 2014; Bwangoy et al., 2010). The majority of the Congo basin is covered by dense moist forests with an irregular age distribution (see Figure 2). This forest type is characterised by a dense tree layer comprising more than 60% of the biomass, which is rich in species and markedly deciduous, with a multitude of emerging trees displaying imposing canopies. In the eastern half of the Congo basin, dense moist forests with a regular age distribution, specific to exploitation or regeneration, which exhibit fewer large crowns than forests with an irregular age distribution, appear to be expanding (Dalimier et al., 2022). The landscape is punctuated by groves of monospecific evergreen dense moist forests, most often of the species Gilbertiodendron. Additionally, montane and sub-montane forests border the great lakes region (Dalimier et al., 2022). Open forests are also identified across the basin, often on the margins of a degradation gradient.
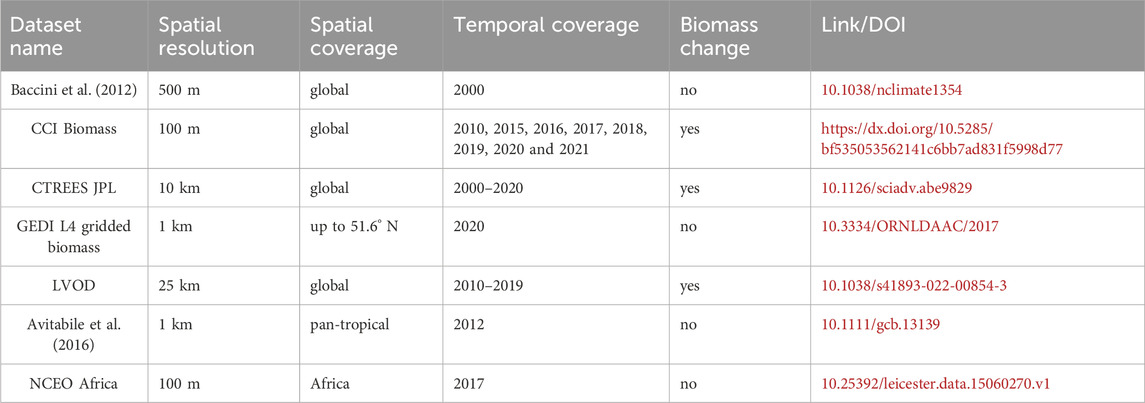
Table 1. Major biomass and biomass change datasets covering tropical forests.
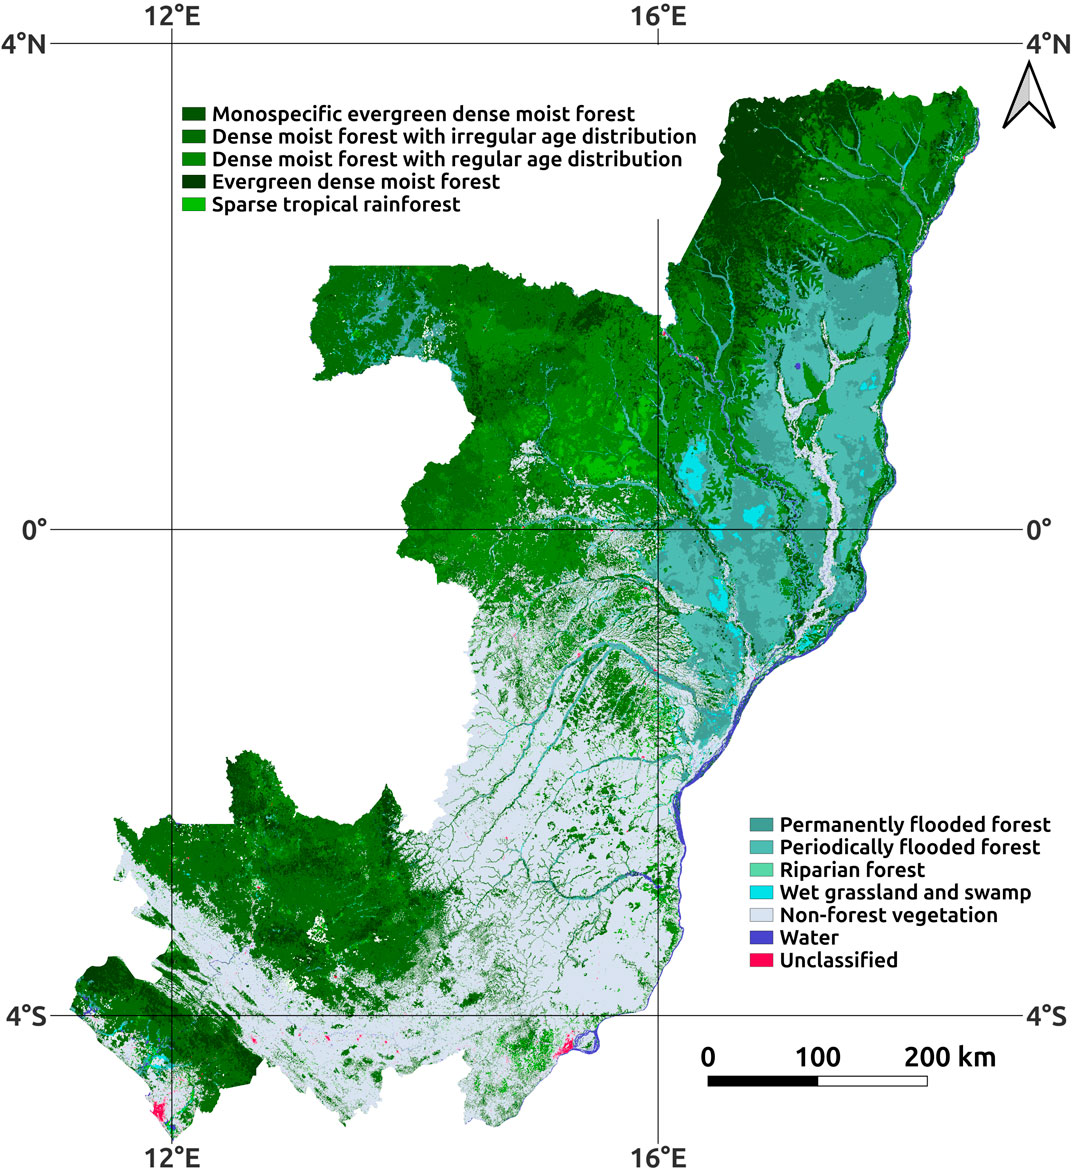
Figure 2. Map of forest types in the Congo Basin at 20 m resolution reproduced from (Dalimier et al., 2022) with shared data from UCLouvain-Geomatics - Observatoire des Forêts d'Afrique centrale.
In the Congo Basin, these different types of land cover contain contrasting floristic and faunistic compositions and functions (Réjou-Méchain et al., 2021) and thus play a different role in biogeophysical and chemical fluxes (e.g., C storage in Congo Basin peatlands, soil carbon, sediment load in watercourses). Existing maps of vegetation types are based on the extrapolation of plot data (185,665 plots used by Réjou-Méchain et al. (2021) with a resolution of 10 km by 10 km over the entire Congo Basin. This map uses 24 climatic predictors, such as many temperature and precipitation metrics, the mean monthly evapotranspiration or the maximum climatic water deficit, to extrapolate vegetation types over the entire region. To achieve higher resolution at large scales, it is possible to combine field data, very-high resolution images (Pléiades, Spot6/7, Planet) and multispectral Sentinel 2 data (Sagang et al., 2022; Viennois et al., 2013).
The use of Sentinel 2 data for the analysis of subtle variations in forest composition and structure requires a level of pre-processing very different from that achieved by currently distributed level 2A products. Efforts are needed to set up a functional processing chain specific to tropical forests, enabling the correction of intra- and inter-swath Bidirectional Reflectance Distribution Function (BRDF) effects. Carefully trained DL models would present a promising solution, particularly when combined with multidate calibration, which has the potential to enhance classifier robustness against inter-image variability. Another lead is the use of Lidar data of canopy structure to infer the vegetation diversity (Marselis et al., 2018; Schneider et al., 2020) or the structural density (Li et al., 2023) with Airborne Laser Scanning (ALS) and Global Ecosystem Dynamics Investigation (GEDI) (Dubayah et al., 2023). In these cases, validation using terrestrial laser scanning (TLS) data is essential (Decuyper et al., 2018). Unfortunately, the relationships between tree species diversity, climate and canopy structure are not as straightforward as originally expected (Marselis et al., 2022) and require further investigation, in particular in Central Africa where plots are scarce.
2.2 Mapping tree height and forest biomass
The first continuous global maps of forest characteristics like height and AGB relied on remote sensing forest height measurements from the ICESat/GLAS mission (from 2003 to 2009) (Lefsky, 2010; Simard et al., 2011). Combining Terra-Aqua/MODIS reflectance data with ICESat/GLAS enabled the generation of global 1 km resolution height maps (Lefsky, 2010; Simard et al., 2011) as well as 500 m resolution AGB maps by combining these maps with field inventories (Baccini et al., 2012). Saatchi et al. (2011) built upon these sensors and incorporated field data from forest inventory plots to derive site-specific allometric equations, ultimately proposing a carbon stock map for tropical forests across three continents (Asia, Latin America and Africa). ICESat/GLAS became a cornerstone for forest characteristics mapping when it was, used in conjunction with other radar sensors like ALOS-PALSAR (Mitchard et al., 2012; Santoro et al., 2021) and Landsat (Hansen et al., 2016; Wang et al., 2018; Zhang et al., 2014) to achieve wall-to-wall mapping. More recently, thanks to GEDI L4 data it is possible to produce biomass density mapping at 1 km resolution based on the GEDI waveform and statistical hybrid inference method (Dubayah et al., 2023; Patterson et al., 2019).
Advancements in remote sensing technologies have yielded higher-resolution data across the optical (Sentinel-2 launched in 2015, PlanetScope from 2016), synthetic aperture radar (SAR, Sentinel-1 launched in 2014), and LiDAR (ICESat-2/ATLAS launched in 2018, GEDI launched in 2018) domains, enabling more accurate AGB and forest height mapping. Notably, GEDI-based canopy height maps rapidly emerged after the first LiDAR acquisitions in 2019, paving the way for high-resolution, large-scale height mapping (Ghosh et al., 2022; Gupta and Sharma, 2022; Liu et al., 2021; Morin et al., 2022; Qi et al., 2019; Schneider et al., 2020; Shendryk, 2022; Silva et al., 2021; Sothe et al., 2022; Wang et al., 2022). For example, 30 m spatial resolution from Landsat optical reflectance data was combined with sparse height measurements from GEDI to generate global, 30 m resolution canopy height maps (Potapov et al., 2021). Recently, Sentinel-2 reflectances with (Pauls et al., 2024) or without (Lang et al., 2023) Sentinel-1 backscatter were combined with GEDI data to achieve global, 10 m resolution wall-to-wall height mapping. Meta and World Resource Institute (WRI) released a 1 m resolution map by using very high resolution RGB images from Maxar satellites and ALS data (Tolan et al., 2024). Figure 3 illustrates height maps over a small area in Gabon produced by three different methods at high spatial resolution (30 m and 10 m) showing that the map from Potapov et al. (2021) saturates at 25 m while the maps from Lang et al. (2023) at 10 m show heights up to 55m, similar to the results of the OFV project (Kayrros, see annex). However, the production of such maps across the entire tropical forests may prove challenging due to optical image distortions caused by clouds, haze or dust. In addition, the directional effects of the sun’s angle can cause the textural information of optical images to be distorted. This is the BRDF effect that can be observed within or between swaths. Although less affected by the presence of clouds, SAR images are impacted by large hydrometeors in convective rain cells which interact with the electromagnetic wave emitted by the sensors. It can cause either brightening or darkening of portions of the contaminated images, especially at higher frequencies (i.e., C and X bands) (e.g., Flores et al., 2019). The presence of speckle noise on radar images and saturation of optical images due to the dense forest can hinder the detection of trees. Finally, the low penetration depth of radar with short wavelength implies a signal saturation that is generally observed in dense forests (Yu and Saatchi, 2016). A different type of saturation is observed for LiDAR, with photons that do not necessarily reach the ground when the canopy is above 40 m. Leads to overcome this challenge include a more advanced LiDAR waveform analysis to identify the saturation or crossing LiDAR signals with DEM, although these are often biased in the presence of canopy. Overall, these limitations increase the uncertainty associated with canopy height estimates in tropical forests.
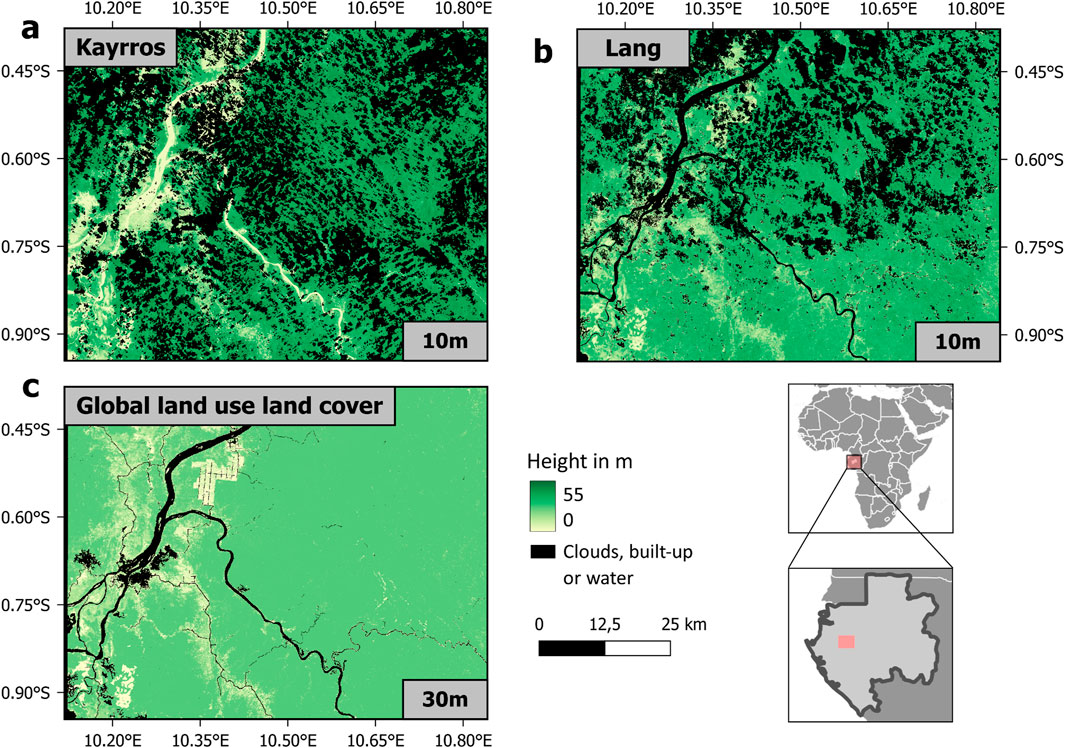
Figure 3. Maps of canopy heights in a small area of 6,057 km2 in Gabon. Panel (a) shows the map at 10 m produced by Kayrros (see annex 1). Panel (b). shows the map at 10 m from (Lang et al., 2022). Panel (c). shows the products at 30 m from the Global land use land cover dataset (Potapov et al., 2021).
Another spaceborne technique used to map forest height and AGB is the interferometry based on SAR images (SAR interferometry or InSAR) acquired from two different angles (repeat-pass). Forest height mapping from InSAR can be achieved either removing a Digital Terrain Model (DTM) representing the bare earth surface from the InSAR Digital Surface Model (DSM) corresponding to the top of the canopy, or differentiating two Digital Elevation Models (DEM) obtained by InSAR at the same or at two different wavelengths, one penetrating deeper in the vegetation as in P or L bands, the other not as in X or C bands (Solberg et al., 2017). The resulting canopy height maps have a spatial resolution of several tens of meters. Such a technique has been applied to map canopy height at country-scale over Gabon using TanDEM-X InSAR acquisitions and deep learning with an R2 of 0.77 and RMSE ∼5 when compared to LiDAR data (Carcereri et al., 2024). AGB estimation is derived from canopy height using regression between the two variables (Berninger et al., 2019). Using X-band InSAR data, no saturation was found up to an AGB of 600 t/ha in a dense tropical forest in Tanzania (Solberg et al., 2017). InSAR coherence (i.e., the degree of correlation between two SAR images which represents the quality of the interferogram) was also used for canopy height mapping and AGB estimates. A linear relationship was found between both the canopy height and AGB. Over tropical forests, including African equatorial study sites, InSAR volume coherence derived canopy heights and AGB were retrieved with RMSE of ∼16% and 21% and R2 of 0.72 and 0.59, respectively (Schlund and Boehm, 2021).
Recent scientific advances have shown that combining ground inventory data with high-resolution satellite and aerial imagery, as well as LiDAR observations using AI, improves environmental monitoring down to the tree level in African drylands (Brandt et al., 2020; Tucker et al., 2023). These emerging methods are capable of producing very high-resolution (3 m) maps of tree cover for Africa (Reiner et al., 2023) and are laying the groundwork for overcoming the challenges of differentiating individual trees in tropical dense forests (Mugabowindekwe et al., 2023). However, current techniques remain strongly limited in their ability to capture tree-level dynamics in dense tropical forests.
The need to combine different data sets propagates the uncertainty associated with these maps. This makes annual monitoring of biomass change challenging. As a result, these maps provide only a static picture of biomass at a given time, with large differences between methods, calling into question their reliability and temporal stability (Dalimier et al., 2022). More recently, several new satellite remote sensing products based on AGB have been produced (Abbas et al., 2020) but the spatial resolution remains limited (100 m to a few km, see Table 1).
2.3 Mapping changes of canopy height and forest biomass
In the previous section, we described methods providing maps of canopy height with a spatial resolution of 10 m–30 m that can be updated annually thanks to the use of AI, potentially allowing for a yearly map production to monitor height changes. However, we also highlighted limitationsthat can increase the uncertainty in canopy height estimates. In tropical forests, the most precise studies still have a mean absolute error (MAE) of a few meters. It is difficult to directly compare studies as they don’t perform uniformly and don’t necessarily use the same validation data on the same regions. However, recent products give height maps with a MAE of 4.5 m (Wan et al., in prep) to 6.4 m (Lang et al., 2023). Therefore these methods make it particularly difficult to monitor height change in mature, slow-growing forests, while they can be very effective in detecting more abrupt changes, such as disturbance and regrowth.
While height can be estimated directly from spaceborne systems like GEDI, biomass requires in situ plot inventory or airborne laser scanning (ALS) data to calibrate the relationship between height and AGB. This reliance on plot data increases the uncertainty in biomass estimates and makes annual monitoring more difficult. To date, most of the AGB maps are static and very few products provide data on the interannual variations in the forest carbon stocks. These “dynamic” products include the one developed by Xu et al. (2021) based on machine learning models which contribute to predicting AGB changes using historical data and optical and high-frequency microwave measurements as well as a large set of ALS data. However this product was found to be limited by saturation issues (Wigneron et al., 2024). In recent years, monitoring of the interannual variations of AGB has mainly been done by using the microwave Vegetation Optical Depth (VOD), which accounts for the microwave extinction effects due to the vegetation layer (Frappart et al., 2020; Wigneron et al., 2024). In particular L-VOD (the VOD index estimated at L-band, a very low frequency band) has been shown to be related to AGB without clear signs of saturation. L-VOD estimated from the SMOS (Soil Moisture and Ocean Salinity) satellite mission, has been used to monitor the interannual variations in AGB at the country (China, USA, Brazil, etc.), continental (tropical and boreal areas, Australia, Europe, etc.) and global scales over the last decade (Yang et al., 2023). For instance, Zhao et al. (2024) have recently found that deforestation resulted in significant carbon emissions that were offset by carbon stock increases due to vegetation growth and recovery, resulting in a net carbon sink in Central Africa from 2010 to 2019, with a carbon stock increase mainly occurring in the northern savannas. These trends have been confirmed by carbon dynamics estimated from X-VOD products (Wang et al., 2024) and by a recent analysis of the patterns and drivers of aboveground carbon changes in the tropics (Feng et al., 2024). However, the L-VOD and X-VOD derived AGB estimates have a coarse spatial resolution of about 20 km × 20 km which does not allow an accurate mapping and attribution of disturbances in forests but is relevant to estimate fluxes at the country level (see Figure 4).
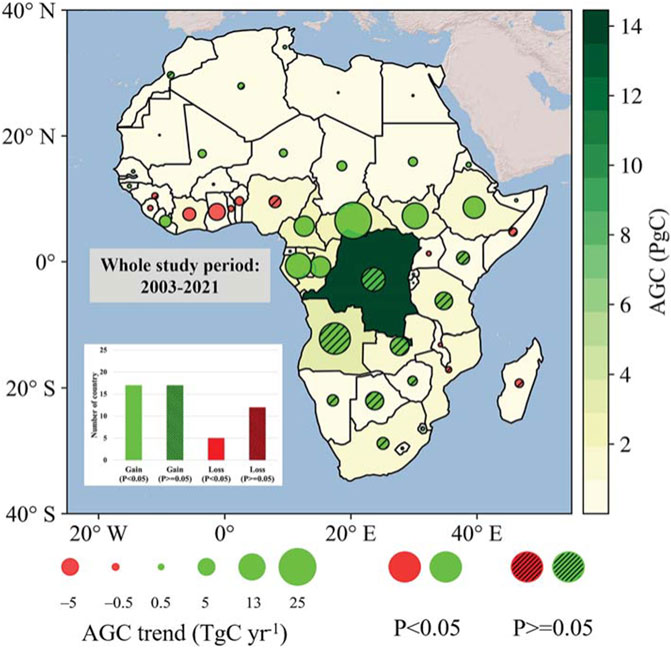
Figure 4. AGC (PgC) and AGC trends (TgC/yr) summed per African country for the period 2003–2021. Data were obtained thanks to the analysis of L-VOD products (Wang et al., 2024).
Table 1 shows that there is currently no high resolution dataset available to report yearly biomass changes. Furthermore, existing products present significant differences making it difficult to define a reference dataset (see Figure 5). As for forest height monitoring, the use of new deep learning techniques offers very promising perspectives to monitor interannual changes in AGB at high resolution (30 m) (Tucker et al., 2023). However, yearly products are not available yet. Note that 30 m is the minimum resolution for which it makes sense to estimate AGB because below this size, the tree heterogeneities necessary to compute a meaningful biomass estimate cannot be accounted for.
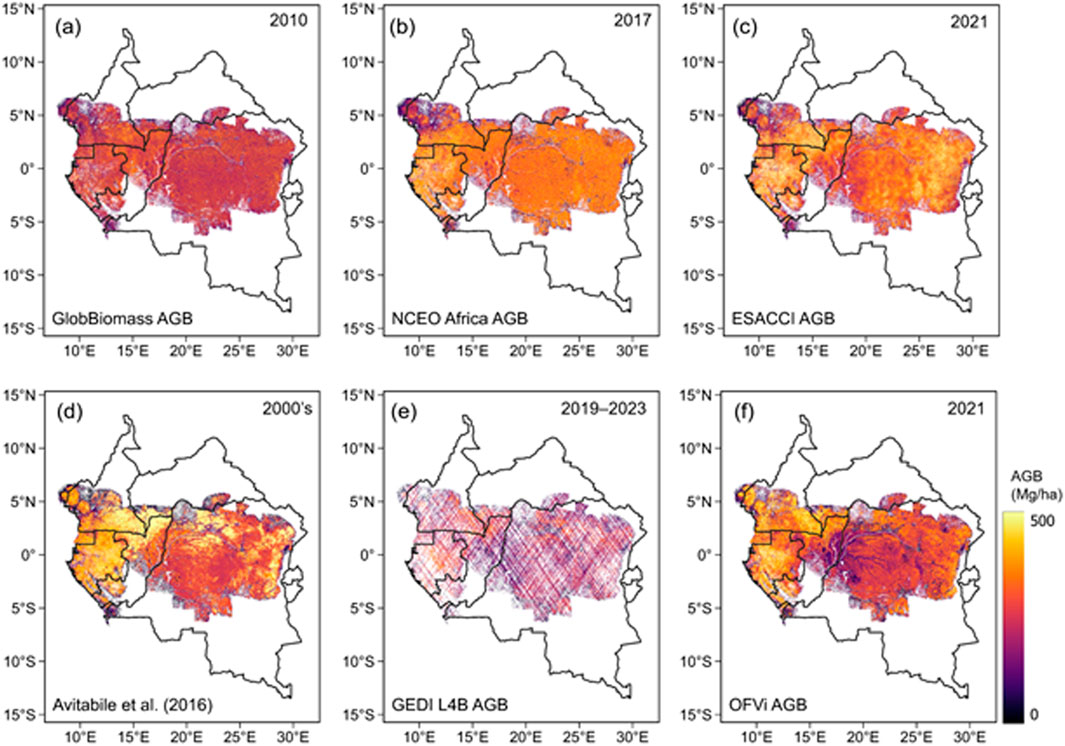
Figure 5. Comparison of spatial distribution above-ground biomass (Mg/ha) in the Congo Basin forests derived from multiple datasets: (a) GlobBiomass (100 m) (Santoro et al., 2018), (b) NCEO Africa AGB (100 m) (Rodriguez-Veiga and Balzter, 2021), (c) ESACCI AGB (100 m) (Santoro and Cartus, 2023), (d) pan-tropical AGB (1 km) (Avitabile et al., 2016), (e) GEDI L4B AGB (1 km) (Dubayah et al., 2023), and (f) FORMS OFVI V1 AGB (10 m) (Wan et al., in prep). FORMS OFVI V1 AGB was generated using Kayrros canopy height maps (see annex) and an allometric equation (AGB = 0.9765×CH1.6353). The approximate year of AGB mapping is shown in the top-right corner of each panel.
2.4 Mapping forest degradation
The development of annual monitoring of AGB at high resolution would provide the opportunity to derive disturbance maps that distinguish between degradation and deforestation. While large-scale deforestation is currently well monitored, small-scale degradation may be harder to detect.
Forest degradation encompasses all activities that alter the structure and composition of forest while remaining under the definition of a forest, such as selective logging, fires, droughts, and more. Unlike deforestation, forest degradation is not categorised as land-use change because it is less intensive, less visible and more difficult to detect but may lead to eventual forest loss. Furthermore, forest degradation is a major concern as it reduces carbon sequestration potential, often overlooked in carbon accounting (Silva Junior et al., 2021). Small-scale forest clearing for agriculture is particularly prevalent in the Congo Basin forest where it accounted for more than 80% of the total forest cover loss in the region between 2001 and 2015 (Curtis et al., 2018; Tyukavina et al., 2018). Another characteristic of the Congo Basin is that forest exploitation is mainly performed through selective logging which represents the second most significant disturbance driver in the region (Tyukavina et al., 2018). On the contrary, large-scale deforestation was the main driver of forest loss in the Amazon and Southeast Asia, accounting for more than 60% (Curtis et al., 2018), even though a recent study has shown that carbon loss from forest degradation exceeds that from deforestation in the Brazilian Amazon over the past decade (Qin et al., 2021).
Deforestation, unlike degradation, has long been monitored because it is easier to detect using remote sensing (Reiche et al., 2021; Tyukavina et al., 2018; Zhuravleva et al., 2013). Recently, the processing of very high resolution (about 3 m) images from the Planet NICFI mosaics (archives since 2015) has significantly improved the mapping of deforestation for Mato Grosso (Wagner et al., 2023) and the entire Brazilian Amazon (Dalagnol et al., 2023). The latter approach uses deep learning classification algorithms, complemented by other high resolution data such as SPOT, MAXAR, and Terrasar-X. It is based on a manual labelling of a large set of anthropogenic disturbances such as roads, logging, and fires, and other factors such as wildfires, and mortality events from droughts.
Historically, the Landsat-based global or pan-tropical datasets (Hansen et al., 2013; Vancutsem et al., 2021) provide 30 m resolution maps of forest cover allowing for an assessment of disturbances. This is the Tropical Moist Forest (TMF) database that provides annual maps of changes (1990–2023) at a spatial resolution of 30 m, distinguishing between forest cover degradation and deforestation. TMF defines a degradation as a temporary disturbance with a maximum duration of 2.5 years (Vancutsem et al., 2021). These maps have also been used to assess forest disturbance dynamics (Tyukavina et al., 2018). If optical images are too cloudy, radar sensors such as Sentinel-1 can provide alternative datasets and information, e.g., using statistical approaches as cumulative sum (CuSum) (Manogaran and Lopez, 2018) or Bayesian approaches (Reiche et al., 2018). These methods have been successfully applied to monitor deforestation and degradation in Amazonia and Congo (Reiche et al., 2021; Ygorra et al., 2023; 2021). When tested in Congo, it allowed to monitor the construction of roads used for logging and also to identify dates of forest disturbance. Figure 6 compares these maps produced by three different methods: RAdar for Detecting Deforestation (RADD) alerts (Reiche et al., 2021), GLAD alerts, i.e., from the University of Maryland’s Global Analysis and Discovery (GLAD) lab (Hansen et al., 2016) and CuSum Cross-Tc (Ygorra et al., 2023) alerts. Disturbances from deforestation and degradation can also be estimated using InSAR data. Non-forested areas are characterized with higher coherence and lower heights than forested areas (Solberg et al., 2015). These properties were used to detect forest degradation using C-band COSMO-SkyMed InSAR data with an accuracy above 75% in two sites in Central Africa (Deutscher et al., 2013), X-band TanDEM-X InSAR data over hilly areas in Gabon (Carstairs et al., 2022) or selective logging sing C-bandRADARSAT-2 InSAR data with an accuracy above 75% in RDC (Antropov et al., 2021).
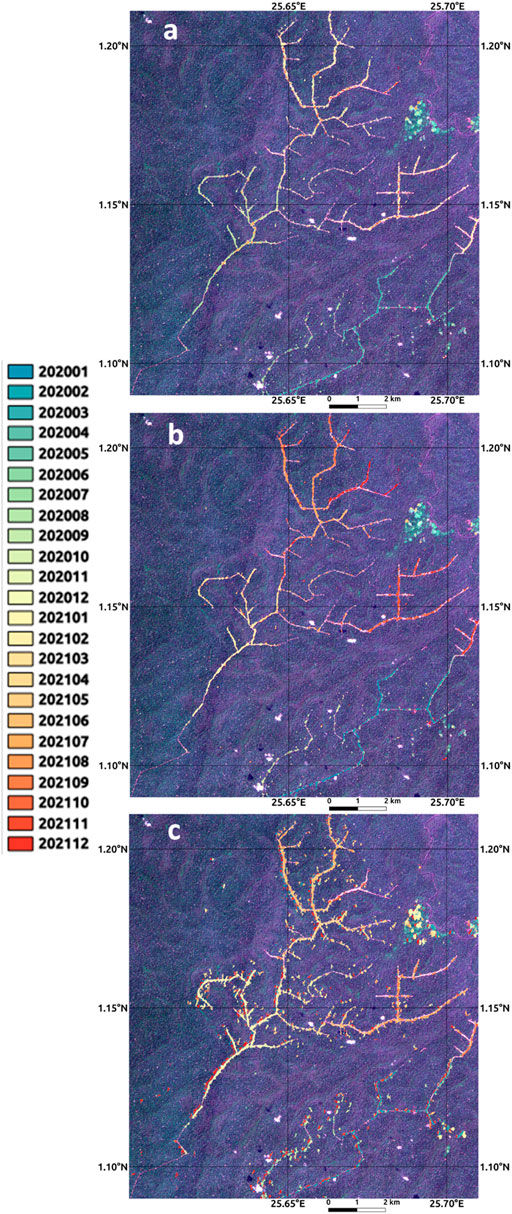
Figure 6. Comparison of different methods used for the detection of forest degradation. Dates of detected changes between 01/2020 and 12/2021 (color scale) in an IFCO concession (Democratic Republic of Congo) according to (a) GLAD alerts (Hansen et al., 2016), (b) RADD alerts (Reiche et al., 2021) and (c) CuSum cross-Tc alerts (Ygorra et al., 2021) on the Sentinel-2 image acquired on 12/02/2021. Annex: FORMS OFVI V1 AGB Maps derived from GEDI, Sentinel-1 and Sentinel-2 satellite observations over the period 2021–2022 over the Congo basin FORMS OFVI V1 mapping of above-ground biomass (AGB) is based on the use of canopy height (CH) as a proxy of AGB and which can be estimated on a large-scale using satellite imagery. Then AGB is estimated from CH using height-to-AGB relationships (Wan et al., in prep).
Other studies have explored the application of Sentinel-2 satellite imagery in detecting forest degradation. Vo Quang et al. (2022) focused on the Ziama Massif where selective logging is the primary degradation process observed. As a result, degraded forests include smaller trees than intact forests, resulting in discontinuities in the canopy. Vo Quang et al. improved the photo-interpretation method for degraded forests in Guinea. The results highlight the significant contribution of Sentinel-2, thanks to its broad range of spectral reflectance, including the mid-infrared region, which considerably improves the separability between dense and degraded forests.This allowed to train a Convolutional Neural Network (CNNs) able to detect degraded forests in similar biogeographic contexts as for the training dataset, as the method is transferable and applicable across different years and similar forest types. However, the generalization of this CNN model to other forest and climatic contexts needs to be studied. There are various forms of degradation and degraded forests, and it is unclear whether the methods can be well suited to monitor them.
3 Perspective for the development of remote sensing products for forest attributes in the context of the African tropical forest
In the above sections, we have briefly reviewed the main remote sensing methods which have been used to monitor the African tropical forests and we have presented some key results. We have shown that the use of machine learning methods, especially those based on deep learning have led to key advances in the monitoring of forests both in space (within a range of spatial resolution of about 3–50 m) and time (interannual variations). In the following we will present a rapid perspective, analysing how these new methods could be applied in the context of the African continent, and then more generally across the tropics.
3.1 Improving maps of forest composition and function
Tests with different pre-processing levels of Sentinel 2 images and state-of-the-art deep learning models and methods (DINOv2, see Oquab et al., 2024) indicate that correcting atmospheric and directional effects remain primordial to attain satisfactory results in terms of mapping forest types and deciduousness. This might be because the main signal in the data comes from spectral components and not from the image texture. Since deep learning approaches are very data-intensive for the calibration and validation of the network, it should be based on 1) a self-supervised framework that limits the need for training data (Ericsson et al., 2021) and 2) then use a reference dataset based on the existing network of plots, photo-interpretation of VHR images (Pleiades, GeoEye and Spot7) and drone orthomosaics (see section 3.5). This would require the help of local experts in targeted countries to finally train the model in a supervised way. This two step strategy appears as a promising approach to reach a high degree of accuracy with a limited amount of (time-consuming) reference data. The methods could be developed first on test regions with sufficient ground observations (typically southern Cameroon, northern Congo or northern Gabon) and on the well monitored supersites (GEOTREES). Then, an extrapolation of this approach to a transnational approach would allow mapping the main forest types of Central African forests and depending on the availability of cloud-free Sentinel- 2 data.
Once the main forest types are defined, it is important to quantify the relative abundance of the main functional types first (Atlantic, semi-deciduous and evergreen forests) and then consider a broader diversity of classes. The collection of functional traits on the most abundant species within GEOTREES supersites and phenological observations derived from repeated drone measurements would additionally help to calibrate and validate quantitative phenological maps based on static or temporal series of Sentinel 2 data, where available. To extrapolate, it would be necessary to assess the potential of AI approaches to automatically identify phenophases and functional types from high resolution drone or satellite data. Such data would also benefit land surface models to improve simulations of carbon and water fluxes.
3.2 Towards a monitoring of tree height change over Congo basin
Following the methodology developed in many recent studies (e.g., Fayad et al., 2024; Schwartz et al., 2024), it is possible to produce annual height maps over all wet tropical forests in Africa since 2017. These products can be compared against 1) existing global height products based on Landsat or on Sentinel-2, 2) independent GEDI footprints that have not been used in the model training procedures, 3) airborne LiDAR campaigns (ALS) acquired over Ghana (Stereńczak et al., 2020), Gabon (AfriSAR (Rodda et al., 2024)), Congo (Stereńczak et al., 2020) and Cameroon (Rodda et al., 2024), and 4) forest inventory sites including the supersites of the GEOTREES program and the existing ForestPlots local inventories. If tree height taken from inventories are considered as the ground truth, it is worth noticing that these measurements can sometimes be heavily biased (Terryn et al., 2024).
At the same time, DL models should be improved to better account for GEDI geolocation errors by shifting them together within sub-tracks (footprints from the same orbit and beam) based on minimizing a user-defined loss function. The fusion of new data from L-band radar (ALOS/PALSAR) and from the upcoming NISAR mission products that should be available in 2024 (Kellogg et al., 2020) could also be tested to improve the height maps over wet tropical forests. The update of the maps for all years since 2017 (start of the Sentinel 2 times series) would ensure data and model versioning and traceability, permanent quality assessment and quality control (QA/QC), and performance evaluation against independent observations. In the long term, the annual production of height maps would allow to assess trends in the forest C stocks.
The potential of radar altimetry could also be explored to increase the number of available data to estimate forest height and their changes against. Even if along-track altimetry data were poorly exploited to estimate forest height due to their very low coverage of the Earth surface in spite of realistic height estimates (Berry et al., 2007; Frappart et al., 2021), the wide-swath Surface Water and Ocean Topography (SWOT) radar altimetry mission (Fu et al., 2024), that has been mapping surface elevation and coherence in the inundation mask since December 2022, is likely to provide complementary information on canopy height and AGB at high spatial (10–60 m) and temporal resolutions (21-day) for each swath which can be used for monitoring interannual changes over edaphic forests and non-flooded forests contained in the SWOT wetland mask. Early results obtained in the Congo Cuvette Centrale showed large changes in surface elevation time-series over narrow rivers surrounded by forests suggesting possible locations of echoes over rivers and forests from one pass to another (Normandin et al., 2024).
Finally, in 2025, CNES (the French Space Agency) plans to launch the CO3D (Constellation Optique en 3 Dimensions) mission, comprising four very high resolution optical satellites. This constellation will deliver a highly accurate 3D map of Earth’s surface, enabling the production of accessible 3D digital terrain models with a resolution of 50 cm, covering the entire world in 5 years. Combined with other Earth observation satellites, CO3D will be a valuable asset for monitoring tree height.
3.3 Towards a mapping of forest biomass change
Accurately converting canopy height into biomass remains a challenge, requiring in situ inventory or airborne LiDAR data from diverse forest sites, including degraded and low biomass forests to build allometry models. Large plots are particularly valuable for assessing empirical relationships between biomass, height, and other vegetation characteristics such as tree density, crown area, and wood density—features that can partly be estimated through remote sensing. The GEOTREES supersites data will offer an opportunity to work on height-biomass The GEOTREES supersites data will offer an opportunity to work on height-biomass allometric relationships over different footprint areas, from 25 to 100 m radius and beyond. Simpler approaches such as the empirical derivation of height-biomass relationships at the stand level can also be tested based on modelled or observed height (see Section 3.1). These methods will support the development biomass maps for wet tropical forests, incorporating uncertainty estimates, e.g., based on different allometric approaches and input data for AI models. Given the spatial heterogeneity of biomass, accurate maps should be produced at 30- and 100-m resolutions in order to capture the biomass of a sufficient number of trees, even if height maps can be available at finer scales. Indeed, there is a consensus that the final resolution of the product should not be too high (around 10 m for height or 30 m for biomass). However, it is not clear what resolution data (up to 1 m or 50 cm) is needed to produce the most accurate maps from AI models. In addition, a trade-off needs to be made between increasing accuracy and increasing the cost of satellite data and product calculations.
Once generated, these biomass products must be independently evaluated using plot data not involved in their calibration. They can also be compared against existing global datasets including ESA CCI Biomass, the above-ground biomass map of African savannas and woodlands from Bouvet et al. (2018), and CTREES maps (https://ctrees.org). Aggregated at a large scale (about 25 km), the annual trends in C stocks obtained from these methods could be compared with coarse resolution estimates of biomass change assessed from the L-VOD product since 2010 (Wigneron et al., 2024).
The annual production of these maps would enable the detection and quantification of biomass gains and losses, particularly in response to degradation or deforestation. A specific focus should be given to the monitoring of biomass dynamics in shifting cultivation areas, which are widespread in the Congo Basin.
To further refine biomass mapping methodologies, a next step would be to incorporate additional height metrics extracted from GEDI vertical waveforms. These metrics would better capture parameters related to canopy thickness and vertical structure which relate to biomass in a less ambiguous way than top or dominant canopy height alone, which is most commonly used in current maps. The new generation of biomass maps could be extended outside wet forest regions to Miombos, woodlands and dry ecosystems with sparse trees. This extension could lead to the first high-resolution biomass carbon change budget for over the African continent based on advanced IA methods.Over the long term, it will be interesting to assess trends and changes, as well as to evaluate the accuracy of the products across all GEOTREES sites and ALS campaigns. These datasets will also support intercomparisons with biomass estimates derived from ESA BIOMASS mission’s upcoming P-band SAR images (Quegan et al., 2019). Expected to be launched in 2024, this mission should enhance the reliability of large-scale forest canopy height and above-ground biomass maps, especially in dense forests of the tropics, where P-band is expected to be much less affected by saturation effects than higher frequency bands as L-, C- and X-bands.
3.4 Towards improved maps of forest degradation
To map degradation of African tropical forests caused by logging, fire, and road construction at a fine resolution, deep learning methods can be developed and trained on images from the Planet NICFI mosaics, as developed by Dalagnol et al. (2023) in the Amazon Basin.
Information on the occurrence and severity of different types of degradation events could then be crossed with biomass change maps (Section 3.3) and with forest height change maps (see Section 3.2) to assess the carbon loss or recovery gain associated with degradation events.
In the long term, dataset on forest degradation, deforestation activity and resulting biomass and height change could be produced annually. It would allow to provide a continuous carbon budget from degradation and deforestation over all countries covered, with an attribution to disturbance types and drivers and an analysis of lagged effects such as forest dieback after a severe drought or non-sustainable logging activities, and resulting cascading effects such as forests being logged and cut after degradation, or combined effects from drought followed by fire.
It is also worth addressing the challenge of the adaptation and implementation of the CNN methodology (Vo Quang et al., 2022) in various tropical forest regions in order to obtain a comprehensive assessment of the current state and trends of forest degradation, ultimately contributing to global conservation initiatives and sustainable forest management. To do so, we could rely on the same methodology as used in (Vo Quang et al., 2022), starting from the photo interpretation of Sentinel 2 images in the context of the Congo basin, to consider various types of degraded forests, and to consider the differences in the climatic context. The objective would be either to build a CNN model able to map the degraded forests from the West African context to the whole Congo basin context, or alternatively to build a set of CNN models specifically for each context.
3.5 Perspectives in deep learning applied to remote sensing
In the last few years, artificial intelligence models has shifted towards the use of Transformers (Dosovitskiy et al., 2021; Vaswani et al., 2017) and Self-Supervised Learning (SSL). Self-Supervised learning consists of pre-training a model on a pretext task, such as reconstruction of degraded data for instance (see Shwartz Ziv and LeCun, 2024 for an overview of common methods) before fine tuning it for a downstream target task (e.g., prediction of forest composition or tree height). Thus, the model can learn the underlying structure of a dataset during pre-training and finetuning is less data and resource demanding (Ericsson et al., 2021). This means that the need for labelled data is shifted towards a need for raw data, which is particularly relevant when using remote sensing over regions where ground truth data is difficult to acquire, such as tropical forests.
Vision Transformers (ViTs, Dosovitskiy et al., 2021) have shown good synergy with SSL and have thus become the state of the art models for most computer vision tasks (Caron et al., 2021; He et al., 2022; Oquab et al., 2024). The attention mechanism built in Transformers enables them to better handle the structure of an image rather than focussing mostly on texture like CNN. Current research seems to suggest that the superiority of ViTs for computer vision tasks on natural images does not necessarily translate when applied to remote sensing of forests (see for instance Fogel et al., 2024; Section 3.1). Overall, CNNs seem to be better suited if the information is mostly spectral and textural and ViTs if the information is structural.
3.6 Discussion about the resolution and the need for ground-truth data
We have shown in the previous sections that the application of AI methods to remote sensing has improved the accuracy of height maps in regions where they were tested (Liu et al., 2023; Schwartz et al., 2024) as it paved the way for the first global maps of canopy height at 10 m convertible into biomass maps at 30 m resolution (Lang et al., 2023). More recently, the fusion of radar products with optical imagery has further enhanced accuracy by limiting the impact of cloud cover. However, these improvements come with important trade-offs and limitations that must be considered.
While finer spatial resolutions can capture detailed canopy structures, the assumption that “higher resolution is always better” does not hold for all applications—especially for biomass estimation in dense tropical forests. In such environments, trees often have overlapping crowns and large diameters, meaning that resolutions below the typical canopy size (about 10 m) may not translate into meaningful improvements in accuracy. Indeed, increasing resolution beyond 30 m for AGB mapping is often unwarranted given the aggregation scale needed to meaningfully quantify biomass (Duncanson et al., 2025). Moreover, very high resolution (3 m and below) is very expensive, often not publicly available (PlanetScope and SPOT data), has a limited temporal repetitiveness, diminishing the chances to obtain cloud-free optical images in the African moist forests. Finally, the processing of these data requires intensive and expensive computing facilities which is a major challenge for their use in developing countries.
AI methods have significantly improved the estimation of forest attributes by integrating CH with ancillary datasets (Fatoyinbo et al., 2021; Liang et al., 2023; Saatchi et al., 2011; Xu et al., 2017). However, it is critical to emphasize that these methods are not a substitute for robust in situ observations (Ploton et al., 2020). AI-driven models depend on high-quality training and validation datasets, and without sufficient ground truth data, even sophisticated algorithms cannot achieve reliable accuracy. In many parts of the Central African forests, the scarcity of publicly available field observations—inclu data sovereignty issues—hinders both model calibration and validation. Addressing these challenges requires strengthening in situ observation networks, which are essential not only for training AI models but also for validating their outputs. Unfortunately, publicly available field observations in the Congo Basin remain scarce, despite the well-recognized need for them. Some initiatives, such as GEOTREES (Chave et al., 2019), aim to bridge this gap by deploying a network of supersites, prioritizing data quality over quantity to enhance the reliability of remote sensing-based CH and AGB estimates.
In summary, although the recent availability in high-resolution remote sensing and AI models has pushed forward the capabilities for monitoring forest biomass, it is crucial to adopt a balanced perspective. For dense tropical forests, resolutions in the range of 30–100 m may be optimal for capturing biomass dynamics, while higher resolutions do not necessarily lead to proportionate gains in accuracy and often entail prohibitive costs. However, very high resolution (e.g., meter scale data) are very powerful to detect mortality at tree level (Brandt et al., 2024b). Ultimately, the accuracy of remote sensing products depends on the availability and quality of ground-truth data, in particular for biomass and tree species/forest types maps, making it imperative to invest in more accessible and extensive in situ observation networks, in particular plots larger than 1 Ha that match the resolution of biomass datasets, and revisits of airborne Lidar campaigns to verify changes.
4 Conclusion
In this paper, we reviewed recent advancements in remote sensing methods for monitoring African tropical forests. Specifically:
We assessed existing products for forest typology, canopy height, and biomass mapping.
We identified limitations and best practice requirements to assess these products, particularly regarding data availability and validation.
We discussed the opportunities offered by the increasing availability of remote sensing data and the development of innovative AI models to retrieve maps of new forest attributes such as forest composition, phenology, and vertical structure.
We emphasized the critical role of ground-truth observations, as their scarcity remains a major obstacle to improving the reliability of forest monitoring products.
The availability of diverse satellite constellations has created new opportunities for large-scale forest mapping and carbon dynamics monitoring. Advances in Earth observation techniques and AI have demonstrated the potential to develop forest monitoring systems that provide detailed and accurate spatial information on biomass, carbon balance, canopy structure, and forest biodiversity. However, this research progress varies considerably between Amazonian, African, and Asian forests. For example, research in the Amazon basin is more advanced than in African forests, because of a more comprehensive understanding of the carbon cycle, productivity, and response to environmental change. Unfortunately, the complexity of tropical forest ecosystems and the type and scale of forest disturbance and degradation make it difficult to directly reproduce the existing methods and studies in Africa. The limitations of existing data, such as observation plots, highlight the need for continuous refinement of these methods to improve the reliability of African-based research on disturbance, recovery, and carbon dynamics in tropical forests. In particular, there is no point in developing the analysis of remote sensing products if the results cannot be compared to the reality of the ground. That is why, it is necessary to expand the plot network and to develop sampling methods at the regional scale to make all ground observations comparable.
Recent initiatives are promising such as co-creation and networking with local researchers to identify the needs and priority to improve our understanding of the Congo Basin Forest. For example, the Congo Basin Science Initiative (CBSI) will focus on capacity building for observation and data collection in the central African tropical forest. The One Forest Vision initiative (OFVi) aims to provide scientific support for the development of IT platforms for continuous monitoring of carbon and biodiversity reservoirs in the Congo forest basins. Although not fully confirmed, NASA’s PANGEA project has a broader scope as it aims to better understand the combined effects of climate and land-use change in tropical forests within and between continents by combining in situ field data with remotely sensed airborne and spaceborne data. Overall, what should be aimed is a synergy among researchers and stakeholders with interest in the forest sector that will likely contribute in improving the design of sampling frame and ground truthing process that are prerequisite for improved forest related research with a cost effective approach.
Author contributions
TB: Conceptualization, Methodology, Project administration, Supervision, Visualization, Writing–original draft, Writing–review and editing. PC: Conceptualization, Funding acquisition, Methodology, Project administration, Supervision, Writing–original draft, Writing–review and editing. SR: Visualization, Writing–original draft, Writing–review and editing. LW: Visualization, Writing–original draft, Writing–review and editing. BY: Visualization, Writing–original draft, Writing–review and editing. EA: Writing–original draft, Writing–review and editing. NBa: Writing–original draft, Writing–review and editing. MB: Writing–original draft, Writing–review and editing. NDe: Writing–original draft, Writing–review and editing. FF: Funding acquisition, Writing–original draft, Writing–review and editing. TG: Writing–original draft, Writing–review and editing. EH: Writing–original draft, Writing–review and editing. SI: Writing–original draft, Writing–review and editing. GJ: Writing–original draft, Writing–review and editing. PMa: Writing–original draft, Writing–review and editing. MM: Writing–original draft, Writing–review and editing. TM: Writing–original draft, Writing–review and editing. CN: Writing–original draft, Writing–review and editing. CO: Writing–original draft, Writing–review and editing. MP: Writing–review and editing, Writing–original draft. CP: Writing–original draft, Writing–review and editing. PP: Visualization, Writing–original draft, Writing–review and editing. LS: Writing–original draft, Writing–review and editing. MS: Writing–original draft, Writing–review and editing. VS: Writing–original draft, Writing–review and editing. BS: Writing–original draft, Writing–review and editing. PT: Writing–original draft, Writing–review and editing. AD: Writing–original draft, Writing–review and editing. AV: Writing–original draft, Writing–review and editing. J-PW: Writing–original draft, Writing–review and editing.
Funding
The author(s) declare that financial support was received for the research, authorship, and/or publication of this article. This research was made in the frame of the One Forest Vision initiative funded by the French Ministry of Research and the French Ministry of Foreign Affairs.
Acknowledgments
We thank Pierre Defourny and Julien Thonnard for sharing the data to reproduce Figure 2. We thank the three anonymous referees for their insightful comments.
Conflict of interest
Author AD was employed by Kayrros SAS.
The remaining authors declare that the research was conducted in the absence of any commercial or financial relationships that could be construed as a potential conflict of interest.
The author(s) declared that they were an editorial board member of Frontiers, at the time of submission. This had no impact on the peer review process and the final decision.
Generative AI statement
The author(s) declare that no Generative AI was used in the creation of this manuscript.
Publisher’s note
All claims expressed in this article are solely those of the authors and do not necessarily represent those of their affiliated organizations, or those of the publisher, the editors and the reviewers. Any product that may be evaluated in this article, or claim that may be made by its manufacturer, is not guaranteed or endorsed by the publisher.
References
Abbas, S., Wong, M. S., Wu, J., Shahzad, N., and Muhammad Irteza, S. (2020). Approaches of satellite remote sensing for the assessment of above-ground biomass across tropical forests: pan-tropical to national scales. Remote Sens. 12, 3351. doi:10.3390/rs12203351
Adugna, T., Xu, W., and Fan, J. (2022). Comparison of random forest and support vector machine classifiers for regional land cover mapping using coarse resolution FY-3C images. Remote Sens. 14, 574. doi:10.3390/rs14030574
Ahlström, A., Raupach, M. R., Schurgers, G., Smith, B., Arneth, A., Jung, M., et al. (2015). The dominant role of semi-arid ecosystems in the trend and variability of the land CO 2 sink. Science 348, 895–899. doi:10.1126/science.aaa1668
Antropov, O., Rauste, Y., Praks, J., Seifert, F. M., and Häme, T. (2021). Mapping forest disturbance due to selective logging in the Congo basin with RADARSAT-2 time series. Remote Sens. 13, 740. doi:10.3390/rs13040740
Assede, E. S. P., Orou, H., Biaou, S. S. H., Geldenhuys, C. J., Ahononga, F. C., and Chirwa, P. W. (2023). Understanding drivers of land use and land cover change in Africa: a review. Curr. Landsc. Ecol. Rep. 8, 62–72. doi:10.1007/s40823-023-00087-w
Avitabile, V., Herold, M., Heuvelink, G. B. M., Lewis, S. L., Phillips, O. L., Asner, G. P., et al. (2016). An integrated pan-tropical biomass map using multiple reference datasets. Glob. Change Biol. 22, 1406–1420. doi:10.1111/gcb.13139
Baccini, A., Goetz, S. J., Walker, W. S., Laporte, N. T., Sun, M., Sulla-Menashe, D., et al. (2012). Estimated carbon dioxide emissions from tropical deforestation improved by carbon-density maps. Nat. Clim. Change 2, 182–185. doi:10.1038/nclimate1354
Bennett, J. R., Maloney, R. F., Steeves, T. E., Brazill-Boast, J., Possingham, H. P., and Seddon, P. J. (2017). Spending limited resources on de-extinction could lead to net biodiversity loss. Nat. Ecol. Evol. 1, 0053. doi:10.1038/s41559-016-0053
Berninger, A., Lohberger, S., Zhang, D., and Siegert, F. (2019). Canopy height and above-ground biomass retrieval in tropical forests using multi-pass X- and C-band pol-InSAR data. Remote Sens. 11, 2105. doi:10.3390/rs11182105
Berry, P. A. M., Garlick, J. D., and Smith, R. G. (2007). Near-global validation of the SRTM DEM using satellite radar altimetry. Remote Sens. Environ. 106, 17–27. doi:10.1016/j.rse.2006.07.011
Berzaghi, F., Longo, M., Ciais, P., Blake, S., Bretagnolle, F., Vieira, S., et al. (2019). Carbon stocks in central African forests enhanced by elephant disturbance. Nat. Geosci. 12, 725–729. doi:10.1038/s41561-019-0395-6
Betbeder, J., Gond, V., Frappart, F., Baghdadi, N. N., Briant, G., and Bartholome, E. (2014). Mapping of central Africa forested wetlands using remote sensing. IEEE J. Sel. Top. Appl. Earth Obs. Remote Sens. 7, 531–542. doi:10.1109/JSTARS.2013.2269733
Bourgoin, C., Ceccherini, G., Girardello, M., Vancutsem, C., Avitabile, V., Beck, P. S. A., et al. (2024). Human degradation of tropical moist forests is greater than previously estimated. Nature 631, 570–576. doi:10.1038/s41586-024-07629-0
Bouvet, A., Mermoz, S., Le Toan, T., Villard, L., Mathieu, R., Naidoo, L., et al. (2018). An above-ground biomass map of African savannahs and woodlands at 25 m resolution derived from ALOS PALSAR. Remote Sens. Environ. 206, 156–173. doi:10.1016/j.rse.2017.12.030
Brandt, M., Chave, J., Li, S., Fensholt, R., Ciais, P., Wigneron, J.-P., et al. (2024a). High-resolution sensors and deep learning models for tree resource monitoring. Nat. Rev. Electr. Eng. 2, 13–26. doi:10.1038/s44287-024-00116-8
Brandt, M., Gominski, D., Reiner, F., Kariryaa, A., Guthula, V. B., Ciais, P., et al. (2024b). Severe decline in large farmland trees in India over the past decade. Nat. Sustain. 7, 860–868. doi:10.1038/s41893-024-01356-0
Brandt, M., Tucker, C. J., Kariryaa, A., Rasmussen, K., Abel, C., Small, J., et al. (2020). An unexpectedly large count of trees in the West African Sahara and Sahel. Nature 587, 78–82. doi:10.1038/s41586-020-2824-5
Brienen, R. J. W., Wanek, W., and Hietz, P. (2011). Stable carbon isotopes in tree rings indicate improved water use efficiency and drought responses of a tropical dry forest tree species. Trees 25, 103–113. doi:10.1007/s00468-010-0474-1
Brockerhoff, E. G., Barbaro, L., Castagneyrol, B., Forrester, D. I., Gardiner, B., González-Olabarria, J. R., et al. (2017). Forest biodiversity, ecosystem functioning and the provision of ecosystem services. Biodivers. Conserv. 26, 3005–3035. doi:10.1007/s10531-017-1453-2
Bwangoy, J.-R. B., Hansen, M. C., Roy, D. P., Grandi, G. D., and Justice, C. O. (2010). Wetland mapping in the Congo Basin using optical and radar remotely sensed data and derived topographical indices. Remote Sens. Environ. 114, 73–86. doi:10.1016/j.rse.2009.08.004
Carcereri, D., Rizzoli, P., Dell’Amore, L., Bueso-Bello, J.-L., Ienco, D., and Bruzzone, L. (2024). Generation of country-scale canopy height maps over Gabon using deep learning and TanDEM-X InSAR data. Remote Sens. Environ. 311, 114270. doi:10.1016/j.rse.2024.114270
Caron, M., Touvron, H., Misra, I., Jegou, H., Mairal, J., Bojanowski, P., et al. (2021). “Emerging properties in self-supervised vision Transformers,” in 2021 IEEE/CVF international conference on computer vision (ICCV). Presented at the 2021 IEEE/CVF international conference on computer vision (ICCV) Montreal, QC, Canada, 11-17 October 2021, IEEE), 9630–9640. doi:10.1109/ICCV48922.2021.00951
Carstairs, H., Mitchard, E. T. A., McNicol, I., Aquino, C., Burt, A., Ebanega, M. O., et al. (2022). An effective method for InSAR mapping of tropical forest degradation in hilly areas. Remote Sens. 14, 452. doi:10.3390/rs14030452
Chave, J., Davies, S. J., Phillips, O. L., Lewis, S. L., Sist, P., Schepaschenko, D., et al. (2019). Ground data are essential for biomass remote sensing missions. Surv. Geophys. 40, 863–880. doi:10.1007/s10712-019-09528-w
Cooper, D. L. M., Lewis, S. L., Sullivan, M. J. P., Prado, P. I., Ter Steege, H., Barbier, N., et al. (2024). Consistent patterns of common species across tropical tree communities. Nature 625, 728–734. doi:10.1038/s41586-023-06820-z
Curtis, P. G., Slay, C. M., Harris, N. L., Tyukavina, A., and Hansen, M. C. (2018). Classifying drivers of global forest loss. Science 361, 1108–1111. doi:10.1126/science.aau3445
Dalagnol, R., Wagner, F. H., Galvão, L. S., Braga, D., Osborn, F., Sagang, L. B., et al. (2023). Mapping tropical forest degradation with deep learning and Planet NICFI data. Remote Sens. Environ. 298, 113798. doi:10.1016/j.rse.2023.113798
Dalimier, J., Achard, F., Delhez, B., Desclée, B., Bourgoin, C., Eva, H., et al. (2022). Répartition des types de forêts et évolution selon leur affectation. CIFOR-ICRAF. Available online at: https://www.cifor-icraf.org/knowledge/publication/8566/(Accessed July 5, 24).
Decuyper, M., Mulatu, K. A., Brede, B., Calders, K., Armston, J., Rozendaal, D. M. A., et al. (2018). Assessing the structural differences between tropical forest types using Terrestrial Laser Scanning. For. Ecol. Manag. 429, 327–335. doi:10.1016/j.foreco.2018.07.032
Deutscher, J., Perko, R., Gutjahr, K., Hirschmugl, M., and Schardt, M. (2013). Mapping tropical rainforest canopy disturbances in 3D by COSMO-SkyMed spotlight InSAR-stereo data to detect areas of forest degradation. Remote Sens. 5, 648–663. doi:10.3390/rs5020648
Dosovitskiy, A., Beyer, L., Kolesnikov, A., Weissenborn, D., Zhai, X., Unterthiner, T., et al. (2021). An image is worth 16x16 words: Transformers for image recognition at scale.
Dubayah, R., Hofton, M., Blair, J. B., Armston, J., Tang, H., and Luthcke, S. (2021). GEDI L2A elevation and height metrics data global footprint level V002. doi:10.5067/GEDI/GEDI02_A.002
Dubayah, R. O., Armston, J., Healey, S. P., Yang, Z., Patterson, P. L., Saarela, S., et al. (2023). Global ecosystem dynamics investigation (GEDI)GEDI L4B gridded above-ground biomass density, version 2.1 0 MB. doi:10.3334/ORNLDAAC/2299
Duncanson, L., Hunka, N., Jucker, T., Armston, J., Harris, N., Fatoyinbo, L., et al. (2025). Spatial resolution for forest carbon maps. Science 387, 370–371. doi:10.1126/science.adt6811
Ericsson, L., Gouk, H., and Hospedales, T. M. (2021). “How well do self-supervised models transfer?,” in 2021 IEEE/CVF conference on computer vision and pattern recognition (CVPR). Presented at the 2021 IEEE/CVF conference on computer vision and pattern recognition (CVPR) Nashville, TN, USA, 19-25 June 2021, IEEE), 5410–5419. doi:10.1109/CVPR46437.2021.00537
Ernst, Y., Archibald, S., Chevallier, F., Ciais, P., Fischer, C. G., Gaubert, B., et al. (2023). The african regional greenhouse gases budget (2010-2019) (preprint). Preprints. doi:10.22541/essoar.169866878.81035511/v1
Fatoyinbo, T., Armston, J., Simard, M., Saatchi, S., Denbina, M., Lavalle, M., et al. (2021). The NASA AfriSAR campaign: airborne SAR and lidar measurements of tropical forest structure and biomass in support of current and future space missions. Remote Sens. Environ. 264, 112533. doi:10.1016/j.rse.2021.112533
Fayad, I., Ciais, P., Schwartz, M., Wigneron, J.-P., Baghdadi, N., De Truchis, A., et al. (2024). Hy-TeC: a hybrid vision transformer model for high-resolution and large-scale mapping of canopy height. Remote Sens. Environ. 302, 113945. doi:10.1016/j.rse.2023.113945
Feng, Y., Ciais, P., Wigneron, J.-P., Xu, Y., Ziegler, A. D., Van Wees, D., et al. (2024). Global patterns and drivers of tropical aboveground carbon changes. Nat. Clim. Change 14, 1064–1070. doi:10.1038/s41558-024-02115-x
Feng, Y., Zeng, Z., Searchinger, T. D., Ziegler, A. D., Wu, J., Wang, D., et al. (2022). Doubling of annual forest carbon loss over the tropics during the early twenty-first century. Nat. Sustain. 5, 444–451. doi:10.1038/s41893-022-00854-3
Flores, A., Herndon, K., Thapa, R., and Cherrington, E. (2019). Synthetic aperture radar (SAR) handbook: comprehensive methodologies for forest monitoring and biomass estimation. doi:10.25966/NR2C-S697
Fogel, F., Perron, Y., Besic, N., Saint-André, L., Pellissier-Tanon, A., Schwartz, M., et al. (2024). Open-canopy: a country-scale benchmark for canopy height estimation at very high resolution.
Frappart, F., Blarel, F., Papa, F., Prigent, C., Mougin, E., Paillou, P., et al. (2021). Backscattering signatures at Ka, Ku, C and S bands from low resolution radar altimetry over land. Adv. Space Res. 68, 989–1012. doi:10.1016/j.asr.2020.06.043
Frappart, F., Wigneron, J.-P., Li, X., Liu, X., Al-Yaari, A., Fan, L., et al. (2020). Global monitoring of the vegetation dynamics from the vegetation optical depth (VOD): a review. Remote Sens. 12, 2915. doi:10.3390/rs12182915
Fu, L., Pavelsky, T., Cretaux, J., Morrow, R., Farrar, J. T., Vaze, P., et al. (2024). The surface water and Ocean Topography mission: a breakthrough in radar remote sensing of the ocean and land surface water. Geophys. Res. Lett. 51, e2023GL107652. doi:10.1029/2023GL107652
Ghosh, S. M., Behera, M. D., Kumar, S., Das, P., Prakash, A. J., Bhaskaran, P. K., et al. (2022). Predicting the forest canopy height from LiDAR and multi-sensor data using machine learning over India. Remote Sens. 14, 5968. doi:10.3390/rs14235968
Giam, X. (2017). Global biodiversity loss from tropical deforestation. Proc. Natl. Acad. Sci. 114, 5775–5777. doi:10.1073/pnas.1706264114
Grassi, G., Conchedda, G., Federici, S., Abad Viñas, R., Korosuo, A., Melo, J., et al. (2022). Carbon fluxes from land 2000–2020: bringing clarity to countries’ reporting. Earth Syst. Sci. Data 14, 4643–4666. doi:10.5194/essd-14-4643-2022
Gupta, R., and Sharma, L. K. (2022). Mixed tropical forests canopy height mapping from spaceborne LiDAR GEDI and multisensor imagery using machine learning models. Remote Sens. Appl. Soc. Environ. 27, 100817. doi:10.1016/j.rsase.2022.100817
Hansen, M. C., Potapov, P. V., Goetz, S. J., Turubanova, S., Tyukavina, A., Krylov, A., et al. (2016). Mapping tree height distributions in Sub-Saharan Africa using Landsat 7 and 8 data. Remote Sens. Environ. 185, 221–232. doi:10.1016/j.rse.2016.02.023
Hansen, M. C., Potapov, P. V., Moore, R., Hancher, M., Turubanova, S. A., Tyukavina, A., et al. (2013). High-resolution global maps of 21st-century forest cover change. Science 342, 850–853. doi:10.1126/science.1244693
He, K., Chen, X., Xie, S., Li, Y., Dollar, P., and Girshick, R. (2022). “Masked autoencoders are scalable vision learners,” in 2022 IEEE/CVF conference on computer vision and pattern recognition (CVPR). Presented at the 2022 IEEE/CVF conference on computer vision and pattern recognition (CVPR) New Orleans, LA, USA, 18-24 June 2022, IEEE, 15979–15988. doi:10.1109/CVPR52688.2022.01553
Heinrich, V. H. A., Vancutsem, C., Dalagnol, R., Rosan, T. M., Fawcett, D., Silva-Junior, C. H. L., et al. (2023). The carbon sink of secondary and degraded humid tropical forests. Nature 615, 436–442. doi:10.1038/s41586-022-05679-w
Hubau, W., Lewis, S. L., Phillips, O. L., Affum-Baffoe, K., Beeckman, H., Cuní-Sanchez, A., et al. (2020). Asynchronous carbon sink saturation in African and Amazonian tropical forests. Nature 579, 80–87. doi:10.1038/s41586-020-2035-0
Karlson, M., Ostwald, M., Reese, H., Sanou, J., Tankoano, B., and Mattsson, E. (2015). Mapping tree canopy cover and above-ground biomass in sudano-sahelian woodlands using Landsat 8 and random forest. Remote Sens. 7, 10017–10041. doi:10.3390/rs70810017
Kellogg, K., Hoffman, P., Standley, S., Shaffer, S., Rosen, P., Edelstein, W., et al. (2020). “NASA-ISRO synthetic aperture radar (NISAR) mission,” in 2020 IEEE aerospace conference. Presented at the 2020 IEEE aerospace conference, IEEE, big sky MT, USA, 7-14 March 2020, 1–21. doi:10.1109/AERO47225.2020.9172638
Khairoun, A., Mouillot, F., Chen, W., Ciais, P., and Chuvieco, E. (2024). Coarse-resolution burned area datasets severely underestimate fire-related forest loss. Sci. Total Environ. 920, 170599. doi:10.1016/j.scitotenv.2024.170599
Lang, N., Jetz, W., Schindler, K., and Wegner, J. D. (2023). A high-resolution canopy height model of the Earth. Nat. Ecol. Evol. 7, 1778–1789. doi:10.1038/s41559-023-02206-6
Lang, N., Kalischek, N., Armston, J., Schindler, K., Dubayah, R., and Wegner, J. D. (2022). Global canopy height regression and uncertainty estimation from GEDI LIDAR waveforms with deep ensembles. Remote Sens. Environ. 268, 112760. doi:10.1016/j.rse.2021.112760
Lefsky, M. A. (2010). A global forest canopy height map from the moderate resolution imaging spectroradiometer and the geoscience laser altimeter system. Geophys. Res. Lett. 37, 2010GL043622. doi:10.1029/2010GL043622
Li, W., Guo, W.-Y., Pasgaard, M., Niu, Z., Wang, L., Chen, F., et al. (2023). Human fingerprint on structural density of forests globally. Nat. Sustain. 6, 368–379. doi:10.1038/s41893-022-01020-5
Liang, M., Duncanson, L., Silva, J. A., and Sedano, F. (2023). Quantifying above-ground biomass dynamics from charcoal degradation in Mozambique using GEDI Lidar and Landsat. Remote Sens. Environ. 284, 113367. doi:10.1016/j.rse.2022.113367
Liu, A., Cheng, X., and Chen, Z. (2021). Performance evaluation of GEDI and ICESat-2 laser altimeter data for terrain and canopy height retrievals. Remote Sens. Environ. 264, 112571. doi:10.1016/j.rse.2021.112571
Liu, S., Brandt, M., Nord-Larsen, T., Chave, J., Reiner, F., Lang, N., et al. (2023). The overlooked contribution of trees outside forests to tree cover and woody biomass across Europe. Sci. Adv. 9, eadh4097. doi:10.1126/sciadv.adh4097
Manogaran, G., and Lopez, D. (2018). Spatial cumulative sum algorithm with big data analytics for climate change detection. Comput. Electr. Eng. 65, 207–221. doi:10.1016/j.compeleceng.2017.04.006
Marselis, S. M., Keil, P., Chase, J. M., and Dubayah, R. (2022). The use of GEDI canopy structure for explaining variation in tree species richness in natural forests. Environ. Res. Lett. 17, 045003. doi:10.1088/1748-9326/ac583f
Marselis, S. M., Tang, H., Armston, J. D., Calders, K., Labrière, N., and Dubayah, R. (2018). Distinguishing vegetation types with airborne waveform lidar data in a tropical forest-savanna mosaic: a case study in Lopé National Park, Gabon. Remote Sens. Environ. 216, 626–634. doi:10.1016/j.rse.2018.07.023
Martin, A. R., Doraisami, M., and Thomas, S. C. (2018). Global patterns in wood carbon concentration across the world’s trees and forests. Nat. Geosci. 11, 915–920. doi:10.1038/s41561-018-0246-x
Masolele, R. N., Marcos, D., De Sy, V., Abu, I.-O., Verbesselt, J., Reiche, J., et al. (2024). Mapping the diversity of land uses following deforestation across Africa. Sci. Rep. 14, 1681. doi:10.1038/s41598-024-52138-9
Mitchard, E. T. A. (2018). The tropical forest carbon cycle and climate change. Nature 559, 527–534. doi:10.1038/s41586-018-0300-2
Mitchard, E. T. A., Saatchi, S. S., White, L. J. T., Abernethy, K. A., Jeffery, K. J., Lewis, S. L., et al. (2012). Mapping tropical forest biomass with radar and spaceborne LiDAR in Lopé National Park, Gabon: overcoming problems of high biomass and persistent cloud. Biogeosciences 9, 179–191. doi:10.5194/bg-9-179-2012
Morin, D., Planells, M., Baghdadi, N., Bouvet, A., Fayad, I., Le Toan, T., et al. (2022). Improving heterogeneous forest height maps by integrating GEDI-based forest height information in a multi-sensor mapping process. Remote Sens. 14, 2079. doi:10.3390/rs14092079
Mostefaoui, M., Ciais, P., McGrath, M. J., Peylin, P., Patra, P. K., and Ernst, Y. (2024). Greenhouse gas emissions and their trends over the last 3 decades across Africa. Earth Syst. Sci. Data 16, 245–275. doi:10.5194/essd-16-245-2024
Mugabowindekwe, M., Brandt, M., Chave, J., Reiner, F., Skole, D. L., Kariryaa, A., et al. (2023). Nation-wide mapping of tree-level aboveground carbon stocks in Rwanda. Nat. Clim. Change 13, 91–97. doi:10.1038/s41558-022-01544-w
Normandin, C., Frappart, F., Baghdadi, N., Bourrel, L., Peña Luque, S., Ygorra, B., et al. (2024). First results of the surface water ocean topography (SWOT) observations to rivers elevation profiles in the Cuvette Centrale of the Congo Basin. Front. Remote Sens. 5, 1466695. doi:10.3389/frsen.2024.1466695
Nunes, L. J. R., Meireles, C. I. R., Pinto Gomes, C. J., and Almeida Ribeiro, N. M. C. (2020). Forest contribution to climate change mitigation: management oriented to carbon capture and storage. Climate 8, 21. doi:10.3390/cli8020021
Oquab, M., Darcet, T., Moutakanni, T., Vo, H., Szafraniec, M., Khalidov, V., et al. (2024). DINOv2: learning robust visual features without supervision.
Pan, Y., Birdsey, R. A., Phillips, O. L., Houghton, R. A., Fang, J., Kauppi, P. E., et al. (2024). The enduring world forest carbon sink. Nature 631, 563–569. doi:10.1038/s41586-024-07602-x
Parmentier, I., Malhi, Y., Senterre, B., Whittaker, R. J., A, T. D. N., Alonso, A., et al. (2007). The odd man out? Might climate explain the lower tree α-diversity of African rain forests relative to Amazonian rain forests? J. Ecol. 95, 1058–1071. doi:10.1111/j.1365-2745.2007.01273.x
Patterson, P. L., Healey, S. P., Ståhl, G., Saarela, S., Holm, S., Andersen, H.-E., et al. (2019). Statistical properties of hybrid estimators proposed for GEDI—NASA’s global ecosystem dynamics investigation. Environ. Res. Lett. 14, 065007. doi:10.1088/1748-9326/ab18df
Pauls, J., Zimmer, M., Kelly, U. M., Schwartz, M., Saatchi, S., Ciais, P., et al. (2024). Estimating canopy height at scale.
Phiri, D., Simwanda, M., Nyirenda, V., Murayama, Y., and Ranagalage, M. (2020). Decision tree algorithms for developing rulesets for object-based land cover classification. ISPRS Int. J. Geo-Inf. 9, 329. doi:10.3390/ijgi9050329
Ploton, P., Mortier, F., Barbier, N., Cornu, G., Réjou-Méchain, M., Rossi, V., et al. (2020). A map of African humid tropical forest above-ground biomass derived from management inventories. Sci. Data 7, 221. doi:10.1038/s41597-020-0561-0
Potapov, P., Li, X., Hernandez-Serna, A., Tyukavina, A., Hansen, M. C., Kommareddy, A., et al. (2021). Mapping global forest canopy height through integration of GEDI and Landsat data. Remote Sens. Environ. 253, 112165. doi:10.1016/j.rse.2020.112165
Qi, W., Lee, S.-K., Hancock, S., Luthcke, S., Tang, H., Armston, J., et al. (2019). Improved forest height estimation by fusion of simulated GEDI Lidar data and TanDEM-X InSAR data. Remote Sens. Environ. 221, 621–634. doi:10.1016/j.rse.2018.11.035
Qie, L., Lewis, S. L., Sullivan, M. J. P., Lopez-Gonzalez, G., Pickavance, G. C., Sunderland, T., et al. (2017). Long-term carbon sink in Borneo’s forests halted by drought and vulnerable to edge effects. Nat. Commun. 8, 1966. doi:10.1038/s41467-017-01997-0
Qin, Y., Xiao, X., Wigneron, J.-P., Ciais, P., Brandt, M., Fan, L., et al. (2021). Carbon loss from forest degradation exceeds that from deforestation in the Brazilian Amazon. Nat. Clim. Change 11, 442–448. doi:10.1038/s41558-021-01026-5
Quegan, S., Le Toan, T., Chave, J., Dall, J., Exbrayat, J.-F., Minh, D. H. T., et al. (2019). The European Space Agency BIOMASS mission: measuring forest above-ground biomass from space. Remote Sens. Environ. 227, 44–60. doi:10.1016/j.rse.2019.03.032
Reiche, J., Mullissa, A., Slagter, B., Gou, Y., Tsendbazar, N.-E., Odongo-Braun, C., et al. (2021). Forest disturbance alerts for the Congo Basin using Sentinel-1. Environ. Res. Lett. 16, 024005. doi:10.1088/1748-9326/abd0a8
Reiche, J., Verhoeven, R., Verbesselt, J., Hamunyela, E., Wielaard, N., and Herold, M. (2018). Characterizing tropical forest cover loss using dense sentinel-1 data and active fire alerts. Remote Sens. 10, 777. doi:10.3390/rs10050777
Reiner, F., Brandt, M., Tong, X., Skole, D., Kariryaa, A., Ciais, P., et al. (2023). More than one quarter of Africa’s tree cover is found outside areas previously classified as forest. Nat. Commun. 14, 2258. doi:10.1038/s41467-023-37880-4
Réjou-Méchain, M., Mortier, F., Bastin, J.-F., Cornu, G., Barbier, N., Bayol, N., et al. (2021). Unveiling African rainforest composition and vulnerability to global change. Nature 593, 90–94. doi:10.1038/s41586-021-03483-6
Rodda, S. R., Fararoda, R., Gopalakrishnan, R., Jha, N., Réjou-Méchain, M., Couteron, P., et al. (2024). LiDAR-based reference above-ground biomass maps for tropical forests of South Asia and Central Africa. Sci. Data 11, 334. doi:10.1038/s41597-024-03162-x
Rodriguez-Veiga, P., and Balzter, H. (2021). Africa above-ground biomass map for 2017. UK: University of Leicester. (Dataset No. 10).
Ronneberger, O., Fischer, P., and Brox, T. (2015). “U-net: convolutional networks for biomedical image segmentation,” in Medical image computing and computer-assisted intervention – MICCAI 2015, lecture notes in computer science. Editors N. Navab, J. Hornegger, W. M. Wells, and A. F. Frangi (Cham: Springer International Publishing), 234–241. doi:10.1007/978-3-319-24574-4_28
Saatchi, S. S., Harris, N. L., Brown, S., Lefsky, M., Mitchard, E. T. A., Salas, W., et al. (2011). Benchmark map of forest carbon stocks in tropical regions across three continents. Proc. Natl. Acad. Sci. 108, 9899–9904. doi:10.1073/pnas.1019576108
Sagang, L. B. T., Ploton, P., Viennois, G., Féret, J.-B., Sonké, B., Couteron, P., et al. (2022). Monitoring vegetation dynamics with open earth observation tools: the case of fire-modulated savanna to forest transitions in Central Africa. ISPRS J. Photogramm. Remote Sens. 188, 142–156. doi:10.1016/j.isprsjprs.2022.04.008
Santoro, M., and Cartus, O. (2023). Global datasets of forest above-ground biomass for the years 2010, 2015, 2016, 2017, 2018, 2019, 2020 and 2021. doi:10.5285/af60720c1e404a9e9d2c145d2b2ead4e
Santoro, M., Cartus, O., Carvalhais, N., Rozendaal, D. M. A., Avitabile, V., Araza, A., et al. (2021). The global forest above-ground biomass pool for 2010 estimated from high-resolution satellite observations. Earth Syst. Sci. Data 13, 3927–3950. doi:10.5194/essd-13-3927-2021
Santoro, M., Cartus, O., Mermoz, S., Bouvet, A., Le Toan, T., and Carvalhais, N. (2018). GlobBiomass global above-ground biomass and growing stock volume datasets (Technical Report).
Schlund, M., and Boehm, H.-D. V. (2021). Assessment of linear relationships between TanDEM-X coherence and canopy height as well as above-ground biomass in tropical forests. Int. J. Remote Sens. 42, 3405–3425. doi:10.1080/01431161.2020.1871101
Schneider, F. D., Ferraz, A., Hancock, S., Duncanson, L. I., Dubayah, R. O., Pavlick, R. P., et al. (2020). Towards mapping the diversity of canopy structure from space with GEDI. Environ. Res. Lett. 15, 115006. doi:10.1088/1748-9326/ab9e99
Schwartz, M., Ciais, P., De Truchis, A., Chave, J., Ottlé, C., Vega, C., et al. (2023). FORMS: forest Multiple Source height, wood volume, and biomass maps in France at 10 to 30 m resolution based on Sentinel-1, Sentinel-2, and Global Ecosystem Dynamics Investigation (GEDI) data with a deep learning approach. Earth Syst. Sci. Data 15, 4927–4945. doi:10.5194/essd-15-4927-2023
Schwartz, M., Ciais, P., Ottlé, C., De Truchis, A., Vega, C., Fayad, I., et al. (2024). High-resolution canopy height map in the Landes forest (France) based on GEDI, Sentinel-1, and Sentinel-2 data with a deep learning approach. Int. J. Appl. Earth Obs. Geoinformation 128, 103711. doi:10.1016/j.jag.2024.103711
Shapiro, A., d’Annunzio, R., Desclée, B., Jungers, Q., Kondjo, H. K., Iyanga, J. M., et al. (2023). Small scale agriculture continues to drive deforestation and degradation in fragmented forests in the Congo Basin (2015–2020). Land Use Policy 134, 106922. doi:10.1016/j.landusepol.2023.106922
Shendryk, Y. (2022). Fusing GEDI with earth observation data for large area above-ground biomass mapping. Int. J. Appl. Earth Obs. Geoinformation 115, 103108. doi:10.1016/j.jag.2022.103108
Shwartz Ziv, R., and LeCun, Y. (2024). To compress or not to compress—self-supervised learning and information theory: a review. Entropy 26, 252. doi:10.3390/e26030252
Silva, C. A., Duncanson, L., Hancock, S., Neuenschwander, A., Thomas, N., Hofton, M., et al. (2021). Fusing simulated GEDI, ICESat-2 and NISAR data for regional above-ground biomass mapping. Remote Sens. Environ. 253, 112234. doi:10.1016/j.rse.2020.112234
Silva Junior, C. H. L., Carvalho, N. S., Pessôa, A. C. M., Reis, J. B. C., Pontes-Lopes, A., Doblas, J., et al. (2021). Amazonian forest degradation must be incorporated into the COP26 agenda. Nat. Geosci. 14, 634–635. doi:10.1038/s41561-021-00823-z
Simard, M., Pinto, N., Fisher, J. B., and Baccini, A. (2011). Mapping forest canopy height globally with spaceborne lidar. J. Geophys. Res. 116, G04021. doi:10.1029/2011JG001708
Slik, J. W. F., Arroyo-Rodríguez, V., Aiba, S.-I., Alvarez-Loayza, P., Alves, L. F., Ashton, P., et al. (2015). An estimate of the number of tropical tree species. Proc. Natl. Acad. Sci. 112, 7472–7477. doi:10.1073/pnas.1423147112
Slik, J. W. F., Paoli, G., McGuire, K., Amaral, I., Barroso, J., Bastian, M., et al. (2013). Large trees drive forest above-ground biomass variation in moist lowland forests across the tropics. Glob. Ecol. Biogeogr. 22, 1261–1271. doi:10.1111/geb.12092
Solberg, S., Gizachew, B., Næsset, E., Gobakken, T., Bollandsås, O. M., Mauya, E. W., et al. (2015). Monitoring forest carbon in a Tanzanian woodland using interferometric SAR: a novel methodology for REDD+. Carbon Balance Manag. 10, 14. doi:10.1186/s13021-015-0023-8
Solberg, S., Hansen, E. H., Gobakken, T., Næssset, E., and Zahabu, E. (2017). Biomass and InSAR height relationship in a dense tropical forest. Remote Sens. Environ. 192, 166–175. doi:10.1016/j.rse.2017.02.010
Sothe, C., Gonsamo, A., Lourenço, R. B., Kurz, W. A., and Snider, J. (2022). Spatially continuous mapping of forest canopy height in Canada by combining GEDI and ICESat-2 with PALSAR and Sentinel. Remote Sens. 14, 5158. doi:10.3390/rs14205158
Stereńczak, K., Laurin, G. V., Chirici, G., Coomes, D. A., Dalponte, M., Latifi, H., et al. (2020). Global airborne laser scanning data providers database (GlobALS)—a new tool for monitoring ecosystems and biodiversity. Remote Sens. 12, 1877. doi:10.3390/rs12111877
Sullivan, M. J. P., Talbot, J., Lewis, S. L., Phillips, O. L., Qie, L., Begne, S. K., et al. (2017). Diversity and carbon storage across the tropical forest biome. Sci. Rep. 7, 39102. doi:10.1038/srep39102
Takougoum Sagang, L. B., Favrichon, S., Dalagnol, R., Ordway, E. M., Medjibe, V., Manfoumbi, F., et al. (2024). Unveiling spatial variations of high forest live biomass carbon stocks of Gabon using advanced remote sensing techniques. Environ. Res. Lett. 19, 074038. doi:10.1088/1748-9326/ad5572
Terryn, L., Calders, K., Meunier, F., Bauters, M., Boeckx, P., Brede, B., et al. (2024). New tree height allometries derived from terrestrial laser scanning reveal substantial discrepancies with forest inventory methods in tropical rainforests. Glob. Change Biol. 30, e17473. doi:10.1111/gcb.17473
The State of the World’s Forests (2020). The state of the world’s forests. FAO and UNEP. doi:10.4060/ca8642en
Tian, L., Wu, X., Tao, Y., Li, M., Qian, C., Liao, L., et al. (2023). Review of remote sensing-based methods for forest above-ground biomass estimation: progress, challenges, and prospects. Forests 14, 1086. doi:10.3390/f14061086
Tolan, J., Yang, H.-I., Nosarzewski, B., Couairon, G., Vo, H. V., Brandt, J., et al. (2024). Very high resolution canopy height maps from RGB imagery using self-supervised vision transformer and convolutional decoder trained on aerial lidar. Remote Sens. Environ. 300, 113888. doi:10.1016/j.rse.2023.113888
Tubiello, F. N., Conchedda, G., Wanner, N., Federici, S., Rossi, S., and Grassi, G. (2021). Carbon emissions and removals from forests: new estimates, 1990–2020. Earth Syst. Sci. Data 13, 1681–1691. doi:10.5194/essd-13-1681-2021
Tucker, C., Brandt, M., Hiernaux, P., Kariryaa, A., Rasmussen, K., Small, J., et al. (2023). Sub-continental-scale carbon stocks of individual trees in African drylands. Nature 615, 80–86. doi:10.1038/s41586-022-05653-6
Tyukavina, A., Hansen, M. C., Potapov, P., Parker, D., Okpa, C., Stehman, S. V., et al. (2018). Congo Basin forest loss dominated by increasing smallholder clearing. Sci. Adv. 4, eaat2993. doi:10.1126/sciadv.aat2993
Vancutsem, C., Achard, F., Pekel, J.-F., Vieilledent, G., Carboni, S., Simonetti, D., et al. (2021). Long-term (1990–2019) monitoring of forest cover changes in the humid tropics. Sci. Adv. 7, eabe1603. doi:10.1126/sciadv.abe1603
Vaswani, A., Shazeer, N., Parmar, N., Uszkoreit, J., Jones, L., Gomez, A. N., et al. (2017). Attention is all you need. Adv. Neural Inf. Process. Syst.
Viennois, G., Barbier, N., Fabre, I., and Couteron, P. (2013). Multiresolution quantification of deciduousness in West-Central African forests. Biogeosciences 10, 6957–6967. doi:10.5194/bg-10-6957-2013
Vo Quang, A., Delbart, N., Jaffrain, G., Pinet, C., and Moiret, A. (2022). Detection of degraded forests in Guinea, West Africa, based on Sentinel-2 time series by inclusion of moisture-related spectral indices and neighbourhood effect. Remote Sens. Environ. 281, 113230. doi:10.1016/j.rse.2022.113230
Wagner, F. H., Dalagnol, R., Silva-Junior, C. H. L., Carter, G., Ritz, A. L., Hirye, M. C. M., et al. (2023). Mapping tropical forest cover and deforestation with Planet NICFI satellite images and deep learning in Mato Grosso state (Brazil) from 2015 to 2021. Remote Sens. 15, 521. doi:10.3390/rs15020521
Waldeland, A. U., Trier, Ø. D., and Salberg, A.-B. (2022). Forest mapping and monitoring in Africa using Sentinel-2 data and deep learning. Int. J. Appl. Earth Obs. Geoinformation 111, 102840. doi:10.1016/j.jag.2022.102840
Wang, C., Elmore, A. J., Numata, I., Cochrane, M. A., Lei, S., Hakkenberg, C. R., et al. (2022). A framework for improving wall-to-wall canopy height mapping by integrating GEDI LiDAR. Remote Sens. 14, 3618. doi:10.3390/rs14153618
Wang, M., Ciais, P., Fensholt, R., Brandt, M., Tao, S., Li, W., et al. (2024). Satellite observed aboveground carbon dynamics in Africa during 2003–2021. Remote Sens. Environ. 301, 113927. doi:10.1016/j.rse.2023.113927
Wang, M., Sun, R., and Xiao, Z. (2018). Estimation of forest canopy height and above-ground biomass from spaceborne LiDAR and Landsat imageries in Maryland. Remote Sens. 10, 344. doi:10.3390/rs10020344
White, L. J. T., Masudi, E. B., Ndongo, J. D., Matondo, R., Soudan-Nonault, A., Ngomanda, A., et al. (2021). Congo Basin rainforest — invest US$150 million in science. Nature 598, 411–414. doi:10.1038/d41586-021-02818-7
Wigneron, J.-P., Ciais, P., Li, X., Brandt, M., Canadell, J. G., Wang, H., et al. (2024). Carbon balance of global vegetation: satellite-based L-VOD results over the last decade and perspectives.
Williams, C. A., Hanan, N. P., Neff, J. C., Scholes, R. J., Berry, J. A., Denning, A. S., et al. (2007). Africa and the global carbon cycle. Carbon Balance Manag. 2, 3. doi:10.1186/1750-0680-2-3
Xu, L., Saatchi, S. S., Shapiro, A., Meyer, V., Ferraz, A., Yang, Y., et al. (2017). Spatial distribution of carbon stored in forests of the democratic republic of Congo. Sci. Rep. 7, 15030. doi:10.1038/s41598-017-15050-z
Xu, L., Saatchi, S. S., Yang, Y., Yu, Y., Pongratz, J., Bloom, A. A., et al. (2021). Changes in global terrestrial live biomass over the 21st century. Sci. Adv. 7, eabe9829. doi:10.1126/sciadv.abe9829
Yang, H., Ciais, P., Frappart, F., Li, X., Brandt, M., Fensholt, R., et al. (2023). Global increase in biomass carbon stock dominated by growth of northern young forests over past decade. Nat. Geosci. 16, 886–892. doi:10.1038/s41561-023-01274-4
Ygorra, B., Frappart, F., Wigneron, J. P., Moisy, C., Catry, T., Baup, F., et al. (2021). Monitoring loss of tropical forest cover from Sentinel-1 time-series: a CuSum-based approach. Int. J. Appl. Earth Obs. Geoinformation 103, 102532. doi:10.1016/j.jag.2021.102532
Ygorra, B., Frederic, F., Jean-Pierre, W., Christophe, M., Thibault, C., Benjamin, P., et al. (2023). ReCuSum: a polyvalent method to monitor tropical forest disturbances. ISPRS J. Photogramm. Remote Sens. 203, 358–372. doi:10.1016/j.isprsjprs.2023.08.006
Yu, Y., and Saatchi, S. (2016). Sensitivity of L-band SAR backscatter to above-ground biomass of global forests. Remote Sens. 8, 522. doi:10.3390/rs8060522
Zhang, Y., Liang, S., and Sun, G. (2014). Forest biomass mapping of northeastern China using GLAS and MODIS data. IEEE J. Sel. Top. Appl. Earth Obs. Remote Sens. 7, 140–152. doi:10.1109/JSTARS.2013.2256883
Zhang-Zheng, H., Adu-Bredu, S., Duah-Gyamfi, A., Moore, S., Addo-Danso, S. D., Amissah, L., et al. (2024). Contrasting carbon cycle along tropical forest aridity gradients in West Africa and Amazonia. Nat. Commun. 15, 3158. doi:10.1038/s41467-024-47202-x
Zhao, Z., Ciais, P., Wigneron, J.-P., Santoro, M., Brandt, M., Kleinschroth, F., et al. (2024). Central African biomass carbon losses and gains during 2010–2019. One Earth 7, 506–519. doi:10.1016/j.oneear.2024.01.021
Zhu, X., Nie, S., Wang, C., Xi, X., Lao, J., and Li, D. (2022). Consistency analysis of forest height retrievals between GEDI and ICESat-2. Remote Sens. Environ. 281, 113244. doi:10.1016/j.rse.2022.113244
Zhuravleva, I., Turubanova, S., Potapov, P., Hansen, M., Tyukavina, A., Minnemeyer, S., et al. (2013). Satellite-based primary forest degradation assessment in the Democratic Republic of the Congo, 2000–2010. Environ. Res. Lett. 8, 024034. doi:10.1088/1748-9326/8/2/024034
Appendix: FORMS OFVI V1 AGB Maps derived from GEDI, Sentinel-1 and Sentinel-2 satellite observations over the period 2021-2022 over the Congo basin
FORMS OFVI V1 mapping of above-ground biomass (AGB) is based on the use of canopy height (CH) as a proxy of AGB and which can be estimated on a large-scale using satellite imagery. Then AGB is estimated from CH using height-to-AGB relationships (Wan et al., in prep).
The Kayrros CHM maps (i.e maximum height of the canopy) and cover (percentage of soil covered by the forest in each pixel) are provided at 10 m resolution and are updated annually from 2019 onward. The methodology to produce regional canopy height maps at high resolution has been developed in collaboration with the LSCE and has been described in several studies (Fayad et al., 2024; Schwartz et al., 2024; Schwartz et al., 2023). The main technical choices can be summarized as follows:
1) Data sources: most layers are produced based on data from ESA’s Sentinel-1 SAR and Sentinel-2 multispectral missions, which offer a good tradeoff between costs on one side (as the images are publicly available) and accuracy (10 m resolution) and scalability (global coverage with high revisit capacity) on the other side.
2) Training dataset: The canopy height used to train the Machine learning model are based on GEDI data (Dubayah et al., 2021) over 600 tiles of 20 x 20 km in tropical and subtropical Africa. The tiles are evenly spread over the study zone and selected to maximize the number of GEDI orbits crossing the tile. We randomly selected 480 tiles (80%) to train the model, 60 tiles (10%) for validation during the training process, and 60 tiles (10%) to test the model. The total number of GEDI footprints after filtering available for the training dataset is 8,5 million. Due to the high cloud cover and the density of tropical African forests, more than 80% of the total available GEDI footprints were filtered.
3) The canopy height estimates are generated using a supervised deep learning model, which is trained with a set of input data and corresponding output data. For this project, the input data consists of mid-resolution multi-spectral (Sentinel 2) and radar (Sentinel 1) images, while the output data consists of GEDI measurements of canopy height, which are available only for certain points and dates. As done by (Schwartz et al., 2024), a U-net model, which is a Fully Convolutional Neural Network adapted from (Ronneberger et al., 2015), is used to perform a pixel-wise regression to predict canopy height. It is implemented using Python’s PyTorch library.
4) The model training process consists of iteratively modifying the weights of the U-NET model in order to minimize a target function, called the loss function defined as the difference between the estimated canopy height and the “ground truth” height (GEDI RH100 measurement). Here, we chose to use a weighted version of the MAE (Mean Absolute Error), inspired by (Lang et al., 2023), in order to balance the weight of each height class and more properly handle the tails of the height distributions (low and high trees).
In a last step, the height-to-AGB relationships are used to transform canopy height to above-ground biomass. These relationships require careful model calibration using an extensive set of field measurements that are geographically representative and span a wide range of AGB values. Note that, however, such comprehensive datasets remain scarce, particularly in remote regions such as the Congo Basin. In addition, most existing forest inventories are conducted at the individual tree scale, rather than over continuous land areas, which limits their applicability in linking height to AGB for satellite-derived biomass maps. In a first step (Version 1) these relationships were calibrated using footprint-level AGB estimates (GEDI Level 4) and relative height metrics (GEDI Level 2) for the ecoregions EBT Af (Evergreen Broadleaf Trees of Africa) and DBT Af (Deciduous Broadleaf Trees of Africa).
Keywords: remote sensing-, deep learning, Congo basin, carbon, biomass, canopy height, forest typology, forest degradation
Citation: Bossy T, Ciais P, Renaudineau S, Wan L, Ygorra B, Adam E, Barbier N, Bauters M, Delbart N, Frappart F, Gara TW, Hamunyela E, Ifo SA, Jaffrain G, Maisongrande P, Mugabowindekwe M, Mugiraneza T, Normandin C, Obame CV, Peaucelle M, Pinet C, Ploton P, Sagang LB, Schwartz M, Sollier V, Sonké B, Tresson P, De Truchis A, Vo Quang A and Wigneron J-P (2025) State of the art in remote sensing monitoring of carbon dynamics in African tropical forests. Front. Remote Sens. 6:1532280. doi: 10.3389/frsen.2025.1532280
Received: 21 November 2024; Accepted: 24 February 2025;
Published: 17 March 2025.
Edited by:
Celso H. L. Silva-Junior, Instituto de Pesquisa Ambiental da Amazonia (IPAM), BrazilReviewed by:
Aurélie C. Shapiro, Food and Agriculture Organization of the United Nations, ItalyBishal Roy, Saint Louis University, United States
Copyright © 2025 Bossy, Ciais, Renaudineau, Wan, Ygorra, Adam, Barbier, Bauters, Delbart, Frappart, Gara, Hamunyela, Ifo, Jaffrain, Maisongrande, Mugabowindekwe, Mugiraneza, Normandin, Obame, Peaucelle, Pinet, Ploton, Sagang, Schwartz, Sollier, Sonké, Tresson, De Truchis, Vo Quang and Wigneron. This is an open-access article distributed under the terms of the Creative Commons Attribution License (CC BY). The use, distribution or reproduction in other forums is permitted, provided the original author(s) and the copyright owner(s) are credited and that the original publication in this journal is cited, in accordance with accepted academic practice. No use, distribution or reproduction is permitted which does not comply with these terms.
*Correspondence: Thomas Bossy, dGhvbWFzLmJvc3N5QGxzY2UuaXBzbC5mcg==