 Isabella Peters
 Peter Kraker
 Elisabeth Lex
 Christian Gumpenberger
 Juan Ignacio Gorraiz
- 1Web Science, ZBW Leibniz Information Centre for Economics, Kiel University, Kiel, Germany
- 2Social Computing Area, Know-Center, Graz, Austria
- 3Open Knowledge Maps, Vienna, Austria
- 4Graz University of Technology, Institute of Interactive Systems and Data Science, Graz, Austria
- 5Bibliometrics and Publication Strategies Department, University of Vienna, Library and Archive Services, Vienna, Austria
In this case study, we aim to explore the characteristics and the reception of files uploaded to Zenodo, and the role the repository plays itself in generating usage. To this end, we first apply descriptive statistics on Zenodo’s full set of data record metadata with digital object identifiers (DOIs) until and including January 2017 (n = 141,777 records). Second, we estimate the coverage of Zenodo datasets in the Data Citation Index as well as of Zenodo journal articles in the Science Citation Index, Social Science Citation Index, and Arts and Humanities Citation Index, Zenodo books and book chapters in the Book Citation Index, and Zenodo conference papers in the Proceedings Citation Index, and analyze their citedness according to the different data record types in Zenodo (e.g., journal article, dataset, book, or conference paper). Third, we provide a bibliometric analysis of Zenodo records by using different metrics for citedness, including citation, usage, and altmetrics. Altmetrics data are gathered from two of the most popular tools for altmetric analyses, PlumX and Altmetric.com, and we compare the results. Moreover, we study how open access and DOIs provided by Zenodo influence the impact of Zenodo data records and we find a tendency toward a positive relationship between permissive access rights and altmetrics in certain data records.
Introduction
Driven by the urgent calls for science being more open, for example, from the European Commission’s Directorate-General for Research & Innovation and Commissioner Carlos Moedas,1 several platforms have been developed that facilitate storing, publication, and sharing of diverse types of research products, e.g., articles, softwares, and data. Sharing facilities for research data are of special importance to many since research data are believed to be the major resource that enables innovation in various areas. Due to the different kinds of research data spanning from interview data to videos and the different stakeholders interested in different data, to date, several types of data repositories are available (Pampel et al., 2013; He and Nahar, 2016): from institutions (e.g., Harvard Dataverse), for disciplinary (e.g., Pangea) or multidisciplinary purposes (e.g., Dryad, Figshare, Mendeley data, and Zenodo), or only project-specific repositories (e.g., CERN Open Data Portal). Over the last years, all research data repositories have witnessed an exponential growth of data deposits. For example, He and Nahar (2016) report that by the end of 2014, Dryad stored almost 40 times as many datasets as by the end of 2010; Robinson-García et al. (2017) identified a sudden increase of data publications in 2016 probably due to the embargo they are restricted by. Among others, this can be attributed to an increased demand by publishers and funders to make scientific data available (e.g., PlosOne,2 Nature,3 or Bill & Melinda Gates Foundation4).
The rise in publication outlets for research data has been accompanied by an increasing number of services that make research data searchable, such as Elsevier’s DataSearch. Other services, e.g., Clarivate’s Data Citation Index (DCI; Robinson-García et al., 2016) collect whether and to what extent that data are reused by others. Also, social media engagement with research data has become visible now because data records are usually equipped with a digital object identifier (DOI) or another persistent identifier (Mayernik and Maull, 2017), which are tracked by altmetrics aggregators such as Altmetric.com or PlumX. Given that an increase in reputation—reflected by metrics, e.g., citations—is one of the most significant drivers of data sharing (Bruno et al., 2015; Kratz and Strasser, 2015), there is a growing interest in the impact of research data. Several studies have confirmed that articles that share code (Vandewalle, 2012) or data (Piwowar et al., 2007; Piwowar and Vision, 2013; Drachen et al., 2016) are more often cited and gain higher altmetrics scores.
Literature Review
Robinson-García et al. (2016) provide an extensive study of Clarivate’s DCI and found that 88.1% of data have not been cited at all. From the data records cited, data sets received most citations (73%), but data studies are cited more often on average. All repositories included in the DCI are cited at least once. In terms of disciplinary coverage, the DCI is biased toward the hard sciences. The majority of data records are described as “data set,” and four repositories account for 75% of DCI’s records (Torres-Salinas et al., 2014).
Dryad was subject to several analyses. He and Nahar (2016) studied 550 URL citations to Dryad from scholarly publications indexed by Scopus. They found that 95% of publications that cite data from Dryad are research articles and that there is an increase in the data citations of 3% every year. Almost 50% of Dryad data were cited in the same year, and 70% were cited within 2 years. Interestingly, 84% of articles that cite Dryad data are self-citations, meaning that the title of the cited data matches the title of the citing publication. Thus, the authors conclude that only “16% of the total data cited in the references of publications are ‘real data reuse,’ which means that the shared scientific data are reused by others.” Raw data, e.g., experimental data, received significantly more non-self-citations than other forms of data.
In a follow-up study, He and Han (2017) analyzed the citedness of data records from the Dryad repository and the relation between their usage counts (i.e., number of downloads) and their citations. Citation counts from the Web of Science (WoS) were obtained for those 9,333 articles from Dryad whose DOIs were found in the WoS. All Dryad records have been downloaded at least once but the percentage of 0 citations varies between 7% for 42 articles from “Cell biology” and 57% for 23 articles from “Biochemical research methods.” The subject with the most Dryad records, “Ecology” (3,686 articles), revealed 25% of uncited articles. The authors could show that there are positive, but discipline-specific correlations between download numbers and citation counts (maximum Pearson coefficient of 0.593 for “behavioral science”).
Robinson-García et al. (2017) provide an extensive description of DataCite,5 how to access the more than seven million data records, what kinds of data are included, where stored data stems from, and when data were published. They found that 12% of valid records are text or articles and that 23% of all DataCite records include DOIs although this number is highly dependent on the data record type (i.e., 90% of DOIs belong to datasets). However, more than one million records (14.7% of all records) were empty due to some data structure modifications carried out by DataCite and should be removed when using DataCite for bibliometric or other analyses. The authors revealed some more conceptual issues with DataCite (e.g., what constitutes data records, how they should be described, or what is the correct publication year) that impact the description of data and which also should be taken into account when working with DataCite information.
Thelwall and Kousha (2016) explored the Figshare repository via profiles of 2,675 Figshare members and showed that data labeled as “media” are more often viewed than other data types. Plus, while “datasets” are the most common data record they are least viewed and second least shared. However, “the results give no suggestion that any particular resource type is ignored in Figshare” (Thelwall and Kousha, 2016). The engagement with data on Figshare is yet influenced by the subject category and the resource type. Later, Park and Wolfram (2017) performed a citer-based analysis on the basis of two million data publications from the WoS subject area with the most data citations, i.e., “Genetics and Heredity.”
While efforts are in place that foster data citation standards (e.g., Data Cite or Martone, 2014), it has been pointed out (He and Nahar, 2016) that signals of research data reuse still most often appear in two different forms: first, as data citations that formally cite data in the reference section of the article and which point to the data set themselves (so-called “reuse citations”; Mayo et al., 2016; see also Robinson-García et al., 2016), and second, as mentions or footnotes (so-called “intratextual citations”; Mayo et al., 2016) in the body of the article. Mayo et al. (2016) found that intratextual citations are most common in articles and that formal reuse citations only appear in 8% of articles. Those varying citation practices have severe implications for bibliometric studies, which typically rely on citation data that are most often extracted from the reference sections of articles (Konkiel, 2013).
There has been a call for alternative metrics for data reuse, which goes beyond traditional forms of citing (Dorch, 2013). Ingwersen (2014) argues that a Data Usage Index (DUI) is needed, that includes, among others, number of searched records, download frequencies, and number for searches. By using such metrics, he could show that “a Bradford distribution can be observed for searched biodiversity dataset records dispersed over datasets” (p. 111) which let him conclude “that the DUI is appropriate” (p. 116).
In addition to citing research data in the articles, there is a growing number of data journals available that publish descriptions of and links to research data. A study conducted by the CWTS for Elsevier6 revealed that one-third of researchers do not publish data at all. If they share data, 33% of asked researchers publish data as an appendix to the publication, 28% as stand alone data publication, and 13% in a data repository. Thus, the authors conclude that “data journals are still a relatively small-scale phenomenon […] [but] the popularity of data journals is growing quite rapidly” (p. 18).
Aims of the Study
Our case study follows the vein of works that describe novel platforms and their potential for bibliometric studies, for example, Kraker et al. (2015), Peters et al. (2015, 2016), and Thelwall and Kousha (2016), who studied Figshare, or Robinson-García et al. (2017) who investigated DataCite, or He and Han (2017) and He and Nahar (2016) who studied Dryad.
In our work, we focus on the multidisciplinary open access (OA) research data repository Zenodo. Zenodo was created by OpenAIRE and CERN in 2013, and by now, it has been integrated into reporting lines for research funded by the European Commission. Zenodo accepts any file format as well as both positive and negative results, and it assigns all publicly available uploads a DOI to make the upload easily and uniquely citable. As one research data outlet among many, to date, Zenodo has not been extensively studied—hence, its characteristics and the reuse and reception of its data records are yet to be explored. Therefore, in this case study, we investigate Zenodo’s data records, their temporal distribution as well as the relation between data records and their licenses [e.g., closed access (CA), embargoed access, or OA]. In addition, we are interested in to what extent Zenodo records are reused or engaged with.
To understand the broader impact of the different kind of data records uploaded in Zenodo, we conduct a bibliometric analysis by using different metrics, including citations, usage, and altmetrics. Metrics data are gathered in Clarivate’s Web of Science Core Collection (including Proceedings and Book Citation Indices; WoS CC) and DCI as well as in one of the currently most popular tool for altmetrics studies, PlumX. The results of the bibliometric analysis are compared, especially with respect to the citedness of data records, the relationship between citations/altmetrics and data record types, and the data availability and intensity of altmetrics that are provided by PlumX and Altmetric.com. Also, we assess the role of the access rights of data records and how they affect altmetrics.
As such, with our case study, we aim to shed light on the characteristics of Zenodo and the broader impact of the different kinds of data records uploaded to the repository. Furthermore, we give insight into the reception of research data in Zenodo in comparison to research data from our previous analyses of Figshare and the DCI (Kraker et al., 2015; Peters et al., 2015, 2016). Thus, we will be able to show whether the repository itself (and its popularity as, for example, induced by mandates from the European Commission) affects usage and reception of data records. Such information can guide authors’ strategic publishing behavior.
Data and Methods
The next section will give an overview on the data and methods used in this study.
Descriptive Statistics of Zenodo Data Records
The basis for our analyses is Zenodo from which we downloaded all metadata records via the OAI–PMH interface using the R package oai (Chamberlain and Bojanowski, 2016) on 17 January 2017, resulting in 142,131 data records. This dataset has been uploaded to Zenodo (see Peters et al., 2017). Thereof 141,777 data records (99.8%) were assigned a DOI and could be used for our further analyses. Table 1 provides an overview on the types of data records contained in Zenodo and their quantities. In addition, the access rights the authors have assigned to the data records are given. Please note that most of the data stored in Zenodo are OA.
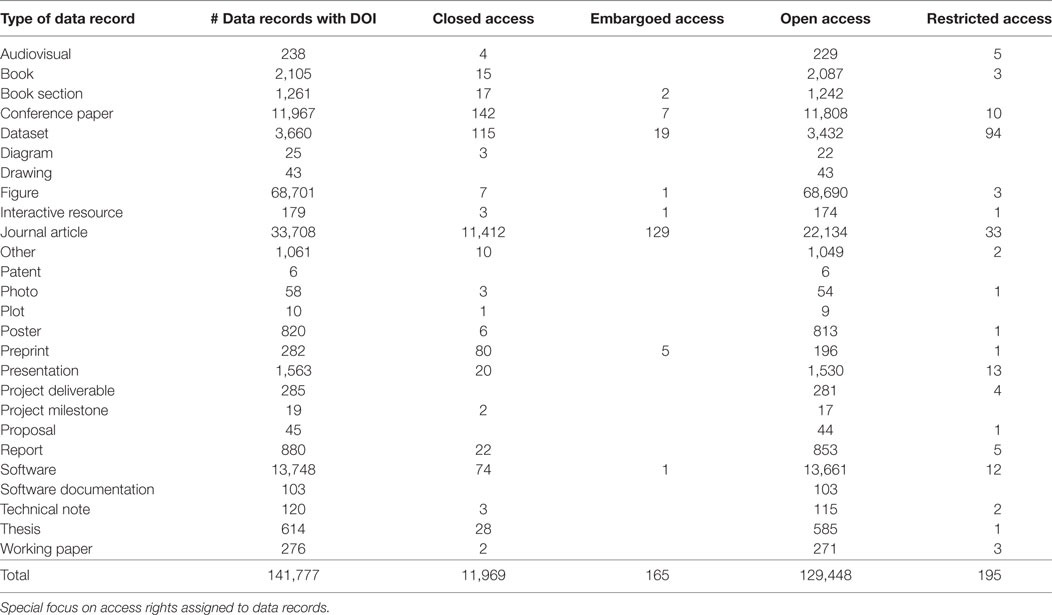
Table 1. Description of Zenodo data records with digital object identifier (DOI) and all publication years.
Zenodo’s records date back until 1762 (year of first publication, not publication at Zenodo), but the majority of records (133,917 or 94.5%) have been published between 2002 and 2016 (1,123 records were published in 2017; six records have publication dates in the future). Figure 1 shows the temporal trend of data record types per publication year. It reveals that journal articles and software have seen strong growth over the last 3–4 years, whereas the number of figures has seen sharp drops in 2014 and 2016. The numbers of datasets and presentations have been steadily growing, but conference papers and books have seen a drop in 2016. Note that these numbers may be influenced by the data collection taking place in January 2017, where not all items published in 2016 may have yet been entered into Zenodo. This may explain the sharp drop of figures in 2016 but would need to be confirmed by further data collection.
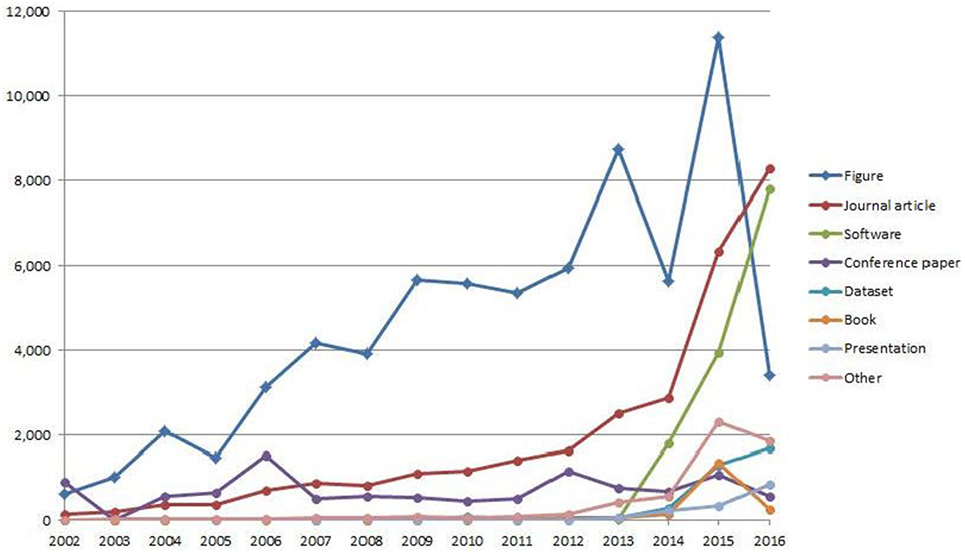
Figure 1. All data record types per publication year in Zenodo with digital object identifier and publication years 2002–2016 (n = 133,917 records).
For the further bibliometric and altmetric analyses, we took into consideration 68,339 journal articles, books and book sections, conference papers, datasets, software, reports, technical notes and working papers, theses, and other non-figures (e.g., diagrams, audiovisuals) with all publication years. To facilitate a more comprehensive description of the results and to condense the large variety of data record types available in Zenodo, the data records were summarized into following seven groups:
(1) journal articles including all journal articles (n = 33,708),
(2) books including Zenodo’s data records “book and book section” (n = 3,366),
(3) conference papers including “conference papers” (n = 11,967),
(4) datasets including “data sets” (n = 3,660) and “software” (n = 13,747),
(5) reports including “working papers” and “technical notes” (n = 1,276),
(6) theses (n = 614), and
(7) other non-figures (n = 4,737) including “audiovisual,” “diagram,” “drawing,” “interactive resource,” “other,” “patent,” “photo,” “plot,” “poster,” “preprint,” “presentation,” “project deliverable,” “project milestone,” “proposal,” and “software documentation.”
The data record type “figure” was excluded from the bibliometric analyses because it is not indexed by the used databases (i.e., Web of Science) and because of its overrepresentation in Zenodo (n = 68,701) that would distort the results.
In this article, we only report findings for the data record types “book,” “conference paper,” “journal article,” and “dataset.” The complete results for data availability as well as for bibliometric and altmetric analyses for each Zenodo data record type (i.e., “journal articles,” “conference papers,” “books,” “datasets,” “software,” “reports,” “theses,” and “other”) including a short statistical analysis [i.e., items with data available, % of items with data available, sum (intensity), mean, mean available (density), maximum, SD, and T confidence interval (α = 0.05)] are included in the Tables A1–A14 in Supplementary Material.
Data and Methods for Bibliometric Analyses of Zenodo Data Records in WoS CC and DCI
A coverage analysis of all data records uploaded to Zenodo corresponding to the categories “book,” “conference paper,” and “journal article” was performed in the Web of Science Core Collection (i.e., Science Citation Index, Social Science Citation Index, and Arts and Humanities Citation Index, but not Emerging Sources Citation Index because it has not been available until 2015), Zenodo books and book chapters in the Book Citation Index, and Zenodo conference papers in the Proceedings Citation Index including the Proceedings and Book Citation Indices (WoS CC). To this purpose, Zenodo DOI’s from all publication years were retrieved from the complete WoS CC using the advanced search and the field DOI. All the retrieved records (n = 3,332 books, n = 11,942 conference papers, and n = 27,252 journal articles) were then downloaded to enable further citation analyses according to the number of citations attracted in WoS CC (Download Field = TC) and in the complete WoS Platform (WoS; Download Field = ZA). Data collection on WoS CC and WoS took place in July 2017.
Likewise, the coverage of the category “datasets” (including the data record type “datasets” as well as “software”) was analyzed in the corresponding tool hosted by Clarivate Analytics, DCI. A citation analysis was also performed for these data record types (n = 17,408) in DCI. Data were collected from the DCI on January 2017.
The coverage of Zenodo records in the WoS CC (see “Zenodo items in WoS CC” in Table 2) and DCI is reflected by the ratio of data records found in the databases, and the amount of records that have been searched for. The citedness (i.e., citation rate) of Zenodo records is the ratio of all citations and all records searched in WoS CC (see “Zenodo items cited in WoS CC” in Table 2) and DCI.
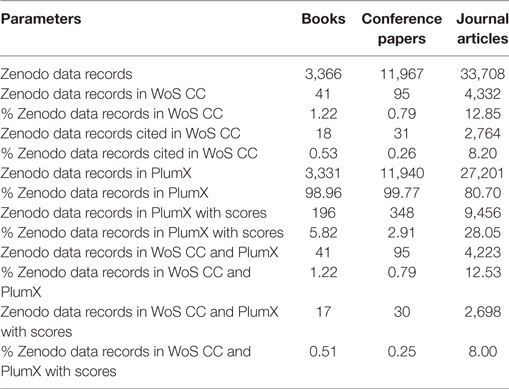
Table 2. Coverage of Zenodo data records in WoS CC and PlumX (Zenodo data record types: books, conference papers, and journal articles—all publication years).
Data and Methods for Altmetric Analyses of Zenodo Data Records in PlumX and Altmetric.com
For the altmetrics data collection and aggregation, currently, three major tools are available: ImpactStory, Altmetric.com, and PlumX. Whereas Altmetric.com and PlumX focus on institutional customers (e.g., publishers, libraries, or universities) by gathering and providing data on a large scale, ImpactStory rather targets individual researchers who wish to include altmetrics information in their CV (Jobmann et al., 2014; Peters et al., 2016; Torres-Salinas et al., 2017). The provider of PlumX is Plum Analytics, a 100% subsidiary of EBSCO Information Services since 2014. However, during the course of writing this article, Elsevier took over PlumX from EBSCO. Altmetric.com is a subsidiary from Digital Publishing launched in 2011. By using different identifiers for scholarly products (e.g., DOI, PubMed-ID, and URN), it tracks altmetrics signals in platforms such as Facebook, Twitter, and Mendeley, but also in news outlets, policy documents, and Wikipedia.
For this study, we have used the fee-based PlumX altmetrics dashboard because it gathers and offers publication-level metrics for so-called artifacts, which also include monographs or books, articles, audios, videos, book chapters, patents, or clinical trials, and it allows DOIs to be directly entered as well as many other identifiers.
To gather the data in PlumX, a plain text file containing all the DOIs for all publication years of the Zenodo sample for each data record type (see Table 1 and data record type categorization) has been introduced in PlumX and processed by the tool, providing a new dataset including all the resulting “artifacts”—as data records are named in PlumX—and the corresponding altmetric scores gathered from each tool consulted in. The resulting dataset for each data record type can be exported to Excel in CSV format. The final dataset that we used for the analysis contains, n = 27,252 journal articles, n = 3,332 books, n = 11,942 conference papers, n = 1,178 reports, n = 3,606 datasets, n = 13,309 software, n = 600 theses, and n = 111 other document types. The resulting dataset also includes the scores of all measures according to their origin. The measures are categorized into five separate dimensions: Usage, Captures, Mentions, Social Media, and Citations (Torres-Salinas et al., 2017). This categorization may be subject to criticism, but one big advantage of PlumX is that the results are differentiated in the resulting dataset for each measure and its origin and can be aggregated according to the user criterion.
The comparison of the altmetrics data from PlumX and Altmetric.com is based on an Altmetric.com database dump. It includes altmetric data for publications with assigned and trackable identifiers, e.g., DOI, PubMed-ID, from its launch in 2011 till June 2016. To work with complete yearly data, we only have used altmetrics for Zenodo data records with the publication years from 2011 until 2015 and altmetrics events till June 2016 (time of download from Altmetric.com) and January 2017 (time of download from PlumX). This resulted in a dataset of 51,051 data records, which makes up for 36% of all Zenodo data records with DOI.
PlumX and Altmetric.com apply different data collection procedures that massively affect the amounts of data records and altmetrics signals that can be analyzed. PlumX counts a data record even if no altmetric signal could be found (e.g., if this DOI has not been tweeted). Altmetric.com tracks Mendeley data for scholarly products if they receive at least one other altmetrics event. Hence, Mendeley data should be analyzed carefully (Costas et al., 2014).
To enable the comparison of both altmetrics providers for data availability and altmetric analyses, we report several indicators to accommodate for the data collection differences:
• data availability = number of data records traced in PlumX and Altmetric.com;
• data with scores = number of data records traced in PlumX and Altmetric.com with at least one score (>1)7;
• data with scores (%) = number of data records traced in PlumX and Altmetric.com with at least one score (>1) and in relation to the number of Zenodo records searched;
• intensity = sum of all altmetric signals or scores;
• density (mean available) = sum of all altmetric signals or scores in relation to the number of Zenodo records with at least one score (>1).
Data availability reflects that data records could be found in PlumX and Altmetric.com although they may not have any altmetric signals to analyze (i.e., similar to uncitedness). Data with scores show the number of data records that has been engaged with at least once (e.g., via tweeting a DOI). As explained by Haustein et al. (2015), the intensity describes how often a data record has been referenced on a social media platform. Density resembles the citation rate that is highly affected by the data with scores (e.g., low data with scores lead to poor values for density).
It is noteworthy that the majority of altmetrics tools currently do not rely on a source index as featured in citation databases. Therefore, retrieval is only successful for documents, which have at least been commented, discussed or mentioned once. Consequently a 0 score is neither available nor sustainable. For comparison, citation databases like the Web of Science are always based on a source AND a citation index. A document available in the source index, but having remained uncited in the citation index so far automatically results in a 0 score.
In this respect, PlumX is unique among the current altmetrics tools, since it creates an index of all documents that have so far been searched and processed by this tool at least once. In doing so, bibliographical data are enhanced automatically, e.g., PlumX includes different variations of the ISBN already used for identification purposes in one of the previous searches (see Torres-Salinas et al., 2017).
Data and Methods for the Analysis of the Relationship between Altmetrics Indicators of Zenodo Data Records and Access Rights
For this study, we have exemplarily investigated the relationship between altmetrics indicators and access rights for journal articles in Zenodo. Our final dataset contains of n = 1,422 OA, n = 2,370 CA, n = 23 Embargoed Access (EA), and n = 12 restricted access (RA) journal articles. Due to the low size of EA and RA, we merged them with the CA articles, resulting in a total of 2,405 CA articles. We treated our analysis as a classification problem where the two types of access rights represent the target classes, i.e., OA, and CA. Each journal article is described by a vector, whose dimensions are the journal article’s altmetrics indicators. We specifically took as dimensions the counts of the following eight indicators extracted from Altmetric.com: blogs posts, unique users in Twitter, f1000 posts, news posts, Facebook posts, Wikipedia posts, readers in Mendeley, readers in CiteULike due to the fact that in our dataset, we had the most data for these indicators, while for other indicators such as, e.g., posts in Reddit, mostly no data were available. Our aim was to study the relevance and relationship between these eight altmetrics indicators and the access rights with the hypothesis in mind that, e.g., OA would have a positive impact on the number of Mendeley readers or Wikipedia articles. For the experiments, we utilized a stochastic gradient descent (SGD) (Zhang, 2004) approach since it is an iterative, efficient approach to fit linear models and due to the fact that its model parameters (i.e., its coefficients) let us assess feature relevance. We used the SGD implementation from the python library scikit-learn.8 Due to the fact that SGD is sensitive to feature scaling, we standardized our data using the StandardScaler also from scikit-learn, which scales the data to a mean of 0 and an SD of 1.
Results
We first present results of the coverage of Zenodo records in the WoS CC and DCI as well as data availability in the altmetrics aggregators PlumX and Altmetric.com. After that, we compare the citedness and altmetrics signals of Zenodo records via WoS CC, DCI, PlumX, and Altmetric.com. Then, an analysis of the access rights of Zenodo’s data records is presented.
Coverage and Data Availability of Zenodo Data Records in WoS CC, DCI, PlumX, and Altmetric.com
WoS CC
The results for the data record types “books,” “conference papers,” and “journal articles” are summarized in Table 2. The results show an almost insignificant coverage percentage for “books” and “conference papers” (less than 1%), due also to the low indexing degree of these publication types in WoS CC. On the other side, almost 13% of the “journal articles” uploaded to Zenodo are indexed in WoS CC.
Data Citation Index
In total, DCI indexed 13,788 records with Zenodo as “source” (including the repository itself): Thereof one “repository,” 147 “data studies,” 2,855 “data sets,” and 10,785 “software.” All records, except ten, could be downloaded. The categories “data set” and “data study” from DCI were compared with the data record type “dataset” in Zenodo, as well as the category “software,” which is identical in both data sources. The results are shown in Figure 2. Almost 80% of the data records categorized in Zotero as “datasets” or “software” were also indexed in DCI. And 1.5% of the data records categorized as “data sets,” “data studies,” or “software” and assigned to Zotero in DCI could not be found in Zotero due to different categorization, indexation delays, elimination, or wrong indexation or DOI.
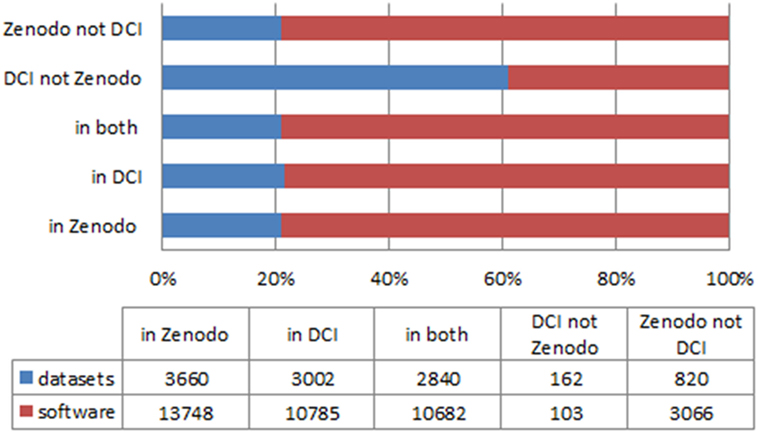
Figure 2. Coverage of Zenodo data records in the Data Citation Index (DCI) (Zenodo data record types: datasets and software; all publication years).
PlumX
Table 2 also provides information about the data availability of Zenodo in PlumX. It should be noted that some PlumX records could not be rematched with the original Zenodo data via DOI. The data used in this table covers 99.99% (3,331 of 3,332) of “books,” 99.98% (11,940 of 11,942) of “conference papers,” and 99.81% (27,201 of 27,252) of “journal articles” in PlumX. The data availability percentages are much higher than in WoS CC for all document types. Almost all Zenodo journal articles indexed were also retrieved in PlumX.
Altmetric.com
From 51,051 data records, 4,692 (9%) were found in the Altmetric.com dataset (see Table 3). Availability of altmetrics data highly varies across the data record types: 15% of journal articles, 11% of reports, working papers, technical notes, and 10% of datasets could be retrieved. The other data record types were less frequent.
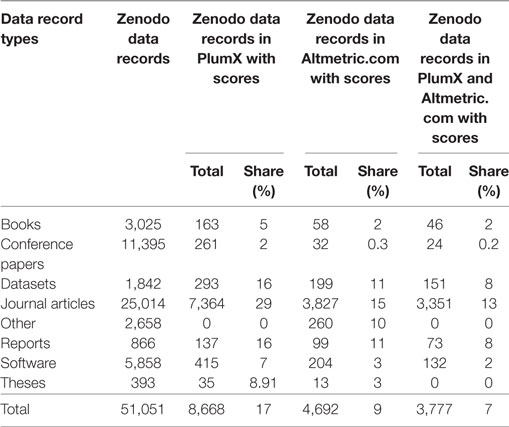
Table 3. Comparison of data records found in Altmetric.com and PlumX (n = 51,051; publication years <2016).
PlumX versus Altmetric.com
As can be seen in Table 3, in terms of data availability PlumX outperforms Altmetric.com for all data record types except for “other” which were not recorded by PlumX. However, the direct comparison of PlumX and Altmetric.com is challenging because both altmetrics providers collect and deliver different altmetric signals. As you can see in Table 4 only the signal “Mendeley reader” is provided by both aggregators.
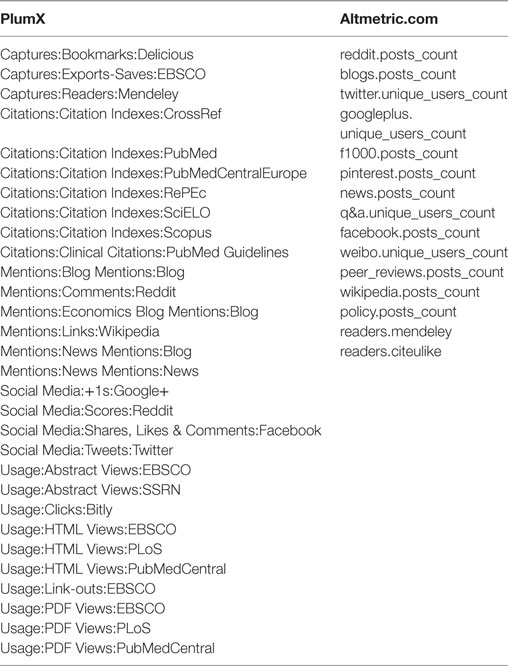
Table 4. Full list of signals for journal articles available in Altmetric.com and PlumX (n = 3,399; publication years <2016).
Citedness of Zenodo Data Records in WoS CC and DCI
WoS CC
About 9% of Zenodo data records of the types “books,” “journal articles,” and “conference papers” have been cited as to the WoS CC where “journal articles” is the data record type gaining the highest share of citations. Almost 64% of “journal articles” that are indexed by the WoS CC also received at least one citation.
Data Citation Index
Twenty-six data records did not contain cited references and three records contained only incomplete cited references. Furthermore, only 24 data records (15 “software” and 9 “data studies”) were cited according to DCI and just once. This result is in good agreement with a previous study performed by Peters et al. (2016), which reveals that research data remain mostly uncited (about 85%), although there has been an increase in citing data sets published since 2008.
Altmetrics Signals of Zenodo Data Records from PlumX and Altmetric.com
PlumX
About 37% of Zenodo data records found in PlumX also have altmetrics counts associated with them. In Table 5, we exemplarily present the results for the data record type “journal articles.” It lists all measures and indicators according to the sources these have been retrieved from to provide enough information about the distribution of the scores. The measures are categorized in five separate dimensions typical for PlumX data: Usage, Captures, Mentions, Social Media, and Citations. It should be noted that the total values for each dimension were only calculated to give a quick overview of the percentage of items with available data. Please note, though, that the dimensions reflect different types of engagement with Zenodo data records that should not be conflated.
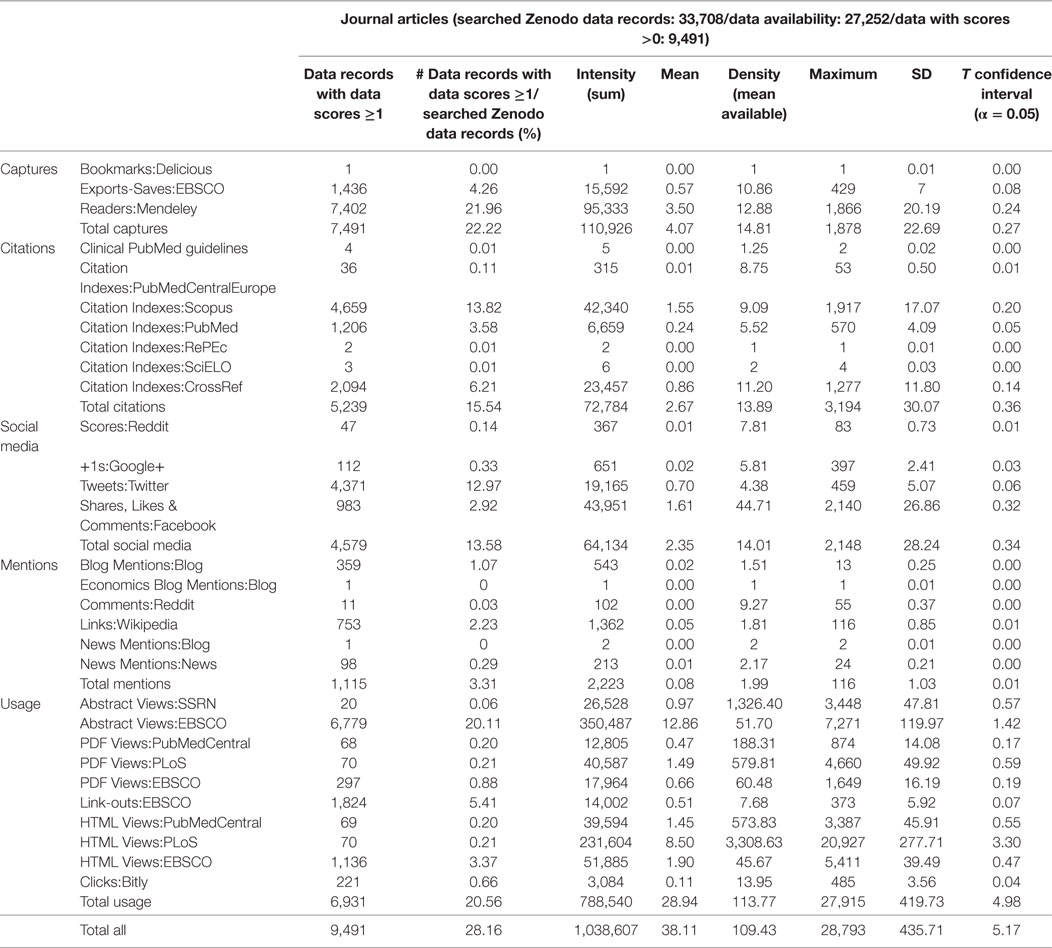
Table 5. Results from PlumX (Zenodo data record type: journal articles; all publication years; see also Tables A1–A7 in Supplementary Material).
As a summarized overview of the peculiarities for each data record type, Table 7 shows the data availability of Zenodo data records in PlumX according to each data record type and PlumX dimensions. It should be noted that the degree of data availability (i.e., number of items traced in PlumX) is not the same as the degree of data with scores (i.e., number of items with at least one score in one of the measures or dimensions reported by PlumX). Data availability can differ strongly in PlumX. For example, in the case of “journal articles,” the DOIs of 33,708 journal articles were introduced in PlumX. However, the data availability provided by PlumX only included 27,252 records. Out of these 27,252 records, only 9,491 records have at least one score in at least one of the tools traced by PlumX (i.e., data with scores). Therefore, the total degree of data with scores for this data record type is 34.83% (see Table 6).
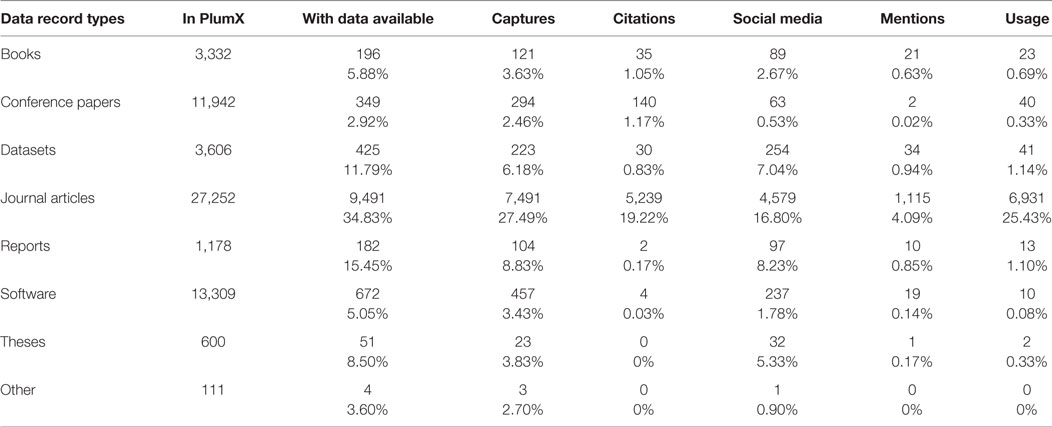
Table 6. Results from PlumX: data availability for each Zenodo data record type (all publication years).
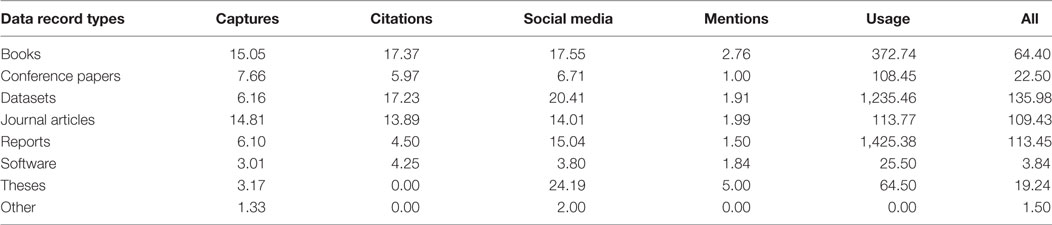
Table 7. Results from PlumX: mean value of the available scores for each Zenodo data record type (all publication years).
Furthermore, Table 7 shows the mean score value computed in PlumX for each dimension (captures, citations, social media, mentions, and usage) and for each Zenodo data record type. In this case, it should be noted that the mean score value (see, for example, Table 6 under “mean available”) was calculated for all data records with at least one score (n = 5,713) and not the mean value of all included in the PlumX resulting dataset (n = 14,454). This value labeled as “mean” in our analysis is also reported for each data record type (see, for example, Table 5 for “journal articles”).
Altmetric.com
In total, 15.3% of journal articles have been found on one of the platforms Altmetric.com tracks. Twitter (12.66%) and Mendeley (11.25%) are those services, which cover most of the journal articles uploaded to Zenodo. In terms of altmetrics intensity, which describes how often particular data record types have been shared on social media platforms, Mendeley yielded the most engagement (39,127 readers), followed by Twitter with 11,516 unique tweeters, Wikipedia with 1,080 posts, and 1,012 Facebook posts (see Table 8). Pinterest and Q&A services are the platforms where Zenodo data records are neither published (i.e., data with score) nor frequently shared (i.e., intensity).
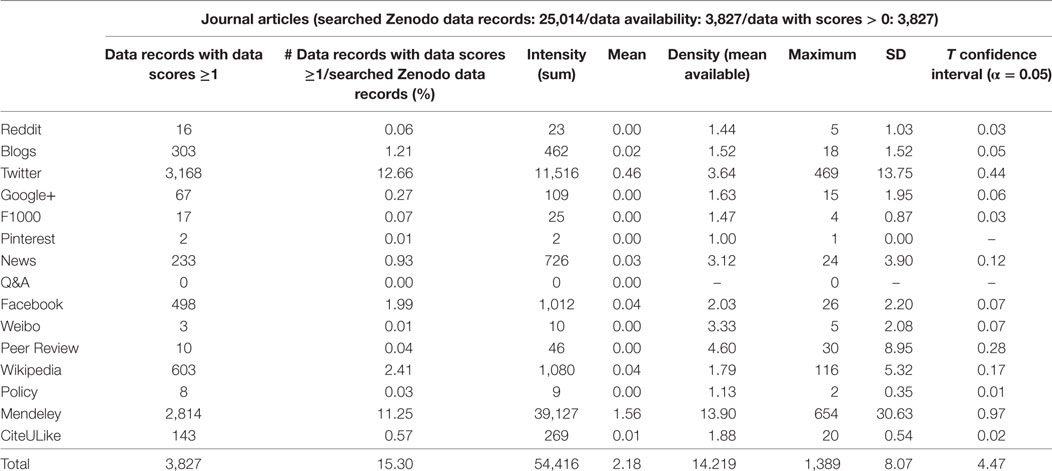
Table 8. Results from Altmetric.com (Zenodo data record type: journal articles, publication years <2016; see also Tables A8–A14 in Supplementary Material).
For all data record types studied, the Pearson correlation between Twitter and Mendeley (only for that data are available in both social media services, n = 3,962) is r = 0.3, for books it is r = 0.12, for conference papers r = 0.03, for reports, working papers, and technical notes r = 0.24, for software r = 0.25, for theses r = 0.88, and for other non-figures r = 0.23. The Pearson correlation of r = 0.33 for Twitter users and Mendeley readers of journal articles reflects that articles receive varying attention on social media platforms.
Comparison of Altmetric Results from PlumX and Altmetric.com
Altmetrics data are highly skewed across the data record types collected in both tools as it is illustrated by the statistical analysis provided in Tables 6 and 9 (as well as in the Tables provided as Supplementary Material). For example, from the 199 datasets in Altmetric.com one is saved by 81 out of 360 Mendeley readers (22.5%) and from the 223 datasets in PlumX one is saved by 135 out of 1,202 Mendeley readers (>10%). Furthermore, one dataset gained 108 out of 682 Twitter unique users in total in Altmetric.com (16%), and one single dataset gained 384 out of tweets 1,608.
Comparing the performance of both tools PlumX retrieves altmetric scores for almost twice as many data records than Altmetric.com. This is in agreement with the high number of sources traced in PlumX and reporting measures (see Table 5) and also corresponds well with the results of previous analyses (Peters et al., 2016). Almost 90% of the journal articles and 80% of all the documents traced in Altmetric.com were also detected in PlumX.
The comparison of PlumX and Altmetric.com reveals that even when retrieving information from the same source, the measured information is different, e.g.: “mentions in blogs” in PlumX versus “counts in blogs” in Altmetric.com, or “+1” versus “unique users counts” in Google+, or “tweets” versus “unique users counts” in Twitter. Captures in Mendeley is the only identical measure collected in both tools (see Table 5), for which the correlation of the traced information in PlumX and Altmetric.com is highly significant (0.95).
Comparison of Bibliometric and Altmetric Results
WoS CC and PlumX
For all journal articles uploaded to Zenodo and at the same time indexed in WoS CC, correlations were performed for the number of citations attracted in WoS CC (WoS CC TC) and in the whole WoS platform (WoS CC-ZA) versus the number of citations attracted in Scopus and CrossRef according to PlumX. The results are summarized in Table 9. The results show a very high correlation between WoS and Scopus, and a lower one between WoS and CrossRef.
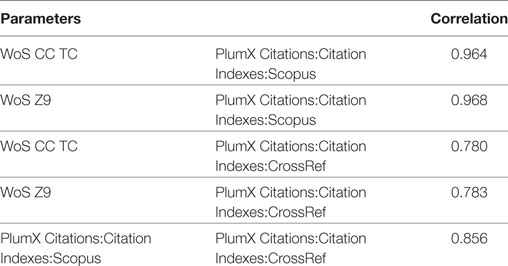
Table 9. Citation correlations Web of Science (WoS) TC and ZA versus PlumX-Scopus/CrossRef (n = 4,233; all publication years).
A summary of the descriptive statistics for citation counts in the four data sources (i.e., WoS CC, WoS, Scopus, and CrossRef) is provided in Table 10. The higher number of citation counts retrieved in WoS can be due to the different dates of the data collection (in WoS 6 months later than in PlumX).
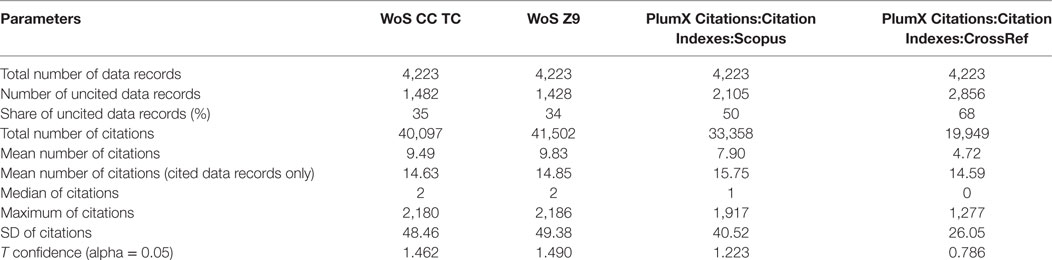
Table 10. Statistical report for the citation analysis performed in WoS CC, Web of Science (WoS), Scopus, and CrossRef (journal articles; all publication years).
Relationship between Bibliometrics, Altmetrics, and Access Rights of Zenodo Data Records
Only few books, book sections, and journal articles make use of the broad range of access rights, which also reflects the current situation with publishers only granting restricted or embargoed access to scholarly products. We exemplarily studied the relationship between access rights of journal articles and a selection of altmetrics indicators from Altmetric.com, and the results of this study are given in Figure 3.
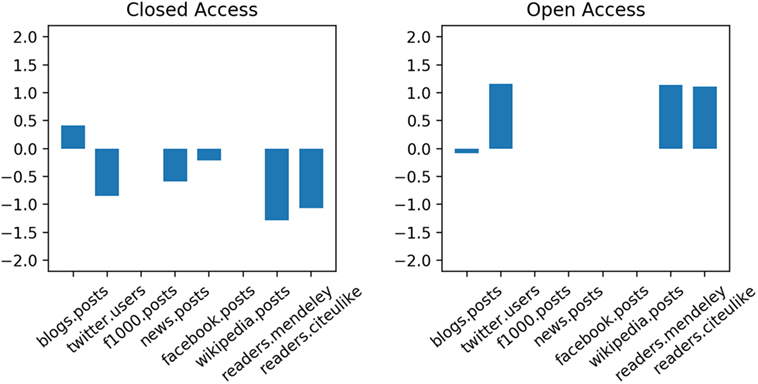
Figure 3. Relationship between altmetrics, and access rights of Zenodo data records. Closed access combines data records with closed, embargoed, and restricted access (data from Altmetric.com, publication years <2016).
As shown in Figure 3, our preliminary study seems to confirm our hypothesis that journal articles with permissive access rights tend to attract more altmetrics counts in our data sample. For example, the indicators “number of (unique) Twitter users,” “readers in CiteULike,” and “readers in Mendeley” have positive coefficients with the class OA. The same indicators are negatively correlated with CA, as well as the indicators “f1000 posts” and “Facebook posts,” albeit with much lower coefficients.
Conclusion
Zenodo has gained momentum and popularity, not only due to its integrated reporting lines for research funded by the European Commission but also due to the free assignment of DOIs to all publicly available uploads. Our case study results reflect this upwards trend. Particularly the numbers of uploaded journal articles and software are increasing almost exponentially and we see a strong growth for datasets as well. We found this shift toward increased data sharing also in our previous analyses of DCI (Peters et al., 2016) and Figshare (Kraker et al., 2015).
Zenodo’s data records are also indexed in other databases, which is paramount to gaining visibility and along with it, to drive reuse of data records. Almost 13% of the journal articles uploaded in Zenodo are indexed in the WoS CC, and nearly 80% of the datasets or software uploaded in Zenodo are covered in the DCI, where this repository plays an important role as a data source.
Data records are, however, also shared via other platforms, such as social media. Traces of that are gathered by altmetrics aggregators such as PlumX. The percentage of altmetric data availability of the data records from Zenodo varies strongly across data record types, but never exceeds the one-third threshold. Out of the searched Zenodo record type journal articles (~35%), followed by reports (~15%) and datasets (~12%), are the record types attracting the highest altmetric scores. These are mostly captures traced in Mendeley, a phenomenon that is generally applicable to all data record types. This corroborates earlier research, which found that Mendeley is one of the altmetrics data sources with the highest coverage (e.g., Zahedi et al., 2017).
The availability of citations from WoS CC is only substantial for journal articles. However, citedness is relatively low due to the short citation window since the majority of data records uploaded to Zenodo was published within the last 3 years. Data records from the type “dataset” and “software” have not seen considerable reuse in terms of citations, which might also be due to lack of standards in citing and indexing references to software (Howison and Bullard, 2016). Most Zenodo data records of this type have not been cited at all. However, those that have been cited or were mentioned on social media platforms have been reused several times.
The observed high percentages of altmetrics availability in social media for datasets, reports, and theses are remarkable (see Supplementary Material). Except for journal articles, the percentage of data records with mentions mostly remains below 1% for all further data record types. The same is true for usage counts. In contrast to previous studies (for example, Torres-Salinas et al., 2017), we found low values for usage of books and book chapters. This can be explained by the low number of books uploaded to Zenodo and the use of the DOIs, and not ISBNs, to trace their scores in PlumX.
In general, datasets, journal articles, and reports are the document types with the highest altmetric mean values. Furthermore, high mean values were observed for the usage of reports and datasets in comparison to the other document types. The high mean value of scores obtained by theses probably reflects the rather more positive attitude of young academics toward social media, who utilize them for the dissemination of their output beyond traditional channels (Work et al., 2015).
With respect to altmetrics and access rights, a preliminary experiment seems to confirm our hypothesis that journal articles in Zenodo with permissive access rights tend to attract more altmetrics counts in our data sample.
In our case study, we also compared the citation metrics retrieved from the data sources WoS and PlumX, the latter also collecting data from Scopus as well as from CrossRef. As could have been expected, the correlations between citation counts in WoS and in Scopus via PlumX are very high and in agreement with previous results (e.g., Gorraiz and Schloegl, 2008; Archambault et al., 2009). The number of citations included in CrossRef are significantly lower (almost half as many) than in WoS or in Scopus. The citation correlations concerning CrossRef are also considerably weaker than the one observed between Scopus and WoS.
Comparing the performance of both tools PlumX retrieves altmetric scores for almost twice as many documents than Altmetric.com. Our results show that almost 90% of the journal articles and 80% of all the documents traced in Altmetric.com were also detected in PlumX.
A more detailed analysis concerning the altmetric information provided by both tools reveals that they are rather complementary than comparable.
Furthermore, PlumX generally collects the total number of scores originating from each tool, whereas Altmetric.com inconsistently either counts the number of events or the number of users. Counting the number of users rather than the number of scores is perceived as a good means to avoid data manipulation. However, combining both approaches in a consistent way would be desirable. In comparison, citation metrics are more straightforward, as they are strictly based on counting cited and citing publications.
We hope that with our case study, we can help spark further research on usage, reception, and engagement of and with repositories for scientific artifacts.
Author Contributions
Conception or design of the work; critical revision of the article; and final approval of the version to be published: CG, JG, PK, EL, and IP. Data collection: CG, JG, PK, and IP. Data analysis and interpretation; drafting the article: CG, JG, EL, and IP. Data upload: PK.
Conflict of Interest Statement
The authors declare that the research was conducted in the absence of any commercial or financial relationships that could be construed as a potential conflict of interest.
Acknowledgments
The authors thank Stephan Buettgen (EBSCO) and Christina Lohr (Elsevier) for granted trial access to PlumX during data collection and Benedikt Blahous for his help processing the data. Moreover, the authors thank Altmetric.com for altmetric data and Steffen Lemke for assistance in data processing. The Know-Center is funded within the Austrian COMET Program—Competence Centers for Excellent Technologies—under the auspices of the Austrian Ministry of Transport, Innovation and Technology, the Austrian Ministry of Economics and Labor, and by the State of Styria. COMET is managed by the Austrian Research Promotion Agency (FFG). Part of this work has been conducted in the project *metrics funded by the Deutsche Forschungsgemeinschaft (DFG, No. 314727790).
Supplementary Material
The Supplementary Material for this article can be found online at http://www.frontiersin.org/articles/10.3389/frma.2017.00013/full#supplementary-material.
Footnotes
- ^http://ec.europa.eu/newsroom/dae/document.cfm?doc_id=16022.
- ^http://journals.plos.org/plosone/s/data-availability.
- ^https://www.nature.com/sdata/policies/repositories.
- ^https://www.gatesfoundation.org/How-We-Work/General-Information/Open-Access-Policy.
- ^https://www.datacite.org/cite-your-data.html.
- ^https://www.elsevier.com/__data/assets/pdf_file/0004/281920/Open-data-report.pdf.
- ^In Altmetric.com data with scores = 0 are only available for Mendeley and CiteULike. Because of the data collection process at Altmetric.com data availability and data with scores of Mendeley data are almost always identical. Differences can appear because of synchronization lags, e.g., when a Mendeley user removes an article from her library and the reader number is then set to 0 (https://mendeleyapi.wordpress.com/category/readership-statistics).
- ^http://scikit-learn.org/stable/modules/sgd.html.
References
Archambault, É, Campbell, D., Gingras, Y., and Larivière, V. (2009). Comparing bibliometric statistics obtained from the Web of Science and Scopus. J. Assoc. Info. Sci. Technol. 60, 1320–1326. doi: 10.1002/asi.21062
Bruno, B., Ferus, A., Gorraiz, J., Gründhammer, V., Gumpenberger, C., Maly, N., et al. (2015). Forschende und ihre Daten. Ergebnisse einer österreichweiten Befragung – Report 2015. Version 1.2. Available at: https://zenodo.org/record/32043
Chamberlain, S., and Bojanowski, M. (2016). oai: General Purpose ‘Oai-PMH’ Services Client. R Package Version 0.2.2. Available at: https://CRAN.R-project.org/package=oai
Costas, R., Zahedi, Z., and Wouters, P. (2014). Do “altmetrics” correlate with citations? Extensive comparison of altmetric indicators with citations from a multidisciplinary perspective. J. Assoc. Info. Sci. Technol. 66, 2003–2019. doi:10.1002/asi.23309
Dorch, S. B. F. (2013). Altmetrics to Quantify the Impact of Scientific Research Published in Open Full Text Repositories. Zenodo. doi:10.5281/zenodo.6773
Drachen, T., Ellegaard, O., Larsen, A., and Dorch, S. (2016). Sharing data increases citations. Liber Q. 26, 67–82. doi:10.18352/lq.10149
Gorraiz, J., and Schloegl, C. (2008). A bibliometric analysis of pharmacology and pharmacy journals: Scopus versus Web of Science. J. Info. Sci. 34, 715–725. doi:10.1177/0165551507086991
Haustein, S., Costas, R., and Larivière, V. (2015). Characterizing social media metrics of scholarly papers: The effect of document properties and collaboration patterns. PLoS ONE 10:e0120495. doi:10.1371/journal.pone.0120495
He, L., and Han, Z. (2017). Do usage counts of scientific data make sense? An investigation of the Dryad repository. Library Hi Tech 35, 332–342. doi:10.1108/LHT-12-2016-0158
He, L., and Nahar, V. (2016). Reuse of scientific data in academic publications: an investigation of Dryad digital repository. Aslib J. Info. Manage. 68, 478–494. doi:10.1108/AJIM-01-2016-0008
Howison, J., and Bullard, J. (2016). Software in the scientific literature: problems with seeing, finding, and using software mentioned in the biology literature. J. Assoc. Info. Sci. Technol. 67, 2137–2155. doi:10.1002/asi.23538
Ingwersen, P. (2014). “Scientific datasets: informetric characteristics and social utility metrics for biodiversity data sources,” in Library and Information Sciences, eds C. Chen, and R. Larsen (Berlin Heidelberg: Springer), 107–117.
Jobmann, A., Hoffmann, C. P., Künne, S., Peters, I., Schmitz, J., and Wollnik-Korn, G. (2014). Altmetrics for Large, Multidisciplinary Research Groups: Comparison of Current Tools. Bibliometrie: Praxis und Forschung, 3.
Konkiel, S. (2013). Tracking citations and altmetrics for research data: challenges and opportunities. Bull. Assoc. Info. Sci. Technol. 39, 27–32. doi:10.1002/bult.2013.1720390610
Kraker, P., Lex, E., Gorraiz, J., Gumpenberger, C., and Peters, I. (2015). “Research data explored II: the anatomy and reception of figshare,” in Proceedings of the 20th International Conference on Science and Technology Indicators (Lugano, Switzerland), 77–79. Available at: http://sti2015.usi.ch/sites/www.sti2015.usi.ch/files/media/book-abstracts-sti2015.pdf
Kratz, J. E., and Strasser, C. (2015). Researcher perspectives on publication and peer review of data. PLoS ONE 10:e0117619. doi:10.1371/journal.pone.0117619
Martone, M. (ed.) (2014). Joint Declaration of Data Citation Principles (Data Citation Synthesis Group: Joint Declaration of Data Citation Principles). San Diego, CA: FORCE11.
Mayernik, M. S., and Maull, K. E. (2017). Assessing the uptake of persistent identifiers by research infrastructure users. PLoS ONE 12:e0175418. doi:10.1371/journal.pone.0175418
Mayo, C., Vision, T. J., and Hull, E. A. (2016). “The location of the citation: changing practices in how publications cite original data in the Dryad Digital Repository,” in Proceedings of the 11th International Digital Curation Conference (Amsterdam, Netherlands).
Pampel, H., Vierkant, P., Scholze, F., Bertelmann, R., Kindling, M., Klump, J., et al. (2013). Making research data repositories visible: there3data.org registry. PLoS ONE 8:e78080. doi:10.1371/journal.pone.0078080
Park, H., and Wolfram, D. (2017). An examination of research data sharing and re-use: implications for data citation practice. Scientometrics 111, 443–461. doi:10.1007/s11192-017-2240-2
Peters, I., Gumpenberger, C., Kraker, P., Lex, E., and Gorraiz, J. (2016). Research data explored: an extended analysis of citations and altmetrics. Scientometrics 107, 723–744. doi:10.1007/s11192-016-1887-4
Peters, I., Gumpenberger, C., Kraker, P., Lex, E., and Gorraiz, J. (2017). Zenodo Public Metadata Records Until 17 January 2017 [Data Set]. Zenodo. doi:10.5281/zenodo.1065506
Peters, I., Kraker, P., Lex, E., Gumpenberger, C., and Gorraiz, J. (2015). “Research data explored: citations versus altmetrics,” in Proceedings of the 15th International Conference on Scientometrics and Informetrics, eds A. A. Salah, Y. Tonta, A. A. Akdag Salah, C. Sugimoto, and U. Al (Istanbul, Turkey), 172–183. Available at: http://issi2015.org/files/downloads/all-papers/0172.pdf
Piwowar, H. A., Day, R. S., and Fridsma, D. B. (2007). Sharing detailed research data is associated with increased citation rate. PLoS ONE 2:e308. doi:10.1371/journal.pone.0000308
Piwowar, H. A., and Vision, T. J. (2013). Data reuse and the open data citation advantage. PeerJ 1, e175. doi:10.7717/peerj.175
Robinson-García, N., Jiménez-Contreras, E., and Torres-Salinas, D. (2016). Analyzing data citation practices using the data citation index. J. Assoc. Info. Sci. Technol. 67, 2964–2975. doi:10.1002/asi.23529
Robinson-García, N., Mongeon, P., Jeng, W., and Costas, R. (2017). DataCite as a novel bibliometric source: coverage, strengths and limitations. arXiv Preprint. Available at: https://arxiv.org/abs/1707.06070
Thelwall, M., and Kousha, K. (2016). Figshare: a universal repository for academic resource sharing? Online Info. Rev. 40, 333–346. doi:10.1108/OIR-06-2015-0190
Torres-Salinas, D., Gumpenberger, C., and Gorraiz, J. (2017). PlumX as a potential tool to assess the macroscopic multidimensional impact of books. Front. Res. Metric. Anal. 2:5. doi:10.3389/frma.2017.00005
Torres-Salinas, D., Martín-Martín, A., and Fuente-Gutiérrez, E. (2014). An introduction to the coverage of the Data Citation Index (Thomson-Reuters): disciplines, document types and repositories. arXiv Preprint. Available at: https://arxiv.org/abs/1306.6584
Vandewalle, P. (2012). Code sharing is associated with research impact in image processing. Comput. Sci. Eng. 14, 42–47. doi:10.1109/MCSE.2012.63
Work, S., Haustein, S., Bowman, T. D., and Larivière, V. (2015). Social Media in Scholarly Communication. A Review of the Literature and Empirical Analysis of Twitter Use by SSHRC Doctoral Award Recipients. Study commissioned by the Social Sciences and Humanities Research Council. Available at: http://crctcs.openum.ca/files/sites/60/2015/12/SSHRC_SocialMediainScholarlyCommunication.pdf
Zahedi, Z., Costas, R., and Wouters, P. (2017). Mendeley readership as a filtering tool to identify highly cited publications. J. Assoc. Info. Sci. Technol. 68, 2511–2521. doi:10.1002/asi.23883
Keywords: Zenodo, data citation, citation analysis, altmetrics, repository, bibliometrics
Citation: Peters I, Kraker P, Lex E, Gumpenberger C and Gorraiz JI (2017) Zenodo in the Spotlight of Traditional and New Metrics. Front. Res. Metr. Anal. 2:13. doi: 10.3389/frma.2017.00013
Received: 09 October 2017; Accepted: 07 December 2017;
Published: 22 December 2017
Edited by:
Xianwen Wang, Dalian University of Technology (DUT), ChinaReviewed by:
Xiaolei Huang, Fujian Agriculture and Forestry University, ChinaPhilippe Mongeon, Université de Montréal, Canada
Copyright: © 2017 Peters, Kraker, Lex, Gumpenberger and Gorraiz. This is an open-access article distributed under the terms of the Creative Commons Attribution License (CC BY). The use, distribution or reproduction in other forums is permitted, provided the original author(s) or licensor are credited and that the original publication in this journal is cited, in accordance with accepted academic practice. No use, distribution or reproduction is permitted which does not comply with these terms.
*Correspondence: Isabella Peters, aS5wZXRlcnNAemJ3LmV1