 Flávia Cristina dos Santos1,2
 Manoel Ricardo de Albuquerque Filho2
 Johnny Rodrigues Soares3
 Tanjila Jesmin1
 Noel Manirakiza1
 Márcia Cristina Teixeira da Silveira2
 Ieda de Carvalho Mendes4Maria Ines Lopes de Oliveira4
 Suraj Melkani1
 Antonio Carlos Reis de Freitas5Juaci Vitoria Malaquias4
 Jehangir H. Bhadha1*
- 1Soil, Water & Ecosystem Sciences Department, University of Florida, Belle Glade, FL, United States
- 2Water, Soil and Environmental Sustainability Department, Embrapa Maize and Sorghum, Sete Lagoas, Minas Gerais, Brazil
- 3Soil and Plant Nutrition Department, Embrapa Rice and Beans, Santo Antonio de Goias, Goias, Brazil
- 4Natural Resources Department, Embrapa Cerrados, Planaltina, Distrito Federal, Brazil
- 5Agroecology Studies Department, Embrapa Cocais, Sao Luis, Maranhao, Brazil
Soil health (SH) indicators, such as organic matter (OM) content and enzymatic activity (EA), are critical for assessing the sustainability of mineral soils in integrated and cover cropping systems. Taking into account the following objectives: (i) to assess the relationship between OM and other SH indicators, (ii) to evaluate the evolution of SH using two models (SH indicators (SHI) scoring approach and A Modified Comprehensive Assessment of Soil Health scoring system developed for Florida soils (A modified CASH method)), and (iii) present their effectiveness in Brazil and the USA, a medium-term study (2019–2023) in Brazil and a short-term seasonal study (2022–2023) in the USA were conducted in diverse agroecosystems. In Brazil, four agricultural systems were analyzed: Cerrado (Cer), Conventional (Conv), Integrated Crop-Livestock (ICL), and Integrated Crop-Livestock-Forestry (ICLF). In the USA, two cover cropping systems in South Florida were assessed: double cover cropping system (DCCS) and multiple cover cropping system (MCCS). Soil samples were collected for analysis of key soil properties. Results in Brazil showed higher OM in the Cer (1.08 dag kg-1) and ICL (1.12 dag kg-1) systems, and increased enzymatic activity in 2023, particularly in ICL (AS = 33.85 mg de p-nitrofenol kg-1 soil h-1 and BG = 54.65 mg de p-nitrofenol kg-1 soil h-1) and ICLF (AS = 21.07 mg de p-nitrofenol kg-1 soil h-1 and BG = 48.90 mg de p-nitrofenol kg-1 soil h-1). Enzyme activity was more responsive to management practices than OM. Principal Component Analysis revealed stronger correlations between OM, EA, and macronutrients in more sustainable systems like ICL and ICLF. The SHI scoring approach better captured changes in Brazil. In the USA short-term cover cropping systems showed no significant changes in OM or EA, but CASH method suggested slight improvements in MCCS. This study highlights the importance of OM and EA as key indicators for assessing and improving SH and suggests that while integrated and cover cropping systems offer potential benefits, longer-term management and organic amendments are necessary to achieve sustained improvements in soil health.
1 Introduction
Global agriculture faces growing pressure to adopt sustainable practices that address climate change while maintaining productivity and resilience. Integrated agricultural systems, such as crop-livestock and crop-livestock-forestry combinations, and cover cropping are two effective strategies for meeting this demand (1, 2). Integrated systems optimize resource use, enhance ecosystem services, and improve soil health (SH) through better soil, plant, and animal management, increased plant diversity, and enhanced soil cover. Similarly, cover crops contribute by protecting soil, improving nutrient cycling, and supporting beneficial microbial activity. Individually, these approaches maintain continuous soil cover, minimize erosion, and improve the physical, chemical, and biological properties of soils, making them vital for enhancing resilience and advancing sustainable agriculture amid climate challenges.
By definition, SH is “the continued capacity of soil to function as a vital living ecosystem that sustains plants, animals, and humans” (3), and often used interchangeably with soil quality (4). While traditional assessments of soil quality focused primarily on crop production (5), contemporary perspectives emphasize its broader role in water quality, climate change mitigation, and human health. In natural systems, soil quality is influenced by landscape factors such as climate, topography, soil type, vegetation, and land use, whereas in managed systems, it is closely tied to soil carbon stocks, fertility, and crop productivity. Developing tools to quantify and map the variability of these factors is critical for monitoring soil health and documenting the benefits of sustainable agricultural practices, including their contributions to ecosystem services (6).
Numerous studies have sought to identify soil properties that are key SH indicators (4, 7–16). Soil chemical and soil fertility indicators are already relatively well defined for each element and type of soil, while microbiological indicators or bioindicators require studies that establish reference areas (comparative assessment) which can be monitored to verify changes over time (dynamic assessment). Therefore, further research on soil quality assessment is require in making scientific advances for a complete conception of integrating chemical, physical and biological indicators (17).
Among these characteristics, soil organic matter (SOM), specifically soil organic carbon (SOC) is the main component that stands out as a key indicator of SH and as a fundamental component and regulator of soil chemical, physical and biological functions. Soil OM is involved in all three functions that make up the soil quality index (SQIFertbio): cycling (F1), storage (F2) and supply (F3) of nutrients (18). The ability to retain and exchange ions in the soil and to buffer acidity, as well as the concentration of nutrients in the solution and in the soil are strongly influenced by the content, chemical nature and bioactivity of SOM (4, 19, 20). Furthermore, the water dynamic (21) and the structuring microbial communities in the soil is intrinsically linked to the quantity and quality of available SOM (22).
Biological indicators, particularly enzymatic activities, have emerged as effective tools for assessing SH and guiding sustainable management practices. Stott et al. (7) highlighted β-glucosidase (BG) activity as a key indicator of SH, linking its activity to SOC levels. They established relationships between BG activity and soil carbon, identifying whether “more is better,” “less is better,” or “local optimum” models apply. Field experiments across soil orders, textures, and climates validated the model, emphasizing the importance of considering annual fluctuations in temperature and precipitation, which affect microbial biomass and plant growth, while seasonal effects were deemed less critical.
Building on this foundation, researchers at Embrapa, Brazil, have developed bioindicators to enhance routine soil analyses. Their efforts led to the identification of two critical enzymes—arylsulfatase (AS) and β-glucosidase (BG)—as sensitive indicators of SH due to their roles in the sulfur and carbon cycles. These studies culminated in the creation of SoilBio, a practical tool for monitoring SH at the farm scale (15). Research has consistently shown enzymatic activity to be more sensitive than organic matter in evaluating SH (23, 24). Furthermore, the positive correlation between enzymatic activity, crop productivity, and the adoption of best management practices underscores its value as a reliable indicator of soil quality (18, 25–30).
Furthermore, Mendes et al. (18) proposed a soil health indicator (SHI) scoring system that integrates three soil functions: nutrient cycling (F1), nutrient storage (F2), and nutrient supply (F3). Function 1 evaluates biological activity and processes like SOM formation and decomposition, using β-glucosidase and arylsulfatase as indicators (25, 31, 32). Function 2 quantifies the soil’s nutrient reservoir, assessed through SOC and cation exchange capacity (CEC), while F3 measures the quality of nutrient availability and acidity, using pH, base cations, and acidity indicators. The SHI model visually represents soil health in four quadrants: Q1 (healthy soil, high cycling and storage), Q2 (deteriorating, declining enzyme activity but stable SOC), Q3 (unhealthy soil, low cycling and storage), and Q4 (recovering soil, improving cycling but stable SOC), and an intermediate condition. This framework highlights the dynamic nature of soil health and the impact of management practices (18, 29).
This study investigates SH dynamics under two distinct sustainable management practices through a comparative analysis of medium-term integrated practices in Brazil and a short-term seasonal cover cropping system in the United States. Both regions, characterized by sandy soils and tropical climatic conditions, play a crucial role in shaping nutrient cycling, microbial activity, and organic matter dynamics, particularly in the context of climate change. The medium-term studies in Brazil provide insights into the long-term impacts of sustainable practices, while the short-term studies in the United States offer a view of initial responses to these interventions. By focusing on the Medium-term agrosystems of the Cerrado in Bahia, Brazil, and the Short-term seasonal cover cropping systems in South Florida, we aim to improve soil fertility and health as well as enhance crop production. However, information regarding how these agrosystems contribute to soil fertility and health in each region is limited. To address this gap, we conducted two separate studies—one in Brazil and the other one in South Florida—to understand the impact of these individual agrosystems on SOM, SH indicators, and overall SH. This comparative analysis highlights both shared patterns and region-specific trends, advancing the understanding of SH improvement in tropical sandy soils.
Therefore the study focuses on evaluating SH across various agroecosystems through two different approaches that attempt to demonstrate the importance of organic matter as a critical indicator of soil health and the objectives were to: (i) evaluate the relationship between SOM and other SH indicators, such as EA, and soil nutrient content; (ii) analyze the evolution in SH in four different agrosystems in Brazil and two separate commercial farming systems within South Florida, USA, using two different models: SHI scoring approach and a modified CASH method; (iii) present the two SH models evaluation for the results from Brazilian and the U.S. studies.
2 Materials and methods
This field study was conducted in two separate agricultural systems situated in different geographical locations: Medium-term agrosystems–Cerrado of Bahia, Brazil and Short-term agrosystems– Seasonal cover cropping systems of South Florida, United States. Brazilian agrosystems are characterized by mineral soils–Arenosols (33, 34), with low OM content (< 1.0%), poor water and nutrient holding capacity (< 4.0 cmolc dm-3) (35). The regions’ weather condition is hot and dry during summer spells, with an average temperature of 24°C, and average annual rainfall ranging from 700 to 1,400 mm (36). The native vegetation in the area is Cerrado (Savannah). On the other hand, South Florida Agrosystems are characterized by sandy soils with poor OM ranging between 1-4%, nutrient deficiencies, poor soil structure, and low water holding capacity (37), and subsequently limit crop growth and yields (38). This region is in a sub-tropical climate where average annual temperature is 20.8°C and rainfall are 1,242 mm (WorldClimateData: http://www.worldclimate.com/climate/us/florida). While the two EA (BG and AS) were analyzed following the same protocol (39) for both Brazilian and the U.S. studies, other soil indicators were analyzed following the standard protocol of each Lab’s study site. The information regarding experimental design, field soil sampling, soil processing and analysis, as well as statistical analysis adopted for Brazil, and South Florida agrosystem are separately provided in detail under the following sections.
2.1 Medium-term agrosystems: Cerrado of Bahia, Brazil
2.1.1 Study site
In Brazil, a four-year medium-term study (2019 and 2023) was conducted at Trijunção Farm, located in Jaborandi, Bahia (14°51’13”S, 45°56’11”W). The farm comprises of beef cattle production under the Brazilian Good Agricultural Practices (40), holding structured and sequential data of the entire production system. Four different agrosystems that are being adopted within the farm including (i) Cerrado (Cer) (baseline); (ii) Conventional system (Conv) as a control, (low-input pasture management); (iii) integrated crop-livestock (ICL); (iv) integrated crop-livestock-forestry (ICLF) were evaluated in this study. The basic criteria for choosing the different agrosystems/plots in this study, except Cer, was similarity in soil types and OM content, as well as the same species of forage used in the pastures, with the only difference being the cultivar.
The agrosystems of Brazil have the following history of land use since 2010 (year from which there is information): the Cer is a baseline and corresponds to the native vegetation of the farm, i.e. it has not been cultivated, and this area was monitored, over time, to improve the comparative analysis of the other farms’ systems. The Conv system, known as the control, had Urochloa brizantha cv. Marandu pasture since 2010 and only had sorghum planted in the 2012/2013 crop season. Afterward, the introduction of Marandu pasture was reimplemented, and it remains current in the system. The ICL agrosystem previously had the pasture that was replaced by crops since 2010 until 2017 (soybean - Glycine max (L.) Merrill) and corn - Zea mays L.). After this Urochloa brizantha cv. Piata was planted and still does today. The ICLF agrosystem had pasture of Urochloa brizantha cv. Marandu from 2010 to 2018, and eucalyptus (Eucalyptus grandis) and crops (soybean - Glycine max (L.) Merrill), sorghum – Sorghum bicolor and millet – Pennisetum glaucum, for two seasons) in 2021 pasture of Urochloa brizantha cv. Piata was sown and still does today. It is important to note that since the year of 2019, Embrapa has begun work on sustainable agricultural intensification in the Trijuncao Farm with the establishment of low- and carbon-neutral livestock protocols (41, 42) in the integrated agrosystems (ICL and ICLF).
The management of the Conv system, that comprises an area of 115 ha divided into 4 paddocks, is made by applying fertilizers over the grass every 3 years This periodicity was defined by the monitoring of soil fertility in the area, where it took three years after fertilization for the soil to return to its initial status of fertility. In 2020, 100 kg ha-¹ of monoammonium phosphate (MAP) was broadcast over the entire area, and in 2021, 1.5 Mg ha-¹ of limestone was applied. The cattle were managed using a rotational grazing system, although at times the pasture height was not closely monitored when moving animals in and out of the paddocks.
The ICL agrosystem comprised an area of 85 ha and was divided into 4 paddocks. The pastures were managed in a rotational grazing system, with the recommended pre-grazing height at 30–40 cm, keeping a minimum pos-grazing height at 20 cm for the Urochloa brizantha cv. Piata. Height was monitored every two weeks, using a sward stick, by sampling approximately 100 points per paddock along a zigzag transect. The animal load adjustment was determined based on this monitoring. Per year doses of 180 kg ha-1 of N were recommended, applied in four times (45 kg ha-1 of N per application) after grazing in the paddocks, plus one dose of 50 kg ha-1 of K2O based on recommendations by Embrapa (43) and on the intensification level adopted. Phosphorus (P) and micronutrients were applied once per two years in a dose of 25 kg ha-1 de P2O5 and 30 kg ha-1 of a fertilizer containing a mixture of micronutrients. The ICLF comprised an area of 15 ha divided into 3 paddocks and has the same management as the ICL agrosystem.
In summary, the Cer area represents an area without anthropic interference and the other three systems are representative systems in Brazil, with the Conv system being the type of system most practiced in Brazil for many years, with more extensive management. The ICL and ICLF systems, on the other hand, are systems that adopt more conservationist practices and allow for intensification and diversification of livestock farming.
2.1.2 Soil sampling
In the years of 2019 and 2023, after the rainy season (April), top-soil samples (0–10 cm) were collected in each system, with 20 replications. All soil samples were identified and placed in plastic bags and promptly transported to the Embrapa Maize and Sorghum Research Center for further soil sample processing and analysis.
2.1.3 Laboratory analyses
While two EA (BG and AS) were analyzed at Microbiology Lab of Embrapa Cerrados, following colorimetric method (39), soil chemical properties, such as OM, pH, cation exchange capacity (CEC), base saturation (BS), and nutrients, such as P, K, Ca, Mg, S, Cu, Mn, Fe, Zn, and clay content were analyzed at the Soil Laboratory at Soil Department of University of Vicosa, following the methodology described by Teixeira et al. (44).
2.2 Short-term seasonal cover cropping systems: South Florida, United States
2.2.1 Study site
In the United States, a two-year seasonal short-term study (2022, and 2023) of cover cropping systems (CCS) was conducted on commercial farms in South Florida´s mineral soils. Among the two farms involved in the study were a double cover cropping system (DCCS) located at 26°41’11.21”N, 80°19’58.31”W, and a multiple cover cropping system (MCCS) situated at 26°41’25.11”N, 80°17’45.13”W. Double cover cropping system consisted of a mixture of Sunn hemp (Crotalaria juncea L.), and Cowpea (Vigna unguiculata), while MCCS consisted of a blend of Sunn hemp (Crotalaria juncea L.), Cowpea (Vigna unguiculata), Sorghum- sudangrass (Sorghum × drummondii), and Buckwheat (Fagopyrum esculentum).
2.2.2 Soil sampling
To enhance the fertility and health of these mineral soils, both the DCCS and MCCS were tested during the hot summer season of 2022 and 2023 using a completely randomized design with ten replications. Topsoil samples (0–15 cm) were collected before the initiation of the cover cropping systems (pre-soil samples) and after cover crop termination (post-soil samples) during the 2022 and 2023 growing seasons. All pre- and post-soil samples were placed in Ziplock bags and promptly transported to the Soil, Water, and Nutrient Management (SWNM) Lab at the Everglades Research and Education Center- University of Florida- where they were air-dried, debris, and plant roots were removed before being passed through a 2 mm sieve for laboratory analyses.
2.2.3 Laboratory analyses
Thirteen soil health indicators were analyzed for all soil samples, including pH, bulk density (BD), maximum water holding capacity (MWHC), OM content OM, active carbon (AC), soil protein (SP), total phosphorus (TP), potassium (TK), Mehlich-3 phosphorus (M3P), Mehlich-3 potassium (M3K), total Kjeldahl nitrogen (TKN), and two enzymatic activities: BG and AS. Soil pH was measured using a pH meter with a 1:1.5 soil/water suspension. Bulk density was calculated by dividing the soil mass by a fixed core volume. Maximum water holding capacity was measured using the modified method outlined by Jenkinson and Powlson (45). Organic matter content was determined via the loss on ignition method at 550°C. Active carbon was measured using the potassium permanganate (KMnO4) method (46). Soil protein was assessed through a sodium citrate extraction method under autoclaving at high temperature and pressure (46). Total phosphorus and TK were measured by ashing samples at 550°C in a muffle furnace for 5 to 16 hours, followed by extraction with 6 M HCl and analysis using ICP-OES. Total Kjeldahl nitrogen was analyzed using the Kjeldahl method (47). The enzymatic activities of BG and AS were assessed using colorimetric methods (39).
2.3 Soil health assessment
Soil health assessments for Brazilian samples were conducted using two models: (i) SH indicators (SHI) scoring approach and (ii) A modified CASH method; and for the U.S. samples using: (i) F1 function (nutrient cycling = enzymes activity), because the data of CEC was missing, and (ii) A modified CASH method. The SH indicators scoring approach followed the methodology of Mendes et al. (18), while the A modified CASH method, illustrated in Supplementary Figure 1, was based on methods described by Tesfahunegn (48), Congreves et al. (49), Shao et al. (50), Bandyopadhyay and Maiti (51), Huang et al. (52), Rezapour et al. (53), and Zhang et al. (54).
2.3.1 SHI scoring approach
The study evaluated a set of variables consisting of four continuous measurements, including the clay content (%), AS, BG, and SOM for the Conv, ICL and ICLF agrosystems. In addition to their absolute values, these indicators were scored by transforming the measured values into 0 to 1, using standardized scoring functions (SSFs) of three types: (1) “More is better” for positive slopes and with finites lower and upper thresholds limits, (e.g., SOC), (2) “Optimum” where a positive curve turns into a negative curve at a threshold value, it is a hill-shaped curve where there is one optimum point and values to the left and right of this point are less desirable, (e.g., pH), and (3) “Less is better” for negative slopes and with finites lower and upper thresholds limits (e.g., Al+3) (51, 55–58). A detailed description of the scoring approach is provided in Mendes et al. (18). The scoring algorithms account for soil texture (15).
2.3.1.1 Calculation of soil functions scores
The continuous variables also included scores for three soil functions: (F1) nutrient cycling, based on AS and BG activities; (F2) nutrient storage, based on SOM and CEC data; and (F3) nutrient supply, considering Ca2+, Mg2+, K+, P, pH, H+Al, Al3+, the sum of bases (SB), and base saturation (BS) (Supplementary Figure S2). Scores for each soil function (SF) also ranged from zero to one (with higher scores indicating better performance). Briefly, to compute the SF, scored indicators (as described in section 2.3) were assigned to each function with specific weights (Wi):
where, SIi are the indicator scores (ranging from 0 to 1) normalized through the standardized scoring functions (SSFs). A detailed description of the calculation of the function scores (SF) is provided by Mendes et al. (18) and Supplementary Table 1.
The SH condition, representing the categorical variable, was determined by combining scores assigned to functions F1 and F2 as shown in Table 1. The sensitivity of soil enzymes causes their activity levels to fluctuate rapidly, while SOM remains relatively stable in the short term (29). This dynamic allows the differentiation of the five SH conditions outlined in Table 1.
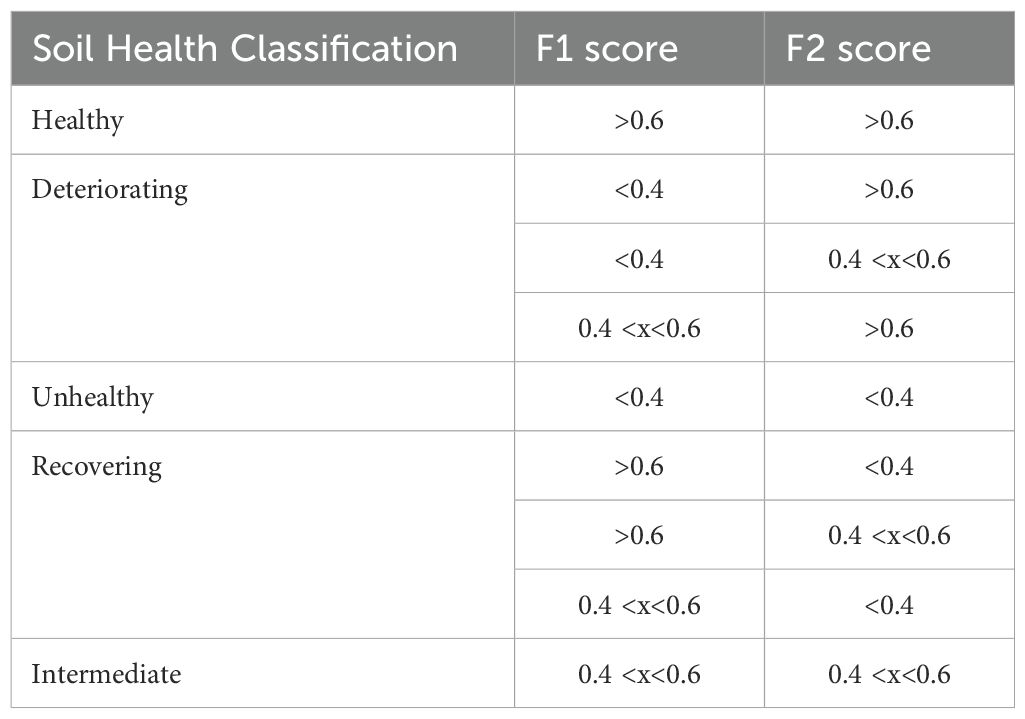
Table 1. Soil health classification based on F1 (nutrient cycling involving arylsulfatase enzyme - AS and β-glucosidase enzyme - BG activities); and F2 (nutrient storage involving SOM and CEC) scores Functions scores (FS) >0.6 are considered high, 0.4<x<0.6 moderate, and <0.4 low.
2.3.2 A modified CASH method
A modified Comprehensive Assessment of Soil Health scoring system developed for Florida soils (A modified CASH method) was used to assess the SHI (49). This scoring system comprises a sequence of steps (59, 60) as given in Supplementary Figure 1–the first step is to reduce the raw dataset to minimum dataset (i.e., a set containing key soil health indicators) using principal component analysis (see details in 59, 60), second one is assigning scores to each selected key soil health indicator using linear scoring, and non-linear scoring functions (see details in 59, 60), the third step is to calculate soil health index (SHI) using scores from linear and non-linear functions (see details in 59, 60), and the fourth step is to use value of SHI to classify soil health status by adopting Huang et al. (52)’s classification of soil health conditions: soil health is –very high (Grade I, SHI ≥ 0.85), high (Grade II, 0.85 ≥ SHI ≥ 0.7); medium (Grade III, 0.7 ≥ SHI ≥ 0.55), low (Grade IV, 0.55 ≥ SHI ≥ 0.4), and very low (Grade V, SHI < 0.4).
2.4 Statistical analyses
Both datasets (Brazil and USA) were statistically analyzed in the same way. The SOM EA, and nutrient contents data had a non-normal distribution and were analyzed using the aligned rank transformation (ART) for non-parametric two-way ANOVA (P < 0.05). Systems and year were considered as fixed factors and the treatments means were compared by contrast using the ART-C procedure with a Bonferroni adjustment (P < 0.05). The ART-C is a robust statistical procedure, recommended for nonconforming data, and has higher power than other tests such as the t-test and Wilcoxon (61). The data was scaled and subjected to principal component analysis (PCA) to explain the variance and correlation between the variables of each year. Statistical analyses were conducted in R software, version 4.4.1 (62), using the ARTool R package (63) for non-parametric analysis and ggbiplot (64) for PCA analysis, and the graphics were plotted in Sigmaplot, version 12.5 (65).
Principal component analysis was used trying to summarize all the variables into two main components, represented by PC1 (x-axis) and PC2 (y-axis). Each axis shows how much variation (difference) in the data they capture. PC1 captures the most variation, and PC2 captures the second most. The percentage values on the axes tell how much of the total variation each PC explains. Each point (dot) represents an observation such as soil sample or land use system. If a point is close to an arrow, it means that variable has a strong effect on that observation. Points near the same arrow are similar, while those far apart are different. Clusters of points indicate that those samples share similar characteristics. Separate clusters suggest differences between groups. If a system (e.g., ICL) clusters near arrows like β-glucosidase, Zn, and P, this indicates that ICL is associated with those variables. Arrows represent the variables and point in the direction of the variables they represent (e.g., nutrients, enzymes). Variables pointing in the same direction are positively correlated and variable pointing in opposite direction are negatively correlated. Closer arrows indicate higher correlation among variables too. Longer arrows parallel to PC axis indicate stronger influence of the variable. These variables contribute more to the variance explained by that PC axis. Shorter arrows and not parallel to PC axis indicate weaker influence, meaning these variables have less effect on that PC axis. Changes in the direction or length of arrows and groupings across different years are to identify trends. Shifts in variables’ spatial distribution across years may indicate changes in soil properties due to environmental conditions or management practices.
3 Results
3.1 Medium-term agrosystems: Cerrado of Bahia, Brazil
The soil of the agrosystems in Brazil is sandy and it’s possible to observe the low levels of OM (less than 1.2%) (Figures 1A, B). The interaction of the factors system and years was not significant (P < 0.05). The Cer and ICL system had higher OM content than Conventional and ICLF systems, in which the contents were 1.15, 1.16, 0.76, and 0.72 dag kg-1, respectively (Figure 1A). The OM content was higher in 2023 than in 2019, corresponding to 1.05 dag kg-1 compared to 0.86 dag kg-1 (Figure 1B).
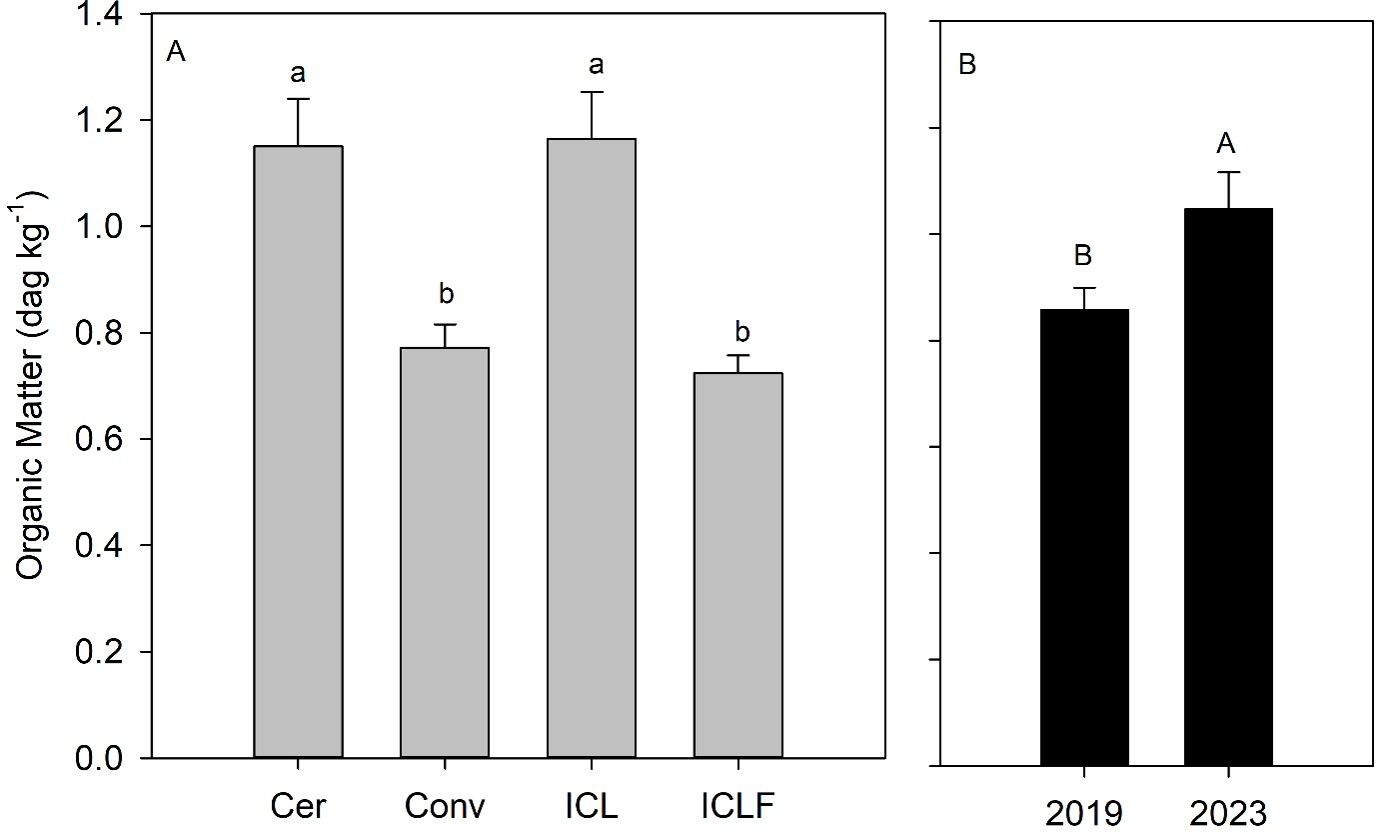
Figure 1. Soil organic matter in the soil in different agrosystems (A) Cerrado (Cer), Conventional (Conv), integrated crop-livestock (ICL), and integrated crop-livestock-forestry (ICLF), and years (B) 2019 and 2023. Lowercase letters compare systems, and uppercase letters compare years by contrast using the ART-C procedure with a Bonferroni adjustment (P < 0.05).
In general, the activities of AS and BG enzymes were higher in the year 2023 compared to 2019 in all systems, except the BG in the Cer and Conv system (Figures 2A, B). In the 2019, the activity of AS enzyme in Cer and ICL were 9.3, 9.2 mg p-nitrophenol kg-1 SOC h-1, respectively, which were higher than Conv and ICLF systems (Figure 2A). The activity of the BG enzyme was markedly higher in the ICL and ICLF systems compared to the Cer and Conv systems, with mean values of 61.0, 50.5, 22.5, and 24.9 mg p-nitrophenol kg-¹ SOC h-¹, respectively (Figure 2B).
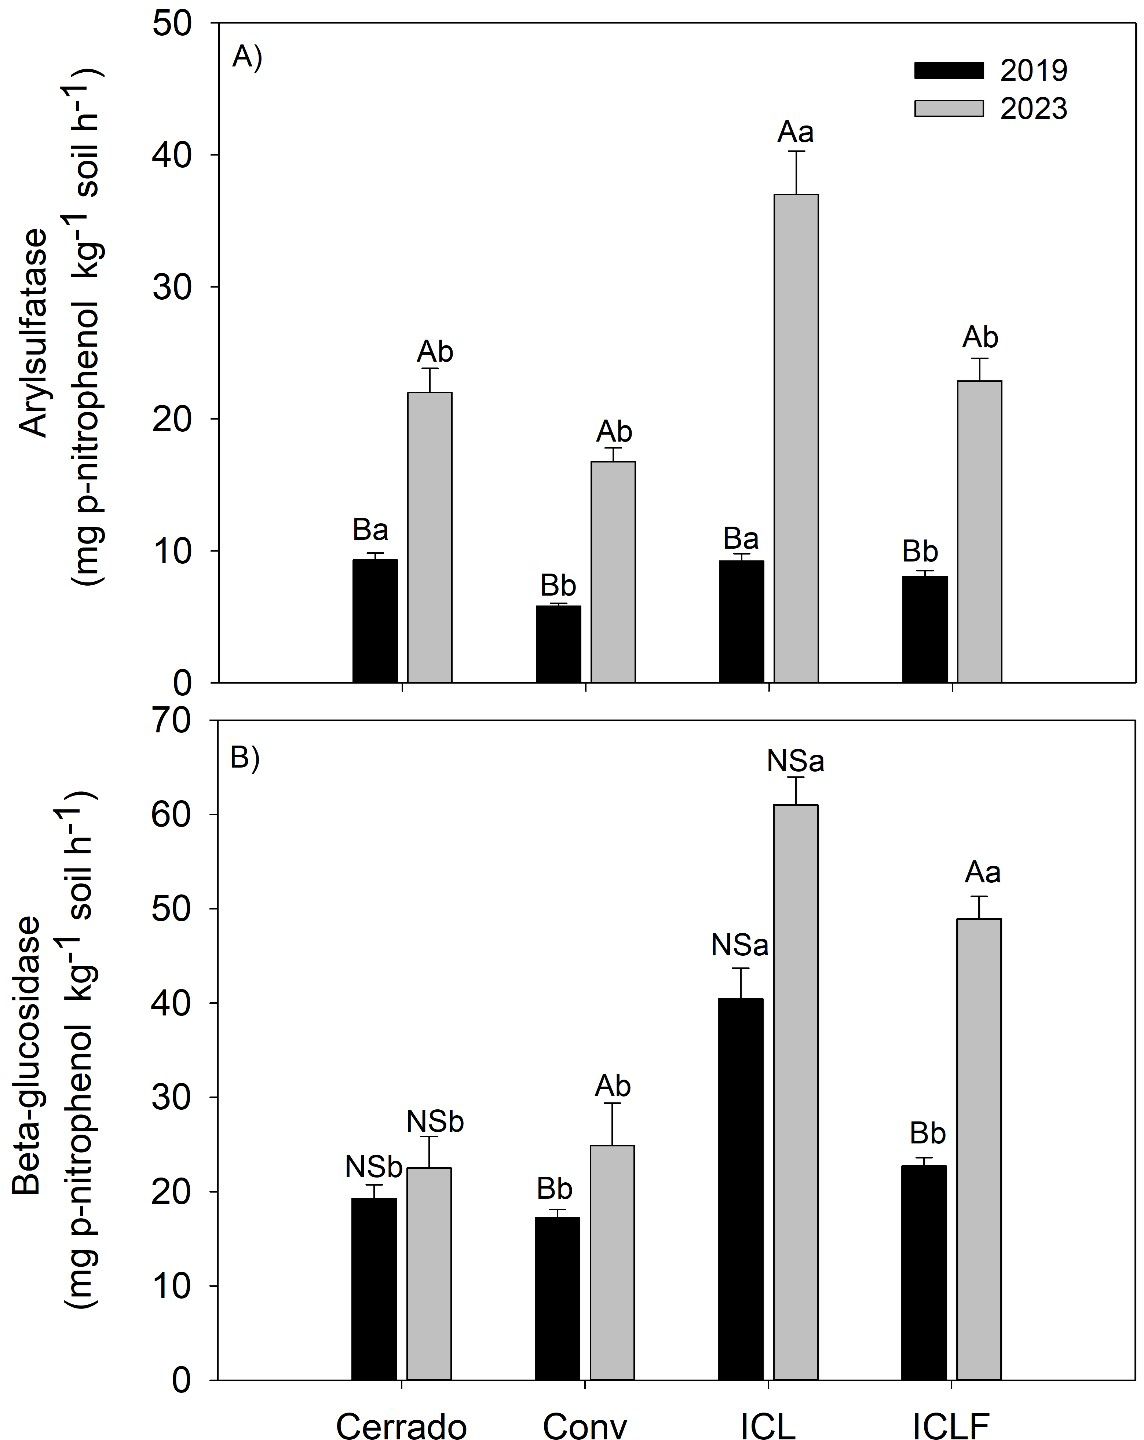
Figure 2. Activity of arylsulfatase (A) and beta-glucosidase (B) enzyme in the soil in different agrosystems: Cerrado, Conventional (Conv), integrated crop-livestock (ICL), and integrated crop-livestock-forestry (ICLF), and years: 2019 and 2023. Lowercase letters compare agrosystems in each year and uppercase letters compare years in each agrosystem by contrast using the ART-C procedure with a Bonferroni adjustment (P < 0.05). NS, no significant.
In 2023, the activity of the AS enzyme was significantly higher in the ICL system, nearly doubling the values observed in other systems, with an average of 37.0 mg p-nitrophenol kg-¹ SOC h-¹ compared to 22.0 in Cer, 16.7 in Conv, and 22.9 mg p-nitrophenol kg-¹ SOC h-¹ in ICLF (Figure 2A). The activity of BG enzyme was higher in ICL and ICLF systems compared to Cer and Conv, corresponding to a mean of 61.0, 50.5, 22.5, 24.9 mg p-nitrophenol kg-1 SOC h-1, respectively (Figure 2B).
Based on correlation analysis among variables, 2019 dataset showed that OM had a positive correlation with CEC (r = 0.60), AS (r = 0.28), BG (r = 0.22), K (r = 0.27), and Zn (r = 0.34), with a weaker correlation observed for Mn (r = 0.06) (Figure 3). Arylsulfatase activity was positively correlated with BG, OM, K, Ca, S, Mn, and Zn. Beta-glucosidase showed significant positive correlations with most soil properties, except for Cu (non-significant), and had negative correlations with S (r = -0.52), Fe (r = -0.53), and clay (r = -0.20). Additional correlations among soil fertility properties are displayed in Figure 3.
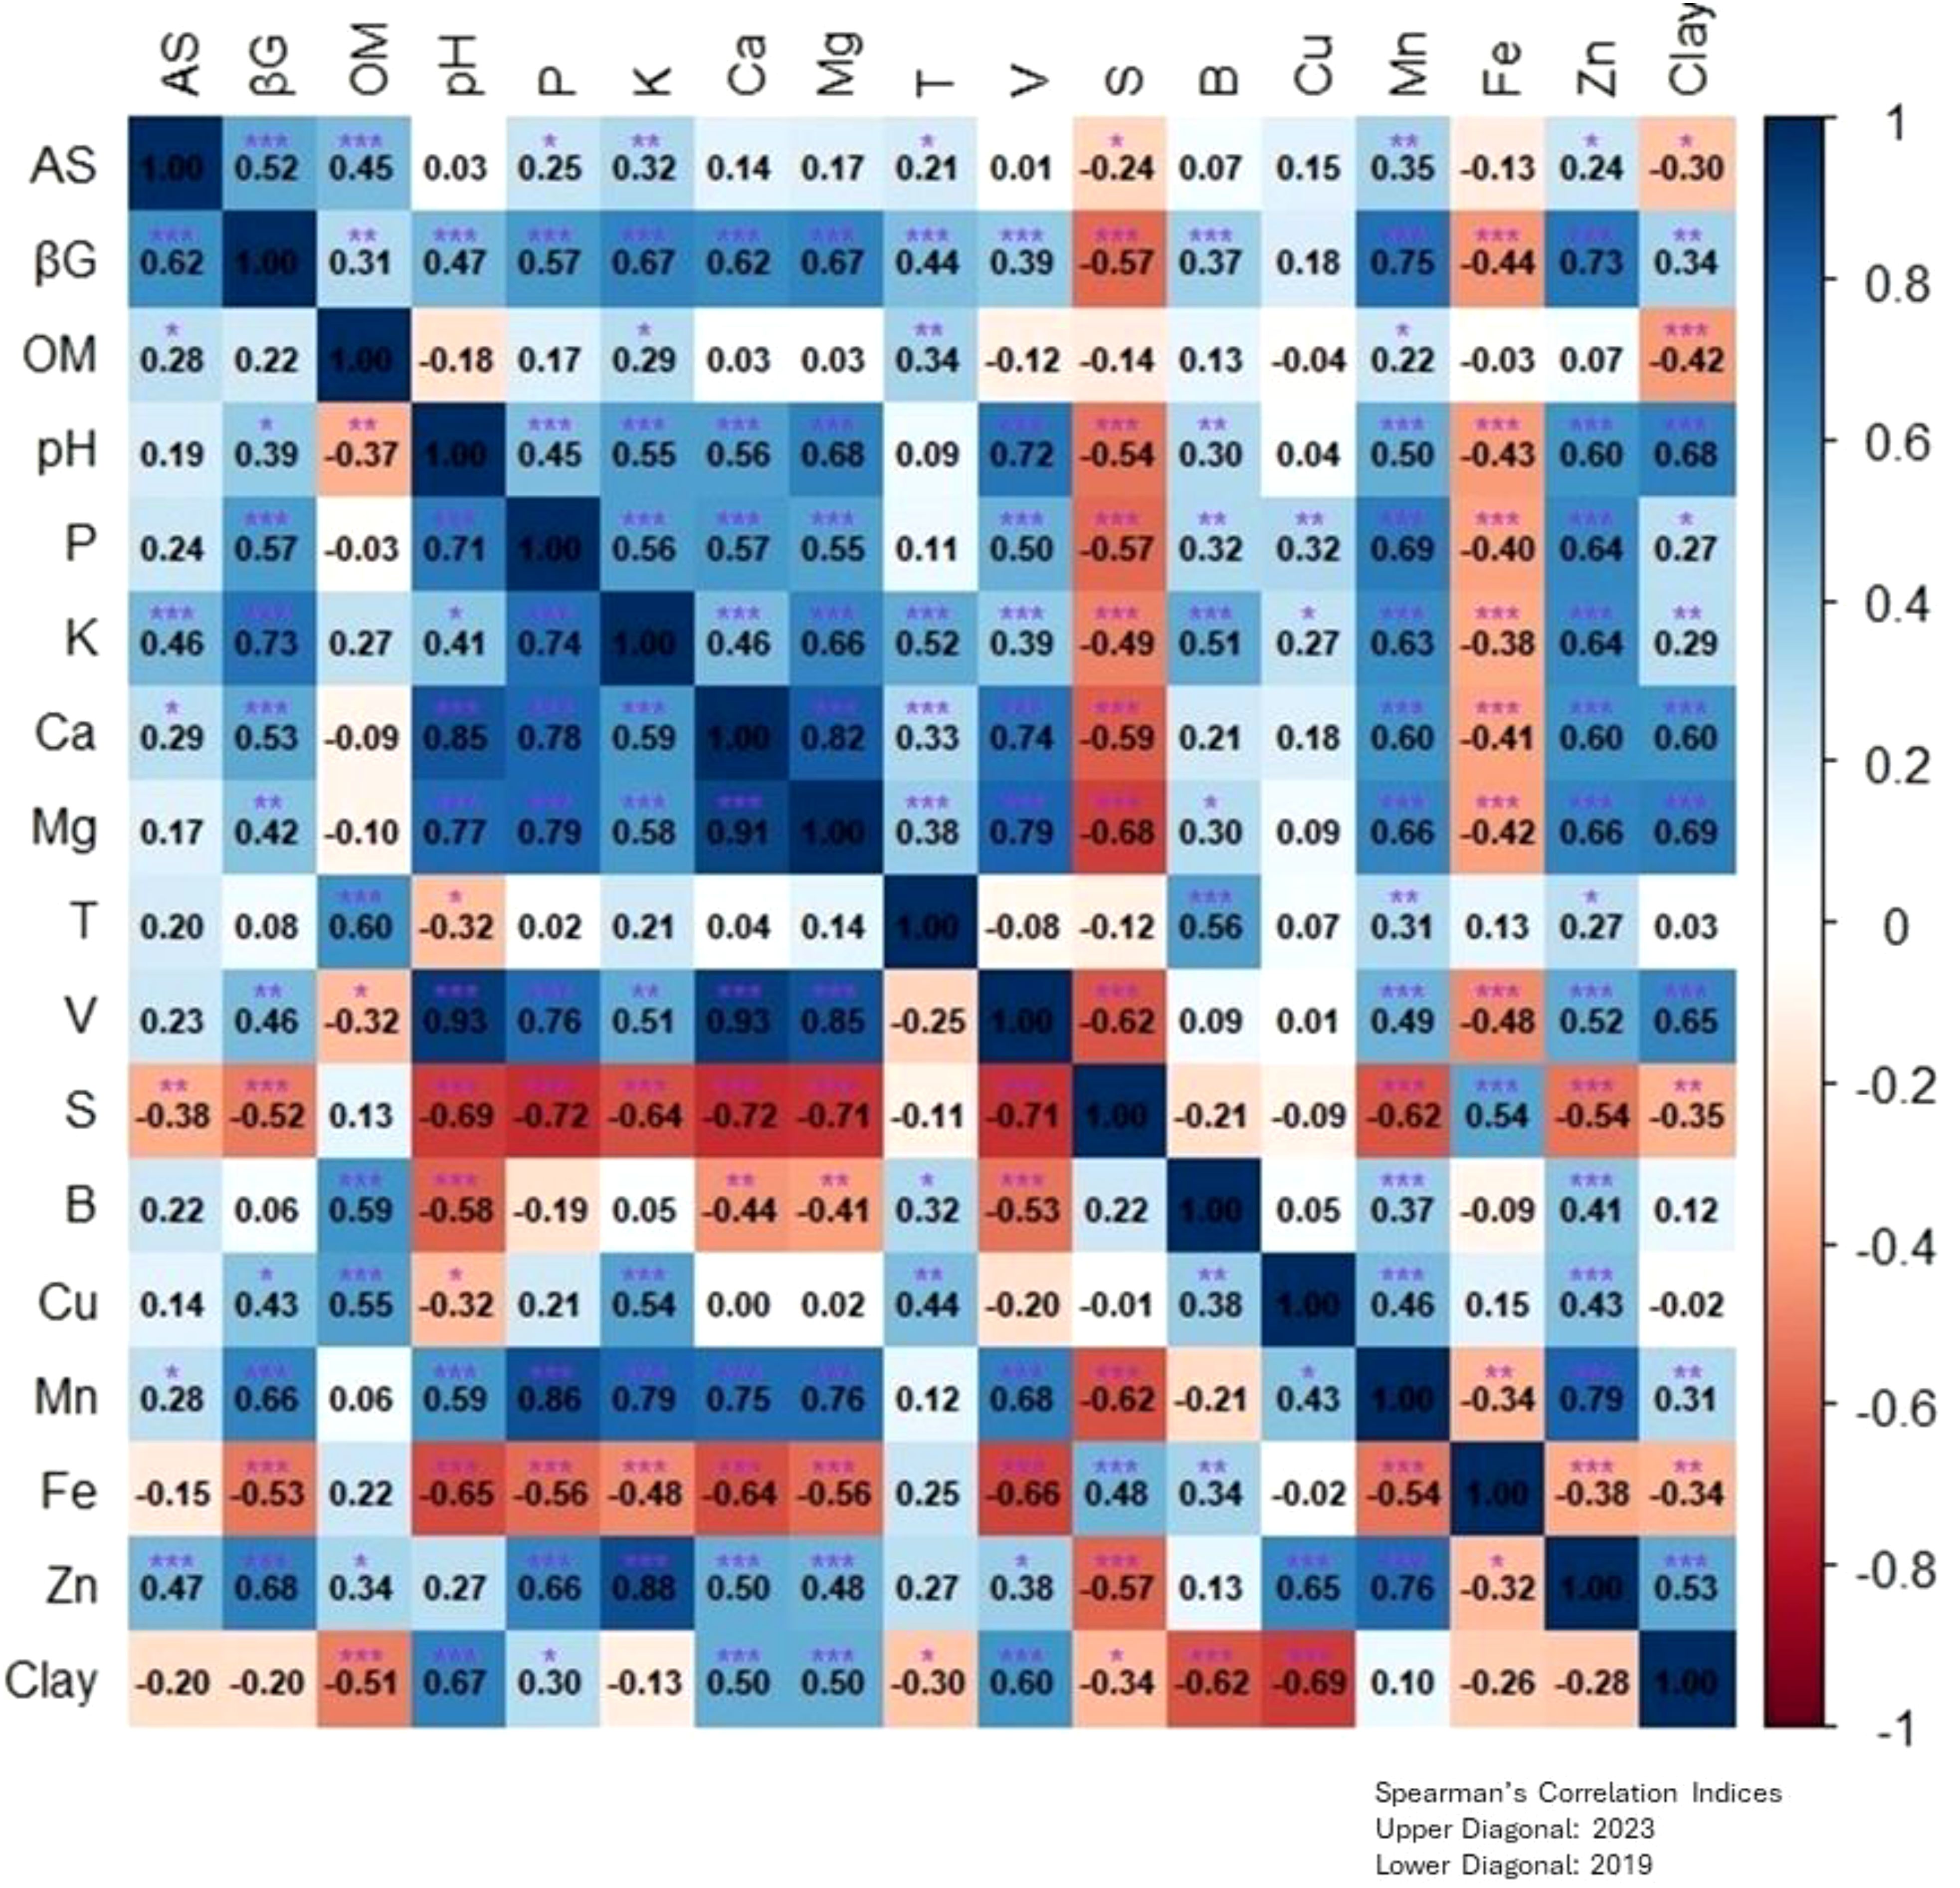
Figure 3. Correlation heatmaps showing the relationships between parameters under different agrosystems and years (2019- Lower diagonal and 2023 Upper diagonal). The values represent Spearman correlation coefficients between pairs of parameters, with significance levels indicated by stars: *** for P < 0.001, ** for P < 0.01, and * for P < 0.05.
In the 2023 data, OM showed a positive correlation with CEC (r = 0.34), AS (r = 0.45), and K (r = 0.29), with a weaker correlation with B (Figure 3). Arylsulfatase activity was positively correlated with BG, OM, P, K, Mn, and Zn. Beta-glucosidase showed significant positive correlations with most soil properties, except for OM, CEC, B, and clay, and it had negative correlations with S (r = -0.57) and Fe (r = -0.44). Additional correlations among soil fertility properties are shown in Figure 3.
The PCA analysis for 2019 and 2023 revealed distinct groupings of soil properties across different land use systems, indicating key differences and associations. The correlations between OM and EA in the most sustainable systems, such as ICL and ICLF, are evident. (Figure 4).
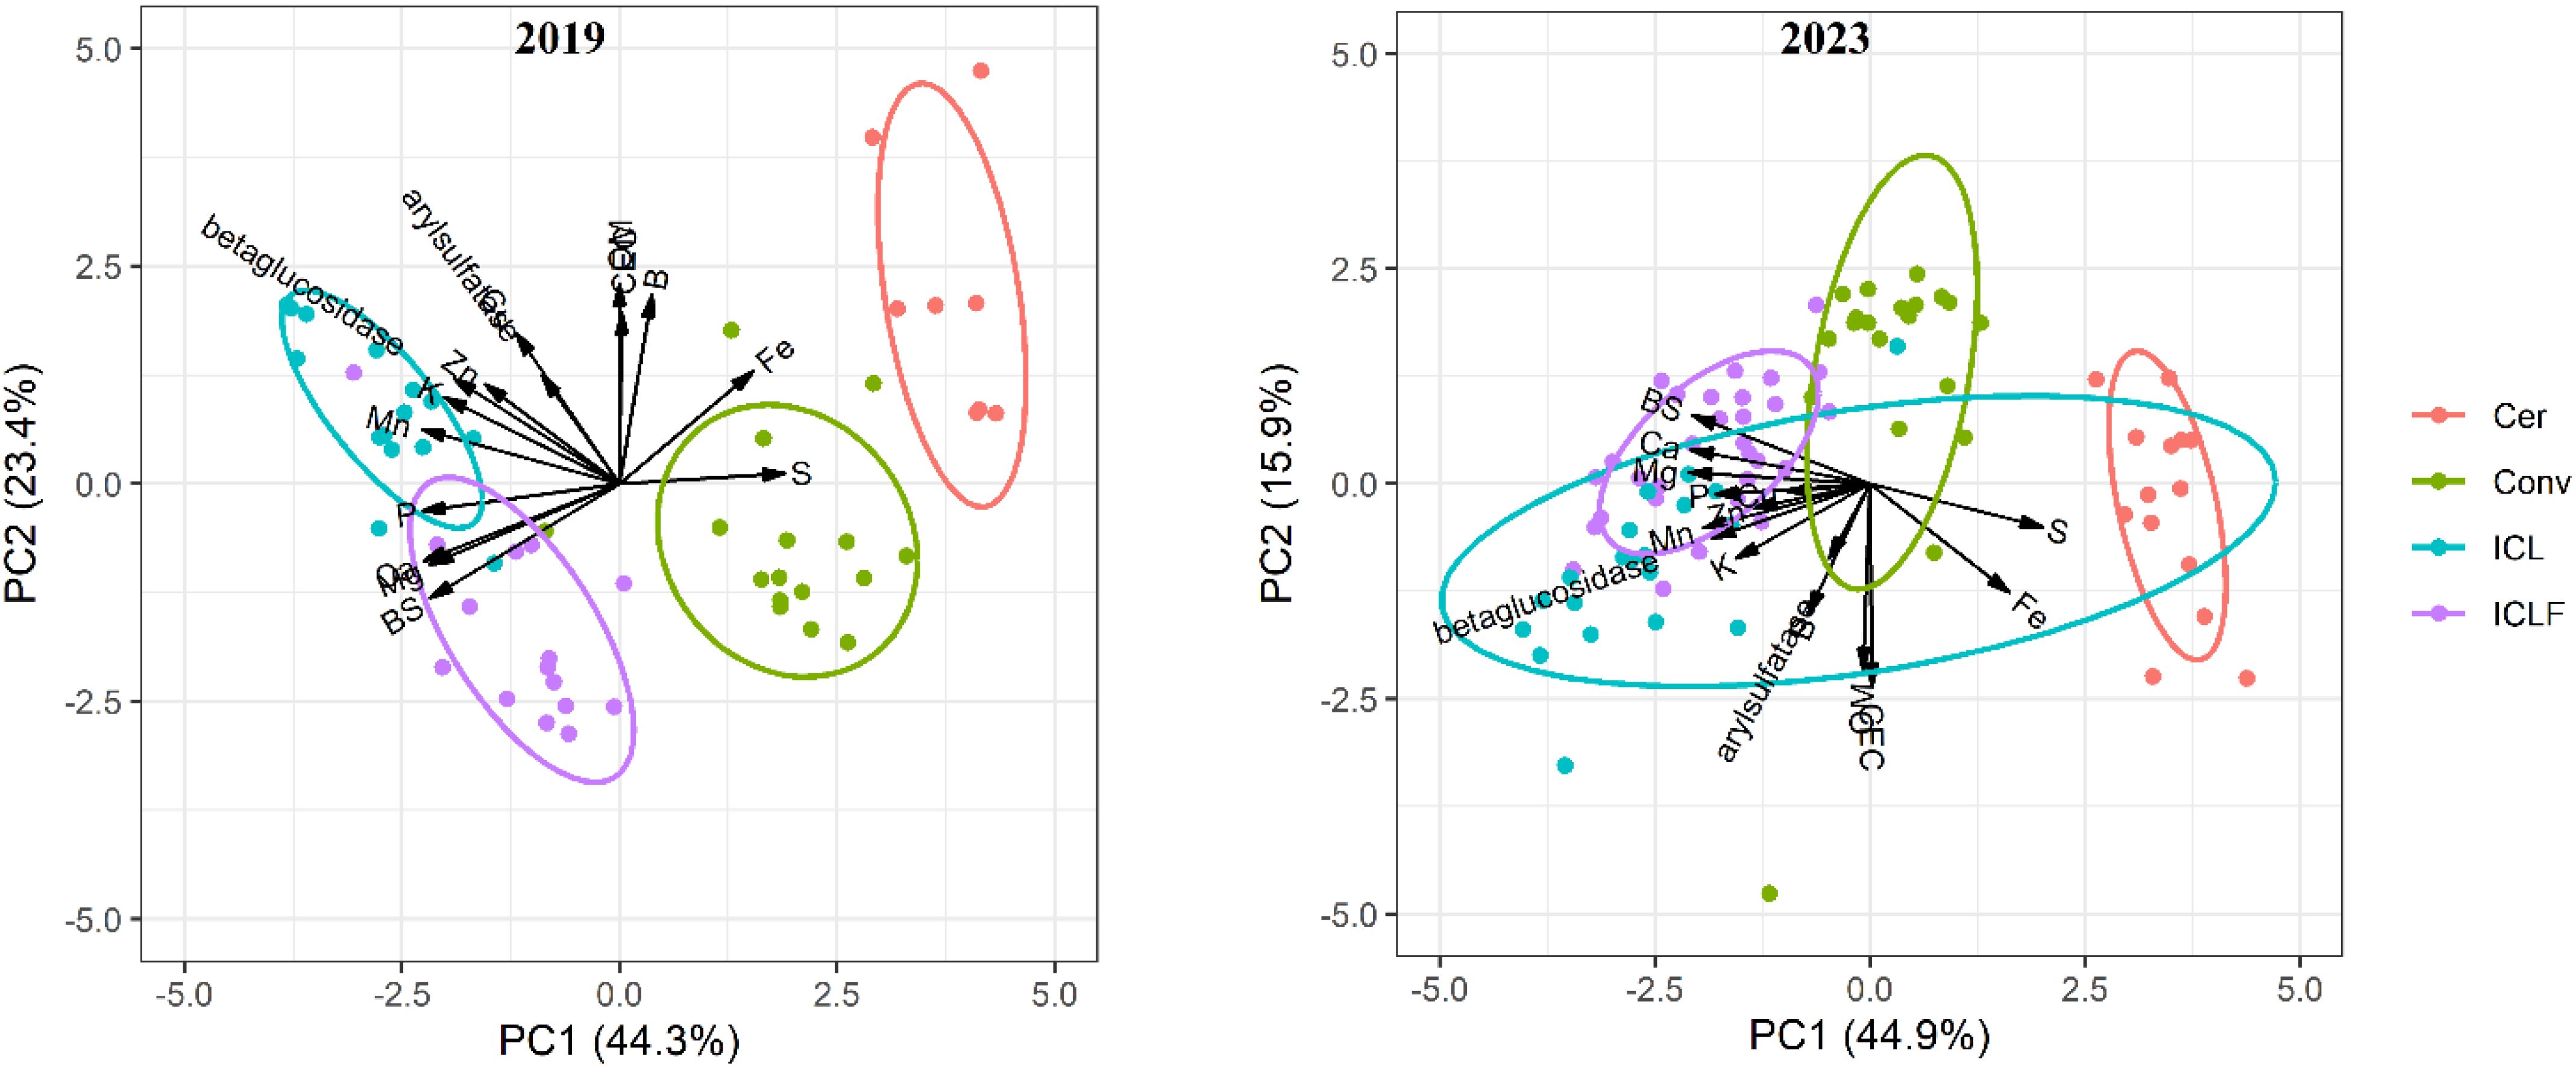
Figure 4. Principal components analysis of soil fertility properties in different agrosystems: Cerrado (Cer), Conventional (Conv), integrated crop-livestock (ICL), and integrated crop-livestock-forestry (ICLF).
In the PCA analysis of 2019 data, the two main components (PC1 and PC2) explained 67.7% of the total variance (Figure 4). The variables that had more contribution to PC1 were Mn, P, Ca, Mg, S and BS; while PC2 was mainly influenced by OM, CEC, Cu, B, and AS. The OM had a positive correlation with CEC; the AS had positive correlation with Cu; BG enzyme with Zn, and K, and Ca with Mg. System-specific associations showed that Cer was positioned on the far right of PC1, demonstrating a positive association with Fe, and S. The Conv system was relatively central, with a strong association with S and some association with Fe. Integrated crop-livestock was associated with β-glucosidase, Zn, Mn, P, Ca, and Mg, while ICLF was closely linked to Ca, Mg, BS, and P.
In the PCA analysis of the 2023 data, the two main components (PC1 and PC2) explained 60.8% of the total variance (Figure 4). The variables contributing most to PC1 were Ca, Mg, Ca, BS, S, and Mn; while PC2 was mainly influenced by OM, CEC, B, and AS. Positive correlations observed in 2023 included OM and CEC, β-glucosidase with Mn and Zn, and AS with B. For system-specific associations, Cer was again positioned on the far right of PC1, with positive associations to S and Fe. The Conv system remained relatively central with less noticeable associations. Integrated crop-livestock was associated with multiple variables, reflecting its integration of various soil properties, while ICLF maintained close links to P, Ca, Mg, Mn, and BS.
The SHI scoring approach in 2019 shows that the soil condition of Conv agrosystem was unhealthy to recovering condition, the ICL was between deteriorating, intermediate, and recovering condition, and the ICLF was unhealthy (Figure 5). In 2023, the Conv was in the deteriorating condition, the ICL have changed to deteriorating and healthy condition and the ICLF have changed from unhealthy to deteriorating (Figure 6).
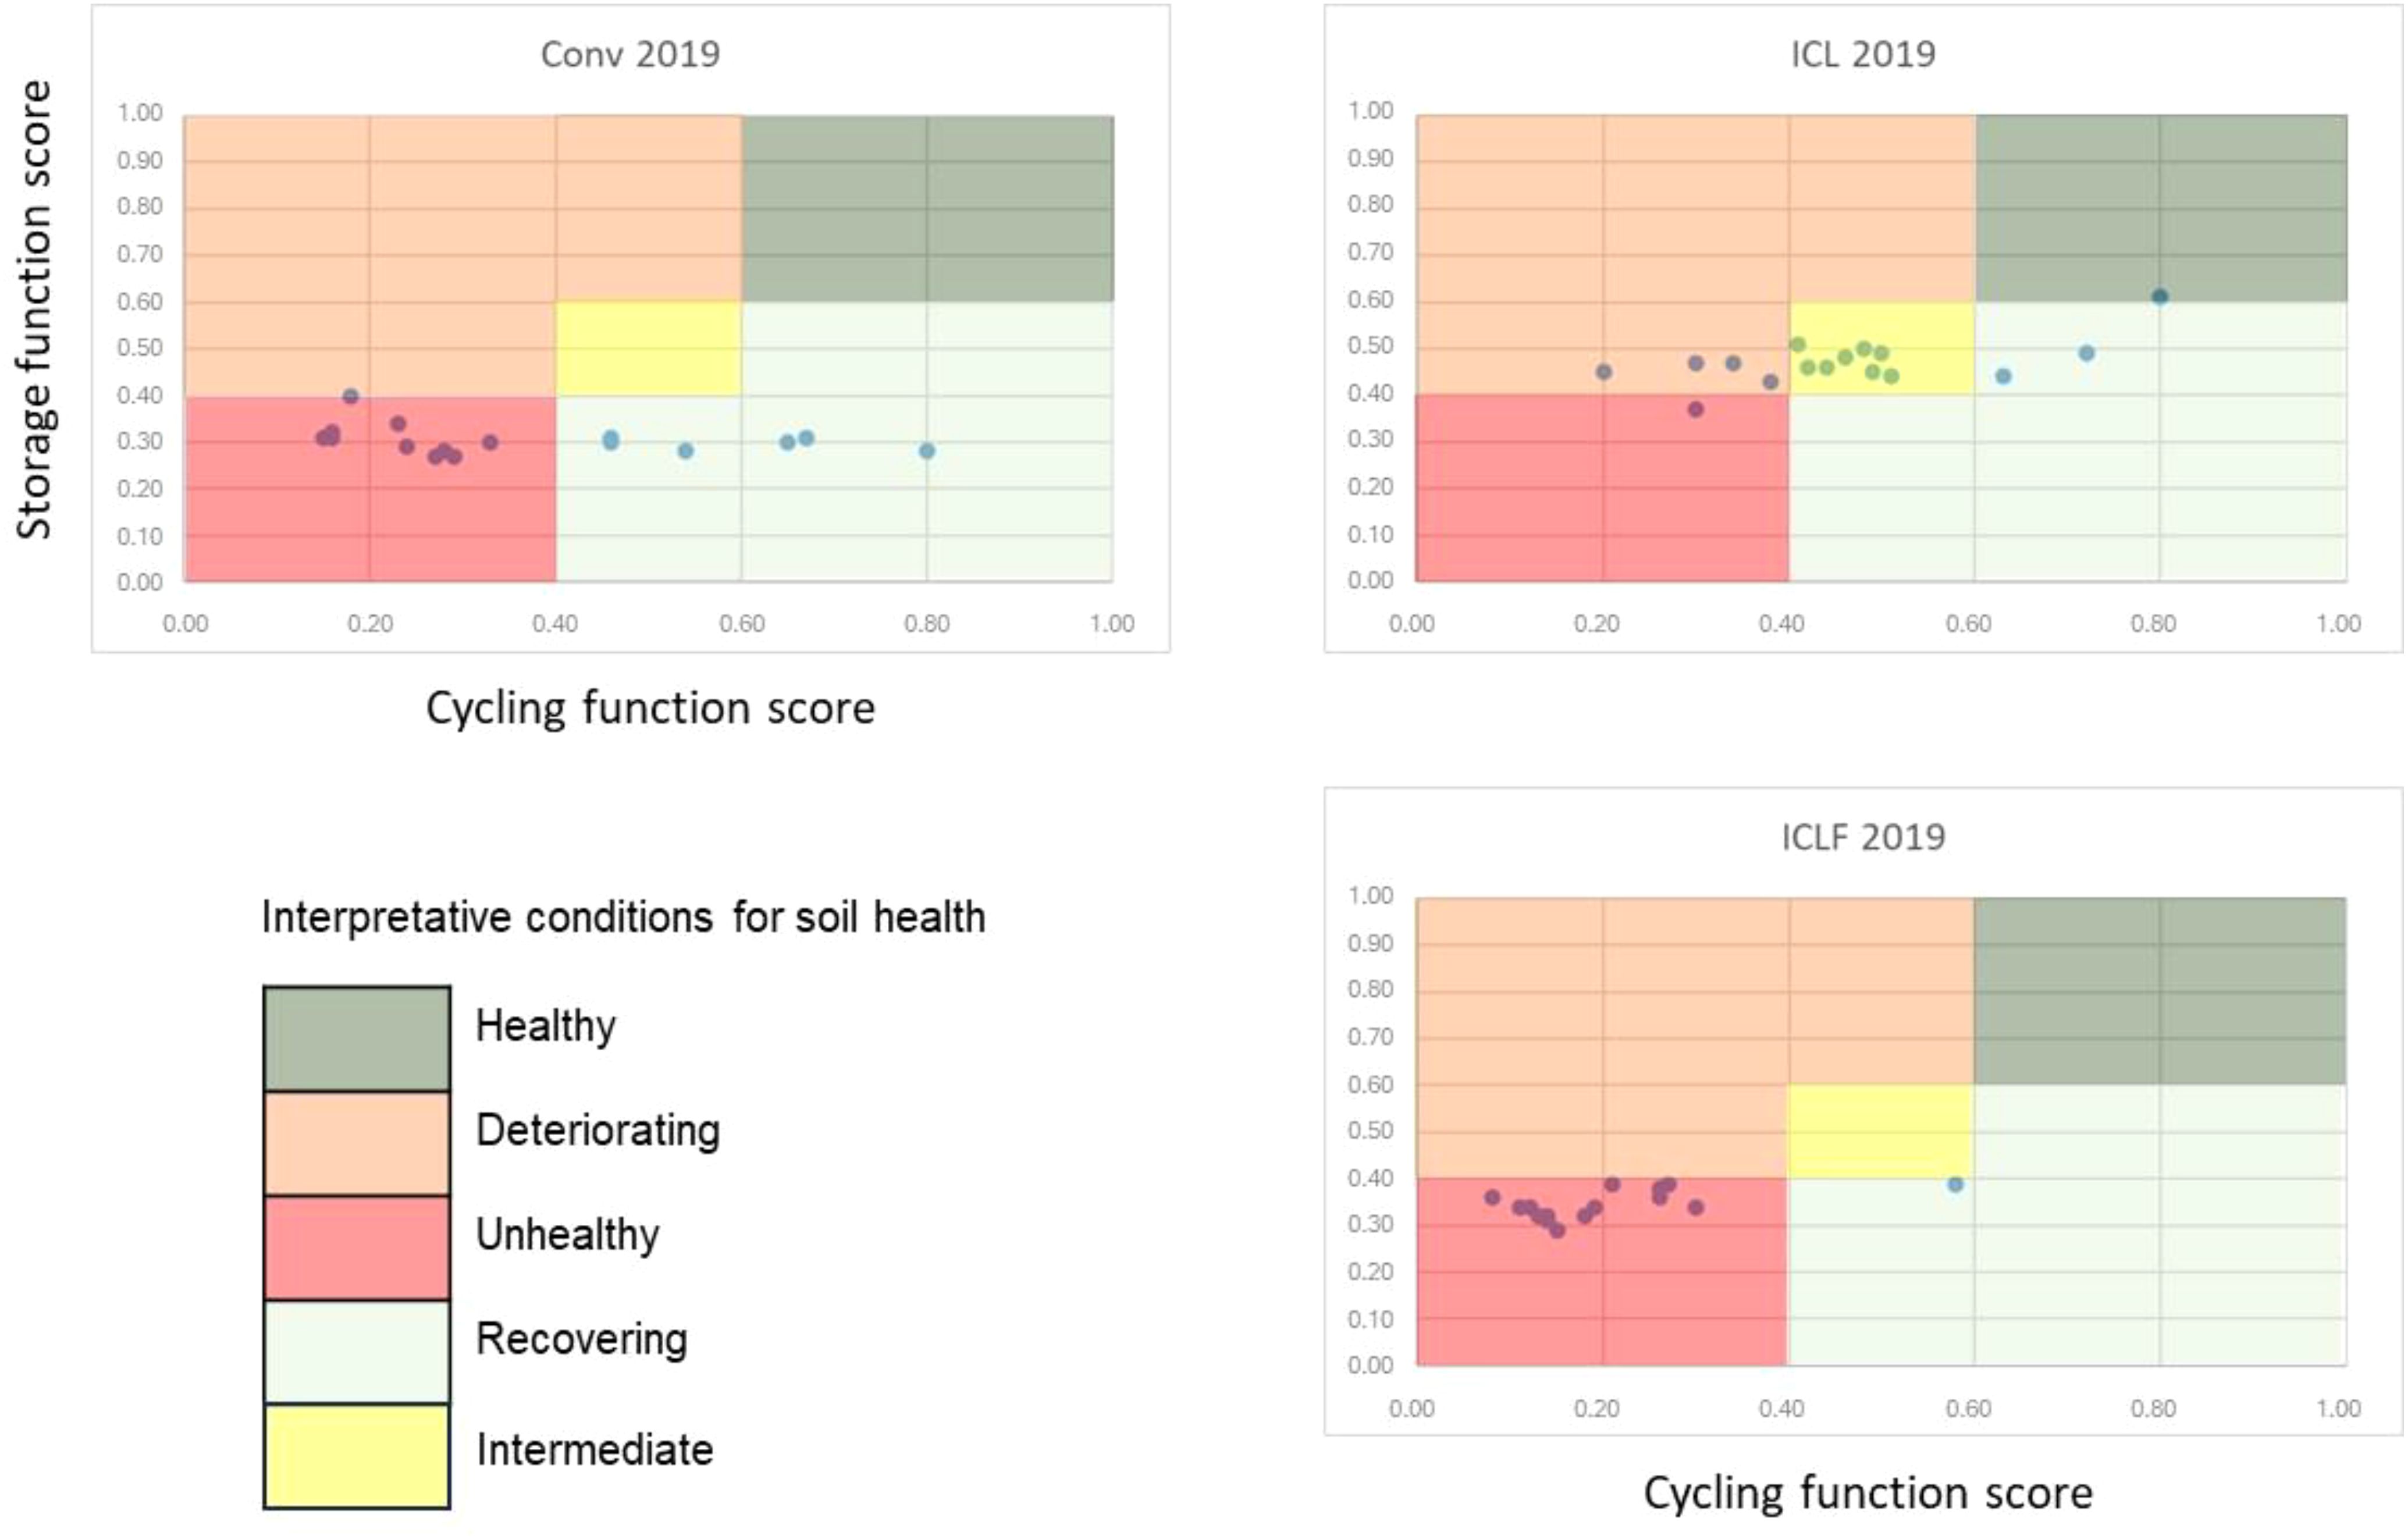
Figure 5. SHI scoring approach considering the agrosystems in the year of 2019. Conv, Conventional; ICL, Integrated Crop-Livestock; and ICLF, Integrated Crop-Livestock-Forestry.
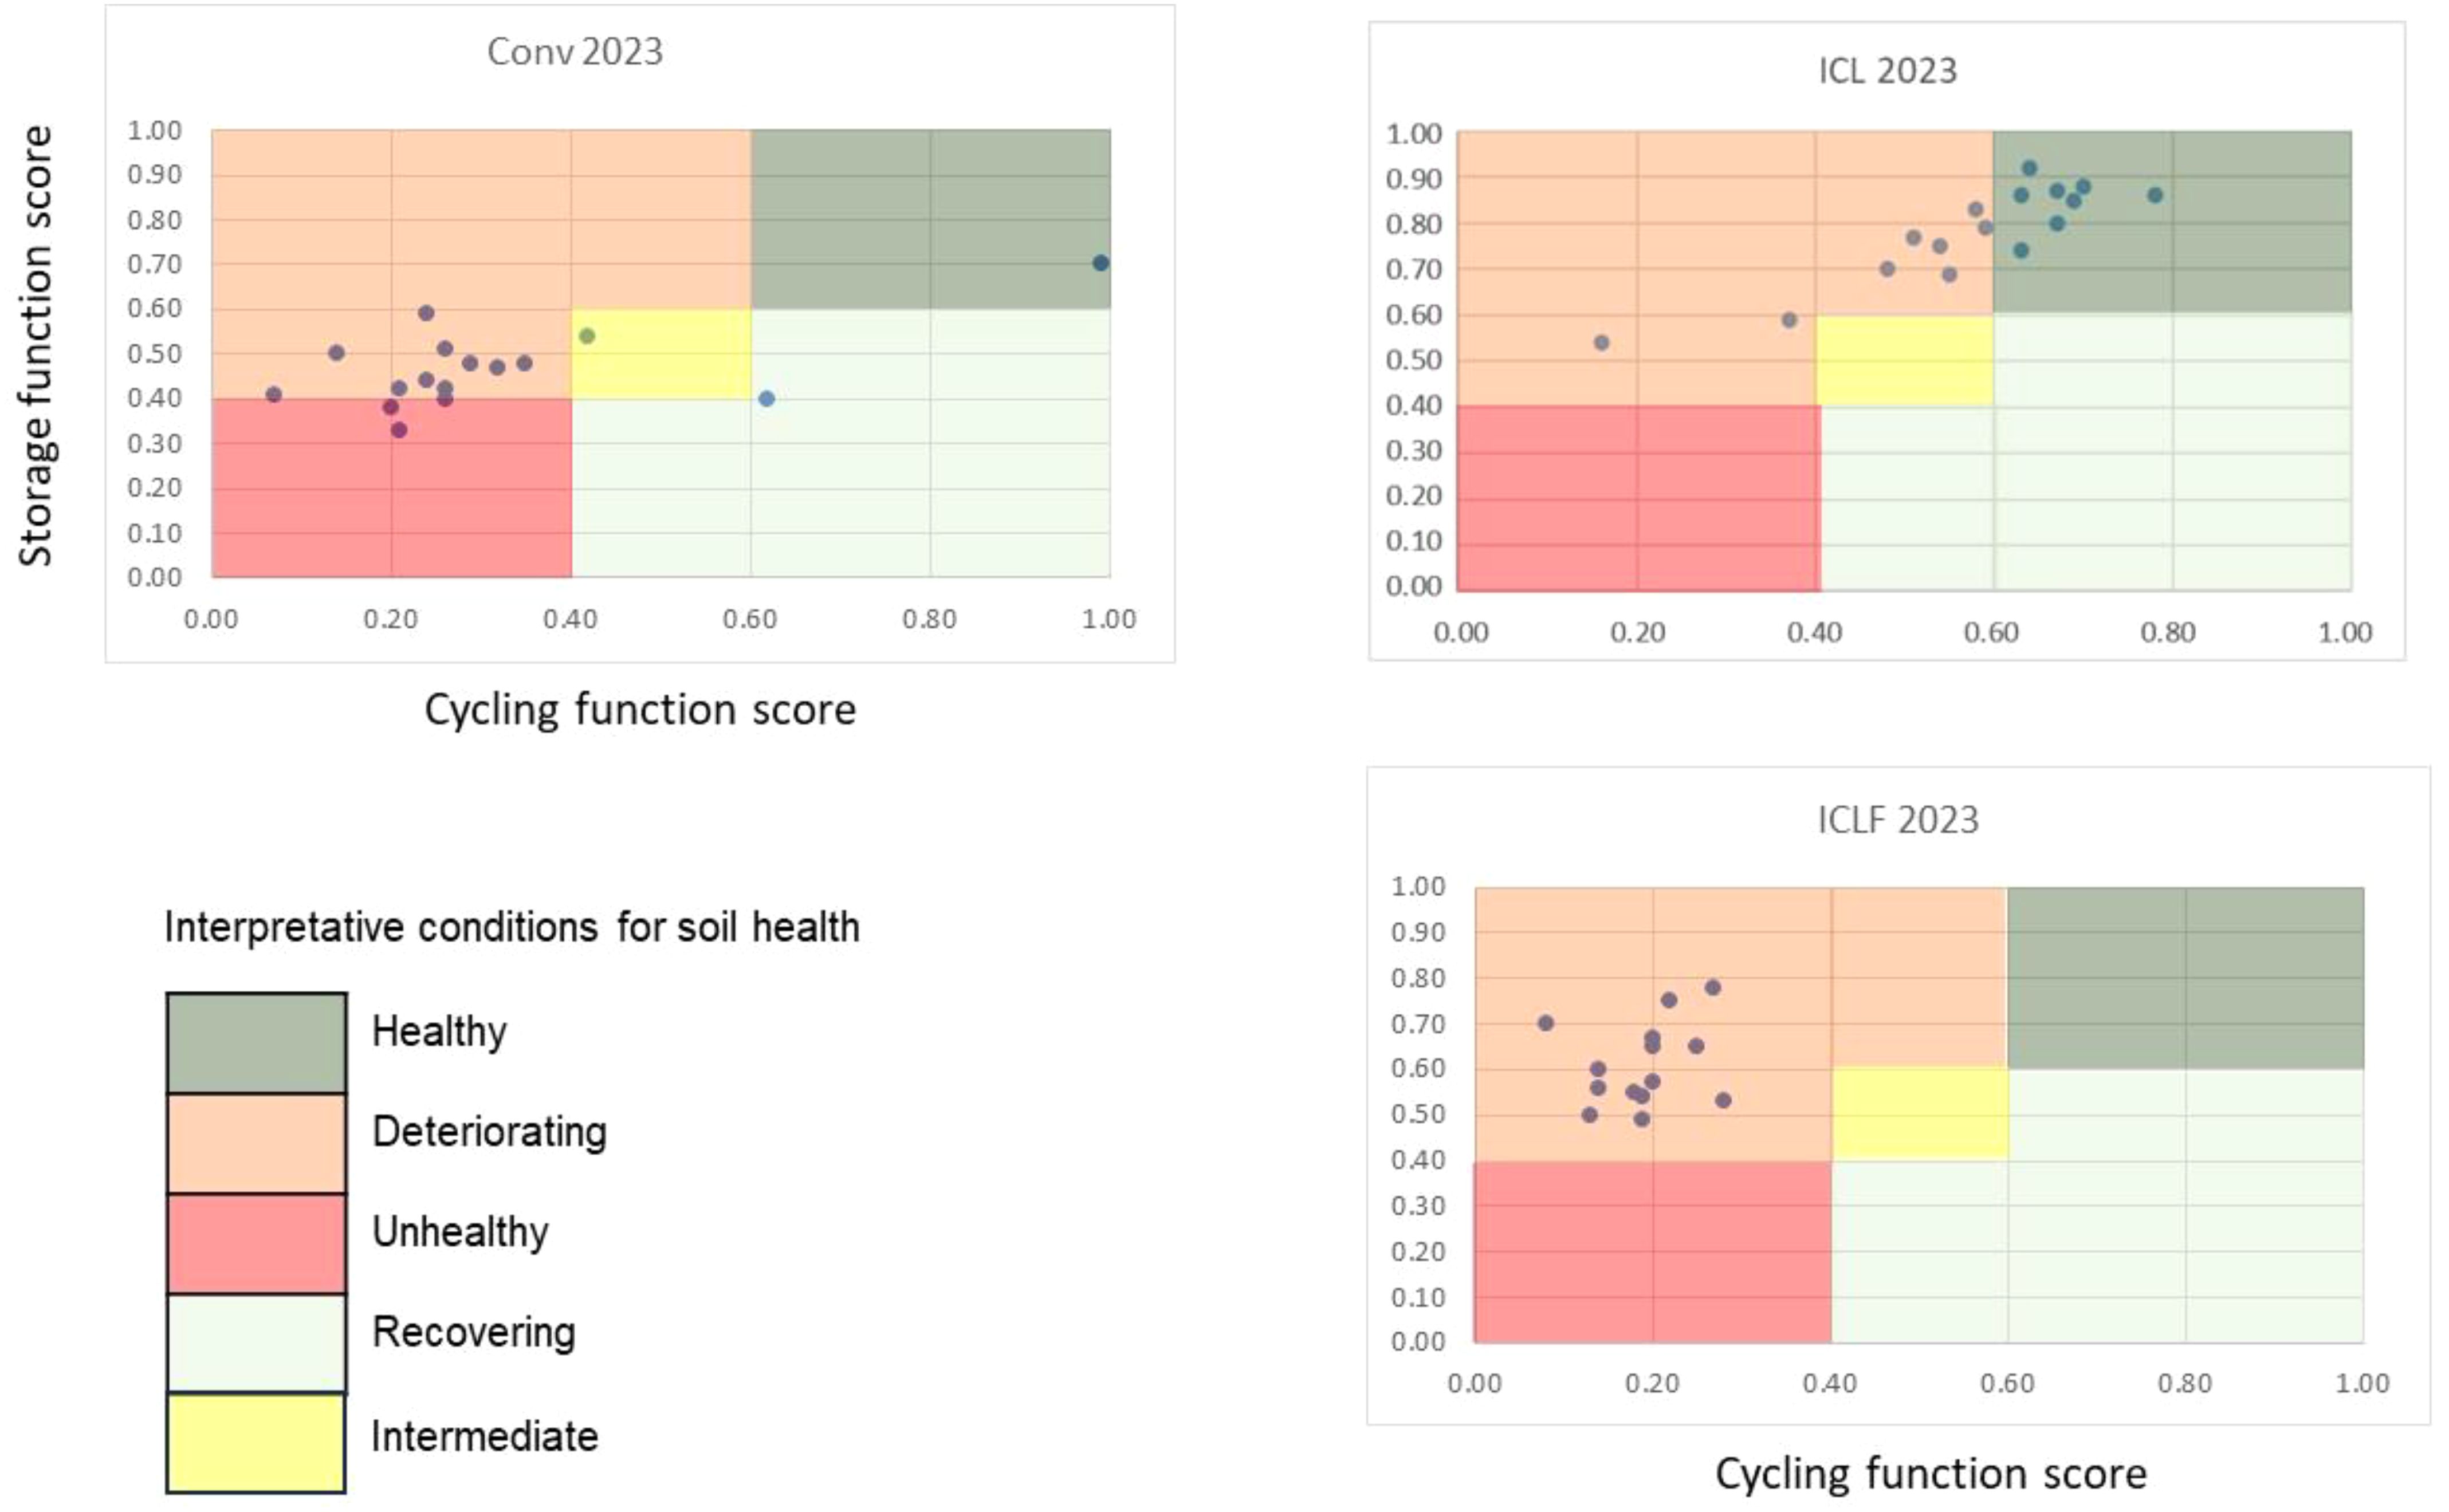
Figure 6. SHI scoring approach considering the agrosystems in the year of 2023. Conv, Conventional; ICL, Integrated Crop-Livestock; and ICLF, Integrated Crop-Livestock-Forestry.
The CASH model indicates a medium SH for Cer in the year of 2019 and high in 2023. The Conv system presented low SH condition in 2019’s year and medium in 2023. The ICL showed medium SH condition in the two years, and ICLF changed of low SH condition in 2019 to high SH condition in 2023 (Table 2).
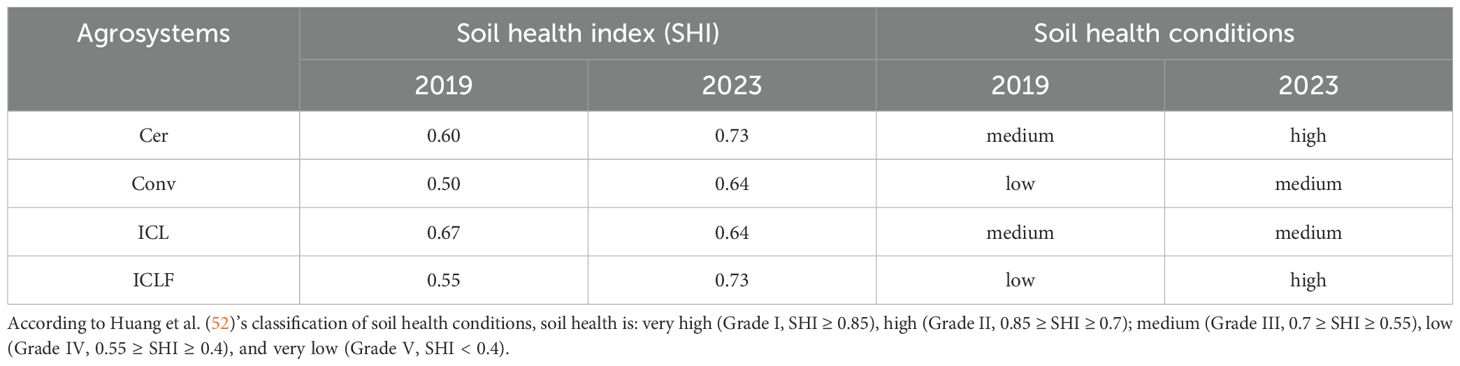
Table 2. A modified CASH method and changes in soil health conditions considering the agrosystems in Brazil.
3.2 Short-term seasonal cover cropping systems: South Florida, United States
In most cases, short-term seasonal cover cropping systems that included both double and mixed cover cropping showed a significant decrease in SOM during the post-harvesting period (P < 0.01; Figure 7). In the second year of the study, the MCCS exhibited a numerical increase in OM content, although this change was not statistically significant. However, both enzyme assays, AS and BG, showed no significant changes in mineral soils due to short-term seasonal cover cropping (P < 0.01; Figure 8). An exception was noted in the DCCS, where AS increased during the first year of the study (2022) but remained unchanged in the second year (2023).
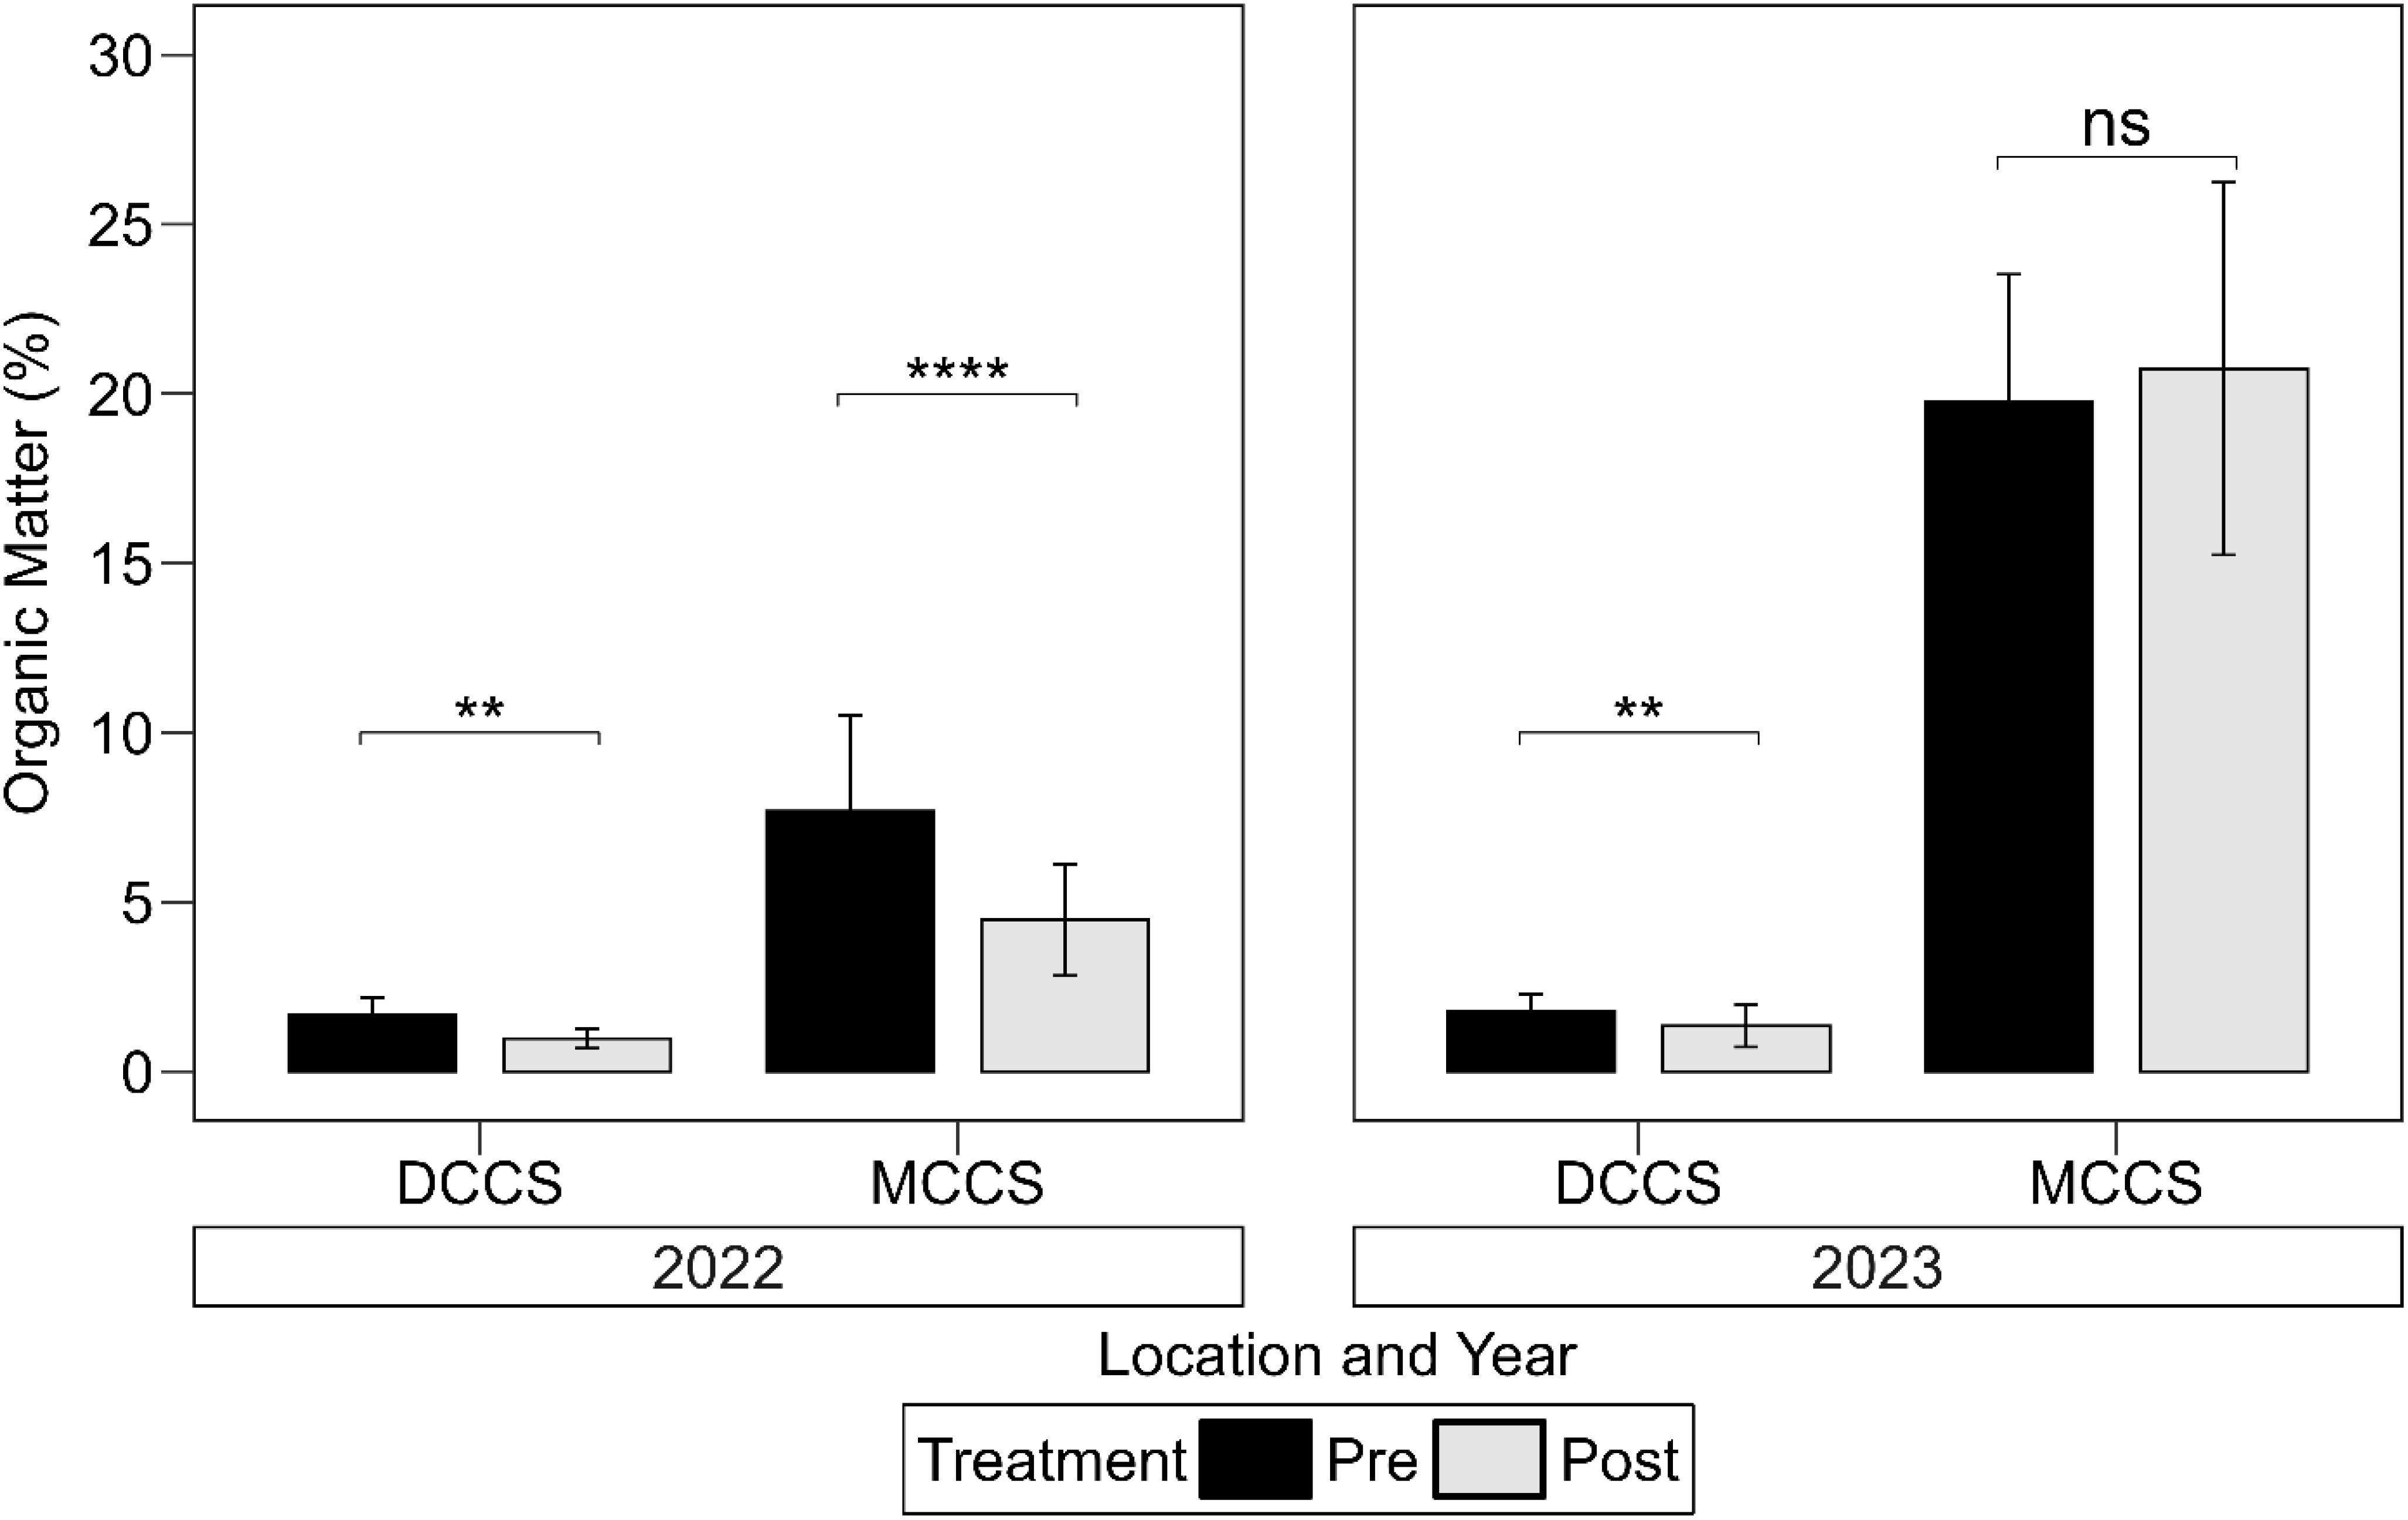
Figure 7. Percentage of soil organic matter during pre-planting and post-harvesting periods in 2022 and 2023 for two cover cropping systems: DCCS (double cover cropping systems) and MCCS (multiple cover cropping systems), Southern Florida, USA. Significance levels are indicated as ** and **** for P values < 0.01 and 0.0001, respectively, while “ns” denotes not significant.
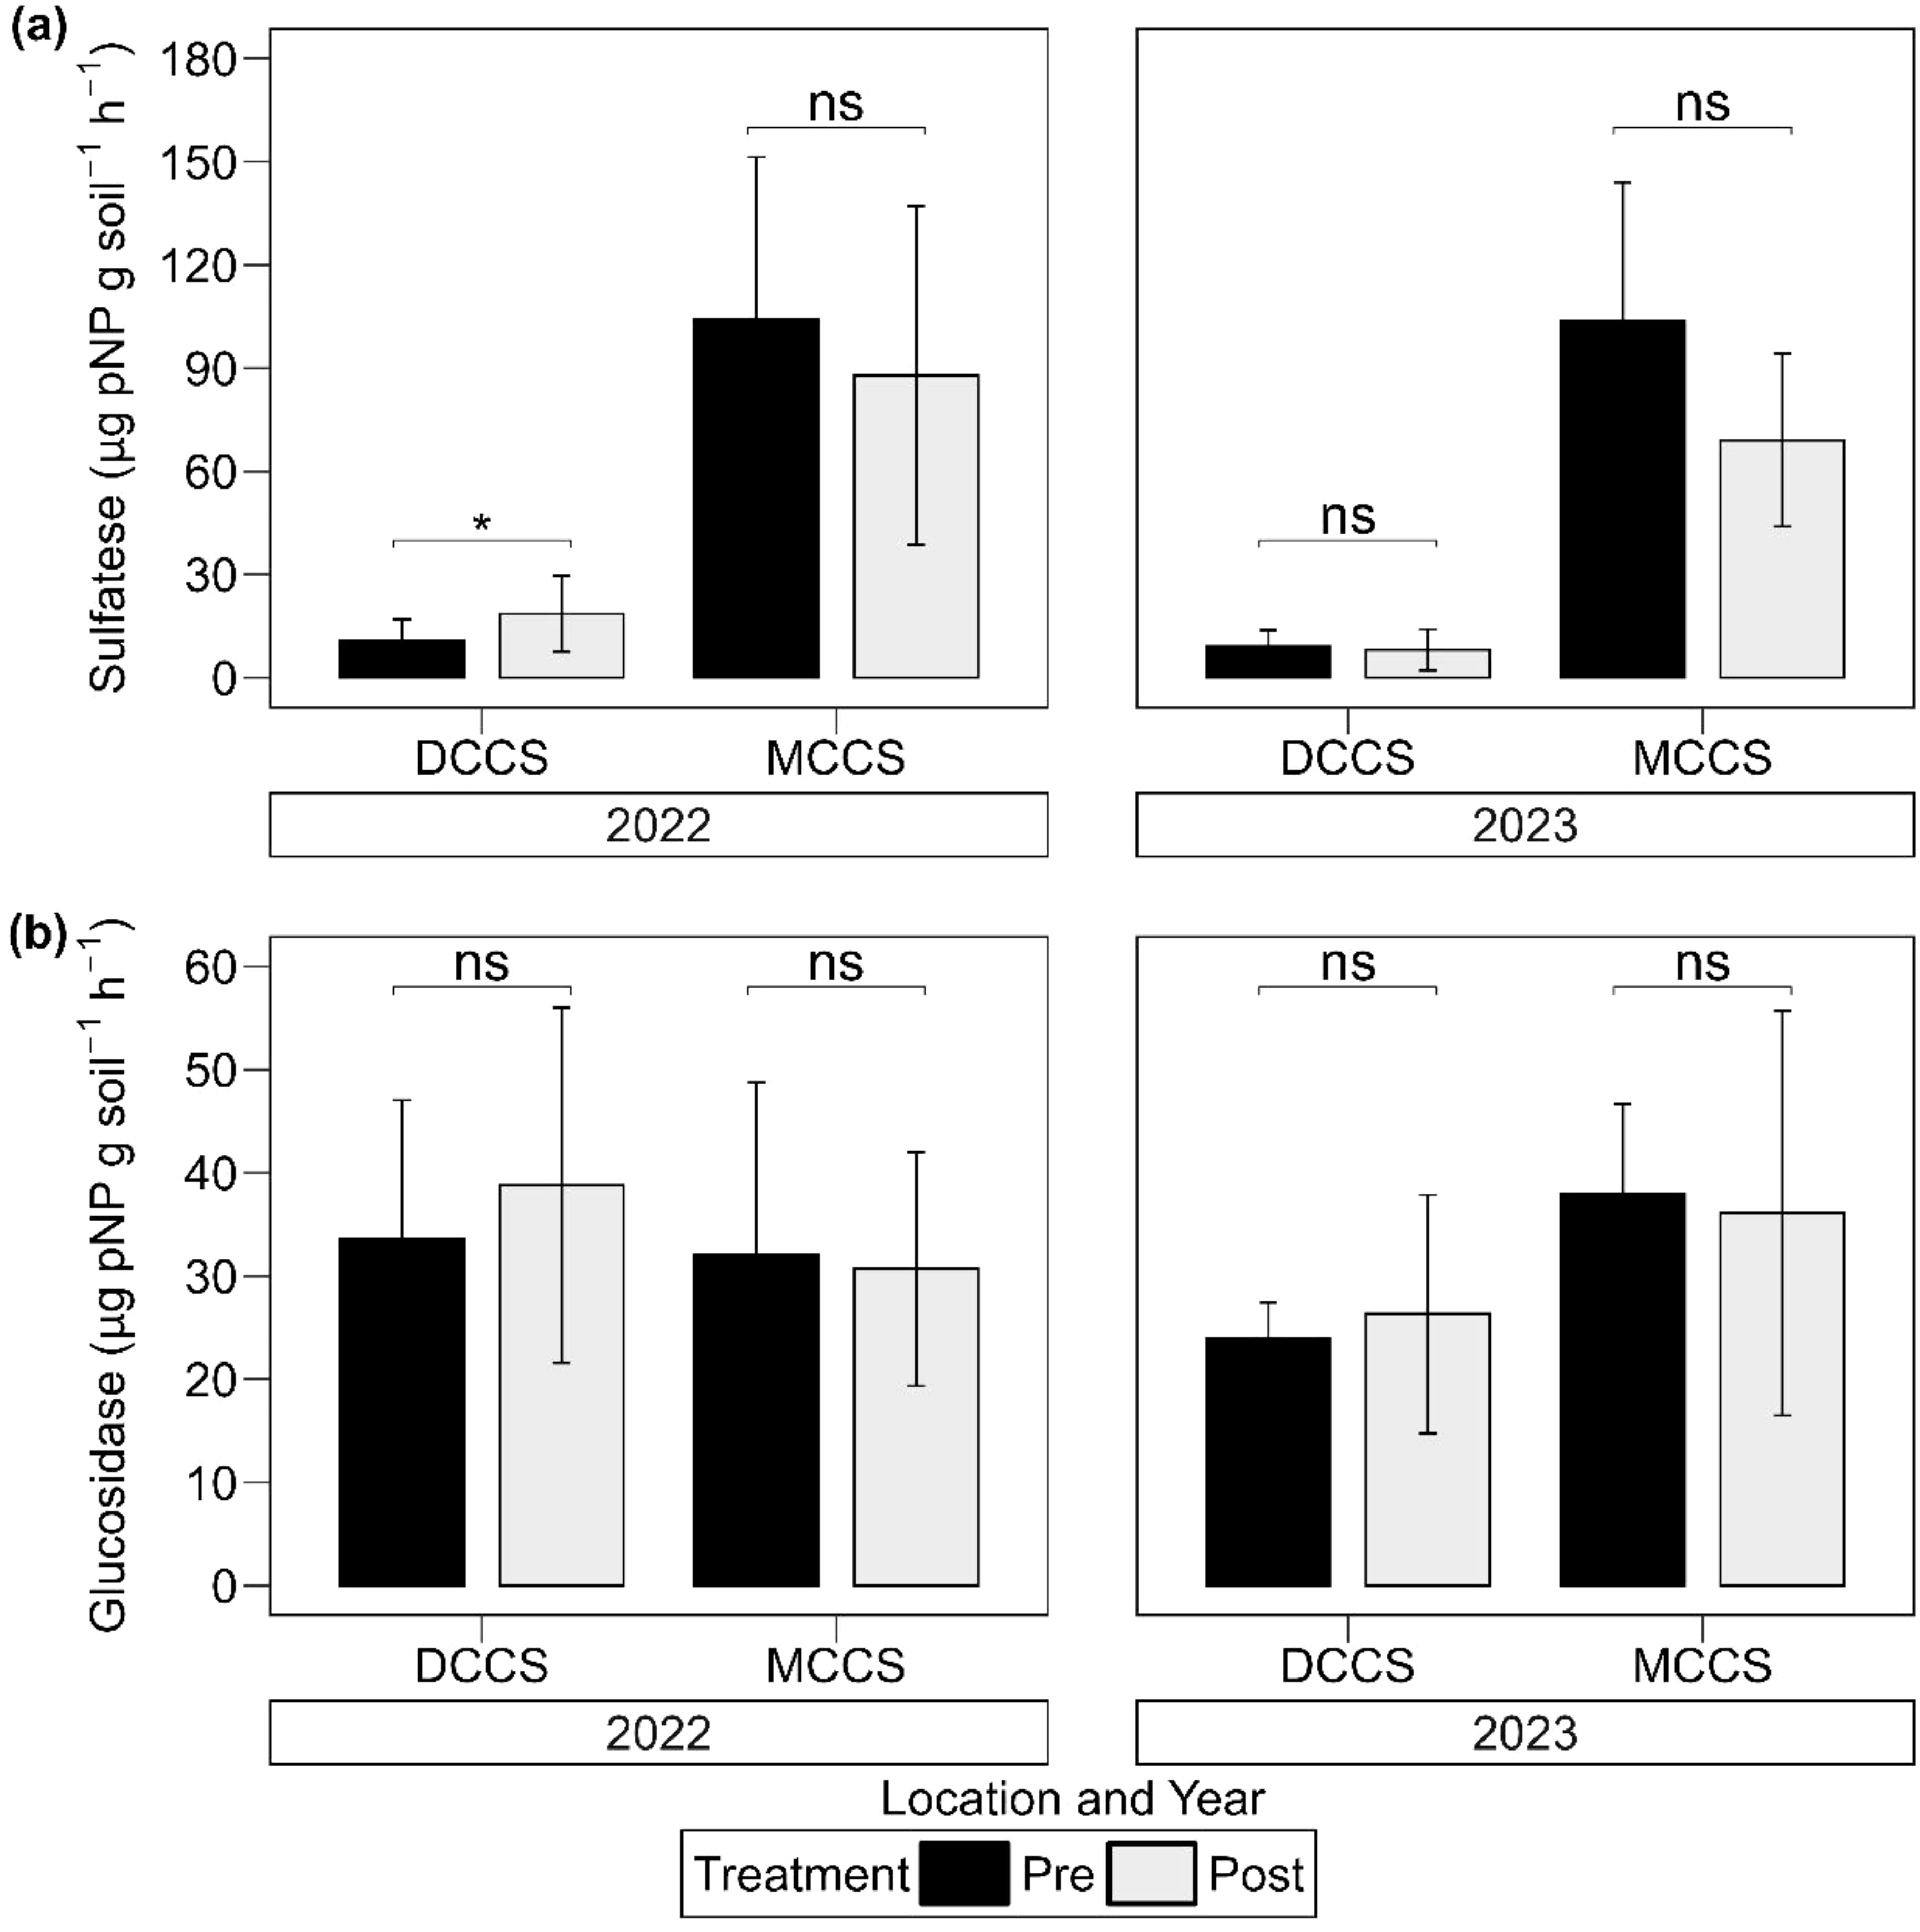
Figure 8. Sulfatase a and b glucosidase enzyme activities during pre-planting and post-harvesting periods in 2022 and 2023 for two cover cropping systems: DCCS (double cover cropping systems) and MCCS (multiple cover cropping systems), Southern Florida, USA. Significance levels are indicated as * for P value < 0.05 while “ns” denotes not significant.
The correlation analysis illustrates the interactions between parameters in pairs while comparing thirteen soil indicators, showing stronger correlations during the post-harvest period in 2022 (Figure 9) compared to the pre-planting phase. However, the opposite trend was observed in the 2023 study. Most notably, OM were positively correlated (P < 0.05) with WHC, AC, SP, and AS in the first year of study while WHC, AC, AS and BG in the second year of study. Consistently OM was negatively correlated (P < 0.05) with BD in both years at both sampling periods.
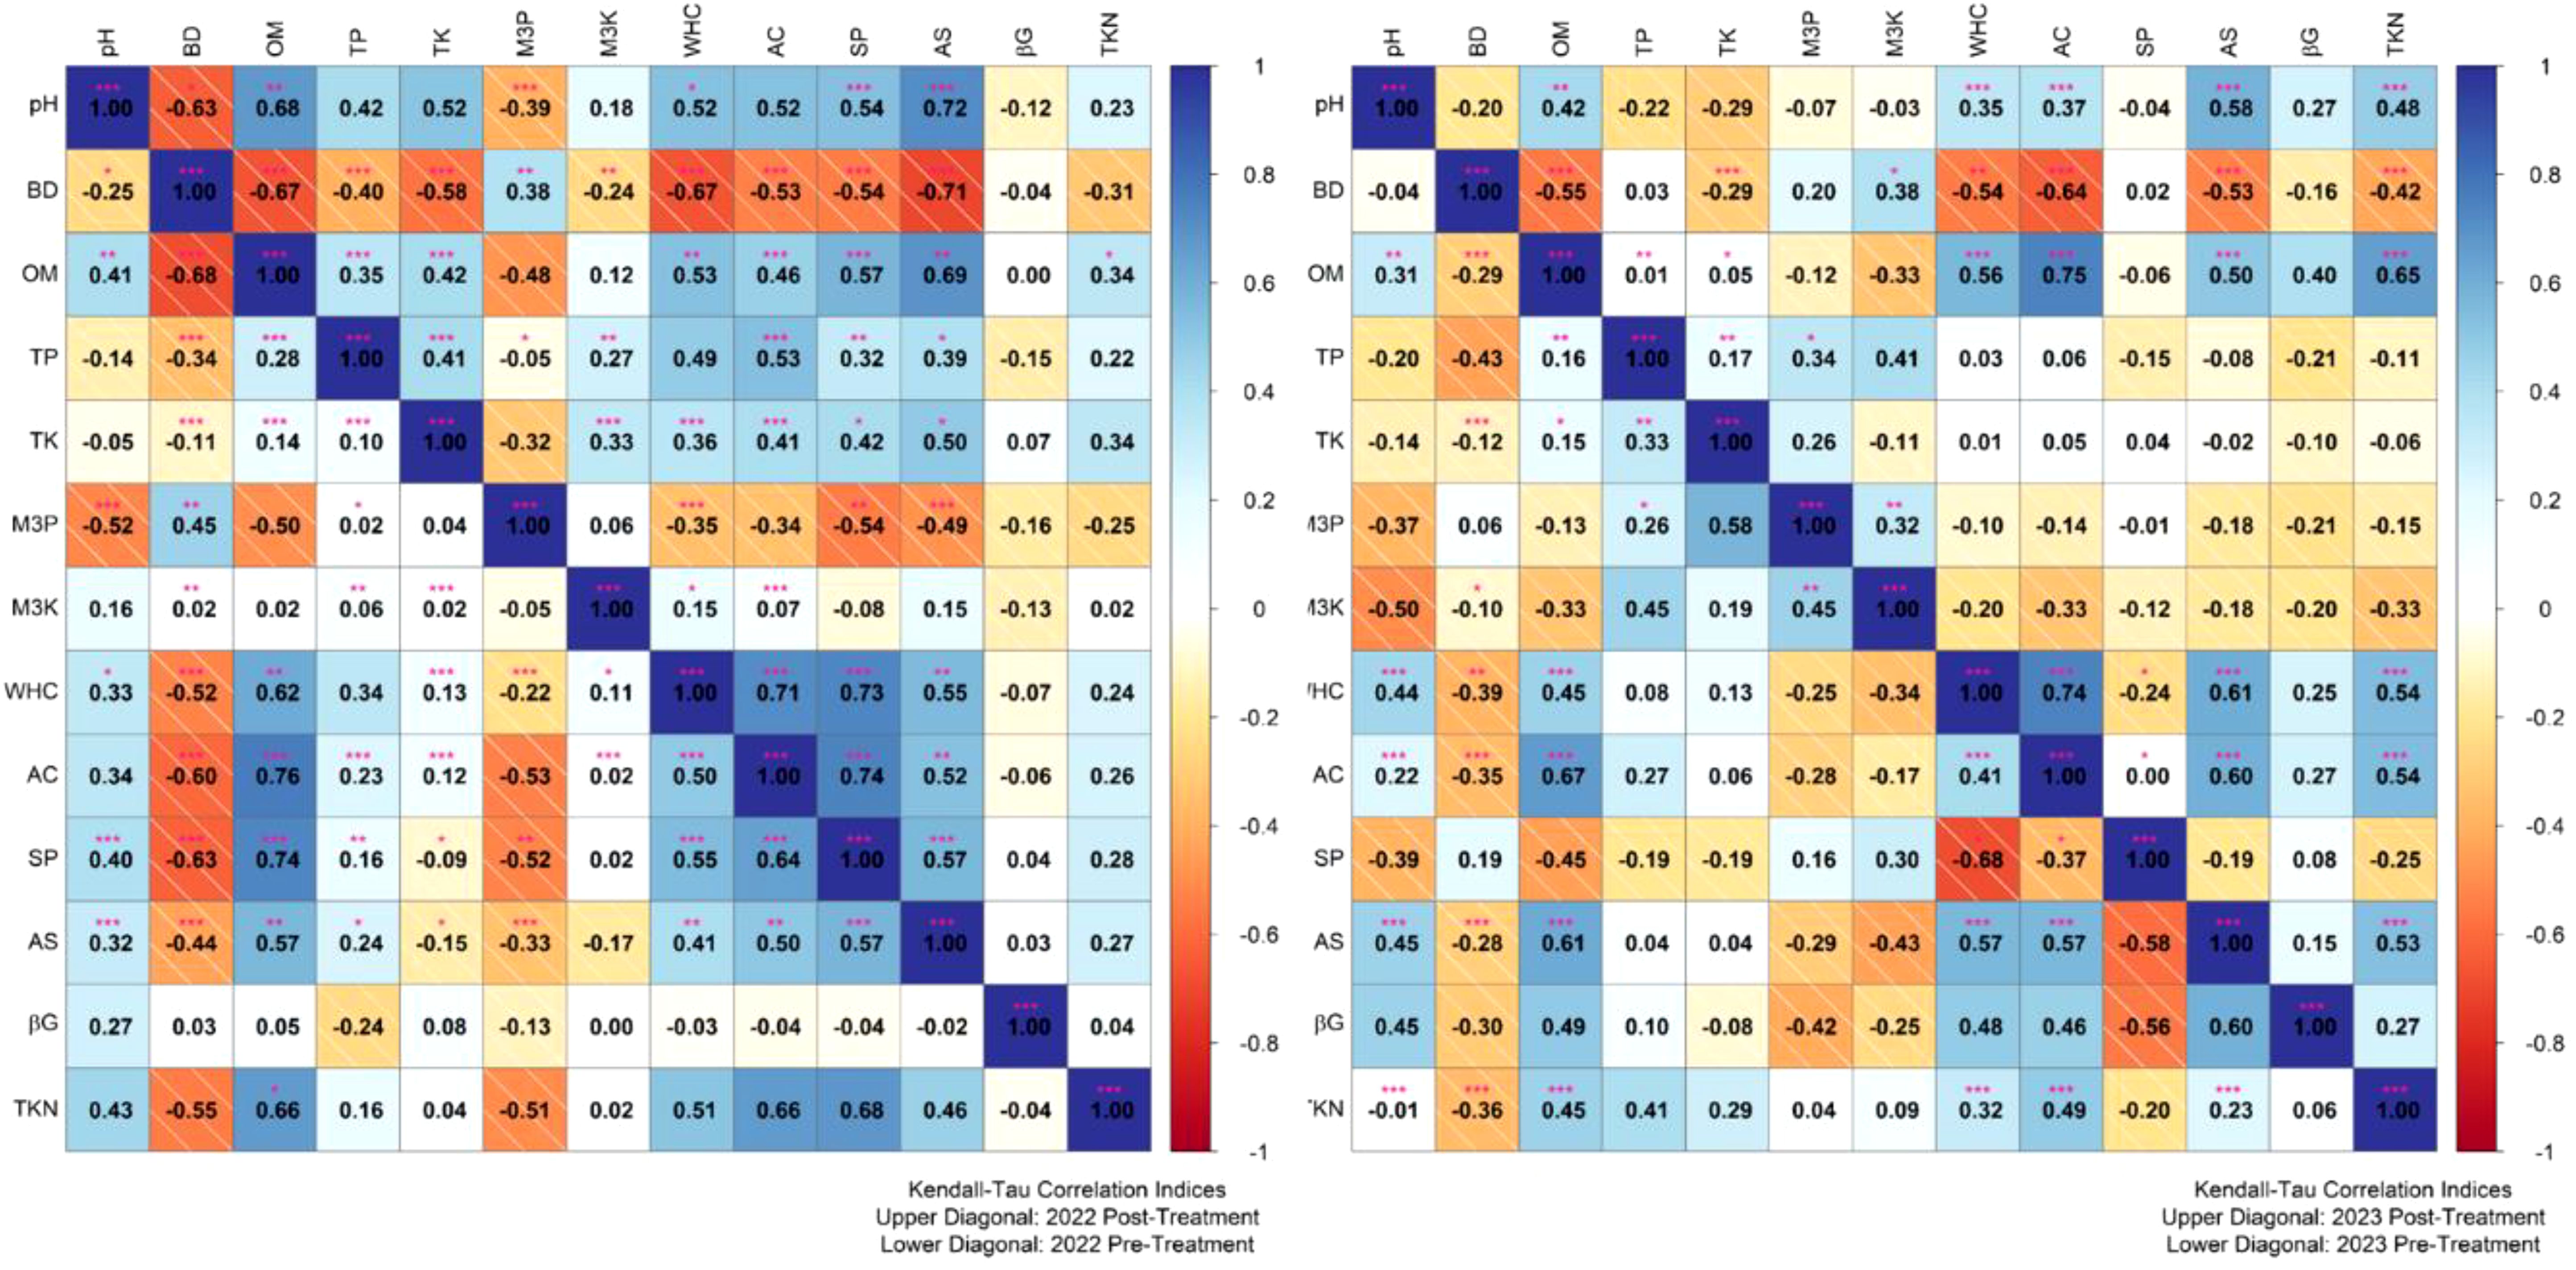
Figure 9. The correlation analysis illustrates the relationships between parameters during the pre-planting and post-harvesting periods in 2022 and 2023 for two cover cropping systems: DCCS (double cover cropping systems) and MCCS (multiple cover cropping systems) in southern Florida, USA. The values are represented by Kendall-Tau indices, with significance levels indicated by stars: *** for P < 0.001, ** for P < 0.01, and * for P < 0.05.
Utilizing PCA analysis of thirteen soil health indicators within DCCS and MCCS, we examined patterns in these parameters during pre-planting and post-harvesting periods in 2022 and 2023 (Figure 10). The first principal component (PC1) explained approximately 45–48% of the total variance, highlighting its role in capturing the main variability in cropping system performance. The second principal component (PC2) accounted for 17–24% of the variance, offering an additional layer of differentiation.
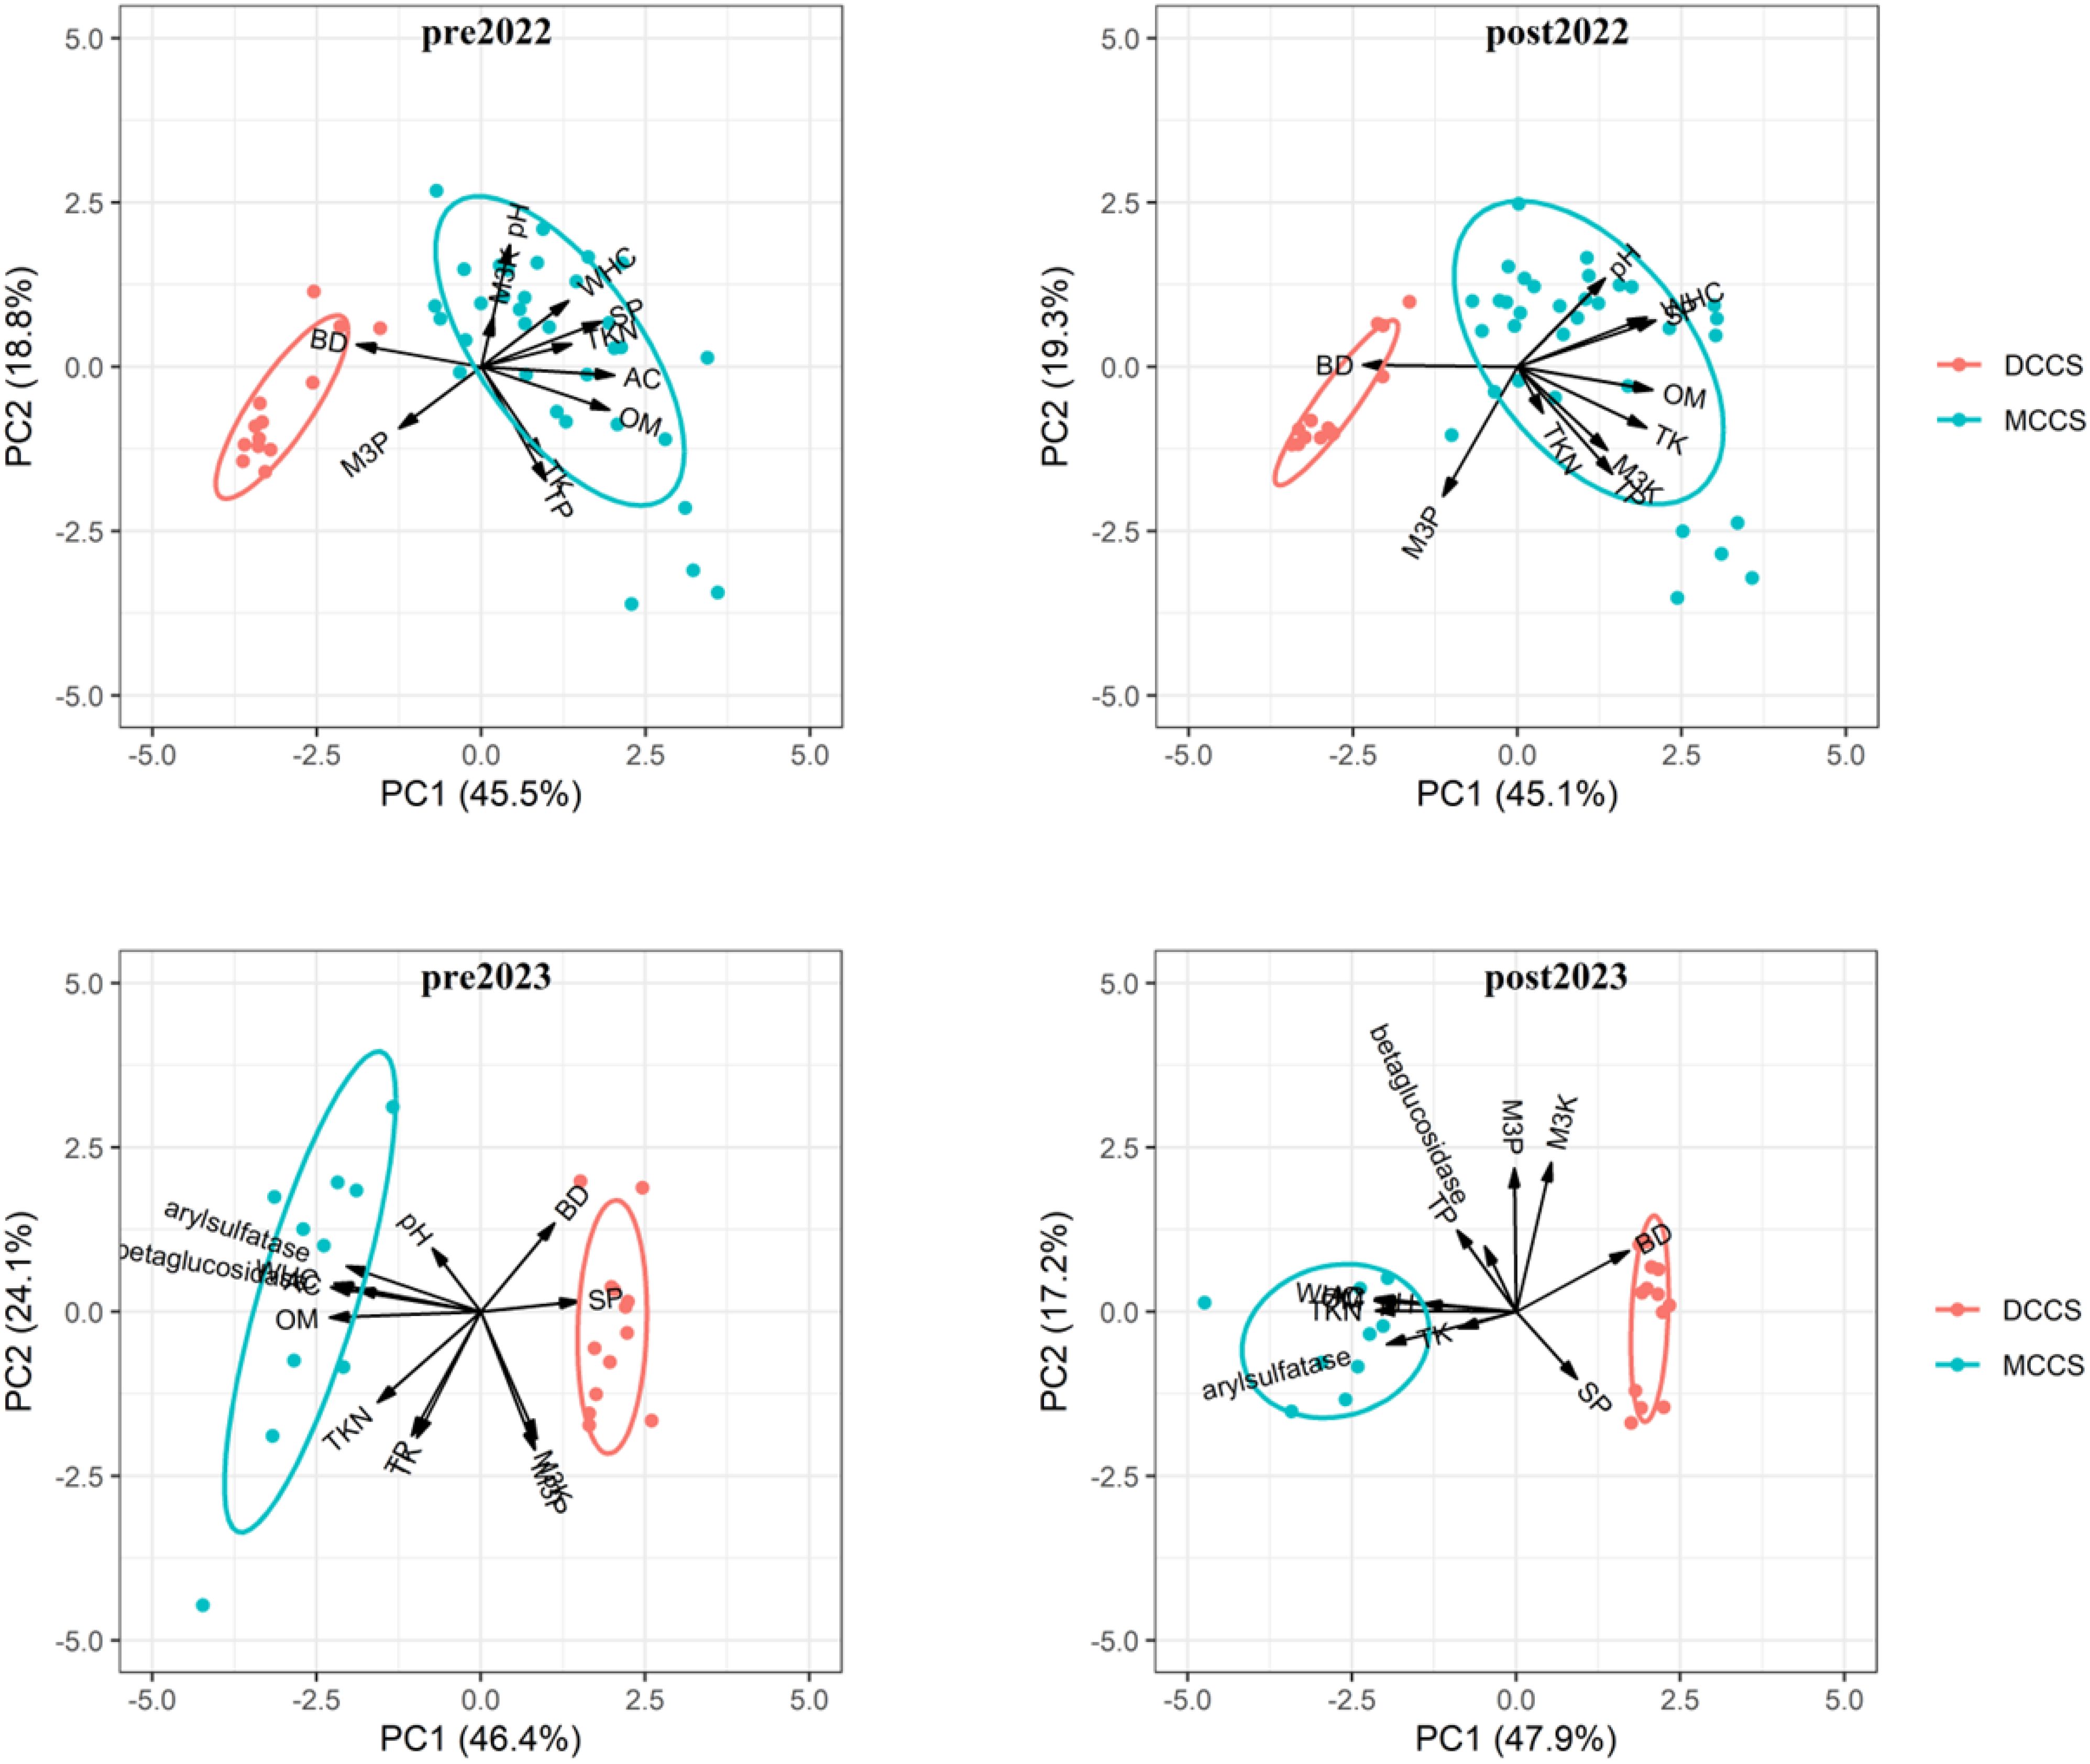
Figure 10. Principal components analysis at pre-planting and post-harvesting periods in 2022 and 2023 for two cover cropping systems: DCCS (double cover cropping systems) and MCCS (multiple cover cropping systems), Southern Florida, USA.
In the 2022 PCA analysis, variables contributing most to PC1 during the pre-planting period were BD, OM, WHC, AC, SP, TKN, M3P, and AS, while PC2 was mainly influenced by pH, TP, and TK. Post-harvest, however, TP, TK, and M3K increased their contributions to PC1, while M3P and AS shifted to PC2. System-specific associations indicated that both DCCS and MCCS retained their positions, showing a negative association with BD and M3P.
For the 2023 PCA analysis, the variables contributing most to PC1 during the pre-planting period were OM, WHC, AC, AS, βG, TKN, and SP, while PC2 was primarily influenced by TP, TK, M3P, and M3K. Post-harvest, pH was added to PC1 by replacing βG and SP, while TK was removed from PC2. System-specific associations showed that both DCCS and MCCS reduced their positions along the axes and exhibited negative associations with BD and SP.
The F1 function score (nutrient cycling) in 2022 indicates that soil conditions in both DCCS and MCCS were medium soil health condition (Table 3). However, in the following year, the DCCS system in post soil samples shifted to low (Table 3). In contrast, the MCCS demonstrated an improvement in soil health scores through cover cropping in the second year of the study (Table 3).
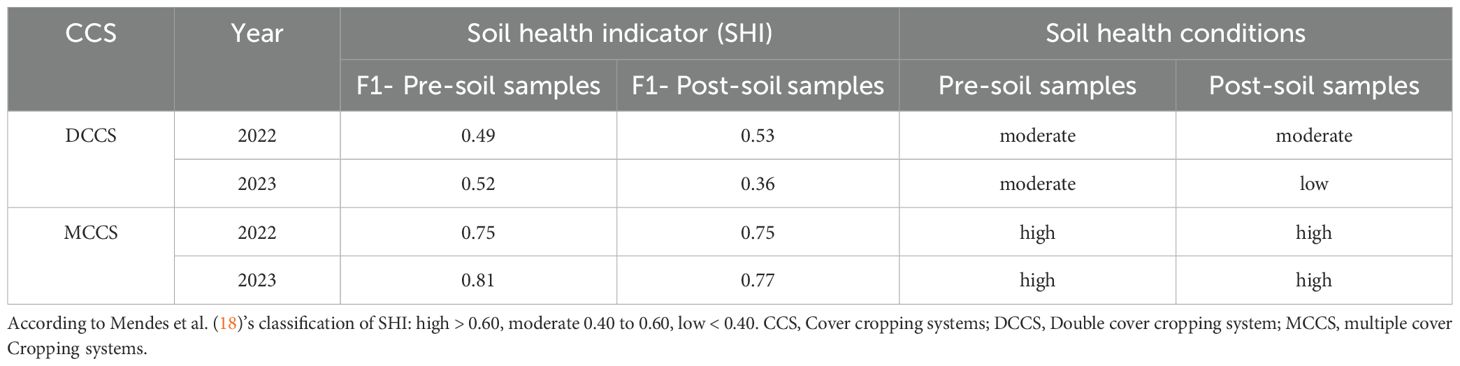
Table 3. F1 function score (nutrient cycling = enzymes activity) (SHI) and interpretative conditions for soil health conditions.
In contrast, soil indexing, known as A modified CASH method, showed minimal changes overall, except for MCCS, which demonstrated an improvement in soil health scores through cover cropping in the second year of the study (Table 4).
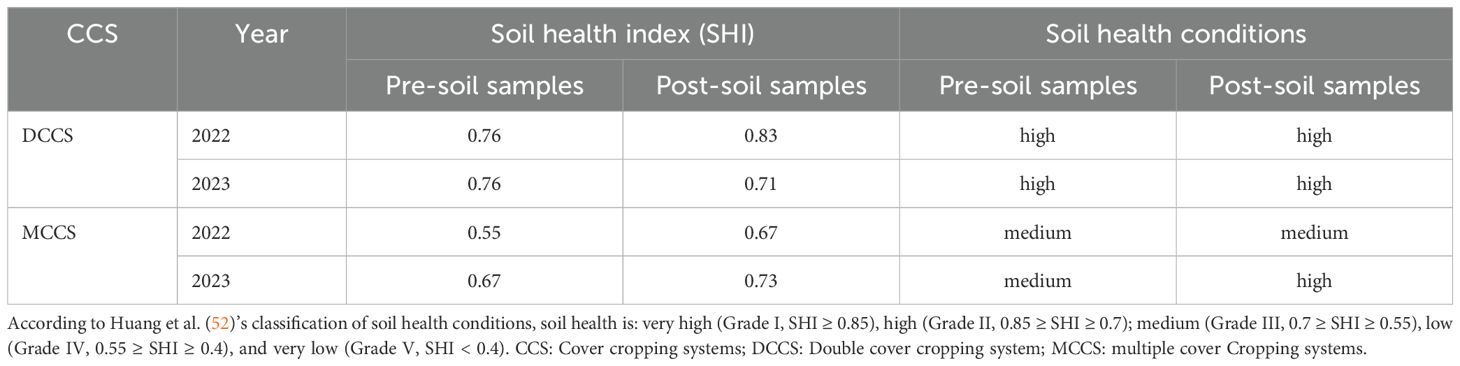
Table 4. A modified CASH method and changes in soil health conditions by cover cropping systems in USA.
4 Discussion
4.1 Soil organic matter
Several studies have reported that SOM levels are often not sensitive to short- or medium-term changes in management, in contrast to enzymatic activity, which is more responsive (7, 18, 23, 24, 26, 28, 29, 66). However, the current study revealed significant differences in both SOM and enzyme activity over time and under varying management practices, with enzymes demonstrating a much greater sensitivity to these changes, showing double the magnitude of response (Figures 1A, B, 2A, B). The higher variability in SOM observed in this study could be attributed to the sandy texture of the soil, which offers limited physical protection for organic matter (67, 68). This sensitivity of SOM to temporal changes in sandy soils underscores the importance of annual monitoring in such systems, rather than relying on biannual or triannual assessments, as previously considered sufficient.
As emphasized by Karlen et al. (69) and Manirakiza et al. (57), SOM—or its counterpart soil organic carbon (SOC)—is widely regarded as the best single indicator of soil quality due to its critical role in key soil functions and its strong correlation with other properties such as cation exchange capacity (CEC), exchangeable acidity (EA), and nutrient availability (Figure 3). However, changes in SOM/SOC occur very gradually, making it difficult to detect small variations against the large background of total soil carbon (70). In contrast, enzyme activity provides a more sensitive indicator of management practices, leading researchers at Embrapa to prioritize its use as a SH bio-indicator over the past two decades. Their efforts culminated in the development of the SoilBio technology, which incorporates enzymes such as arylsulfatase (AS) and β-glucosidase (BG), associated with sulfur and carbon cycles, respectively, into routine soil health assessments.
Findings from U.S.-based study sites highlight the dynamic nature of soil health responses to short-term cover cropping systems. For example, a decline in SOM post-harvest suggests that short-term practices may not sustain SOM levels due to factors such as erosion, insufficient residue input, or low microbial diversity (71, 72). However, in the second year of monitoring, diversified cover cropping systems (MCCS) showed a numerical, though not statistically significant, increase in SOM, indicating potential for long-term improvements with sustained management practices.
4.2 Enzyme activities
As described by Mendes et al. (15), BG is a key enzyme in the carbon cycle. It functions as a carbohydrate hydrolase, facilitating the conversion of cellobiose into glucose, which serves as a critical energy source for soil microbial communities (73). This role makes BG essential in the final step of cellulose degradation. The enzyme is highly responsive to organic amendments containing cellulose, a major component of plant residues. On the other hand, AS is an enzyme of the esterase class involved in the hydrolysis of ester sulfates into sulfate, a primary sulfur source for plant uptake (74). Interestingly, the sensitivity of AS to changes in soil management is linked to fungal activity. Unlike bacteria, fungi accumulate ester sulfate, the substrate for AS, reflecting fungal biomass production and turnover (26, 75). Thus, higher fungal activity in the soil results in greater production of sulfatases, highlighting the connection between AS activity and fungal-driven soil processes.
The enzyme activity findings further reveal the limited impact of short-term seasonal cover cropping on soil biochemical properties in mineral soils, compared to medium-term integrated systems. Neither AS nor BG activity showed significant changes over time, except for an initial increase in AS in DCCS during the first year (2022). This suggests that while cover crops may have provided organic substrates beneficial for soil quality (76), the short duration of the study likely limited sustained increases in enzyme activity. The inconsistent enzyme responses across years underscore the resilience of soil enzyme levels to short-term management changes in mineral soils, particularly in systems with low organic matter inputs or rapid microbial turnover. These findings highlight the need for longer-term studies to better understand the cumulative effects of cover cropping on soil biochemical properties.
Microbial enzyme activities are strongly linked to the OM content in soil (77, 78). That’s why an increasing trend in enzyme activity along with the OM was observed over four years of integrated systems in Brazil. Soil enzymes originate from various sources, including living and dead microbes, plant roots and residues, and soil animals. Once stabilized within the soil matrix, enzymes accumulate or form complexes with organic matter (e.g., humus), clay, or humus-clay complexes, becoming dissociated from viable cells (79). Therefore, sandy soils typically exhibit lower enzyme activity due to their naturally low OM content, poor water-holding capacity, and reduced microbial biomass. Plant roots, however, can enhance enzyme activity by stimulating microbial activity and releasing exudates that serve as substrates for enzymatic processes. Despite this, short-term seasonal cover cropping did not significantly influence enzyme activity due to the limited duration of its implementation.
4.3 Interactions among soil health indicators
The PCA analysis from 2019 and 2023 highlights the distinct effects of land use systems on soil properties and enzyme activities. The Cer system consistently exhibited strong associations with Fe and S in both years, aligning with the region’s natural soil fertility, which is acidic and nutrient-poor, except for Fe (Supplementary Figures S2–S4). The Conv system was centrally positioned with weak variable associations, particularly with S in 2019 and AS (an enzyme linked to sulfur cycling) in 2023. This reflects the low-input management typical of traditional livestock production in Brazil, characterized by minimal amendments such as the application of only 1.5 Mg ha-¹ of limestone in 2021. In contrast, the ICL systems showed strong correlations with BG, P, K, Mn, and Zn in 2019, and expanded associations with BG, P, K, Ca, Mg, Mn, Zn, and Cu in 2023, indicating improved soil conditions due to better management practices. The integration of crops and livestock enhances plant diversity, OM content, nutrient cycling, and enzyme activity, thereby contributing to soil health. Similarly, the ICLF systems were associated with P, Ca, Mg, and BS in 2019 and with additional variables, including Cu, Zn, Mn, and BG, by 2023. These improvements underscore the benefits of fertilization, better plant and cattle management, and effective nutrient recycling.
The persistence of OM, CEC, and enzyme activities as critical contributors highlights their roles in maintaining soil health. Integrated systems like ICL and ICLF exemplify effective soil management by supporting these processes, whereas the Conv system’s variability points to a need for more consistent practices. Correlation analysis revealed shifting interactions among soil parameters, with stronger post-harvest correlations in 2022 and weaker correlations in 2023. Positive correlations between OM and indicators such as WHC, AC, and SP in both years suggest that SOM enhancements directly benefit soil biological properties. Conversely, the consistent negative correlation between OM and BD reflects the inverse relationship where organic inputs reduce BD by improving soil aggregation and structure (80). These findings highlight the potential of SOM to improve soil structure; however, the observed SOM declines, particularly under short-term seasonal cover cropping, may limit these benefits. This analysis underscores the need for long-term strategies to enhance soil sustainability across diverse land use systems.
4.4 Soil health scoring
The SHI scoring approach effectively captured the impact of management practices on SH, highlighting improvements with sustainable practices like integrated agrosystems and height-based grazing management to regulate cattle movement (Figures 5, 6). In Conv systems, typical of livestock farming in Brazil, demonstrated poor management characterized by unregulated grazing, overconsumption of plant biomass, soil exposure to erosion, and minimal fertilizer application. In contrast, ICL and ICLF systems showcased more sustainable approaches. By 2019, ICL soils reflected deteriorating/intermediate/recovering SH conditions due to improved crop production and fertilization, with further enhancements observed by 2023, when the system was in the deteriorating/healthy condition. Similarly, ICLF soils transitioned from an “unhealthy” state in 2019 to “deteriorating” by 2023, underscoring progress linked to fertilization, better plant and cattle management, and nutrient recycling.
Integrated systems promoted soil fertility, plant diversity, OM accumulation, and C sequestration. Annual rotations of nitrogen-fixing legumes and grasses significantly improved soil cover and nutrient cycling. For instance, Urochloa brizantha yielded up to 20 Mg ha-¹ of dry matter, exceeding the 12.5 Mg ha-¹ required to maintain a carbon balance in Cerrado conditions (81, 82). In ICLF systems, eucalyptus trees further enhanced soil health by providing livestock shade, fixing carbon, and generating additional income from wood production (24, 41). These improvements contributed to the recovery of degraded pastures, increased soil nutrient content (e.g., P, K, Ca, Mg), and enhanced beef production efficiency (Supplementary Figures S2–S4, Table 2). The SHI scoring approach effectively demonstrated these advancements, outperforming the A modified CASH method in reflecting management-induced changes in SH. While Conv systems showed limited progress due to reduced stocking rates without adequate nutrient replenishment, ICLF systems transitioned from low to high SH by 2023, validating the benefits of integrated management practices.
Both the SHI and A modified CASH method highlighted key soil health indicators influencing variability across cover cropping systems. Short-term seasonal cover cropping, such as DCCS and MCCS, demonstrated some potential for improving SH but fell short of achieving substantial gains in physical soil recovery or organic matter accumulation within the study timeframe. The PCA revealed that OM, WHC, AC, and nutrient availability (TKN, M3P) were principal contributors to system variability. Additionally, shifts in the contributions of TP, TK, and M3K between pre-planting and post-harvest reflected nutrient dynamics influenced by cover crop residue decomposition (83). However, persistent negative associations with BD in both years suggest limited short-term effects of cover cropping on soil physical recovery. These findings emphasize the importance of long-term studies and complementary soil management practices to maximize the benefits of cover cropping in enhancing soil health, particularly in mineral soils.
Historically, agricultural production management emphasized the chemical and physical properties of soil, but advancements in soil health studies, incorporating biological attributes, have revolutionized decision-making for farmers. Insights into soil health status—whether healthy, diseased, or at risk of degradation—enable more informed management strategies. Research has shown that combining organic matter with enzymatic activities of AS and BG provides an effective indicator for tracking soil health evolution using the SHI scoring approach. Findings from two study sites underscore the importance of continuous intervention through integrated systems and cover cropping, coupled with regular monitoring of key soil attributes, particularly in sandy soils with low buffering capacity under tropical conditions. The analyses, including A modified CASH method and SHI scoring, effectively captured the impacts of management practices, revealing strong correlations between enzyme activities, organic matter, and soil health attributes, especially in ICL, ICLF, and MCCS. These results highlight the practicality and value of using these indicators to guide sustainable soil management.
5 Conclusions
This study highlights the essential role of OM in assessing and enhancing SH across various agroecosystems. It shows that while SOM levels change gradually, enzyme activities like AS and BG respond more readily to short/medium-term management practices. This result is highly significant because the methodology for enzyme analysis is straightforward and aligns with the sampling procedures producers already use for soil fertility analysis in the 0–10 cm layer after harvest. This compatibility facilitates its adoption on farms and in laboratories. Consequently, the results enable farmers to track the impact of their practices on soil health, allowing for quicker adjustments as needed. This approach helps ensure improved yields, healthier soils, and more sustainable environments. Our findings reveal that ICL and ICLF systems significantly improve soil properties and nutrient cycling compared to Conv systems, which struggle due to poor management and limited inputs. The importance of OM, CEC, and enzyme activities is particularly evident in nutrient-poor regions such as Brazil’s Cer. The SHI scoring approach developed in Brazil effectively illustrates the evolution of SH in these agroecosystems based on the management practices employed. In contrast, while cover cropping systems in the USA demonstrate potential for enhancing soil conditions, their short-term implementation may fall short of delivering lasting benefits, highlighting the need for long-term commitments and additional organic amendments to increase SOM and enzyme activity. Ultimately, this research underscores the significance of OM and EA in SH assessment and improvement, promoting integrated and sustainable agricultural practices that boost organic inputs and biodiversity to enhance soil resilience and productivity. Future studies should focus on longer timeframes and a wider variety of organic amendments to further our understanding of soil health dynamics across different agroecosystem contexts. Overall, the findings underscore that while DCCS and MCCS have potential as soil improvement strategies, short-term cover cropping alone may not be sufficient to achieve substantial and consistent enhancements in soil health. Long-term studies and additional soil management practices are likely needed to maximize the benefits of cover cropping in mineral soils, particularly to build OM, sustain enzyme activity, and enhance nutrient cycling effectively.
Data availability statement
The original contributions presented in the study are included in the article/Supplementary Material. Further inquiries can be directed to the corresponding author.
Ethics statement
The animal study was approved by Ethics Committee for the Use of Animals at Embrapa (CEUA/CPPSUL No. 09/2019). The study was conducted in accordance with the local legislation and institutional requirements.
Author contributions
FS: Conceptualization, Data curation, Funding acquisition, Investigation, Methodology, Project administration, Resources, Supervision, Validation, Visualization, Writing – original draft, Writing – review & editing. MAF: Data curation, Investigation, Methodology, Supervision, Writing – review & editing. JS: Formal analysis, Writing – original draft, Writing – review & editing. TJ: Data curation, Formal analysis, Investigation, Methodology, Supervision, Validation, Visualization, Writing – original draft, Writing – review & editing. NM: Data curation, Formal analysis, Investigation, Methodology, Validation, Visualization, Writing – original draft, Writing – review & editing. MS: Data curation, Investigation, Methodology, Supervision, Writing – review & editing. IM: Data curation, Investigation, Methodology, Supervision, Writing – review & editing. MO: Data curation, Methodology, Validation, Writing – review & editing. SM: Formal analysis, Writing – review & editing. AF: Writing – original draft, Writing – review & editing. JM: Formal analysis, Writing – review & editing. JB: Conceptualization, Funding acquisition, Investigation, Methodology, Project administration, Supervision, Writing – review & editing.
Funding
The author(s) declare that financial support was received for the research and/or publication of this article. In Brazil the research was funded by Trijuncao Farm (Trijuncao Project), grant number 0369 -Faped and by Embrapa, grant number 30.18.00.022.00.00. In the USA the study was funded by Florida Department of Consumer Services (FDACS) Office of Agricultural Water Policy; USDA Hatch Funding (FLA-ERC-006388); and Fertilize 4 Life, a multi-national scientific collaboration between University of Florida, Institute of Food and Agricultural Sciences (UF|IFAS), the Brazilian Agricultural Research Corporation (EMBRAPA), USDA Agricultural Research Service (ARS), the International Fertilizer Development Center (IFDC), and the USDA Foreign Agricultural Service (FAS).
Acknowledgments
The authors are grateful to Trijunção Farm and Embrapa for the research support and financing, and Dr. Abul Rabbany and Salvador Galindo for laboratory and field work.
Conflict of interest
The authors declare that this study received funding from Trijuncao Farm. The funder had the following involvement in the study: provided the area and an employee to help conduct the research and collect data. The funder was not involved in study design, analysis, interpretation of data, or the writing of this paper.
The author(s) declared that they were an editorial board member of Frontiers, at the time of submission. This had no impact on the peer review process and the final decision.
Generative AI statement
The author(s) declare that no Generative AI was used in the creation of this manuscript.
Publisher’s note
All claims expressed in this article are solely those of the authors and do not necessarily represent those of their affiliated organizations, or those of the publisher, the editors and the reviewers. Any product that may be evaluated in this article, or claim that may be made by its manufacturer, is not guaranteed or endorsed by the publisher.
Supplementary material
The Supplementary Material for this article can be found online at: https://www.frontiersin.org/articles/10.3389/fsoil.2025.1524550/full#supplementary-material
References
1. Scholberg JM, Dogliotti S, Leoni C, Cherr CM, Zotarelli L, and Rossing WA. Cover crops for sustainable agrosystems in the Americas. In: Genetic Engineering, Biofertilizers, Soil Quality, and Organic Farming (2010). p. 23–58. doi: 10.1007/978-90-481-8741-6_2
2. Gil JD, Cohn AS, Duncan J, Newton P, and Vermeulen S. The resilience of integrated agricultural systems to climate change. Wiley Interdiscip Rev Clim Change. (2017) 8:e461. doi: 10.1002/wcc.461
3. USDA-NRCS. Soil health (2024). Available online at: https://www.nrcs.usda.gov/conservation-basics/natural-resource-concerns/soils/soil-health (Accessed 03 October 2024).
4. Moebius-Clune BN, Moebius-Clune DJ, Gugino BK, Idowu OJ, Schindelbeck RR, Ristow AJ, et al. Comprehensive Assessment of Soil Health – The Cornell Framework, Edition 3.2. Geneva, NY: Cornell University (2016).
5. Lehmann J, Bossio DA, Kogel-Knabner I, and Rillig MC. The concept and future prospects of soil health. Nat Rev Earth Environ. (2020) 1:544–53. doi: 10.1038/s43017-020-0080-8
6. Oliveira ES, Reatto A, and Roig HL. Soil carbon stocks according to landscape components. Cadernos Ciec e Tecnologia (2015) 32(1/2):71–93.
7. Stott DE, Andrews SS, Liebig MA, Wienhold BJ, and Karlen DL. Evaluation of β-glucosidase activity as a soil quality indicator for the soil management assessment framework. Soil Sci Soc Am J. (2010) 74:107–19. doi: 10.2136/sssaj2009.0029
8. Fine AK, van Es HM, and Schindelbeck RR. Statistics, scoring functions, and regional analysis of a comprehensive soil health database. Soil Sci Soc Am J. (2017) 81:589–601. doi: 10.2136/sssaj2016.09.0286
9. Hurisso TT, Moebius-Clune DJ, Culman SW, Moebius-Clune BN, Thies JE, and van Es HM. Soil protein as a rapid soil health indicator of potentially available organic nitrogen. Agric Environ Lett. (2018) 3:180006. doi: 10.2134/ael2018.02.0006
10. Stott DE. Recommended soil health indicators and associated laboratory procedures. In: Soil Health Technical Note No. 450-03. USA: USDA–NRCS (2019).
11. Norris CE, Bean GM, Cappellazzi SB, Cope M, Greub KLH, Liptzin D, et al. Introducing the north american project to evaluate soil health measurements. Agron J. (2020) 112:3195–215. doi: 10.1002/agj2.v112.4
12. Nunes MR, Veum KS, Parker PA, Holan SH, Karlen DL, Amsili JP, et al. The soil health assessment protocol and evaluation applied to soil organic carbon. Soil Sci Soc Am J. (2021) 85:1196–213. doi: 10.1002/saj2.20244
13. Liptzin DL, Norris CE, Cappellazzi SB, MacBean G, and Cope M. An evaluation of carbon indicators of soil health in long-term agricultural experiments. Soil Biol Biochem. (2022) 172:108708. doi: 10.1016/j.soilbio.2022.108708
14. Bagnall DK, Rieke EL, Morgan CLS, Liptzin DL, Cappallazzi SB, and Honeycutt CW. A minimum suite of soil health indicators for North American agriculture. Soil Secur. (2023) 10:100084. doi: 10.1016/j.soisec.2023.100084
15. Mendes IC, Chaer GM, Reis Junior FB, Dantas OD, Malaquias JV, Oliveira MIL, et al. Soil bioanalysis (SoilBio): A sensitive, calibrated, and simple assessment of soil health for Brazil. In: Mendes IC and Cherubin MR, editors. Soil Health and Sustainable Agriculture in Brazil, vol. 3 . Soil Science Society of America, Madison (2024). p. 292–326.
16. Zhang J, Dyck M, Quideau SA, and Norris CE. Assessment of soil health and identification of key soil health indicators for five long-term crop rotations with varying fertility management. Geoderma. (2024) 443:116836. doi: 10.1016/j.geoderma.2024.116836
17. Simon CDP, Gomes TF, Pessoa TN, Soltangheisi A, Bieluczyk W, Camargo PBD, et al. Soil quality literature in Brazil: A systematic review. Rev Bras Ciec do Solo (2022) 46:e0210103.
18. Mendes IC, Sousa DMG, Dantas OD, Lopes AAC, Reis-Junior FB, Oliveira MI, et al. Soil quality and grain yield: a win–win combination in clayey tropical Oxisols. Geoderma. (2021) 388:114880. doi: 10.1016/j.geoderma.2020.114880
19. Obalum S, Chibuike G, Peth S, and Ouyang Y. Soil organic matter as sole indicator of soil degradation. Environ Monit Assess. (2017) 189:176. doi: 10.1007/s10661-017-5881-y
20. Silva CA, Cerri CEP, Andrade CA, Martin-Neto L, and Bettiol W. Matéria orgânica do solo: ciclo, compartimentos e funções. In: Bettiol W, Silva CA, Cerri CEP, Martin-Neto L, and Andrade CA, editors. Entendendo a matéria orgânica do solo em ambientes tropical e subtropical. Empresa Brasileira de Pesquisa Agropecuária, Brasília, DF (2023). p. 17–48.
21. Oguike P, Onwuka B, and Obalum S. Soil organic matter control of water transmission properties of coarse-textured soils under contrasting land-use types in tropical rainforest. Int J Hydrol Sci Technol. (2023) 16(1):93–106. doi: 10.1504/IJHST.2023.131833
22. Quevedo HD, Nishisaka CS, and Mendes R. Soil microbiome and its relationship with organic matter. Understanding Soil organic matter Trop subtropical environments (2023), 125–44.
23. Geisseler D and Horwath WR. Short-term dynamics of soil carbon, microbial biomass, and soil enzyme activities as compared to longer-term effects of tillage in irrigated row crops. Biol Fertil Soils. (2009) 46:65–72. doi: 10.1007/s00374-009-0400-0
24. Camargo TA, Alves LA, Mendes IC, Gasques LR, Oliveira LGS, Pires GC, et al. Enhancing soil quality and grain yields through fertilization strategies in integrated crop-livestock systems under no-till in Brazilian Cerrado. Eur J Soil Biol. (2024) 121:103613. doi: 10.1016/j.ejsobi.2024.103613
25. Lopes AAC, Sousa DMG, Chaer GM, Reis Junior FB, Goedert WJ, and Mendes IC. Interpretation of microbial soil indicators as a function of crop yield and organic carbon. Soil Sci Soc Am J. (2013) 77:461–72. doi: 10.2136/sssaj2012.0191
26. Acosta-Martínez V, Pérez-Guzmán L, Veum KS, Nunes MR, and Dick RP. Metabolic activity – enzymes. In: Karlen DL, Stott DE, and Mikha MM, editors. Laboratory Methods for Soil Health Analysis, vol. 2 . SSSA, Madison, WI (2021), ISBN: ISBN: 978-0-891-18982-4. p. 194–250.
27. Karlen DL. Preface. In: Approaches to Soil Health Analysis, 1st ed. Soil Science Society of America, Madison, WI, USA (2021).
28. Mendes IC, Sousa DMG, Chaer GM, Reis Junior FB, Lopes AAC, Dantas OD, et al. Soil bioanalysis: A simple and effective tool to access and interpret soil health. In: Proceedings of the Global Symposium on Soil Biodiversity (2021) Food and Agriculture Organization, Rome, Italy. p. 256–61. doi: 10.4060/cb7374en
29. Chaer GM, Mendes IC, Dantas OD, Malaquias JV, Reis Junior FB, and Oliveira MIL. Evaluating C trends in clayey Cerrado Oxisols using a four-quadrant model based on specific arylsulfatase and β-glucosidase activities. Appl Soil Ecol. (2023) 183:104742. doi: 10.1016/j.apsoil.2022.104742
30. Carneiro RG, Figueiredo CC, Malaquias JV, and Mendes IC. A soil health assessment tool for vegetable cropping systems in tropical soils based on beta-glucosidase, arylsulfatase, and soil organic carbon. Appl Soil Ecol. (2024) 198:105394. doi: 10.1016/j.apsoil.2024.105394
31. Mendes IC, Sousa DMG, Reis Junior FB, Lopes AAC, and Souza LM. Bioanalise de solo: Aspectos teoricos e praticos. Topicos em Ciencia do Solo. (2019). pp. 399–462.
32. Mendes IC, Souza LM, Sousa DMG, Lopes AAC, Reis Junior FB, Lacerda MPC, et al. Critical limits for microbial indicators in tropical Oxisols at post-harvest: The FERTBIO soil sample concept. Appl Soil Ecol. (2019) Sociedade Brasileira de Ciência do Solo, Vicosa, MG 139:85–93. doi: 10.1016/j.apsoil.2019.02.025
33. Albuquerque Filho MR, Viana JHM, Francelino MR, Thomazini A, Santana DP, and Santos FC. Caracterização pedológica da área do Projeto Trijunção no Oeste da Bahia, Região do Matopiba. Sete Lagoas: Embrapa Milho e Sorgo (2020). p. 64. Embrapa Milho e Sorgo. Boletim de Pesquisa e Desenvolvimento, 217.
34. World Reference Base - WRB/FAO. World Reference Base for Soil Resources: International soil classification system for naming soils and creating legends for soil maps. 4th ed. Vienna, Austria: International Union of Soil Sciences (IUSS (2022).
35. Santos FC, Viana JHM, Batista MA, Resende AV, and Albuquerque Filho MR. Agricultural use of sandy soils in Brazilian Cerrado (Brazilian Savanna). In: Hartemink AE and Huang J, editors. Sandy Soils. Switzerland: Springer (2024). p. 165–77. doi: 10.1007/978-3-031-50285-9
36. Peel MC, Finlayson BL, and McMahon TA. Updated world map of the Köppen-Geiger climate classification. Hydrol Earth Syst Sci. (2007) 11:1633–44. doi: 10.5194/hess-11-1633-2007
37. Bhadha JH, Capasso JM, Khatiwada R, Swanson S, and LaBorde C. Raising soil organic matter content to improve water holding capacity: Sl447/Ss661, 10/2017. Edis (2017) 2017(5).
38. Manirakiza N and Şeker C. Effects of compost and biochar amendments on soil fertility and crop growth in a calcareous soil. J Plant Nutr. (2020) 43:3002–19. doi: 10.1080/01904167.2020.1806307
39. Tabatabai MA. Soil enzymes. In: Weaver RW, editor. Methods of Soil Analysis, Part 2: Microbiological and Biochemical Properties. SSSA Book Series No. 5. SSSA, Madison, WI (1994). p. 778–833.
40. Valle ER ed. Boas práticas agropecuárias: Bovinos de corte: Manual de orientações, 2nd ed., rev. e ampl. Campo Grande, MS: Embrapa Gado de Corte (2011). 69 p.
41. Alves FV, Almeida RG, and Laura VA. Carbon Neutral Brazilian Beef: a new concept for sustainable beef production in the tropics. Brasília, DF: Embrapa (2017). p. 28. (Embrapa Gado de Corte. Documentos, 243).
42. Almeida RG and Alves FV. Diretrizes técnicas para produção de carne com baixa emissão de carbono certificada em pastagens tropicais: Carne Baixo Carbono (CBC). Campo Grande, MS: Embrapa Gado de Corte (2020). 36 p. (Embrapa Gado de Corte. Documentos, 280).
43. Martha Junior GB, Vilela L, and Sousa DMG. Cerrado: uso eficiente de corretivos e fertilizantes em pastagens. Planaltina, DF: Embrapa Cerrados (2007). 224 p.
44. Teixeira PC, Donagemma GK, Fontana A, and Teixeira WG. Manual de métodos de análise de solo, 3rd ed., rev. e ampl. Brasília, DF: Embrapa (2017).
45. Jenkinson DS and Powlson DS. The effects of biocidal treatments on metabolism in soil—I. Fumigation with chloroform. Soil Biol Biochem (1976) 8(3):167–77.
46. Schindelbeck RR, Moebius-Clune BN, Moebius-Clune DJ, Kurtz KS, and van Es HM. Cornell Univ Compr Assess Soil Health Lab standard operating procedures (2016).
47. Bremner JM and Mulvaney CS. Nitrogen—total. Methods Soil analysis: Part 2 Chem microbiological properties (1982) 9:595–624.
48. Tesfahunegn GB. Soil quality assessment strategies for evaluating soil degradation in Northern Ethiopia. Appl Environ Soil Sci (2014) 2014(1):646502.
49. Congreves KA, Hayes A, Verhallen EA, and Van Eerd LL. Long-term impact of tillage and crop rotation on soil health at four temperate agroecosystems. Soil Tillage Res. (2015) 152:17–28. doi: 10.1016/j.still.2015.03.012
50. Shao G, Ai J, Sun Q, Hou L, and Dong Y. Soil quality assessment under different forest types in the Mount Tai, central Eastern China. Ecol Indic (2020) 115:106439.
51. Bandyopadhyay S and Maiti SK. Application of statistical and machine learning approach for prediction of soil quality index formulated to evaluate trajectory of ecosystem recovery in coal mine degraded land. Ecol Eng (2021) 170:106351.
52. Huang W, Zong M, Fan Z, Feng Y, Li S, Duan C, et al. Determining the impacts of deforestation and corn cultivation on soil quality in tropical acidic red soils using a soil quality index. Ecol Indic. (2021) 125:107580. doi: 10.1016/j.ecolind.2021.107580
53. Rezapour S, Alamdari P, and Kalavrouziotis IK. Response of soil health index to untreated wastewater irrigation in selected farms under different vegetable types. Agric Water Manage (2023) 290:108592.
54. Zhang Y, Wang L, Jiang J, Zhang J, Zhang Z, and Zhang M. Application of soil quality index to determine the effects of different vegetation types on soil quality in the Yellow River Delta wetland. Ecol Indic (2022) 141:109116.
55. Wymore AW. Model-Based Systems Engineering: An Introduction to the Mathematical Theory of Discrete Systems and to the Tricotyledon Theory of Systems Design. Boca Raton, FL: CRC Press (1993).
56. Karlen DL, Mausbach MJ, Doran JW, Cline RG, Harris RF, and Schuman GE. Soil quality: A concept, definition, and framework for evaluation. Soil Sci Soc Am J. (1997) 61:4–10. doi: 10.2136/sssaj1997.03615995006100010001x
57. Manirakiza N, Melkani S, Rabbany A, Medina-Irizarry N, Smidt S, Braswell A, et al. Responses of soil health to seasonal change under different land cover types in a sub-tropical preserve ecosystem. PloS One (2025) 20(3):e0318092.
58. Glover JD, Reganold JP, and Andrews PK. Systematic method for rating soil quality of conventional, organic, and integrated apple orchards in Washington State. Agric Ecosyst Environ. (2000) 80:29–45. doi: 10.1016/S0167-8809(00)00131-6
59. Amgain NR, Xu N, Rabbany A, Fan Y, and Bhadha JH. Developing soil health scoring indices based on a comprehensive database under different land management practices in Florida. Agrosyst Geosci Environ. (2022) 5:e20304. doi: 10.1002/agg2.20304
60. Jesmin T, Amgain NR, Rabbany A, Manirakiza N, Capasso J, Korus K, et al. On-farm soil health assessment across seven sub-tropical cover crop management systems. Agrosyst Geosci Environ. (2025) 8:e70022. doi: 10.1002/agg2.70022
61. Elkin L, Kay M, Higgins J, and Wobbrock J. An aligned rank transform procedure for multifactor contrast tests. Proc ACM Hum.-Comput Interact. (2021) 5:1–15. doi: 10.1145/3472749.3474784
62. R Core Team. R: A language and environment for statistical computing. Vienna, Austria: R Foundation for Statistical Computing (2024). Available at: https://www.R-project.org/ (Acessed August 19, 2024).
63. Kay M, Elkin L, Higgins J, and Wobbrock J. ARTool: Aligned Rank Transform for Nonparametric Factorial ANOVAs. R package version 0.11. 1. In Proceedings of the ACM Conference on Human Factors in Computing Systems. ACM Press. Zenodo (2021). doi: 10.5281/zenodo.594511
64. Vu VQ. ggbiplot: A ggplot2 based biplot. R package version 0.55 (2011). Available online at: http://github.com/vqv/ggbiplot (Acessed August 19, 2024).
66. Hok L, Sá JCM, Reyes M, Boulakia S, Tivet F, Leng V, et al. Enzymes and C pools as indicators of C build-up in short-term conservation agriculture in a savanna ecosystem in Cambodia. Adv Agron. (2018) 177:125–33. doi: 10.1016/j.still.2017.11.015
67. Hassink J and Whitmore AP. A model of the physical protection of organic matter in soils. Soil Sci Soc Am J. (1997) 61:131–9. doi: 10.2136/sssaj1997.03615995006100010020x
68. Six J and Paustian K. Aggregate-associated soil organic matter as an ecosystem property and a measurement tool. Soil Biol Biochem. (2014) 68:A4–9. doi: 10.1016/j.soilbio.2013.06.014
69. Karlen DL, Veum KS, Sudduth KA, Obrycki JF, and Nunes MR. Soil health assessment: Past accomplishments, current activities, and future opportunities. Soil tillage Res (2019) 195:104365.
70. Paul E. The nature and dynamics of soil organic matter: Plant inputs, microbial transformations, and organic matter stabilization. Soil Biol Biochem. (2016) 98:109–26. doi: 10.1016/j.soilbio.2016.04.001
71. Dabney SM, Delgado JA, and Reeves DW. Using winter cover crops to improve soil and water quality. Commun Soil Sci Plant Anal (2001) 32(7-8):1221–50.
72. Haruna SI, Anderson SH, Udawatta RP, Gantzer CJ, Phillips NC, Cui S, et al. Improving soil physical properties through the use of cover crops: A review. Agrosyst Geosci Environ. (2020) 3:e20105. doi: 10.1002/agg2.20105
73. Deng S and Popova I. Carbohydrate hydrolases. In: Dick RP, editor. Methods of Soil Enzymology, vol. 9 . Madison, Wisconsin, USA: ASA and SSSA (2011). p. 185–209. doi: 10.2136/sssabookser9.c9
74. Klose S, Bilen S, Tabatabai MA, and Dick WA. Sulfur cycle enzymes. In: Dick RP, editor. Methods of Soil Enzymology, vol. 9 . Madison, Wisconsin, USA: ASA and SSSA (2011). p. 125–59. doi: 10.2136/sssabookser9.c7
75. Saggar S, Bettany JR, and Stewart JWB. Measurement of microbial S in soil. Soil Biol Biochem. (1981) 13:493–8. doi: 10.1016/0038-0717(81)90040-7
76. Xu N, Bhadha JH, Rabbany A, and Swanson S. Soil health assessment of two regenerative farming practices on sandy soils. Sustain Agric Res. (2019) 8:61–71. doi: 10.5539/sar.v8n4p61
77. Burns RG and Dick RP. Enzymes in the Environment: Activity, Ecology, and Applications. New York: Dekker (2002).
78. Kotroczo Z, Veres Z, Fekete I, Krakomperger Z, Tóth JA, Lajtha K, et al. Soil enzyme activity in response to long-term organic matter manipulation. Soil Biol Biochem. (2014) 70:237–43. doi: 10.1016/j.soilbio.2013.12.028
79. Štursová M and Baldrian P. Effects of soil properties and management on the activity of soil organic matter-transforming enzymes and the quantification of soil-bound and free activity. Plant Soil. (2011) 338:99–110. doi: 10.1007/s11104-010-0296-3
80. Karami A, Homaee M, Afzalinia S, Ruhipour H, and Basirat S. Organic resource management: Impacts on soil aggregate stability and other soil physico-chemical properties. Agric Ecosyst Environ. (2012) 148:22–8. doi: 10.1016/j.agee.2011.10.021
81. Sa JCM, Seguy L, Tivet F, Lal R, Bouzinac S, Borszowskey PR, et al. Carbon depletion by plowing and its restoration by no-till cropping systems in Oxisols of subtropical and tropical agro-ecoregions in Brazil. Land Degrad Dev. (2015) 26:531–43. doi: 10.1002/ldr.2218
82. Farias GD, Dubeux JCB, Savian JV, Duarte LP, Martins AP, Tiecher T, et al. The role of integrated crop-livestock system and fertilization strategies for food production. Agron Sustain Dev (2020) 40:1–19.
Keywords: integrated systems, cover crops, low carbon agriculture, sandy soil, enzymatic activity, soil physical-chemical indicators
Citation: Santos FCd, Albuquerque Filho MRd, Soares JR, Jesmin T, Manirakiza N, Silveira MCTd, Mendes IdC, Oliveira MILd, Melkani S, Freitas ACRd, Malaquias JV and Bhadha JH (2025) Organic matter: a critical soil health indicator in agrosystems within the Cerrado of Bahia, Brazil and South Florida, USA. Front. Soil Sci. 5:1524550. doi: 10.3389/fsoil.2025.1524550
Received: 07 November 2024; Accepted: 18 April 2025;
Published: 26 May 2025.
Edited by:
Emmanuel Arthur, Aarhus University, DenmarkReviewed by:
Sunday Ewele Obalum, University of Nigeria, Nsukka, NigeriaWilliamson Gustave, University of The Bahamas, Bahamas
Copyright © 2025 Santos, Albuquerque Filho, Soares, Jesmin, Manirakiza, Silveira, Mendes, Oliveira, Melkani, Freitas, Malaquias and Bhadha. This is an open-access article distributed under the terms of the Creative Commons Attribution License (CC BY). The use, distribution or reproduction in other forums is permitted, provided the original author(s) and the copyright owner(s) are credited and that the original publication in this journal is cited, in accordance with accepted academic practice. No use, distribution or reproduction is permitted which does not comply with these terms.
*Correspondence: Jehangir H. Bhadha, amFuZ29AdWZsLmVkdQ==