 George Amenchwi Amahnui1,2*
 Paligwendé Nikièma3
 Veronica Ebot Manga2Aaron Suh Tening4Theophilus Olufemi Isimikalu5
 Tek B. Sapoka6
- 1Multifunctional Landscapes, International Center for Tropical Agriculture (CIAT), Cali, Colombia
- 2Department of Environmental Science, Faculty of Science, University of Buea, Buea, Cameroon
- 3Natural Resources and Indigenous Futures, Government of Manitoba, Winnipeg, MB, Canada
- 4Department of Agronomic and Applied Molecular Sciences, University of Buea, Buea, Cameroon
- 5Department of Natural Sciences, University of Maryland Eastern Shore, Princess Anne, MD, United States
- 6Sustainable Agri-Food Systems, International Maize and Wheat Improvement Center (CIMMYT), Texcoco, Mexico
With a specific focus on zero tillage and organic fertilization, this study examines the effects of agronomic practices on soil greenhouse gas (GHGs—CO2, N2O, and CH4) emissions, global warming potential (GWP), maize productivity and greenhouse gas intensity (GHGI) over two growing seasons (2020 minor and 2021 main season) in Buea, Cameroon. Two tillage practices–i.e., zero-tillage and conventional tillage with ridge formation and three fertilizer treatments—i.e., no fertilizer, synthetic fertilizer (urea), and organic fertilizer (composted municipal solid waste), were factorially combined in a split-plot design with three replications. Fertilizer was applied at a rate of 100 kg N ha-¹. The hybrid maize cultivar CMS 8704 was used. GHG emissions were measured using the static flux chamber method, and flux rates were calculated with the HMR package in R software. Results showed that tillage and fertilizer types significantly (p<0.05) influenced seasonal cumulative CO2, N2O, and CH4 emissions. Synthetic fertilizer treatments produced the highest cumulative N2O emissions, particularly under zero-tillage in 2020 and conventional tillage in 2021. Conventional tillage paired with organic fertilizer yielded the highest CO2 emissions across both seasons, while methane fluxes were low and largely negative across treatments, indicating that the volcanic upland soils acted as CH4 sinks. Application of synthetic fertilizer increased GWP by 20% and 322% under zero tillage in the 2020 and 2021 seasons, respectively. Under conventional tillage, GWP decreased by 15% in 2020 but sharply increased by 295% in 2021, highlighting season-specific effects. Although treatment effects were not significant (P>0.05) on maize yields in 2020, the highest yield (3.06 t/ha) occurred under conventional tillage without fertilization. Fertilizer type and its interaction with tillage significantly (P<0.05) influenced yields in 2021, with the highest yield under conventional tillage with synthetic fertilization (6.15 tons/ha). However, conventional tillage treatment without fertilization produced the highest yield (3.06 t/ha) in 2020 and the lowest GHGI (12.04 kg CO2-eq t-¹). In 2021, zero tillage treatment without fertilization resulted in a high yield (5.56 t/ha) with the lowest GHGI (2.15 kg CO2-eq t-¹). The results suggest that in Buea’s minor growing season, conventional tillage with or without organic fertilization reduced GHG emissions without compromising yields, while in main seasons, zero tillage without fertilization offered the most favorable yield-emission balance. This study highlights the importance of context-specific soil and nutrient management strategies for sustainable agriculture and climate change mitigation. Findings provide valuable data for national GHG inventory reporting and inform agronomic practices in tropical upland agricultural systems.
1 Introduction
Balancing agricultural productivity with environmental sustainability is crucial for global food security and climate-change mitigation (1). Agricultural production together with agriculture-induced land-use change and land degradation contribute significantly to greenhouse gas (GHG) emissions, accounting for up to 24% of total global anthropogenic emissions (2). Specifically, agricultural soils are major sources of GHGs, responsible for about 60% of nitrous oxide (N2O) and 50% of methane (CH4) emissions from human activities (3). In cropland systems, tillage and fertilizer management directly influence soil GHG emissions (4). As demand for agricultural land increases with population growth, these emissions are expected to rise (5). However, significant knowledge gaps still persist on the GHG mitigation potential of agronomic practices and their effects on crop yields in sub-Saharan African countries, including Cameroon.
Tillage, a fundamental agricultural practice, involves mechanically manipulating soil to prepare it for planting. Tillage can overcome soil-related constraints. However, if not well managed tillage may lead to adverse effects such as soil-structure degradation, loss of organic matter, and increased GHG emissions (6). In cropland ecosystems, tillage practices can influence soil CO2 emissions by accelerating the decomposition of organic matter, increasing microbial activity, and altering soil temperature (7). For N2O emissions, tillage enhances aeration and nitrogen availability and disrupts soil microbial communities, directly or indirectly impacting N2O emissions (8). Additionally, tillage can affect CH4 emissions by increasing aeration and oxygen availability, thereby disrupting anaerobic conditions and altering microbial communities (9).
Nitrogen (N) fertilizers are commonly applied in large quantities to boost crop production worldwide. From 2015 to 2020, global N fertilizer use increased by 1.5% annually, from 175 Tg N yr−1 to 188 Tg N yr−1 (10). Excessive application beyond crop requirements leads to significant environmental problems, including soil and water degradation, as well as increased GHG emissions (11). Synthetic nitrogen fertilizers are a major contributor to N2O emissions from agricultural soils through the enhancement of microbial activity, which accelerates nitrification and denitrification processes (12). Their use also causes watershed pollution, and nitrate leaching, leading to eutrophication. Additionally, overuse of these fertilizers can elevate soil CO2 emissions by disturbing soil structure, degrading organic matter, and altering microbial communities. The impact of N fertilizer on CH4 emissions is complex and depends on factors like fertilizer type and soil management practices (13). Furthermore, conventional fertilizer recommendations, primarily calibrated for tillage-based systems, may not be suitable for conservation agriculture and different fertilizer management practices may perform differently under different tillage regimes.
According to Cameroon’s 2021 updated Nationally Determined Contribution (NDC) report, agriculture employs nearly 60% of the population and is a key sector of the economy, contributing 23% to its gross domestic product (GDP). However, agriculture is also the largest source of GHG emissions, accounting for 69% of the total, with 24,074.61 Gt CO2 Eq (14). Given the country’s commitment to reducing its carbon footprint by 35% by 2030, agriculture presents a significant opportunity for GHG emission reduction. The NDC emphasizes promoting agricultural practices that enhance production while reducing emissions as a crucial strategy to achieve this goal.
The United Nations Framework Convention on Climate Change (UNFCCC) has established guidelines for reporting GHG emissions to the Intergovernmental Panel on Climate Change (IPCC). However, many sub-Saharan African countries, including Cameroon, lack the country-specific data needed for accurate national GHG accounting in agriculture (15). This data scarcity poses a significant challenge, especially with the upcoming shift from Biennial Updated Reports to Biennial Transparency Reports under the Enhanced Transparency Framework starting in 2025. As a result, Cameroon struggles to effectively measure, monitor, and report GHG emissions from agricultural systems, as required under the Paris Climate Agreement, which the government ratified in 2016.
Previous research on agriculture and climate change in Cameroon has primarily focused on adaptation strategies and assessing the impacts of climate change on agricultural systems (16–18). The knowledge of how agronomic practices such as zero tillage and organic fertilizer impact GHG emissions and crop productivity in Cameroon remains limited. This study aims to address this knowledge gap by investigating the specific case of Buea, Cameroon, and exploring the complex interactions between tillage and fertilizer management and their consequences on soil GHG emissions, global warming potential (GWP), maize yield and greenhouse gas intensity (GHGI). These farm management practices are common across most agroecological zones in Cameroon. We hypothesize that agronomic practices such as reduced tillage and organic fertilizer significantly influences soil greenhouse gas (GHG) emissions, GWP, maize yields and GHGI. This research is highly relevant not only to the local context of Buea but also to sustainable agriculture in tropical regions. By examining tillage, fertilizer application, and their interaction and influence on soil GHG emissions, the study’s findings can inform policy, guide agricultural practices, and enhance Cameroon’s GHG reporting to the UN, using locally aggregated data. This contributes to global climate-change mitigation efforts. The following sections of the paper will detail the methodology, results, and discussions, providing an in-depth analysis of the impacts of tillage and fertilizer types on soil GHG emissions, GWP, crop productivity and GHGI in Buea, Cameroon.
2 Materials and methods
2.1 Study area
The field experiment was conducted at the teaching and research farm of the Department of Environmental Science, University of Buea, situated between latitudes 4° 03’N and 4° 12’N of the equator and longitudes 9° 12’E and 9° 20’E of the Greenwich Meridian (19). The University of Buea, located in the capital of Cameroon’s Southwest region, lies along the eastern slopes of Mount Cameroon (Figure 1).
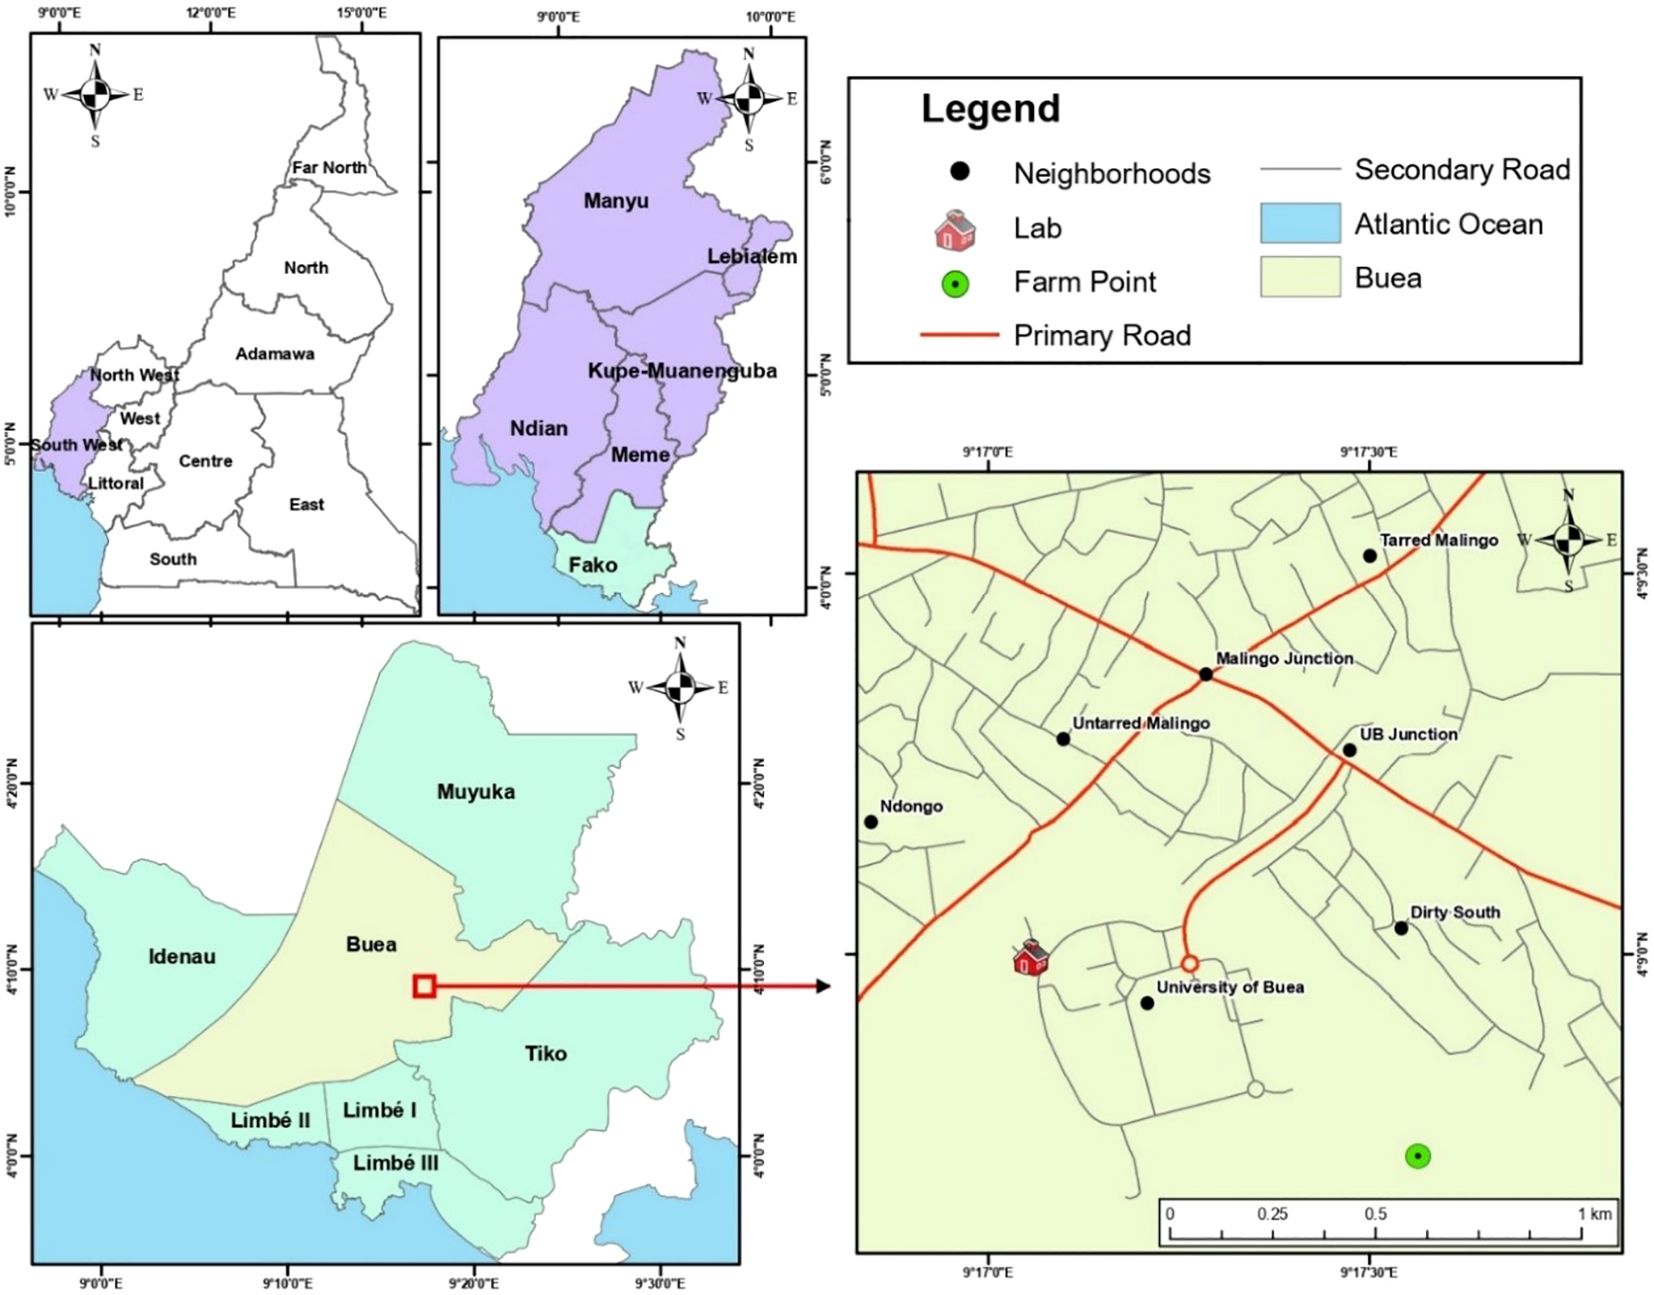
Figure 1. Study area map– illustrating the location of the Southwest Region within Cameroon, the position of Buea within the Southwest Region, and the location of the University of Buea campus.
Buea is subject to a humid climate with two main seasons: the rainy season from mid-March to mid-October and the dry season from mid-October to mid-March. The average temperature in March is 28.7 °C, while July sees the lowest average temperature at 17.3 °C (20). Precipitation varies significantly; December is the driest month, receiving only 29 mm of rain, while August is the wettest, with an average of 488 mm (21). Buea has two growing seasons each year: the main season, from March to July, and the minor season, from September to December. The main growing season receives significantly more precipitation that the minor season. Buea soil is primarily of recent origin, formed mostly on young volcanic rocks. They are black, well-drained due to the hilly terrain, and rich in nutrients (22, 23). The region’s humid tropical climate and nutrient-rich volcanic soils provide ideal conditions for cultivating crops like maize, beans, groundnuts, tomatoes, and cabbage (19). The study site soil properties are presented in Table 1 (presented in section 3.1).

Table 1. Physico-chemical properties of the soil of the study site.
2.2 Experimental design and treatments
The field experiment was conducted during the 2020 minor growing season (September to December 2020) and the 2021 major growing season (March to early July 2021). Two tillage systems and three fertilizer management practices were factorially combined in a split-plot design with three replications, giving a total of 18 sub-plot of 5 m length and 5 m width each (Figure 2). The main plot factor was the tillage system (zero-tillage (NoTill) and conventional tillage (Till)), and the subplot factor was soil amendment types (organic (ORG), inorganic (SYN), and control/no amendment (CON)). This resulted in six treatment (Figure 2) combinations as follows; NoTill + SYN, NoTill + ORG, NoTill + CON, Till + SYN, Till + ORG, and Till + CON, defined as follows;
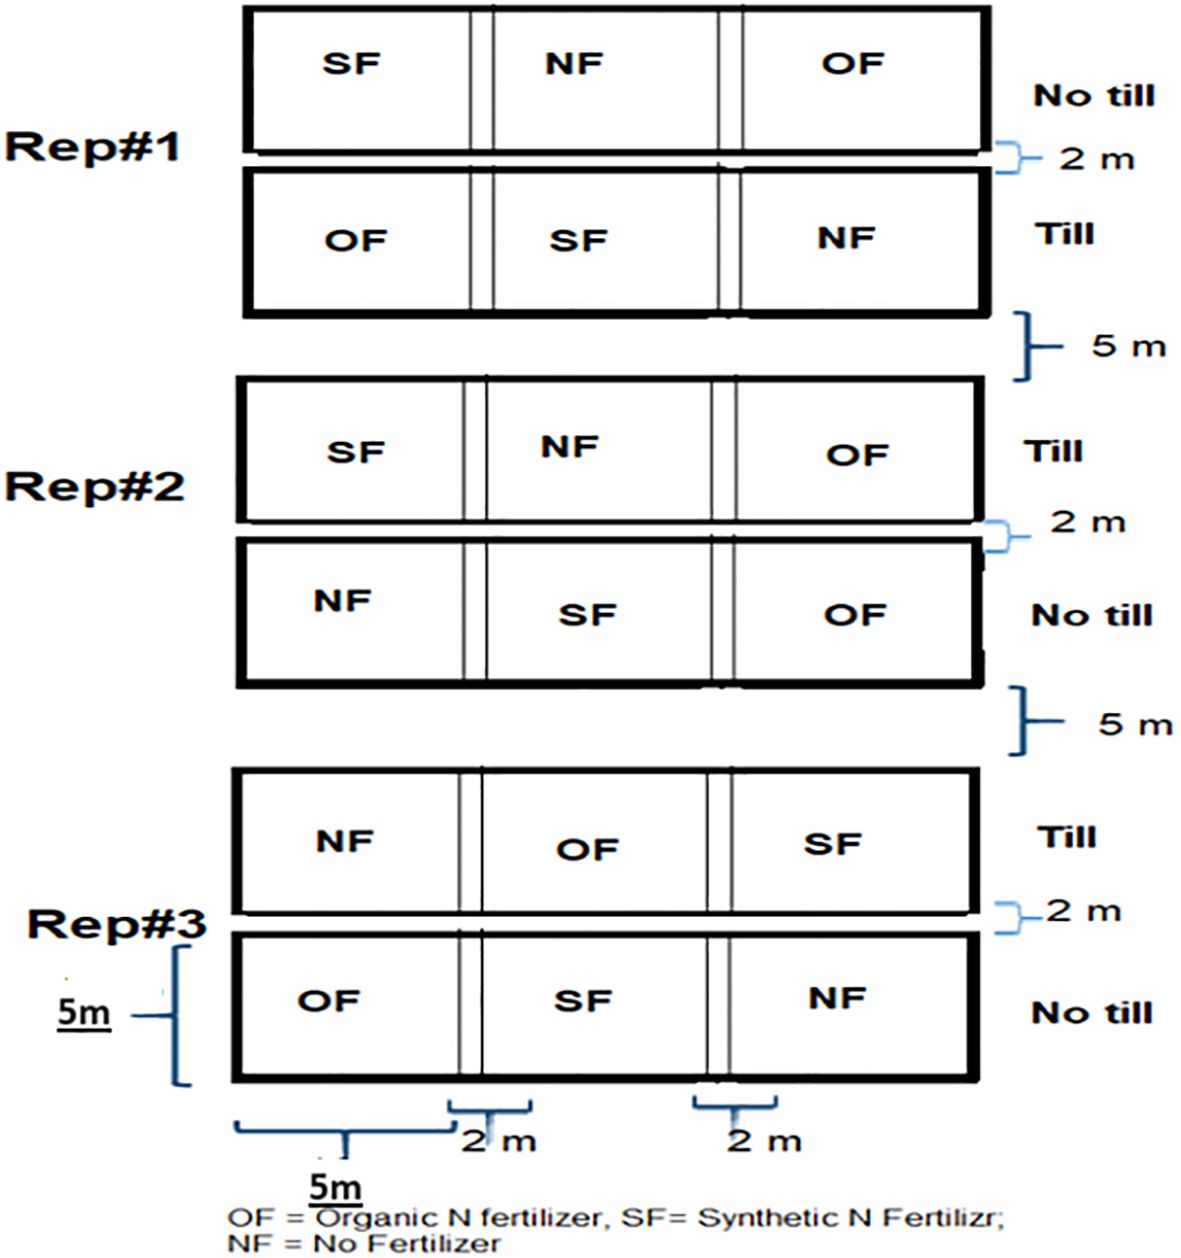
Figure 2. Experimental layout in a split plot design.
i. NoTill + CON: Plots under zero-tillage with no fertilization.
ii. NoTill + ORG: Plots under zero-tillage with organic fertilization.
iii. NoTill + SYN: Plots under zero-tillage with synthetic fertilization.
iv. Till + CON: Plots under conventional tillage with no fertilization.
v. Till + ORG: Plots under conventional tillage systems with organic fertilization.
vi. Till + SYN: Plots under conventional tillage systems with synthetic fertilization.
Prior to the experiment, the physicochemical properties of the soils in the study area were analyzed using standardized methodologies. Nitrogen fertilizer was applied at a rate of 100 kg/ha, as recommended by (19)for volcanic soils in Buea, Cameroon. Composted municipal solid waste was used as organic fertilizer. The nitrogen concentration of the compost was verified to match that of urea. Based on the compost N content (11%), we applied compost at the rate of 2.275 kg per 25m2 plot to provide 100 kg N h-1, as recommended by (19). For Urea, which contains 46% of N, the application rate was 0.55kg per plot to achieve the same N rate equivalence. The same fertilization rate and timing were used in both seasons with application made one month after planting through broadcasting. The test crop was the hybrid maize CMS 8704, obtained from the Regional Delegation of Agriculture in the Southwest Region of Cameroon. A seeding rate of 45.55 kg/ha was used, with 114 g of maize seeds planted per 25 m² subplot. The experiment was conducted in a field that had been under mixed-cropping, primarily maize and cassava during the previous three years. Before establishing the experimental treatments, all remaining plant residues were cleared from the plots.
2.3 Measurement of soil GHG emissions
The static gas chamber method, adapted from (24), was employed for measuring GHG emissions. In-situ closed cover chambers were used to measure N2O, CH4, and CO2 fluxes, using a chamber design adapted from Neville and Kevin of the W.K. Kellogg Biological Station (KBS) in S.W. Michigan, USA.
The chambers used were Letica 3.5-gallon pails (359OSTWHOO), chosen for their white color to reflect sunlight and minimize heat buildup. Equipment included an O-Ring Seal - Letica tear band lid (5LTBWHOO) as the chamber lid; Labco Extainer tubes (5.9 ml) as sample vials, a Becton Dickinson Vacutainer serum vial (10 ml) (366430) as septa, and a Becton Dickinson Luer Lok Tip (20 ml) (309604) as a syringe. Needles for the syringe were Becton Dickinson (22G 1”) (305155).
The chambers were inserted into the soil using a guide hole to ensure proper placement. A board was placed on top and gently tapped around the edges to insert the chamber, minimizing soil disturbance. This was done at least one day before sampling to allow the soil to settle. If gaps formed between the chamber and soil, they were gently closed to ensure a good seal. Once positioned, the chamber height above ground was measured from four directions, and the average height and internal diameter were used to calculate the chamber volume (headspace). A standard stopwatch was used for timing and a data recording sheet was used to document basic field parameters related to the study such as sampling time and weather conditions during sampling.
2.3.1 Gas sampling
Gas samples were collected in the early morning, between 8:30 AM and 10:00 AM, during the transitional period between the cooler nighttime temperatures and the warming daytime temperatures. Gas samples were collected four times at 15-minute intervals following chamber closure to track changes in gas concentration over time. Sampling involved inserting a 20 mL syringe through the septa to withdraw gas, which was then transferred to a pre-evacuated glass vial sealed with a butyl rubber septum for storage. Samples were kept at room temperature, placed in zippered bags, and shipped to the USDA Northern Plains Laboratory in Sidney, Montana, USA, for gas chromatography analysis. Samples were analyzed approximately two to three weeks after their collection. Sampling was done weekly, with frequency reduced to biweekly and triweekly towards the end of the growing season. Gas sampling was also adjusted to capture short-term fluxes triggered by farm management activities like fertilizer application and manual weeding. In the first growing season, daily GHG samples were collected on nine different dates, while in the second season, GHG samples were collected on 12 different dates.
Auxiliary data were collected to understand their impact on gas fluxes (24). Soil temperature and moisture content were recorded during the flux measurement period. Soil temperature was measured with a thermometer inserted 2.5 to 7 cm into the soil, with readings taken after two minutes for stabilization. Soil moisture was assessed by oven-drying soil samples at 105 °C for 24 hours or until a constant mass was achieved.
2.3.2 Laboratory analysis and flux rate calculation
Gas samples were analyzed at the USDA Northern Plains Agricultural Research Laboratory in Sidney, Montana, using a gas chromatograph, following strict quality control and calibration procedures. Samples were inspected upon arrival, and those with broken vials were rejected. Sample details were registered in an MS Excel spreadsheet. After analysis, flux rates were calculated by measuring the increase in gas concentration within the chamber over the closure time, relative to the chamber’s cross-sectional soil area. This calculation was performed using the HMR package in R Studio, with results expressed in μg ha-¹ d-¹ for N2O and CH4, and mg ha-¹ d-¹ for CO2.
The flux rate at each sampling time was calculated by integrating the following parameters:
2.3.2.1 Volume of the bucket chamber headspace in liters
The volume was calculated by using the following Equation 1:
Where V = headspace volume in L and Ht. = the height in centimeters.
a. Exact sampling time in hours: The initial sampling time represents 0, from which subsequent time intervals (15, 30, and 45 minutes) were computed. This represents 0, 0.25, 0.50, and 0.75hrs.
b. Concentration of gas in the headspace sample units were in ppm volume or microliters of gas per L.
c. Air temperature at time of sampling in degrees was measured using an air thermometer. The temperatures were converted to degrees Kelvin using the following formula (Equation 2 (8)).
Kelvin is ideal for scientific calculations, where absolute temperature values are needed for consistency, especially in gas-related equations.
The HMR package in R was used to calculate the flux rates for all plots. Data visualization, depicting the impacts of tillage and fertilizer types on soil GHG emissions, was accomplished using the ggplot2 package. Additionally, the linear interpolation function in R was employed to calculate cumulative GHG emissions throughout the growing season. An analysis of variance (ANOVA) test was performed to assess significant differences in GHG emissions among the experimental treatments, and the least-significant difference (LSD) test was used to compare mean GHG fluxes. Correlation analysis was also conducted in R to examine the relationship between soil moisture and temperature and the GHG emissions.
2.4 Maize yields under different tillage systems and fertilizer types
The study employed the methodology of (25) to assess the effects of conservation agricultural practices on maize (Zea mays) grain yield. Maize yield was measured in tons per hectare (T/ha) at constant dry weight. Harvestable plants were counted per plot, and five representative cobs were sampled, threshed and oven-dried at 79°C to constant mass. Yield per plot was calculated by multiplying the average grain weight per cob by the number of harvestable cobs, then converting to ton per hectare. Descriptive statistics and ANOVA were conducted in R to evaluate the impact of different tillage systems and fertilizer types on maize yield.
2.5 Calculation of global warming potential and greenhouse gas intensity
According to the (26), the global warming potentials (GWPs) of CH4 and N2O over a 100-year time horizon are 25 and 298, respectively, relative to CO2, which is assigned a value of 1. Based on this, the GWP in this study was estimated by multiplying the cumulative seasonal GHG emissions of CH4 and N2O by their respective GWP factors, following the method of (27). The results are reported as kilograms of CO2-equivalents per hectare (kg CO2-eq ha-¹). Additionally, the greenhouse gas intensity (GHGI) was determined as the ratio of GWP to maize grain yield, following the method described by (28).
3 Results
3.1 Physico-chemical properties of the study site
The study site soil is clay-rich (49% clay, 33% silt, 18% sand), with very low salinity (EC 0.04 mS cm-¹) and low bulk density (1.15 g cm-³), indicating good structure. It is moderately acidic (pH-H2O 5.8; pH-KCl 4.7), suggesting appreciable exchangeable acidity. Organic status is moderate (total C 13.3%; soil organic C 3.0%), yet total nitrogen is extremely low (0.01%), implying N limitation. Available phosphorus is also low (4.10 mg kg-¹). The cation pool shows modest Ca (1.22), Mg (0.86), and relatively high K (1.15) with negligible Na (0.01) and a low-to-moderate CEC (8.48 cmolc kg-¹), consistent with nutrient-responsive conditions (Table 1).
3.2 The interaction effects of tillage and fertilizer types on daily GHG emissions (N2O, CO2 and CH4)
On October 13th, 2020, N2O emissions were similar across all tillage and treatment types. However, significant spikes were observed in NoTill + CON and NoTill + SYN five days later (October 18th). These spikes were temporary, as the plots experienced a subsequent drop in N2O emissions by October 25th. By October 30th, one month after tillage and two days after fertilizer application, N2O emissions were relatively higher in plots under synthetic fertilization amendment in both tillage systems (10850 μg ha-1 d-1 and 7940 μg ha-1d-1 for Till + SYN and NoTill + SYN, respectively). One week after, NoTill + SYN recorded a slight drop in N2O emissions but Till + SYN had high spikes. A little over two months after tillage and planting, N2O emissions fluctuated in all plots regardless of tillage and fertilizer types until the end of the growing season in December 2020 (Figure 3). The highest mean N2O emission rate (9032.27 µg ha-1d-1) across treatments was observed in the NoTill + SYN plot, while the lowest (4746.038 µg ha-1d-1) was observed in the NoTill + ORG plot (Table 2). Tillage practices and fertilizer types had no significant effects (p>0.05) on daily N2O emission rates.
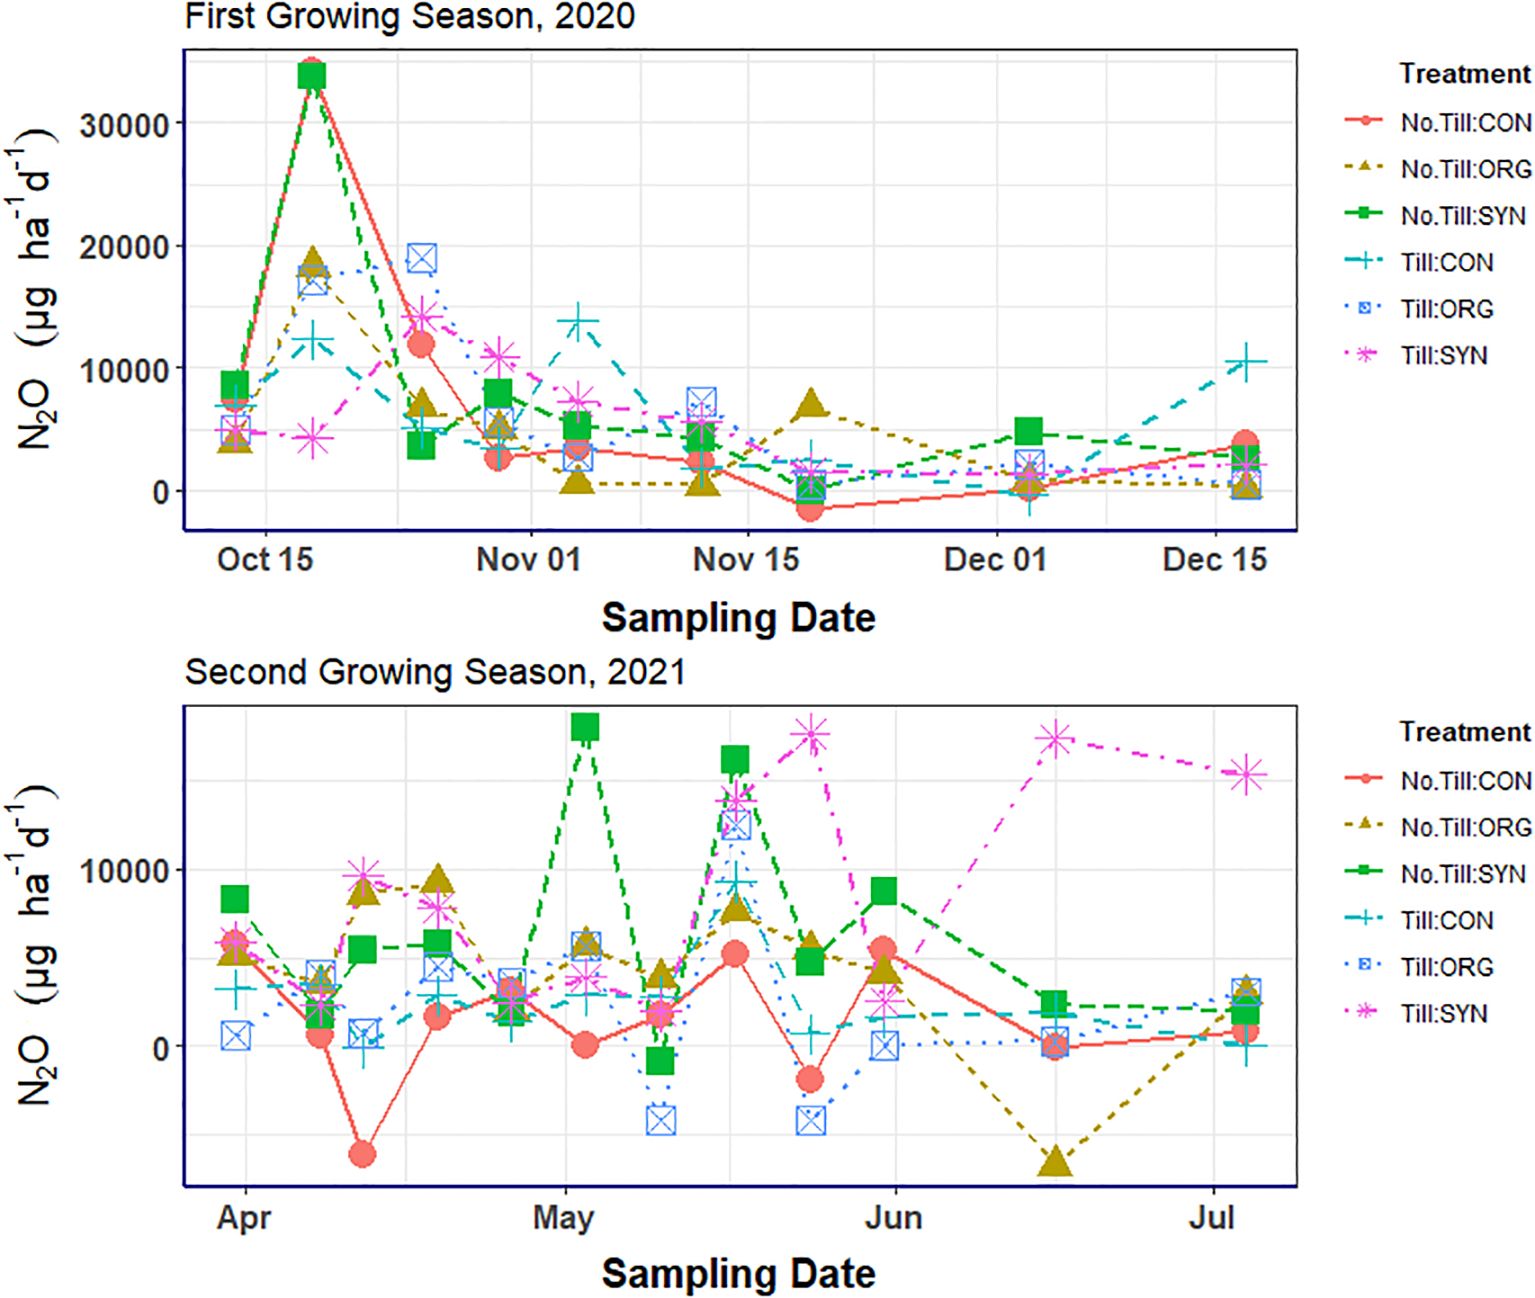
Figure 3. Effects of tillage and fertilizer types on soil N2O emissions in the 2020 and 2021 growing seasons across sample dates.
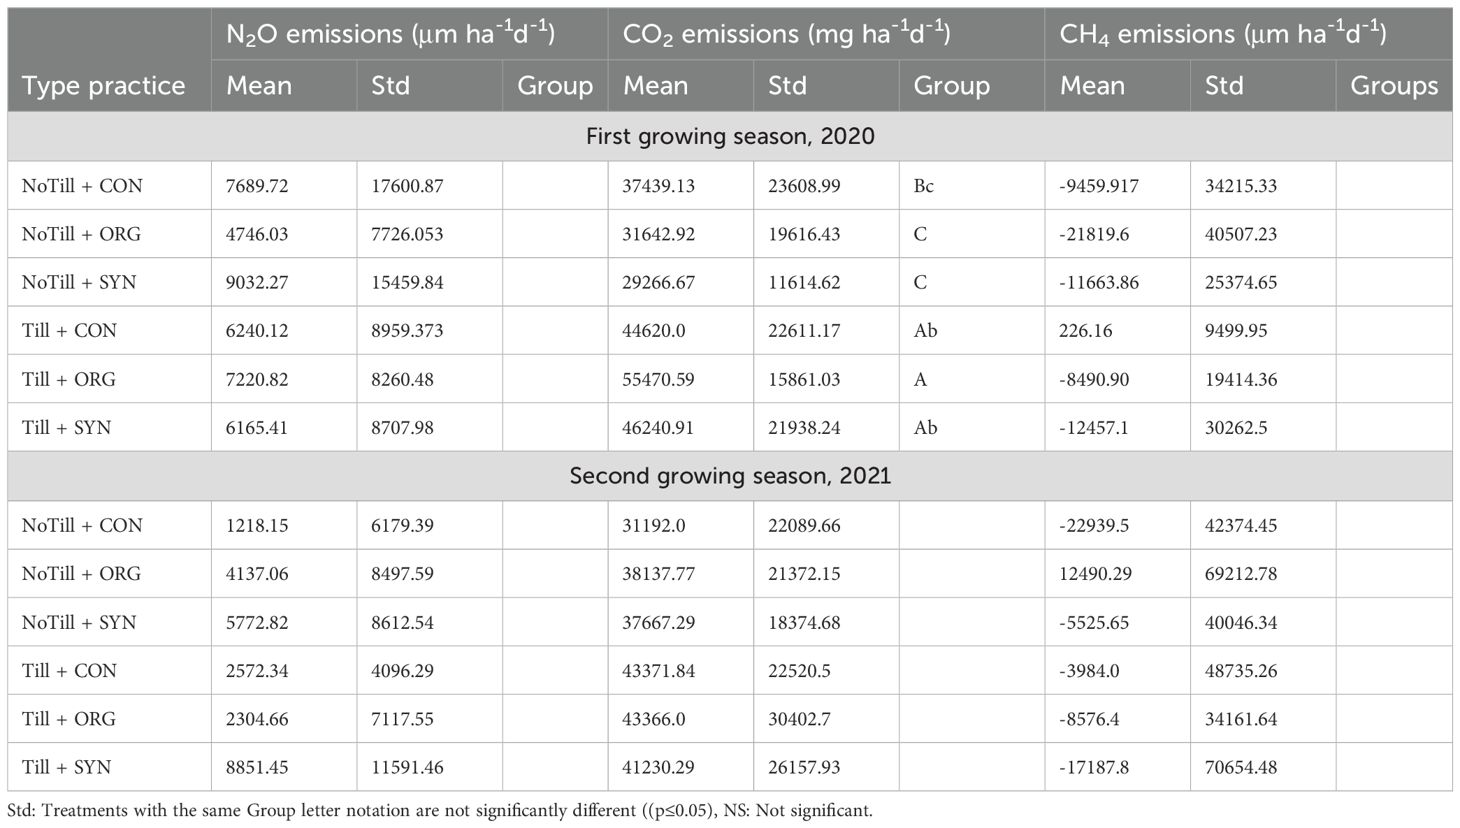
Table 2. Summary statistics showing the interaction effect of tillage and fertilizer types on GHG (N2O, CO2 and CH4) emissions in the 2020 and 2021 growing seasons.
Prior to fertilizer application (first month of the cropping season) in the 2021 season, N2O emissions fluctuated in all plots, regardless of tillage systems. Two days after fertilizer application on May 4th, emissions were highest under NoTill + SYN (18000 μg ha-1d-1). Conversely, plots under NoTill + CON on this date generated the lowest emissions. Between early May and June, emissions fluctuated in all plots, although higher spikes were recorded in plots under synthetic fertilization. From June until the end of the growing season, Till + SYN had higher N2O emissions, which continued until the end of the growing season (Figure 3). The highest average N2O emission (8851.45 µg ha-1d-1) occurred in Till + SYN plots, while the lowest (1218.14 µg ha-1d-1) was recorded in the NoTill + CON plot. Tillage and fertilizer types had no significant (p>0.05) effect on N2O emissions recorded under different treatments (Table 2).
A few weeks after the start of the first growing season when the plots were differentiated just by tillage systems, CO2 emissions exhibited fluctuations in all plots. By October 30th, 2020, two days after fertilization, CO2 emissions peaked at 71600 mg ha-1d-1 in the Till + ORG plots. In early November, CO2 emissions were notably higher in plots under conventional tillage. This pattern persisted throughout the growing season, with plots under conventional tillage (Till + ORG, Till + SYN, and Till + CON) consistently showing higher CO2 emission rates than plots under zero-tillage (NoTill + ORG, NoTill + SYN, NoTill + CON) (Figure 4). Till + ORG plots recorded the highest daily mean CO2 emission (55470.59 mg ha-1d-1) across treatments while the lowest (29266.67 mg ha-1d-1) was recorded in the NoTill + SYN. CO2 emissions across treatments were significantly different (p<0.05). Tillage practice and fertilizer types showed no significant effects (p>0.05) on daily CO2 emission rates (Table 2).
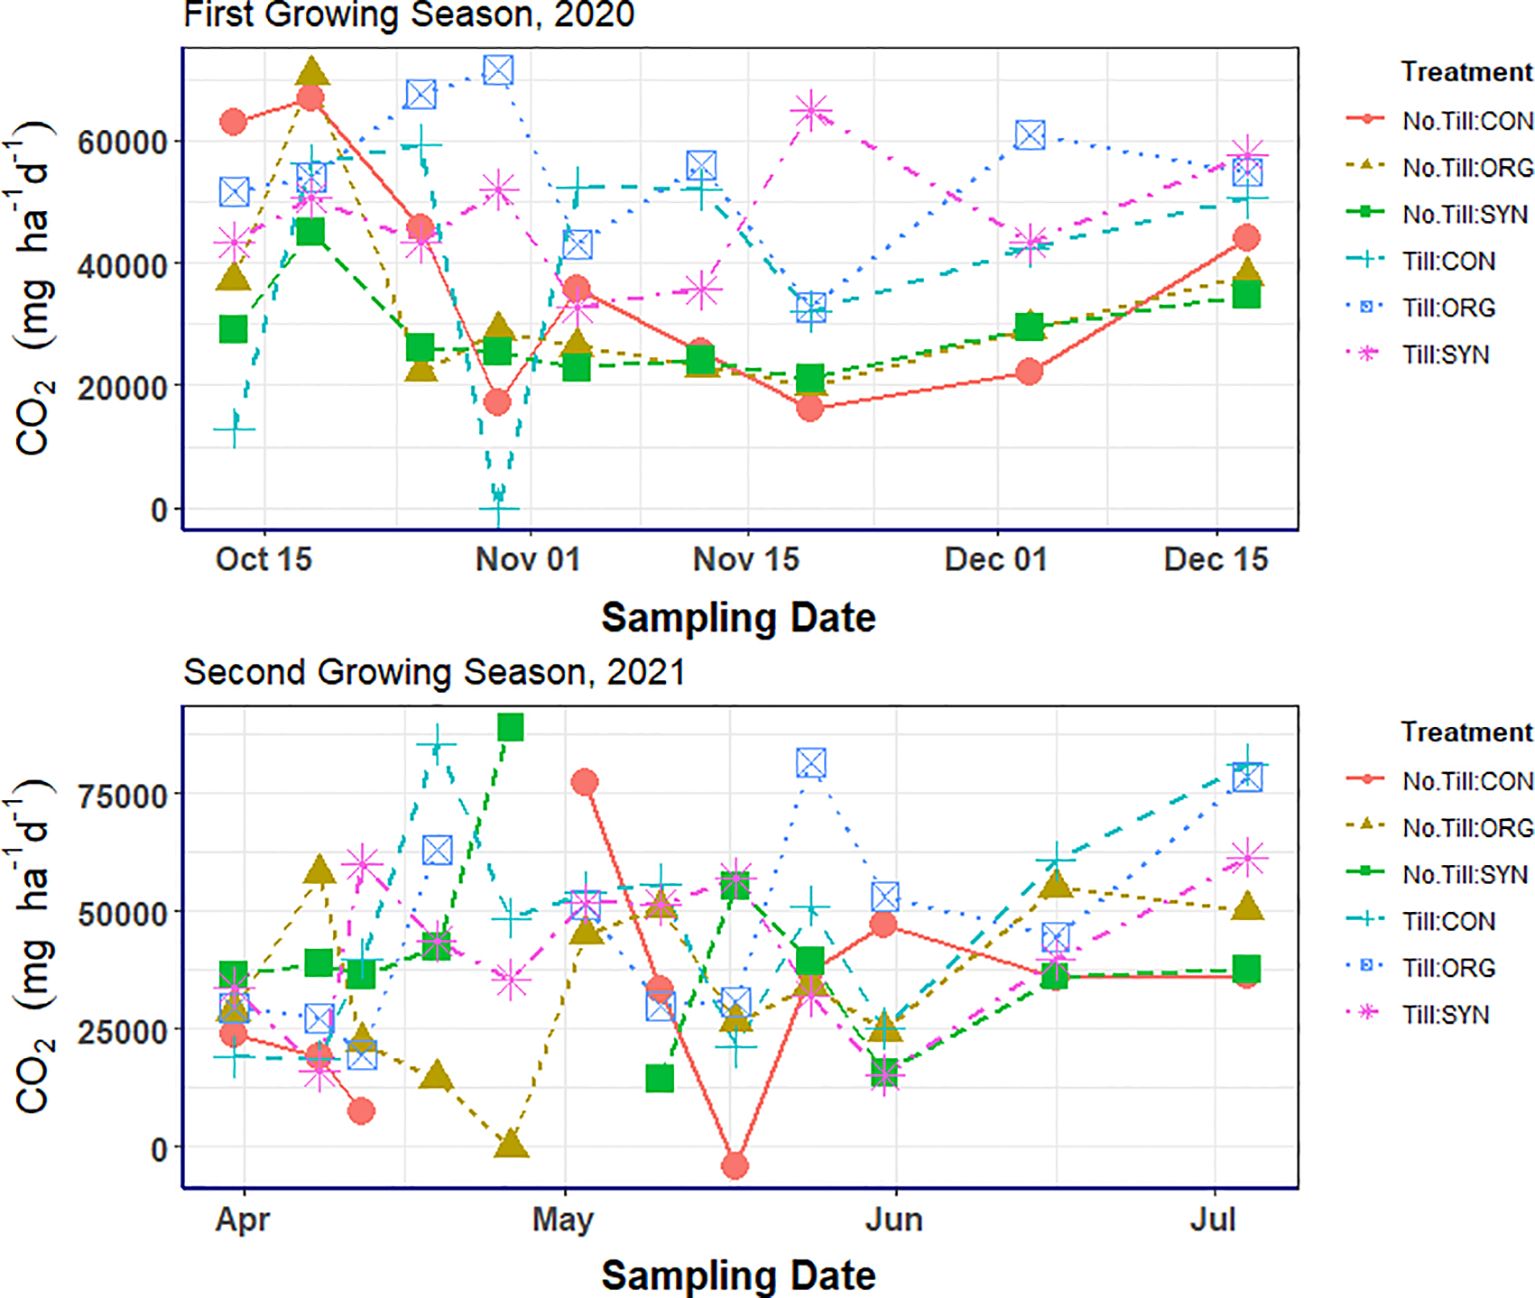
Figure 4. The combined effects of tillage and fertilizer types on daily soil CO2 emissions in the first and second growing season across sample dates.
In the 2021 growing season, there were significant changes in CO2 emissions across all plots with different tillage systems. The application of fertilizer in early May resulted in comparatively higher CO2 emissions in tilled plots. By the end of the growing season, CO2 emissions remained notably higher in all tilled plots (Till + ORG, Till + SYN, and Till + CON) compared to untilled plots (NoTill + ORG, NoTill + SYN, NoTill + CON) (Figure 4). Till + ORG and Till + CON emitted the highest average daily CO2 levels (43–366 mg ha-1d-1 and 43371.84 mg ha-1d-1 respectively), while NoTill + SYN had the lowest (31192 mg ha-1d-1) (Table 2). Tillage systems and fertilizer types used in this study did not significantly affect CO2 emissions in this season.
At the onset of the 2020 growing season, when the plots were distinguished solely by their tillage systems, CH4 emissions were either negative or slightly above zero in all plots, irrespective of their tillage types. After fertilizer application, only the NoTill + CON plot exhibited slightly positive values on October 30th. By November 4th, CH4 emissions remained negative in all plots except for Till + CON, which recorded a slightly positive value. From that point onward, CH4 emission rates were negative in all plots throughout the growing season, except on November 12th, when Till + ORG recorded a positive value (Figure 5). The highest mean daily CH4 emission (226.16μg ha-1d-1) in the sampling period in 2020 occurred under Till + CON while NoTill + ORG had the lowest (-11663.86 μg ha-1d-1) (Table 2). Results showed that the main effects of tillage practice and fertilizer types were not significant (p>0.05).
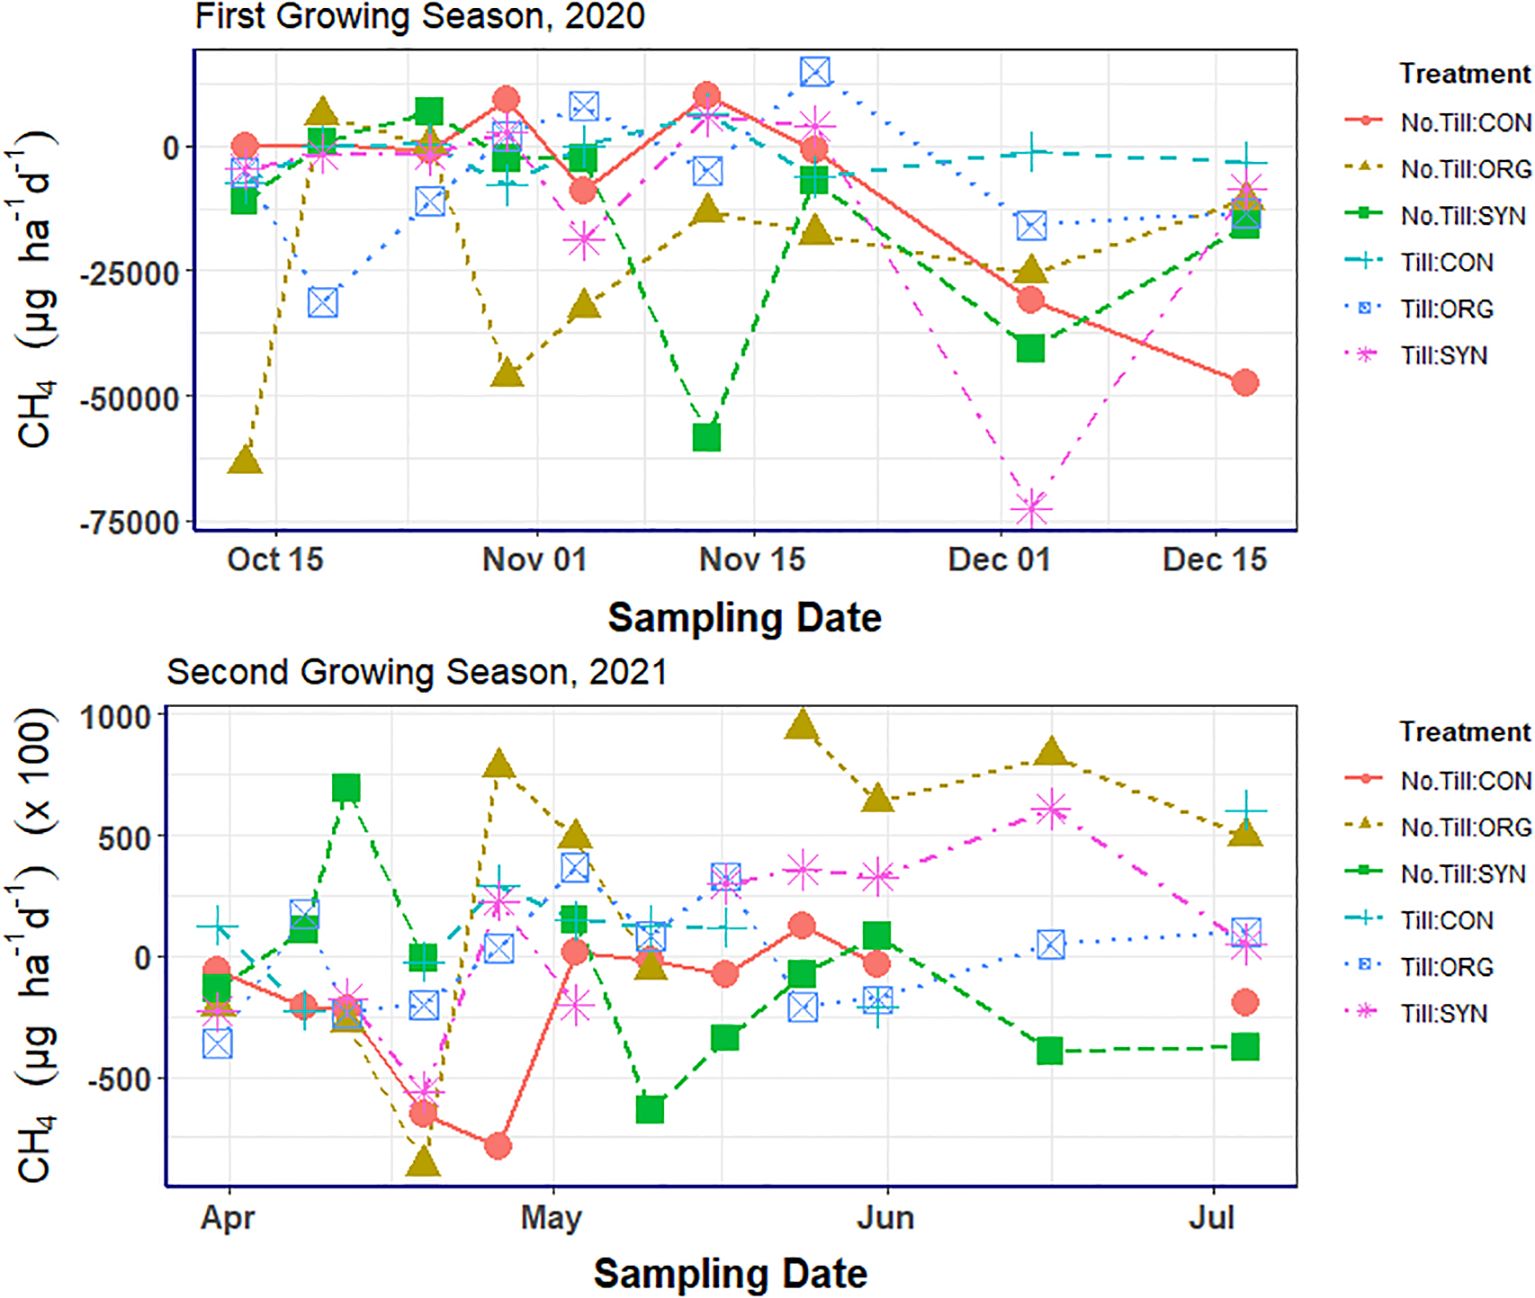
Figure 5. The effects of tillage and fertilizer types on daily soil CH4 emissions in the 2020 and 2021 growing seasons.
At the start of second growing season in April 2021, tillage had little or no effect on soil CH4 emission, as almost all plots recorded negative CH4, except for NoTill + SYN, which exhibited positive values around mid-April. Following fertilizer application in early May, CH4 emissions were 36480 μg ha-1d-1 in Till + ORG. From this period, fluctuations in CH4 emission rates occurred throughout the growing season (Figure 5). In 2021, NoTill + ORG recorded the highest average (12490.29 μg ha-1d-1) CH4 emission rates while NoTill + CON recorded the lowest (-22939.5 μg ha-1d-1). The main effects of Tillage and Fertilizer types on CH4 emission rates were not significant (p>0.05).
3.3 Effects of tillage and fertilizer types on the cumulative GHG (N2O, CO2 and CH4) emissions
Study findings reveal that in 2020 tillage practice and fertilizer types significantly affected total N2O in the cropping year (p<0.05). NoTill + SYN exhibited the highest cumulative N2O emissions (0.128 kg CO2-eq ha-1), while NoTill + ORG had the lowest cumulative emission (0.078 kg CO2-eq ha-1) (Figure 6).
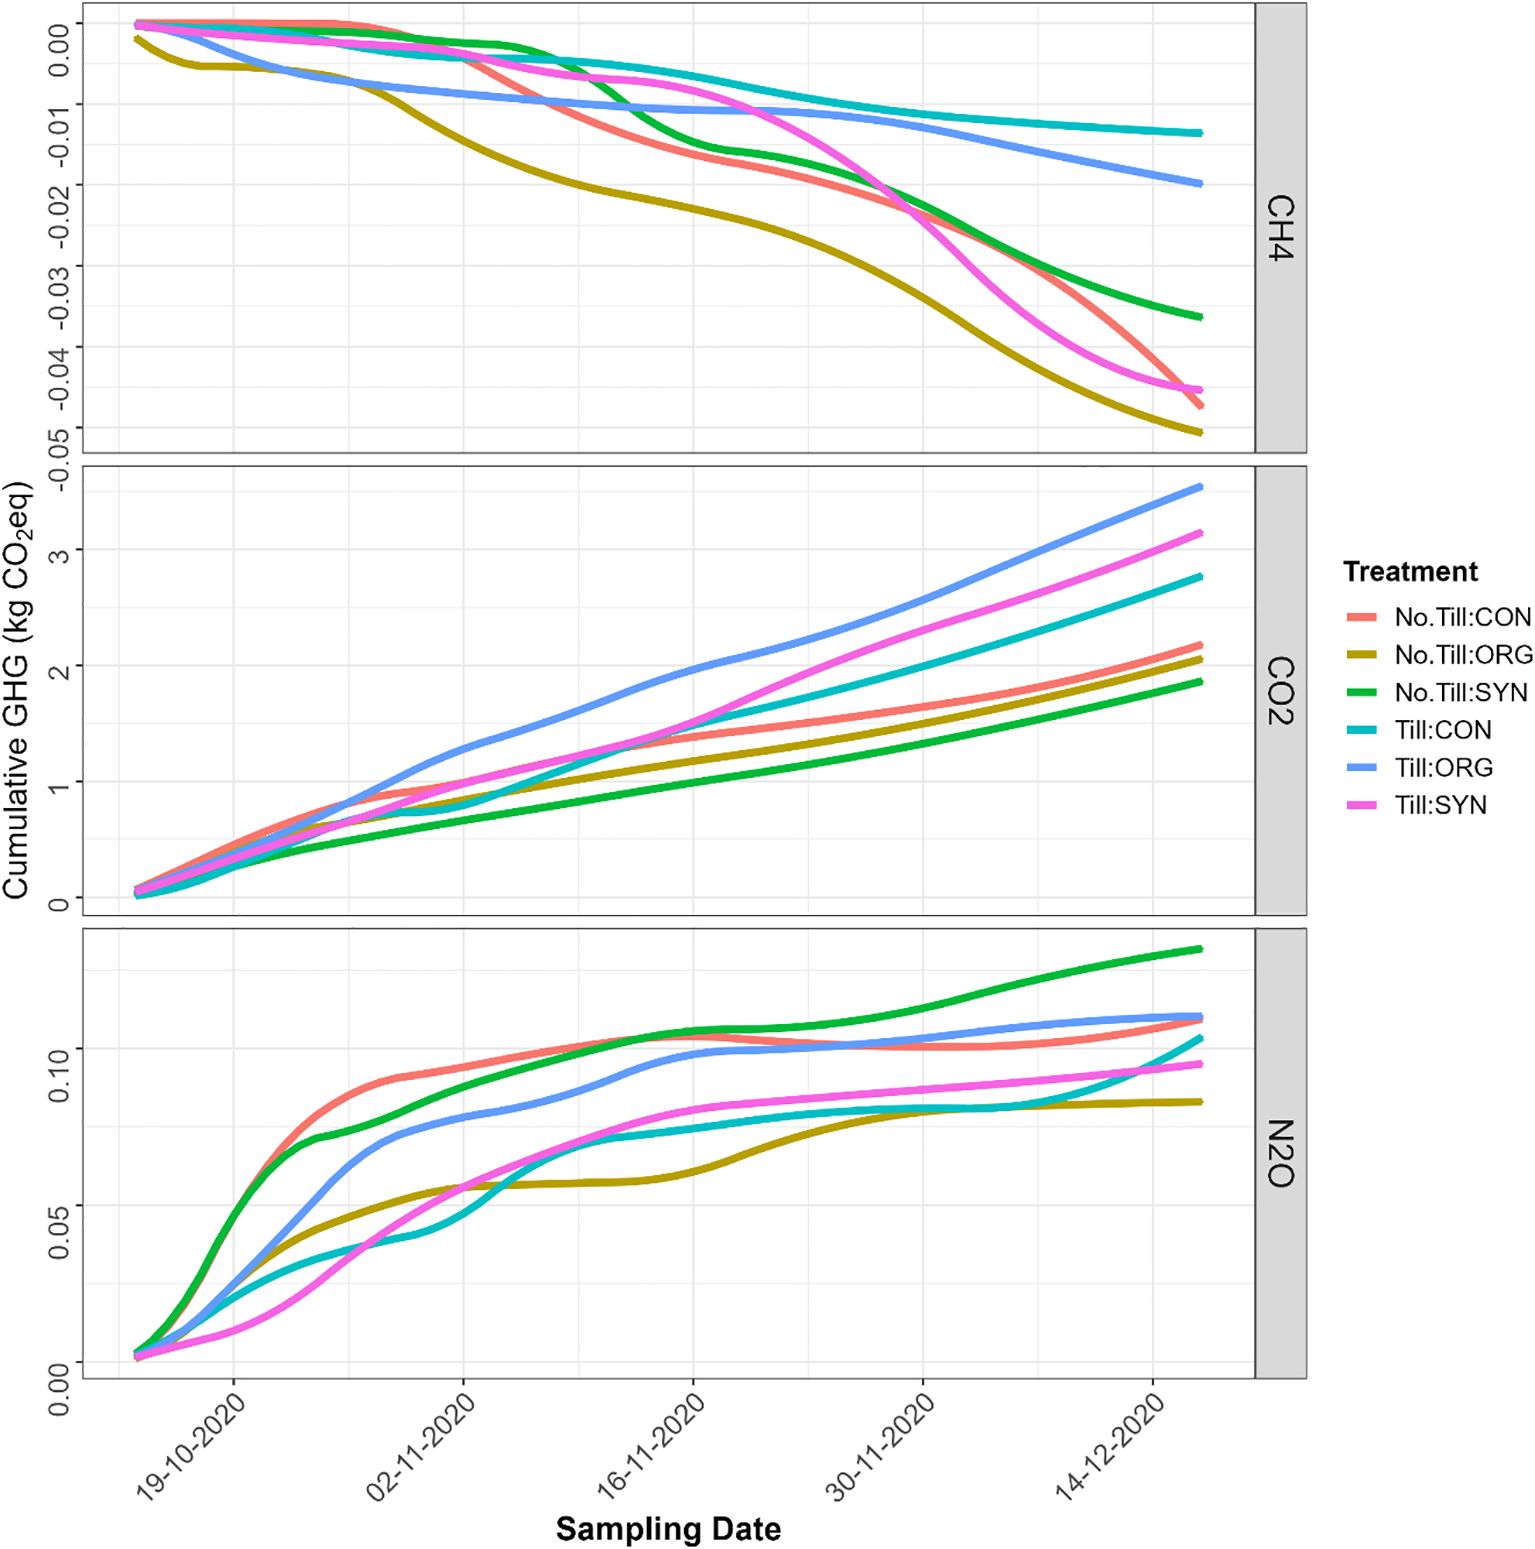
Figure 6. Effects of tillage and fertilizer types on the cumulative growing-season GHG emissions in 2020.
There was a significant difference (p<0.05) in cumulative CO2 emission rates among the different tillage systems and fertilizer types. The highest cumulative CO2 emission of 3.6 kg ha-1 in the first year was observed under Till + ORG, while NoTill + SYN exhibited the lowest cumulative emissions (1.8 kg ha-1) (Figure 6).
For CH4, our result reveal that tillage and fertilizer types significantly (p<0.05) affected cumulative CH4 emission. The highest cumulative CH4 emission were recorded under Till + CON, with a value of -0.004 kg CO2-eq ha-1. NoTill + ORG exhibited the lowest cumulative CH4 emissions at -0.051 kg CO2-eq ha-1 (Figure 6).
In the 2021 study period, the main effects of tillage and fertilizer type were significant (p<0.05) on cumulative N2O emissions. Till + SYN exhibited the highest cumulative N2O emissions (0.267 kg CO2-eq ha-1), while NoTill + CON had the lowest cumulative N2O emissions (0.033 kg CO2-eq ha-1) (Figure 7).
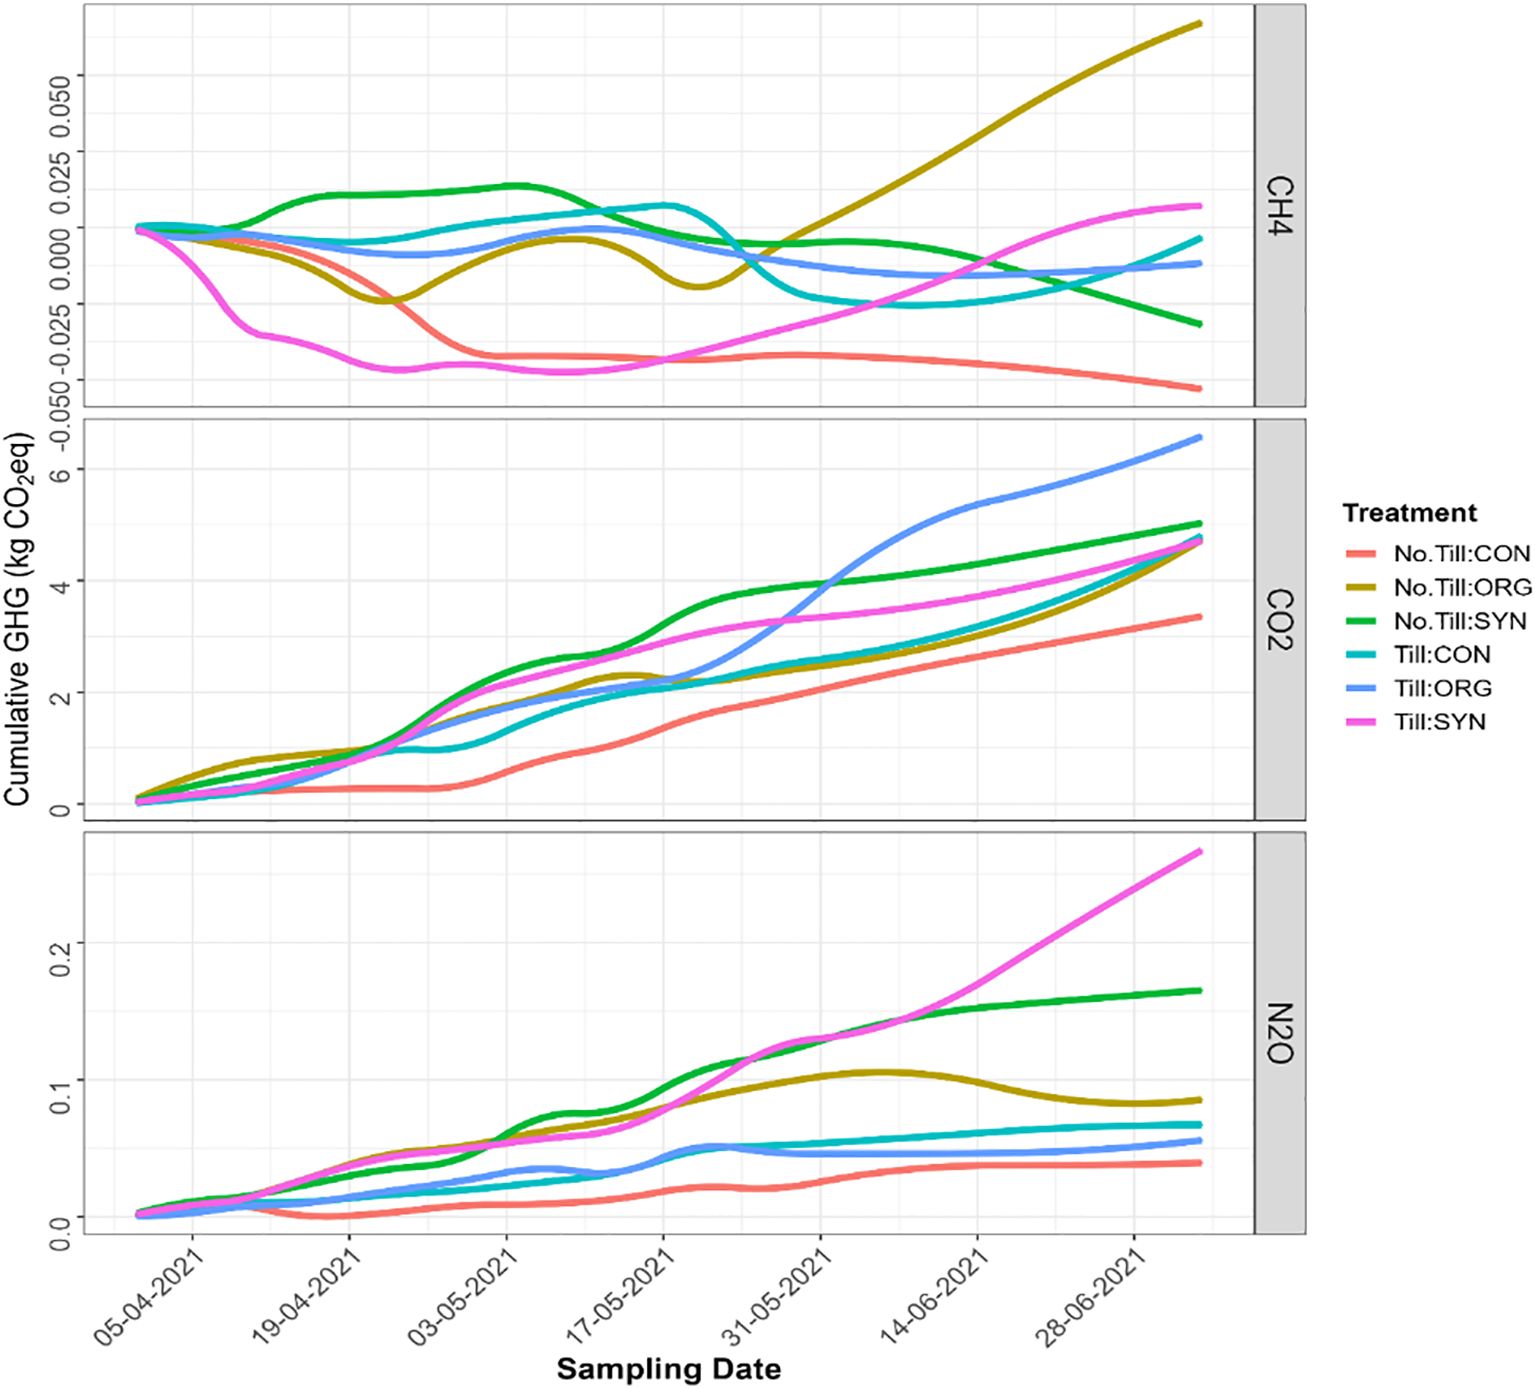
Figure 7. Impacts of tillage and fertilizer types on the cumulative growing-season GHG emissions in the 2021 study season.
Tillage practice and fertilizer types also significantly affected cumulative CO2 emissions (p<0.05).
The highest cumulative CO2 emission rate of 6.8 kg ha-1 was observed in Till + ORG, while NoTill + CON had the lowest value of 3.110 kg ha-1 (Figure 7).
The main effects of tillage and fertilizer type were also significant (p<0.05) on cumulative growing season CH4 emissions. For CH4, the highest cumulative growing season emission of 0.0625 kg CO2-eq ha-1 was observed in NoTill + ORG, while NoTill + CON emitted the lowest cumulative CH4 emissions (-0.04 kg CO2-eq ha-1) (Figure 7).
3.4 Correlation analysis of GHG emissions and environmental variables
Our results revealed weak relationships between GHG emissions and measured environmental variables (Figure 8). N2O emissions exhibited a weak positive correlation with soil temperature (0.07) and almost no correlation with soil moisture (-0.01). CO2 emissions had a very weak positive correlation with soil temperature (0.02) and no correlation with soil moisture (0). Methane emissions also had a weak positive correlation with soil temperature (0.07) and a weak negative correlation with soil moisture (-0.03) (Figure 8).
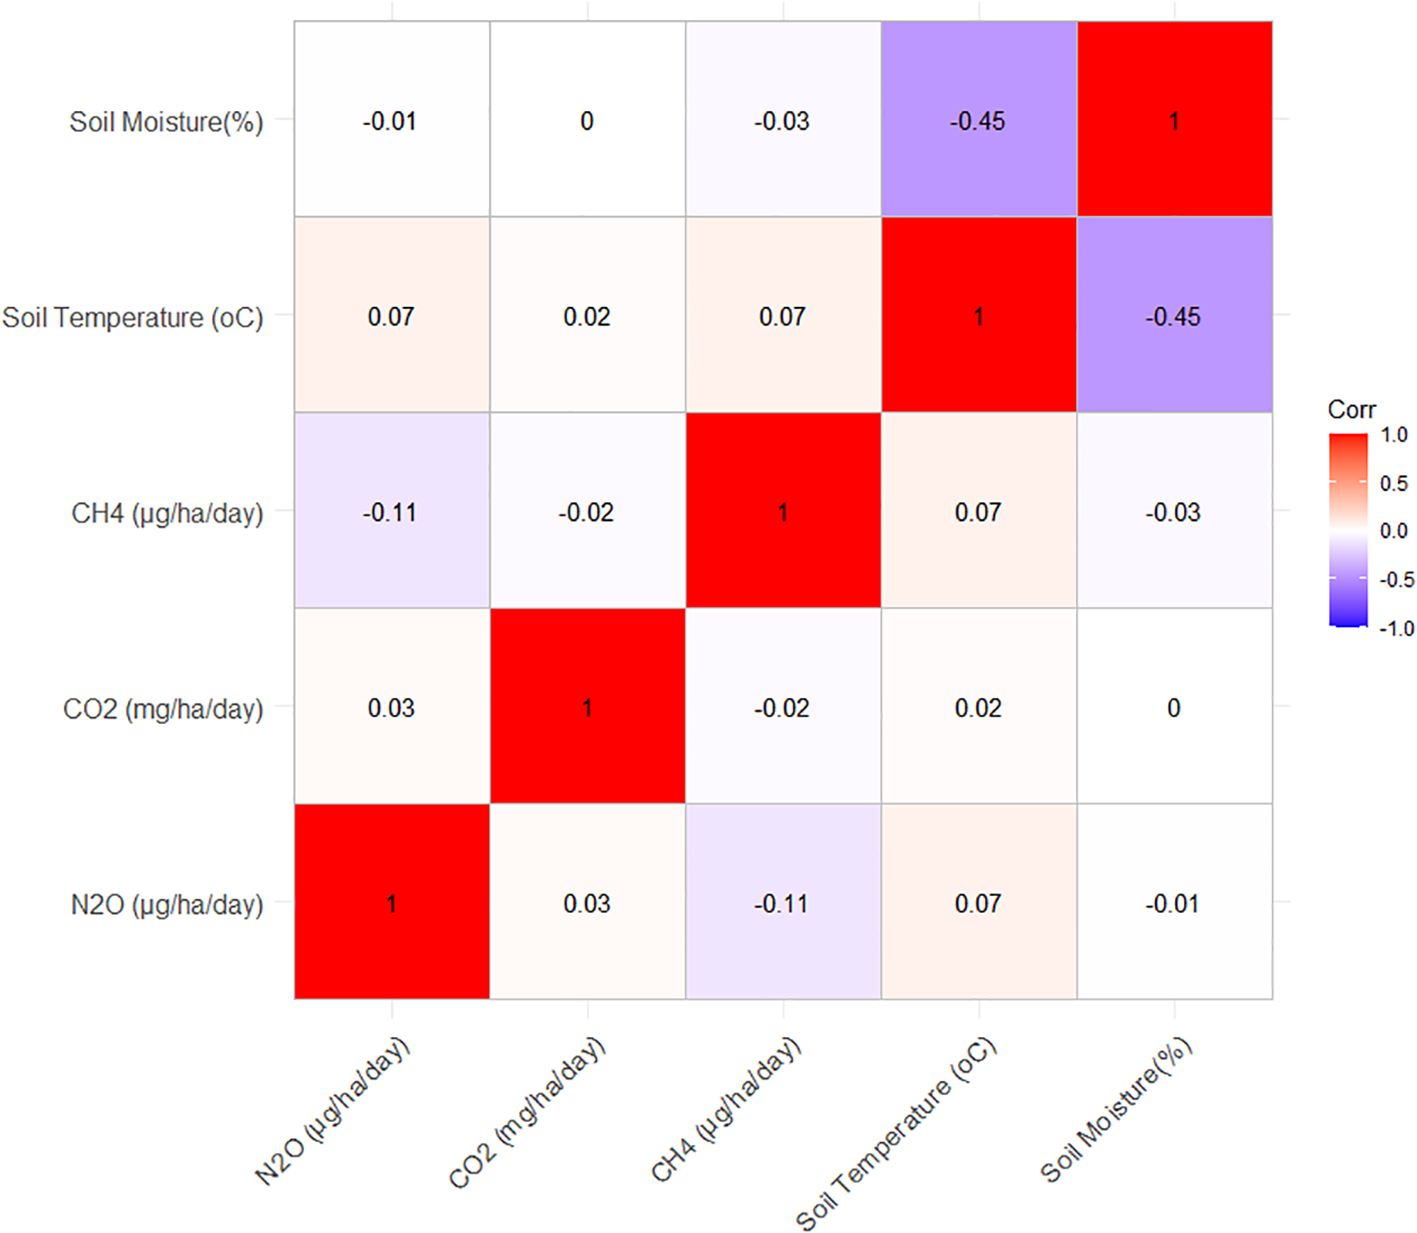
Figure 8. Correlation of GHG emissions and environmental variables.
3.5 Effects of tillage and fertilizer types on maize yields
In the 2020 growing season, there were no statistically (P >0.05) significant effects of the interaction between tillage and fertilizer types on maize yields, although differences in mean yield were observed among treatments. The highest mean maize yield that year was recorded in the conventional tillage without fertilizer treatment (Till+CON), at 3.06 T ha-1, while the lowest yield (1.44 T ha-1) was observed in the no-tillage with organic fertilizer treatment (No Till +ORG) (Table 3).
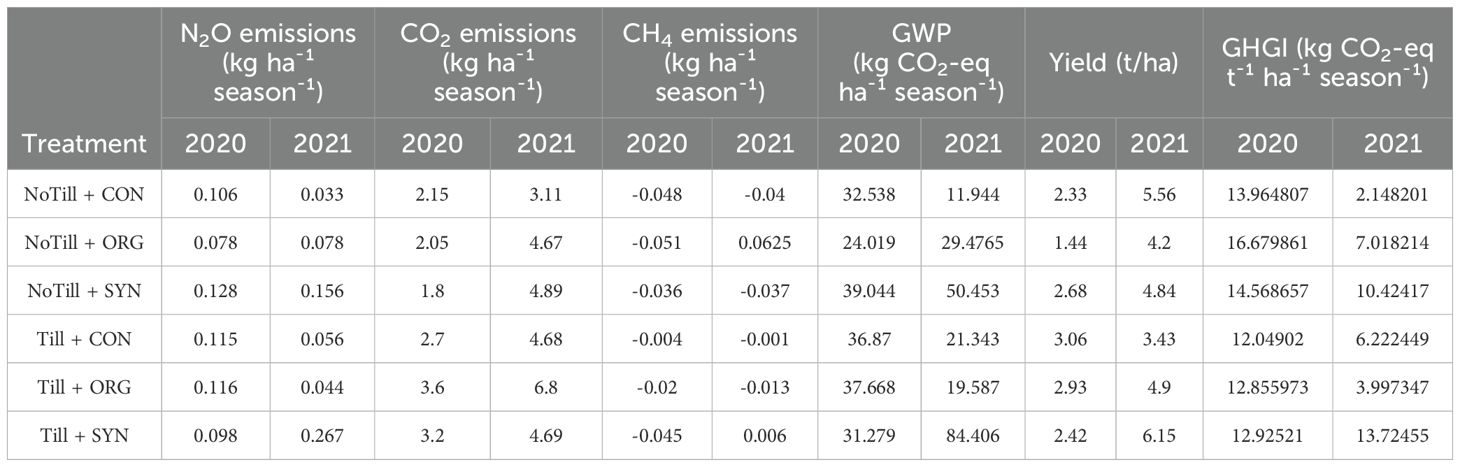
Table 3. The effects of tillage and fertilizer types on global warming potential, maize yields and greenhouse gas intensity.
In contrast, during the growing season of 2021, fertilizer type and their interaction between tillage and fertilization significantly (P< 0.05) influenced maize yields, while tillage alone had no significant effect. Yield differences among the treatment combinations were statistically significant. The highest mean maize yield (6.15 T ha-1) was recorded under conventional tillage with synthetic fertilizer (Till + SYN), while the lowest yield (1.44 T ha-1) occurred under conventional tillage without any N application (Till + CON) (Table 3).
Maize yields differed significantly (P< 0.05) between the 2020 and 2021 growing seasons, with mean yields per plot generally higher in the minor growing season than in the main growing season, indicating improved performance across treatments in the second growing season.
3.6 Global warming potential and greenhouse gas intensity
In the 2020 growing season, the highest GWP was recorded under No.Till + SYN (39.044 kg CO2-eq ha-¹ season-¹), followed by Till + ORG (37.668 kg CO2-eq ha-¹ season-¹) and Till + CON (36.87 kg CO2-eq ha-¹ season-¹). The lowest GWP was observed in NoTill + ORG (24.02). Greenhouse gas intensity (GHGI) was lowest under Till + CON (12.049 kg CO2-eq t-¹ ha-¹ season-¹) and highest under No.Till + ORG (16.679 CO2-eq t-¹ ha-¹ season-¹), indicating that synthetic fertilizer under tilled conditions had the most emissions per ton of maize produced.
In 2021, GWP increased sharply under Till + SYN (84.41 kg CO2-eq ha-¹ season-¹), more than doubling its 2020 value, while NoTill + SYN also exhibited a high GWP (50.45 84.41 kg CO2-eq ha-¹ season-¹). The lowest GWP was recorded in NoTill + CON (11.94 kg CO2-eq ha-¹ season-¹). GHGI followed a similar pattern, with the lowest value under NoTill + CON (2.15 kg CO2-eq t-¹ ha-¹ season-¹) and the highest under Till + SYN (13.72).
4 Discussion
4.1 Impacts of tillage and fertilizer application on soil GHG emissions
Soil tillage results in changes in soil aeration, soil temperature, and moisture (29, 30) thus tillage type and timing can directly or indirectly influence N2O, CO2 and CH4 emissions (4). Similarly, the type of N fertilizer applied to agricultural soils to increase productivity directly or indirectly affects soil GHG fluxes (31).
4.1.1 Soil N2O emissions
The observed interaction between tillage and N fertilizer type had a clear and seasonally distinct effect on soil N2O emissions. In 2020, NoTill + SYN treatment significantly increased cumulative N2O emissions, while in 2021, Till + SYN treatment significantly increased cumulative N2O emissions (Table 2). This pattern underscores the critical role of soil moisture and aeration status in regulating soil microbial processes of N transformation, both of which are strongly influenced by tillage regime and environmental conditions such as rainfall and temperature.
In the 2020 dryer growing season (late September to December), the zero tillage practice likely enhanced water retention relative to tillage practice by reducing soil moisture loss through evaporation. This enhanced moisture retention may have maintained optimal water-filled pore space (WFPS) for aerobic microbial processes, particularly nitrification, which is known to peak around 60% WFPS (32). Under these conditions, the application of synthetic fertilizer provided an immediate and mineralized nitrogen source (ammonium and nitrate), promoting nitrifier activity and associated elevating N2O emissions. The higher cumulative N2O fluxes observed in NoTill + SYN (Table 2) plots during this season are consistent with this mechanism.
Conversely, during the 2021 main growing season (March to July), rainfall was markedly higher, especially between mid-May and July. Under these wetter conditions, NoTill plots experienced elevated WFPS, often exceeding 80%, which would limit gas diffusion and oxygen availability. This anaerobic environment favors denitrification, the gradual reduction of nitrate to dinitrogen (N2) with N2O acting as an obligate intermediate. However, under highly saturated conditions, N2O is often further reduced to N2 before escaping the soil matrix. Therefore, the decline in N2O emissions recorded in NoTill plots during this wet season is consistent with a likely reduction of N2O to N2.
The shift in peak emissions to the Till + SYN plots during 2021 (Table) is likely a result of improved soil aeration in these plots, even under high rainfall. Tillage disrupts soil aggregates and increases porosity, thereby enhancing oxygen diffusion and favoring nitrification pathways where N2O is release. These results are consistent with previous studies (32)which found that tillage effects on N2O emissions are modulated by soil moisture, with NoTill systems emitting more under dry conditions and tilled systems emitting more under wet conditions. Zero tillage systems typically have more surface residue cover and less soil disturbance. This leads to Better soil structure and more continuous pores, which can improve moisture retention even during drier periods. Under dry conditions, these small pockets of retained moisture can create localized anaerobic microsites that allow nitrification to occur and thus generate more N2O, even when the overall soil appears dry. Tilled systems on the other hand disrupt soil structure and usually increase evaporation and aeration. In these wet conditions, aerated soils maintain oxygen in pore spaces, enabling nitrifying bacteria to convert ammonium to nitrate effectively. Good aeration prevents the soil from becoming fully anaerobic, thus supporting continuous and efficient nitrification (32).
This seasonal difference is also supported by a growing body of literature indicating that tillage effects on N2O fluxes are highly context dependent. Some studies report elevated emissions from NoTill systems in dry climates due to moisture conservation (27), while others find higher emissions under conventional tillage during wetter seasons (33). Moreover, several meta-analyses report cases where no significant difference is observed between tillage treatment, particularly under moderate moisture conditions (28).
These findings are consistent with our mechanistic understanding of N cycling in soils. Nitrification-driven N2O emissions dominate when WFPS is between 40–70%, while denitrification contributes more substantially above 60% WFPS. At WFPS >80%, oxygen diffusion becomes severely limited, favoring the complete reduction of N2O to N2 (34).The pronounced drop in emissions in NoTill plots during July 2021 corresponding with the peak rainfall strongly suggests that this threshold was likely exceeded in the NoTill plots, thus suppressing N2O release.
The fertilizer effect observed across both seasons is equally notable. Synthetic N treatments consistently produced the highest average daily and cumulative N2O emissions, highlighting the importance of N form and availability in affecting emissions. Urea, being highly soluble and rapidly hydrolyzed to ammonium, provides an immediate substrate for both nitrifiers and denitrifiers. The sharp N2O spikes following fertilizer application in both years (October 30, 2020, and May 4, 2021) further supports the phenomenon of fertilizer-induced emissions, as reported in prior studies (35).
In contrast, plots amended with composted municipal solid waste exhibited substantially lower N2O emissions. This is likely due to the slower mineralization rates of organic N compounds, which result in more gradual available N release. This reduced availability of readily mineralized N limits substrate supply for denitrification and slows nitrification turnover, thereby reducing N2O fluxes. The discrepancy between our findings and those of studies using poultry manure (34) reinforces the importance of organic amendment type: poultry manure typically contains higher proportions of labile nitrogen compounds compared to compost.
These results align with broader observations in tropical agroecosystems, where the combination of high rainfall, reactive soils, and rapid microbial turnover makes N2O emissions particularly sensitive to both management and weather variability. The interplay between tillage, moisture, and fertilizer type clearly governs not just the magnitude but also the timing of emissions. These findings emphasize the importance of tailoring nutrient and tillage management to seasonal rainfall patterns in order to minimize emissions while maintaining productivity. (30, 31, 35–44)
4.1.2 Soil CO2 emissions
It is important to note, that this study did not differentiate between microbial and root-derived CO2 emissions. As such, the observed fluxes represent total soil respiration, which includes both heterotrophic (microbial decomposition of organic matter) and autotrophic (root metabolic) components. While the contribution of microbial respiration is expected to dominate following fertilizer application and tillage-induced decomposition, particularly in treatments receiving organic inputs, root respiration may also have contributed variably depending on plant growth stage and treatment effects on root biomass which was not measured in this study.
Overall, our findings indicate that tillage practices had a consistent and statistically significant influence on daily CO2 fluxes and cumulative seasonal emissions across both growing seasons. CO2 emissions were markedly higher under conventional tillage, particularly when organic fertilizer was applied. The highest seasonal emissions were observed under the Till + ORG treatment in both years (Table 2), highlighting the synergistic effects of soil disturbance and the addition of labile organic carbon through compost on soil respiration.
Tillage breaks down aggregates and enhances soil aeration, thereby accelerating organic matter decomposition and microbial activity. These effects increase CO2 emissions by stimulating the mineralization of soil organic carbon and the decomposition of crop residues and amendments. When combined with compost, which supplies an additional source of readily decomposable carbon, the result is a pronounced rise in microbial respiration. This mechanism is well-documented in the literature; for example (44), reported higher CO2 emissions from tilled compared to no-till soils due to increased microbial decomposition under improved aeration conditions (39).
Further, tillage physically exposes protected organic matter within soil aggregates which enhance substrate availability to soil microbes. This exposure leads to elevated CO2 fluxes through increased heterotrophic respiration. Similar outcomes have been reported in other studies: for instance (34), documented a 27% increase in CO2 emissions following tillage, while (40) observed reduced emissions under zero-tillage in continuous maize systems. These results reinforce the role of zero-tillage as a viable strategy for mitigating CO2 emissions by preserving soil structure and limiting microbial access to soil carbon. In addition to tillage, fertilizer type also significantly influenced CO2 emissions. Treatments receiving organic amendments showed consistently higher average CO2 flux rates and cumulative emissions. This is consistent with findings from other studies (41, 42), which report elevated CO2 release following organic fertilizer application due to enhanced microbial decomposition of the added organic matter. Compost, in particular, provides a sustained source of carbon that supports microbial growth and activity throughout the growing season.
Conversely, the lowest CO2 emissions in 2020 were recorded under the NoTill + SYN treatment (Table 2), where minimal soil disturbance was combined with the use of urea, a nitrogen source that does not supply organic carbon. This outcome highlights the role of substrate availability in driving microbial respiration. Moreover, inorganic nitrogen application can suppress microbial breakdown of soil organic matter by providing readily available N, thereby reducing the microbial demand for nitrogen via mineralization processes.
Indeed, previous research (43) has shown that urea and other synthetic N fertilizers may either suppress or have a neutral effect on soil CO2 emissions. One possible explanation is that urea application alters soil pH, potentially creating unfavorable conditions for microbial activity. For example (44), reported a 30–40% reduction in CO2 emissions following ammonium nitrate (NH4NO3) application, attributing this to reduced microbial respiration due to acidification.
Taken together, our results demonstrate that both tillage and nitrogen source play significant roles in promoting soil CO2 emissions. The combination of conventional tillage and organic fertilizer poses the highest risk for elevated CO2 fluxes, while conservation practices such as zero tillage paired with synthetic N can substantially reduce microbial CO2 release. These findings contribute to the growing body of evidence supporting integrated soil and nutrient management strategies aimed at reducing carbon losses from agricultural systems. However, our inability to separate heterotrophic and autotrophic respiration underscores the need for complementary methods, such as isotopic tracing or root exclusion techniques in future studies aiming to partition the sources of soil CO2 emissions.
It should be noted that this study did not incorporate crop residues. Without surface residues, soils receive fewer carbon inputs and lose mulch that cools and moistens the top layer. The bare surface heats and dries faster, stimulating microbes to mine organic matter, increasing CO2 fluxes. Residues promote aggregate formation and protect organic matter; their absence leaves carbon exposed to decomposition. A similar experiment with residues may yield different results. (45, 46) Rochette & Angers, (2019) (42, 47–52)
4.1.3 Soil CH4 emissions
Methane (CH4) emissions were consistently small in magnitude compared to those of CO2 and N2O across all treatments and both growing seasons. This pattern is characteristic of well-drained upland agricultural systems, where methanogenesis is generally suppressed, and methane oxidation can dominate. In our study, CH4 fluxes were predominantly negative, confirming the role of the volcanic upland soils as active methane sinks.
These findings align with numerous studies showing that upland, oxidized soils—particularly those with good aeration and drainage—serve as net consumers of atmospheric methane due to the activity of methanotrophic bacteria (45). Under aerobic conditions, these microbes oxidize CH4 into CO2, thereby contributing to negative or near-zero net emissions. The physical and chemical properties of the volcanic soils at the study site likely provided favorable conditions for CH4 oxidation, limiting the formation of anaerobic microsites that would otherwise promote CH4 production.
Across both growing seasons, CH4 fluxes were predominantly negative in all treatments, confirming the role of the study site’s volcanic upland soils as consistent methane sinks. These results are consistent with numerous studies that demonstrate the capacity of well-aerated, oxidized soils, particularly in upland environments to consume atmospheric methane through microbial oxidation (45). Methane oxidation in soils is mediated by methanotrophic bacteria, which utilize CH4 as a carbon and energy source and convert it to CO2 under aerobic conditions. The prevalence of negative fluxes suggests that oxygen availability was sufficient to support active methanotrophic communities, which suppress net CH4 emissions by offsetting or entirely preventing methane production.
The strong sink strength observed in this study is characteristic of upland agroecosystems, particularly those situated on well-drained volcanic soils with inherently high porosity and aeration. These physical soil properties limit the development of anaerobic microsites, thereby constraining methanogenesis and favoring CH4 oxidation. Our findings align with those of (34), who reported similar net CH4 uptake in aerobic cropping systems.
However, a few instances of positive CH4 emissions were recorded, notably under the Till + ORG treatment in 2021(Table 2). This may be attributed to the combination of organic matter input and elevated soil moisture and temperature during the peak of the growing season, which could have created localized anaerobic zones favorable to methanogenesis. The decomposition of compost under warm and moist conditions can elevate labile carbon availability, enhancing microbial respiration and quickly depleting oxygen, particularly in compacted or water-saturated microsites.
Other studies have reported similar effects. For instance (12), observed a two- to ninefold increase in CH4 emissions following compost incorporation in tropical maize systems, with emissions rising linearly up to 3% depending on the compost rate. Similarly (46), demonstrated that the magnitude of CH4 emissions is influenced by the quality of the organic amendment, particularly its carbon concentration and C:N ratio, higher values promote methanogenesis, whereas lower ratios suppress it.
Nonetheless, the overall patterns in our data reinforce the prevailing conclusion that CH4 oxidation dominates in well-aerated soils, particularly when organic inputs are moderate, and soil moisture is not excessive. Both tillage and well-structured no-till systems maintained sufficient oxygen levels to limit methane production and sustain oxidation activity. These findings further support the recognition of upland agricultural soils as potential CH4 sinks, especially in systems that avoid excessive organic inputs or poorly drained conditions.
4.2 Maize yields, GWP and GHGI
Maize yields varied substantially across treatments and between the two growing seasons, reflecting the influence of both agronomic management and climatic conditions. In 2020, yields were generally lower and showed no statistically significant treatment effects, although the highest yield was recorded under conventional tillage without fertilization. In contrast, the 2021 season exhibited significantly higher yields, particularly in treatments receiving synthetic fertilizer, likely due to more favorable rainfall patterns and growing conditions (Table 4). These results emphasize the responsiveness of maize yield to nutrient availability and environmental conditions and highlight the importance of seasonal variability in interpreting agronomic outcomes.
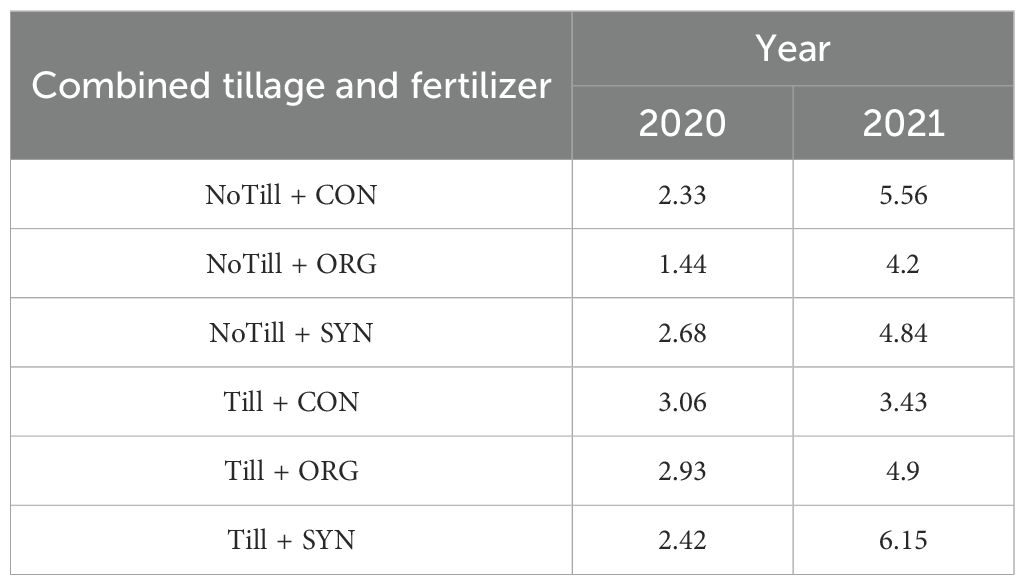
Table 4. Effects of tillage and fertilizer types on maize productivity in the 2020 and 2021 growing season.
The study revealed a significant variability in global warming potential (GWP) among treatment, primarily influenced by fertilizer type, tillage regime, and inter-annual climatic conditions. In 2020, the highest GWP was recorded under the NoTill + SYN treatment (39.04 kg CO2-eq ha-¹ season-¹), underscoring the contribution of synthetic fertilizer use, particularly in no-till systems to increased nitrous oxide emissions. In contrast, NoTill + ORG yielded the lowest GWP (24.02) (Table 3), suggesting that organic fertilization under no-till conditions can mitigate overall GHG emissions by avoiding highly reactive N inputs.
In 2021, GWP increased across nearly all treatments, with a dramatic rise observed under Till + SYN (84.41 kg CO2-eq ha-¹)(Table 3). This increase is likely attributable to higher N2O emissions driven by favorable microbial activity and increased soil moisture resulting from higher seasonal rainfall. These findings emphasize the sensitivity of GWP to both agronomic management and inter-annual climatic variability. Specifically, the application of synthetic fertilizer under no-tillage increased GWP by 20% and 322% in 2020 and 2021, respectively. Under conventional tillage, GWP declined slightly in 2020 (–15%) but increased sharply in 2021 (+295%), illustrating that emissions outcomes are not only treatment-dependent but also season-specific.
While GWP offers a cumulative measure of emissions, GHGI provides a more nuanced evaluation by relating emissions to crop productivity. In 2020, GHGI values varied widely due to differences in yield performance. The lowest GHGI (12.05 kg CO2-eq t-¹) was observed under Till + CON, which also produced the highest yield (3.06 t/ha). This suggests that even moderate emissions can be offset by efficient production, highlighting the importance of yield as a denominator in climate-smart metrics. In contrast, the NoTill + ORG treatment, with its low yield (1.44 t/ha), exhibited a relatively high GHGI (16.68), reinforcing that low productivity can amplify emissions per unit output (Table 3).
In 2021, GHGI values declined markedly in treatments where yields improved significantly. Notably, NoTill + CON achieved both low GWP (11.94 kg CO2-eq ha-¹) and a substantial maize yield (5.56 t/ha), resulting in the lowest GHGI of the study (2.15 kg CO2-eq t-¹) (Table 3). This treatment demonstrates that minimal inputs under no-till can achieve a favorable balance of emissions and productivity. Similarly, Till + ORG also showed improved emission efficiency (GHGI = 3.99), despite its relatively higher GWP, due to a concurrent yield increase.
Overall, NoTill + CON in 2021 emerges as the most climate-efficient treatment, combining moderate emissions with high productivity. This outcome suggests that conservation tillage paired with low-input management may offer a viable strategy for sustainable, low-emission maize production in tropical upland systems. The results further reinforce the importance of assessing mitigation strategies not solely on absolute emission levels, but in the context of yield-scaled metrics like GHGI, which better capture the trade-offs and synergies between productivity and environmental performance. (53, 54) Fowler et al. (2009) (55)
5 Conclusion
This study provides important insights into the effects of agronomic practices, specifically tillage systems and fertilizer types, on greenhouse gas (GHG) emissions under maize cultivation in volcanic upland soils of Buea, Cameroon. Across two growing seasons, the study concludes that that the combination of tillage and fertilization significantly influenced soil cumulative seasonal emissions of N2O, CO2, and CH4, as well as global warming potential (GWP), maize yield, and greenhouse gas intensity (GHGI).
The study concludes that in the 2020 season, cumulative N2O emissions were highest under NoTill + SYN, while CO2 emissions peaked under Till + ORG. Although all CH4 fluxes were negative, indicating net methane uptake, their relative magnitudes varied across treatments, with Till + CON showing the least negative values. In 2021, N2O emissions were greatest under Till + SYN, and CO2 emissions again peaked under Till + ORG. Although the NoTill + ORG treatment recorded slight positive CH4 emissions, most treatments remained net methane sinks, affirming the role of well-aerated upland soils in CH4 oxidation.
Zero tillage, particularly when combined with organic inputs or no fertilization, consistently reduced GHG emissions and GHGI while maintaining competitive yields. These results support its potential as a viable strategy for climate-smart, low-emission maize production. In contrast, synthetic fertilizers, while promoting yields, especially under conventional tillage also contributed to significantly higher N2O emissions and overall GWP, particularly under wetter conditions.
The study further underscores that fertilizer type has differential effects on GHG dynamics: synthetic fertilizers increase N2O emissions due to immediate nitrogen availability, whereas organic fertilizers tend to elevate CO2 (and occasionally CH4) through microbial decomposition of added organic matter. However, the emissions associated with organic inputs were substantially moderated under no-till systems. These findings emphasize the importance of context-specific agronomic strategies. Agronomic practices must consider not only yield outcomes but also emission profiles, especially under changing climatic conditions. The variability observed between seasons reinforces the sensitivity of soil GHG fluxes to rainfall, temperature, and soil moisture conditions.
Importantly, this study contributes valuable data for Cameroon’s national GHG inventory reporting and informs climate-resilient soil management strategies for smallholder systems in similar tropical agroecosystems.
6 Limitations of the study
This study was conducted over a relatively short timeframe, two growing seasons across two consecutive years, which limits the ability to generalize the results across longer-term climatic variability and soil system responses. Given the strong inter-annual influence of rainfall and temperature on GHG dynamics, a longer study period (ideally 5–10 years) would provide a more robust understanding of the long-term impacts of conservation agriculture practices on soil GHG emissions in tropical upland systems.
Additionally, due to the absence of an on-site weather station, site-specific meteorological data (e.g., rainfall, temperature, and soil moisture) were not collected during the experiment. This limited our ability to directly correlate climatic variables with GHG fluxes, particularly during peak emission periods. The lack of high-resolution weather data constrains mechanistic interpretations and limits the potential for model calibration or extrapolation beyond the study period. Integrating continuous climatic monitoring in future work would significantly improve the explanatory power of treatment effects.
Furthermore, CO2 flux measurements in this study represent total soil respiration, encompassing both autotrophic (root-derived) and heterotrophic (microbial) sources. The inability to separate these components may have led to overestimations of microbial CO2 emissions, and consequently, inflated estimates of cumulative CO2, GWP, and GHGI. Similarly, while CH4 fluxes indicated net methane uptake, the study did not quantify methanotroph activity or assess soil microbial communities, limiting mechanistic insight into the biological drivers of methane oxidation. Future studies incorporating root exclusion techniques and microbial or isotopic analyses would provide a more refined understanding of the biogeochemical processes governing GHG dynamics in these systems.
Lastly, we acknowledge that matching compost and urea on total N does not ensure equivalence in plant-available N, because compost N requires mineralization whereas urea N is immediately available; we did not directly quantify compost mineralization rates in this study.
Data availability statement
The original contributions presented in the study are included in the article. Further inquiries can be directed to the corresponding author.
Author contributions
GA: Conceptualization, Data curation, Formal analysis, Funding acquisition, Investigation, Methodology, Project administration, Resources, Software, Validation, Visualization, Writing – original draft, Writing – review & editing. PN: Conceptualization, Formal analysis, Investigation, Methodology, Resources, Software, Supervision, Validation, Visualization, Writing – review & editing. VM: Conceptualization, Data curation, Investigation, Project administration, Supervision, Validation, Writing – review & editing. AT: Conceptualization, Data curation, Investigation, Project administration, Validation, Writing – review & editing. IO: Data curation, Formal analysis, Software, Visualization, Writing – review & editing. TS: Data curation, Investigation, Methodology, Validation, Writing – review & editing.
Funding
The author(s) declare financial support was received for the research and/or publication of this article. This research was supported through the CLIFF-GRADS program, a joint initiative of the CGIAR Research Program on Low Emissions Food Systems and the Global Research Alliance on Agricultural Greenhouse Gases (GRA). We gratefully acknowledge the Government of New Zealand for their generous financial contribution, which made this work possible. Additional funding was provided by the CGIAR Research Program on Low Emissions Food Systems and the CGIAR Climate Action Science Program, both supported by the CGIAR Trust Fund and its contributing partners. For a full list of CGIAR funding partners, please refer this link: https://www.cgiar.org/funders/.
Acknowledgments
The authors would like to express their sincere appreciation to Dr. Augusto Castro Núñez and Dr. Louis Verchot for their invaluable mentorship throughout the research process. The authors would also like to acknowledge Green Growth Africa (formerly the International Support Network for African Development, ISNAD-Africa) for their mentorship through the research mentorship program. We are deeply grateful to Mr. Amungwa Ivan, Mr. Ekuri Brian Akom, Mr. Nkeng Joel, Mr. Wamei Kikoh Regan, Mr. Tiku David, and Mr. Nchini Livinus for their invaluable assistance during the data collection phase of this study. Additionally, the authors would like to acknowledge Vincent Johnson (Consultant to the Alliance of Bioversity International and CIAT Science Writing Service) for copy editing and editorial review of this manuscript.
Conflict of interest
The authors declare that the research was conducted in the absence of any commercial or financial relationships that could be construed as a potential conflict of interest.
The author(s) declared that they were an editorial board member of Frontiers, at the time of submission. This had no impact on the peer review process and the final decision.
Generative AI statement
The author(s) declare that no Generative AI was used in the creation of this manuscript.
Any alternative text (alt text) provided alongside figures in this article has been generated by Frontiers with the support of artificial intelligence and reasonable efforts have been made to ensure accuracy, including review by the authors wherever possible. If you identify any issues, please contact us.
Publisher’s note
All claims expressed in this article are solely those of the authors and do not necessarily represent those of their affiliated organizations, or those of the publisher, the editors and the reviewers. Any product that may be evaluated in this article, or claim that may be made by its manufacturer, is not guaranteed or endorsed by the publisher.
References
1. Lankoski J and Lankoski L. Environmental sustainability in agriculture: Identification of bottlenecks. Ecol Econ. (2023) 204. doi: 10.1016/j.ecolecon.2022.107656
2. Crippa M, Solazzo E, and Guizzardi D. Food systems are responsible for a third of global anthropogenic GHG emissions. Nat Food. (2021) 2:198–209.
3. Pu C, Liu X, Zhang Y, Wang J, and Li M. A review of greenhouse gas emissions from agricultural soil. Sustainability. (2024) 16.
4. Žurovec O, Sitaula BK, Čustović H, Žurovec J, and Dörsch P. Effects of tillage practice on soil structure, N2O emissions and economics in cereal production under current socio-economic conditions in central Bosnia and Herzegovina. PloS One. (2017), 12–1. doi: 10.1371/journal.pone.0187681
5. Ramankutty N, Mehrabi Z, Waha K, Jarvis L, Kremen C, Herrero M, et al. Trends in global agricultural land use: implications for environmental health and food security. Annu Rev Plant Biol. (2018), 789–815. doi: 10.1146/annurev-arplant-042817-040256
6. Sharma C. Long-term fertilization effects on soil organic carbon sequestration in an Inceptisol. Soil Tillage Res. (2018) 177:134–44. doi: 10.1016/j.still.2017.12.006
7. Mohammed S, Mirzaei M, Pappné Törő Á, Anari MG, Moghiseh E, Asadi H, et al. Soil carbon dioxide emissions from maize (Zea mays L.) fields as influenced by tillage management and climate. Irrigation Drainage. (2022) 71:228–40. doi: 10.1002/ird.2633
8. Jiang Q, Madramootoo CA, and Qi Z. Soil carbon and nitrous oxide dynamics in corn (Zea mays L.) production under different nitrogen, tillage and residue management practices. Field Crops Res. (2022) 277.
9. Feng J, Li F, Zhou X, Xu C, Ji L, Chen Z, et al. Impact of agronomy practices on the effects of reduced tillage systems on CH4 and N2O emissions from agricultural fields: a global meta-analysis. PloS One. (2018) 13. doi: 10.1371/journal.pone.0196703
10. FAO-Food; Nations A ot U. World fertilizer trends and outlook to 2020. (2020) (Rome, Italy: Food and Agriculture Organization of the United Nations (FAO)).
11. Sainju UM, Ghimire R, and Pradhan GP. Nitrogen fertilization I: Impact on crop, soil, and environment. Nitrogen fixation. (2019) 9:1–9.
12. Syakila A and Kroeze C. The global nitrous oxide budget revisited. Greenhouse gas measurement management. (2019) 1:17–26. doi: 10.3763/ghgmm.2010.0007
13. Wassmann R, Papen H, and Rennenberg H. Methane emission from rice paddies and possible mitigation strategies. Chemosphere. (2013) 26:201–17. doi: 10.1016/0045-6535(93)90422-2
14. Ministry of Environment NP and SD (MINEPDEV). Nationally Determined Contribution (NDC) for Cameroon (2021) (UPDATED). (2021) (Yaoundé, Cameroon: Ministry of Environment, Nature Protection and Sustainable Development (MINEPDED)).
15. Mairura FS, Mugendi DN, Mwanje JI, Ramisch JJ, Mbugua PK, and Chianu JN. Integrating scientific and farmers’ evaluation of soil quality indicators in Central Kenya. Geoderma. (2017) 139:134–43.
16. Ngala KI, Nyanchi GT, Kongnso ME, Antu NV, Nghobuoche F, and Muala MN. Climate variability impact and adaptation: the experience of maize farmers in Bui division, Northwest Cameroon. Int J Environment Agric Biotechnol. (2020) 5:683–98. doi: 10.22161/ijeab.53.22
17. Ngute ASK, Marchant R, and Cuni-Sanchez A. Climate Change, Perceptions, and Adaptation Responses Among Farmers and Pastoralists in the Cameroon Highlands. In: Handbook of Climate Change Management: Research, Leadership, Transformation (2020). (Cham, Switzerland: Springer Nature) p. 1–14.
18. Molua EL. An empirical assessment of the impact of climate change on smallholder agriculture in Cameroon. Global Planetary Change. (2009) 67:205–8. doi: 10.1016/j.gloplacha.2009.02.006
19. Ngosong C, Bongkisheri V, Tanyi CB, Nanganoa LT, and Tening AS. Optimizing nitrogen fertilization regimes for sustainable maize (Zea mays L.) production on the volcanic soils of Buea Cameroon. Adv Agric. (2019). doi: 10.1155/2019/4681825
20. Ajonina UP, Joseph TN, and Fonchenalla TA. Farmers’ Perceptions of impacts of climate variability on market gardening and adaptation strategies on the slopes of mount Cameroon. Int J Res. (2021) 7:1–10.
21. Wanie CM, Nkemasong Nicasius A, Bate BG, and Betrand A. Climate variability related impacts on market gardening crop production in Buea Urban Area, Cameroon: Inquiry and policy implications towards urban food security. Int J Sci Research(IJSR),. (2020) 9:1519–24.
22. Manga VE, Suh CE, Agyingi CM, and Shemang EM. Mineralogy and geochemistry of soils developed along the slopes of Mt. Cameroon West Africa J Afr Earth Sci. (2013) 81:82–93. doi: 10.1016/j.jafrearsci.2013.01.008
23. Egbe EA, Fonge BA, Mokake SE, Besong M, and Fongod AN. The effects of green manure and NPK fertilizer on the growth and yield of maize (Zea mays L) in the Mount Cameroon region. Agric Biol J North America. (2012) 3:82–92. doi: 10.5251/abjna.2012.3.3.82.92
24. Sapkota TB, Rai M, Singh LK, Gathala MK, Jat ML, Sutaliya JM, et al. Greenhouse Gas Measurement from Smallholder Production Systems: Guidelines for Static Chamber Method. New Delhi, India: International Maize and Wheat Improvement Center (CIMMYT) and Indian Council of Agricultural Research (ICAR (2014). p. 18.
25. Memon SQ, Mirjat MS, Mughal AQ, and Amjad N. Effects of different tillage and fertilizer treatments on growth and yield components of maize. Pakistan J Agriculture Agric Eng Veterinary Sci. (2012) 28:160–76.
26. IPCC. Climate Change 2007- the Physical Science Basis: Working Group I Contribution to the Fourth Assessment Report of the IPCC. Cambridge (2007). (Cambridge, United Kingdom, and New York, USA: Cambridge University Press).
27. Zhang ZS, Guo LJ, Liu TQ, Li CF, and Cao CG. Effects of tillage practices and straw returning methods on greenhouse gas emissions and net ecosystem economic budget in rice–wheat cropping systems in central China. Atmos Environ. (2015), 636–44. doi: 10.1016/j.atmosenv.2015.09.065
28. Pareja-Sánchez E, Cantero-Martínez C, Álvaro-Fuentes J, and Plaza-Bonilla D. Impact of tillage and N fertilization rate on soil N2O emissions in irrigated maize in a Mediterranean agroecosystem. Agric Ecosyst Environ. (2020) 287. doi: 10.1016/j.agee.2019.106687
29. Yang XM, Drury CF, and Reeb MR. No-Tillage had Warmer Over-Winter Soil Temperatures than Conventional Tillage in a Brookston Clay Loam Soils in Southwestern Ontario. Soil Sci Soc America J. (2018) 82:307–14. doi: 10.2136/sssaj2017.05.0167
30. Venterea RT. Nitrite-driven nitrous oxide production under aerobic soil conditions: kinetics and biochemical controls. Global Change Biol. (2011) 13:1798–809.
31. Bayer C, Gomes J, Zanatta J, Vieira FCB, de Cássia Piccolo M, Dieckow J, et al. Soil nitrous oxide emissions as affected by long-term tillage, cropping systems and nitrogen fertilization in Southern Brazil. Soil Tillage Res. (2015) 146:213–22. doi: 10.1016/j.still.2014.10.011
32. Firestone MK and Davidson EA. Microbiological basis of NO and N 2 O production and consumption in soil. Exchange of Trace Gases Between Terrestrial Ecosystems and the Atmosphere. (1989) 47:7–21.
33. Zhang ZS, Chen J, Liu TQ, Cao CG, and Li CF. Effects of nitrogen fertilizer sources and tillage practices on greenhouse gas emissions in paddy fields of central China. Atmos Environ. (2016), 274–81. doi: 10.1016/j.atmosenv.2016.09.003
34. Yoo J, Woo SH, Park KD, and Chung KY. Effect of no tillage and conventional tillage practices on the nitrous oxide (N2O) emissions in an upland soil: soil N2O emission as affected by the fertilizer applications. Appl Biol Chem. (2016) 59:787–97. doi: 10.1007/s13765-016-0226-z
35. Abdalla M, Osborne B, Lanigan G, Forristal D, Williams M, Smith P, et al. Conservation tillage systems: a review of its consequences for greenhouse gas emissions. Soil Use Manage. (2013) 29:199–209. doi: 10.1111/sum.12030
36. Fernández-Ortega J, Álvaro-Fuentes J, and Cantero-Martínez C. The use of double-cropping in combination with no-tillage and optimized nitrogen fertilization reduces soil N2O emissions under irrigation. Sci Total Environ. (2023) 857. doi: 10.1016/j.scitotenv.2022.159458
37. Linn DM and Doran JW. Effect of water-filled pore space on carbon dioxide and nitrous oxide production in tilled and non-tilled soils. Soil Sci Soc America J. (1984) 48:1267–72. doi: 10.2136/sssaj1984.03615995004800060013x
38. Davidson EA. Fluxes of nitrous oxide and nitric oxide from terrestrial ecosystems. Microbial production and consumption of greenhouse gases: methane, nitrogen oxides, and halomethanes. (1991), 219–35 (Washington, D.C., USA: American Society for Microbiology (ASM Press)).
39. Granli T and Bøckman OC. Nitrous oxide (N2O) emissions from soils in warm climates. Fertilizer Res. (1995) 42:159–63. doi: 10.1007/BF00750510
40. Deng Q, Hui D, Wang J, Iwuozo S, Yu CL, Jima T, et al. Corn yield and soil nitrous oxide emission under different fertilizer and soil management: A three-year field experiment in middle Tennessee. PloS One. (2015) 10. doi: 10.1371/journal.pone.0125406
41. Smith P, Martino D, Cai Z, Gwary D, Janzen H, Kumar P, et al. Greenhouse gas mitigation in agriculture. Philos Trans R Soc B Biol Sci. (2022) 363:789–813. doi: 10.1098/rstb.2007.2184
42. Bouwman AF. Direct emission of nitrous oxide from agricultural soils. Nutr Cycl Agroecosyst. (1996) 46:53–70. doi: 10.1007/BF00210224
43. Fungo B, Lehmann J, Kalbitz K, Thionģo M, Tenywa M, Okeyo I, et al. Ammonia and nitrous oxide emissions from a field Ultisol amended with tithonia green manure, urea, and biochar. Biol Fertil Soils. (2019) 55:135–48. doi: 10.1007/s00374-018-01338-3
44. Pelster DE, Chantigny MH, Rochette P, Bertrand N, Angers DA, Zebarth BJ, et al. Rates and intensity of freeze–thaw cycles affect nitrous oxide and carbon dioxide emissions from agricultural soils. Can J Soil Sci. (2019) 99:472–84. doi: 10.1139/cjss-2019-0058
45. Álvaro-Fuentes J, Cantero-Martínez C, López MV, and Arrúe JL. Soil carbon dioxide fluxes following tillage in semiarid Mediterranean agroecosystems. Soil Tillage Res. (2007) 96:331–41. doi: 10.1016/j.still.2007.08.003
46. Chatskikh D and Olesen JE. Soil tillage enhanced CO2 and N2O emissions from loamy sand soil under spring barley. Soil Tillage Res. (2007) 97:5–18. doi: 10.1016/j.still.2007.08.004
47. Rochette P and Angers DA. Soil surface carbon dioxide fluxes induced by spring, summer, and fall moldboard plowing in a sandy loam. Soil Sci Soc America J. (2019) 63:621–8. doi: 10.2136/sssaj1999.03615995006300030027x
48. Ussiri DA and Lal R. Long-term tillage effects on soil carbon storage and carbon dioxide emissions in continuous corn cropping system from an alfisol in Ohio. Soil Tillage Res. (2019) 104:39–47. doi: 10.1016/j.still.2008.11.008
49. Alvarez R, Alconada M, and Lavado R. Sewage sludge effects on carbon dioxide- carbon production from a de-surfaced soil. Commun Soil Sci Plant Anal. (2019) 30:1861–6.
50. Zhai LM, Liu HB, Zhang JZ, Huang J, and Wang BR. Long-term application of organic manure and mineral fertilizer on N2O and CO2 emissions in a red soil from cultivated maize-wheat rotation in China. Agric Sci China. (2011) 10:1748–57. doi: 10.1016/S1671-2927(11)60174-0
51. Hu J, Lin X, Wang J, Dai J, Chen R, Zhang J, et al. Microbial functional diversity, metabolic quotient, and invertase activity of a sandy loam soil as affected by long-term application of organic amendment and mineral fertilizer. J Soils Sediments. (2011) 11:271–80. doi: 10.1007/s11368-010-0308-1
52. Sitaula BK, Bakken LR, and Abrahamsen G. CH4 uptake by temperate forest soil: effect of N input and soil acidification. Soil Biol Biochem. (2015) 27:871–80. doi: 10.1016/0038-0717(95)00017-9
53. Schindlbacher A, Zechmeister-Boltenstern S, and Butterbach-Bahl K. Effects of soil moisture and temperature on NO, NO2, and N2O emissions. European forest soils. J Geophysical Research: Atmospheres. (2004). doi: 10.1029/2004JD004590
54. Butterbach-Bahl K, Baggs EM, Dannenmann M, Kiese R, and Zechmeister-Boltenstern S. Nitrous oxide emissions from soils: how well do we understand the processes and their controls? Philos Trans R Soc B: Biol Sci. (2013) 368.
Keywords: greenhouse gas emissions, global warming potential, agronomic practices, zero tillage practices, organic fertilizer, maize production systems, greenhouse gas intensity (GHGI)
Citation: Amahnui GA, Nikièma P, Manga VE, Tening AS, Isimikalu TO and Sapoka TB (2025) The effects of agronomic practices on soil greenhouse gas emissions in maize production systems in Buea, Cameroon. Front. Soil Sci. 5:1549302. doi: 10.3389/fsoil.2025.1549302
Received: 20 December 2024; Accepted: 21 October 2025;
Published: 25 November 2025.
Edited by:
Ngonidzashe Chirinda, Mohammed VI Polytechnic University, MoroccoReviewed by:
Mohamed H. H. Abbas, Benha University, EgyptMariela Fuentes Ponce, Autonomous Metropolitan University, Mexico
Copyright © 2025 Amahnui, Nikièma, Manga, Tening, Isimikalu and Sapoka. This is an open-access article distributed under the terms of the Creative Commons Attribution License (CC BY). The use, distribution or reproduction in other forums is permitted, provided the original author(s) and the copyright owner(s) are credited and that the original publication in this journal is cited, in accordance with accepted academic practice. No use, distribution or reproduction is permitted which does not comply with these terms.
*Correspondence: George Amenchwi Amahnui, Z2VvcmdlYW1haG51aUBnbWFpbC5jb20=