 Honoré Tekeu
 Joël D’Astous-Pagé
 Thomas Jeanne
 Richard Hogue
- 1Laboratory of Microbial Ecology, Research and Development Institute for the Agri-Environment (IRDA), Quebec, QC, Canada
- 2Institute of Integrative and Systems Biology, Université Laval, Québec, QC, Canada
- 3Department of Wood and Forest Sciences, Université Laval, Québec, QC, Canada
This study investigated the impact of chloropicrin fumigation and a Bacillus species-based biostimulant applied alone or in combination in soil of potato crop over five key time-points in season. Rhizoctonia canker incidence, potato yield and the effect on the fungal community have been monitored. Quantitative PCR and high throughput metabarcoding sequencing were used to assess soil fungal diversity, specifically biomass, richness, composition and network interactions. Potato gross yield increased by 7.06% (23.5 cwt. acre-1) with fumigation alone and by 8.41% (28 cwt. acre-1) with biostimulant applied to fumigated soil in comparison to non-fumigated control treatment. Net yield losses caused by rhizoctonia canker exceeded 20% in control plots, while both treatments reduced rhizoctonia canker index by 30% and yield losses to less than 5.6%. Fumigation alone reduced fungal abundance during the season, but the biostimulant slightly increased the mean and variability of fungal abundance. Shannon and Evenness diversity indices decreased in fumigated plots, while the biostimulant increased the variability of Chao1 and Observed ASVs indices throughout the season. Biostimulant application promoted rapid late−season fungal recolonization, enlarged connectivity among taxa in non−fumigated soil, and, when combined with fumigation, eliminated the late−season resurgence of Rhizoctonia solani detected in fumigation−only plots. Fumigation also delivered early-season knock-downs of Fusarium spp. (10-fold reduction) and Colletotrichum coccodes (≥3-fold), yet these both opportunists partially rebounded by harvest while the biostimulant had little effect on these genera. Alternaria spp. and Verticillium nubilum stayed sporadic (<0.5 % reads) but were consistently lowest in fumigated soils. Overall, integrated fumigant–biostimulant management delivered the greatest season−long suppression of pathogenic fungi, the most resilient and functionally connected fungal network, and the highest tuber yield, demonstrating that coupling targeted chemical fumigation with microbial stimulation can reconcile disease control with soil microbiome monitoring in intensive potato systems.
Introduction
Potato (Solanum tuberosum L.) is one of the world’s most important staple crops, providing a substantial portion of global food security. However, the cultivation of potato crops is constantly threatened by various biotic and abiotic stresses, among which rhizoctonia canker (black scurf) caused by the soilborne fungal pathogen Rhizoctonia solani Kühn (Thanatephorus cucumeris), a fungus prevalent in potato-growing regions worldwide (1, 2). Rhizoctonia disease manifests as foliar and stem rot, tuber decay, and damping-off in seedlings. Furthermore, tubers frequently exhibit the presence of rhizoctonia canker (black scurf), which consists of irregular black sclerotia of R. solani accumulated on the tuber surface (2). The economic implications of this disease are profound, as it not only reduces yield quantity but also affects tuber quality, leading to market rejection and financial losses throughout the supply chain (1). The ease with which Rhizoctonia solani can persist in soil and its capacity to infect a wide range of crops further compounds the complexity of managing this pathogen effectively. Traditional methods of disease management, such as chemical fumigation and rotation, have shown limited success due to the pathogen’s ability to form resilient resting structures and its wide host range (3). Additionally, increasing concerns about the environmental impact and long-term sustainability of chemical interventions necessitate the exploration of alternative strategies for disease management. This context underscores the urgency of developing innovative and sustainable approaches that not only mitigate the disease’s impact but also promote the overall health of the agroecosystem. Although biological control methods have proven effective in some cases, the outcomes are not always consistent (3, 4). Soil microorganisms play a vital role in maintaining plant health and productivity, and changes to the soil microbiome resulting from farming practices can affect soil functions (5, 6) and alter R. solani disease incidence (7).
Previous authors found that soil fumigation altered the microbial communities when compared to non-fumigated soils (8). In Canadian potato crop systems, the most commonly used chemical fumigants are chloropicrin and metam-sodium (9). In a study on tomato production systems, authors explored the potential of chloropicrin as an alternative fumigant to methyl bromide (10). They found that chloropicrin was highly effective at reducing soil microbial populations, with more than 85% of bacteria, fungi, and actinomycetes killed according to a bioassay method that estimated microbial inoculum survival on potato dextrose agar petri dishes. Although chemical fumigation effectively reduces soil-borne diseases, it can have negative consequences, including reduced soil microbial biomass and diversity, enzyme activities, and carbon/nitrogen cycling and mineralization (11–13). Repeated soil fumigation with chloropicrin could lead to a decline in microbial richness and diversity, but to an increase in the abundance of Actinobacteria and Saccharibacteria (14).
While fumigation with chloropicrin has a significant and persistent impact on microbial diversity (9), other fumigation methods and biofumigation with mustard plant residues also lead to transient decreases in microbial diversity (3, 9, 15). These changes in the soil microbiome may impaired the functions and persistence of potato beneficial microorganisms which can result in dysbiosis, creating opportunities for soilborne plant pathogens to invade or recolonize the soil and negatively impacting agricultural productivity (16, 17). Since the use of chloropicrin to control soil-borne pests and diseases may destroy beneficial soil microorganisms, it is necessary to promote rapid microbial repopulation of the soil using microorganisms that stimulate plant growth (18, 19).
Biostimulants based on seaweed extracts contain plant hormones and polysaccharides, as those based on humic substances promote phytohormone-like activity that have been shown to enhance soil nutrient availability and increase mineral content in plant-based food (20). The Bacillus genus is a well-known source of phytostimulants, biopesticides and biofertilizers products. Indeed, mixes of Bacillus species-based biostimulant are available commercially. These biostimulants increase microbial activity leading to increased nutrient availability that affect plant growth and enhance plants’ tolerance to biotic and abiotic stresses (21). A better understanding of the impact of inoculated bacterial mixed species-based biostimulants on plant-growth and soil microbial community may lead to efficient strategies to promote sustainable management farming practices to mitigate the effects of soil fumigation on soil microbial diversity, structure, and functions (19, 22, 23).
To address this gap, our study aims to use high throughput sequencing (HTS) amplicon-based Illumina MiSeq and network inference analysis to assess the effect of Chloropicrin-based fumigant and mix of five Bacillus species-based biostimulant, applied alone or in combination, on soil fungal community and their interactions in potato production field.
Nowadays, machine learning techniques such as penalized regression, support vector machine, random forest, artificial neural network, and deep neural networks are increasingly being used to explore the complex relationships between microbiome and host phenotypes (24, 25). Our study will employ the artificial neural network technique to contribute to a better understanding of the interactions among different fungal species within a community, while also providing insights into the use of biostimulant and fumigant to promote plant growth and control rhizoctonia canker disease.
We hypothesize that fumigation will increase potato yield and reduce yield losses caused by Rhizoctonia solani, while altering interactions within the soil fungal community. The combination of biostimulant and fumigation will further increase potato yield, promote rapid fungal recolonization which will increase species richness and reduce soil persistence of potato fungal pathogens in comparison to control and fumigated soils. Our specific objectives were (1) to evaluate the agronomic performance of potato plants and the incidence of rhizoctonia canker on potato yield in soil treated with Chloropicrin-based fumigant and mix Bacillus species-based biostimulant, applied alone or in combination (2), to compare the effects of the treatments on soil fungal community, specifically its quantity, diversity, richness, and composition, and (3) to assess the relationships and interactions between the soil fungal populations.
Materials and methods
Field experiment design
Experiment was carried out on 16 plots of 6 rows of 6 m in length, planted in a field located in Saint-Ubalde (46.729085, -72.266851) (QC, Canada). Experiments were conducted in a randomized complete block design with four repetitions, installed in an area of 532.53 m2 in 2018. Soil physicochemical properties and nutrients content are described in Table 1. Planting was done at a density of 33,300 plants ha-1. The two rows in the center of each plot were used to determine the potato yield, the next two rows were used for soil composite and plant biomass sampling, while the outer rows represent a treatment buffer zone. Main plots involved four treatments: T1 (non-fumigated soil without biostimulant application), T2 (non-fumigated soil with biostimulant application), T3 (fumigated soil without biostimulant application) and T4 (fumigated soil with biostimulant application).
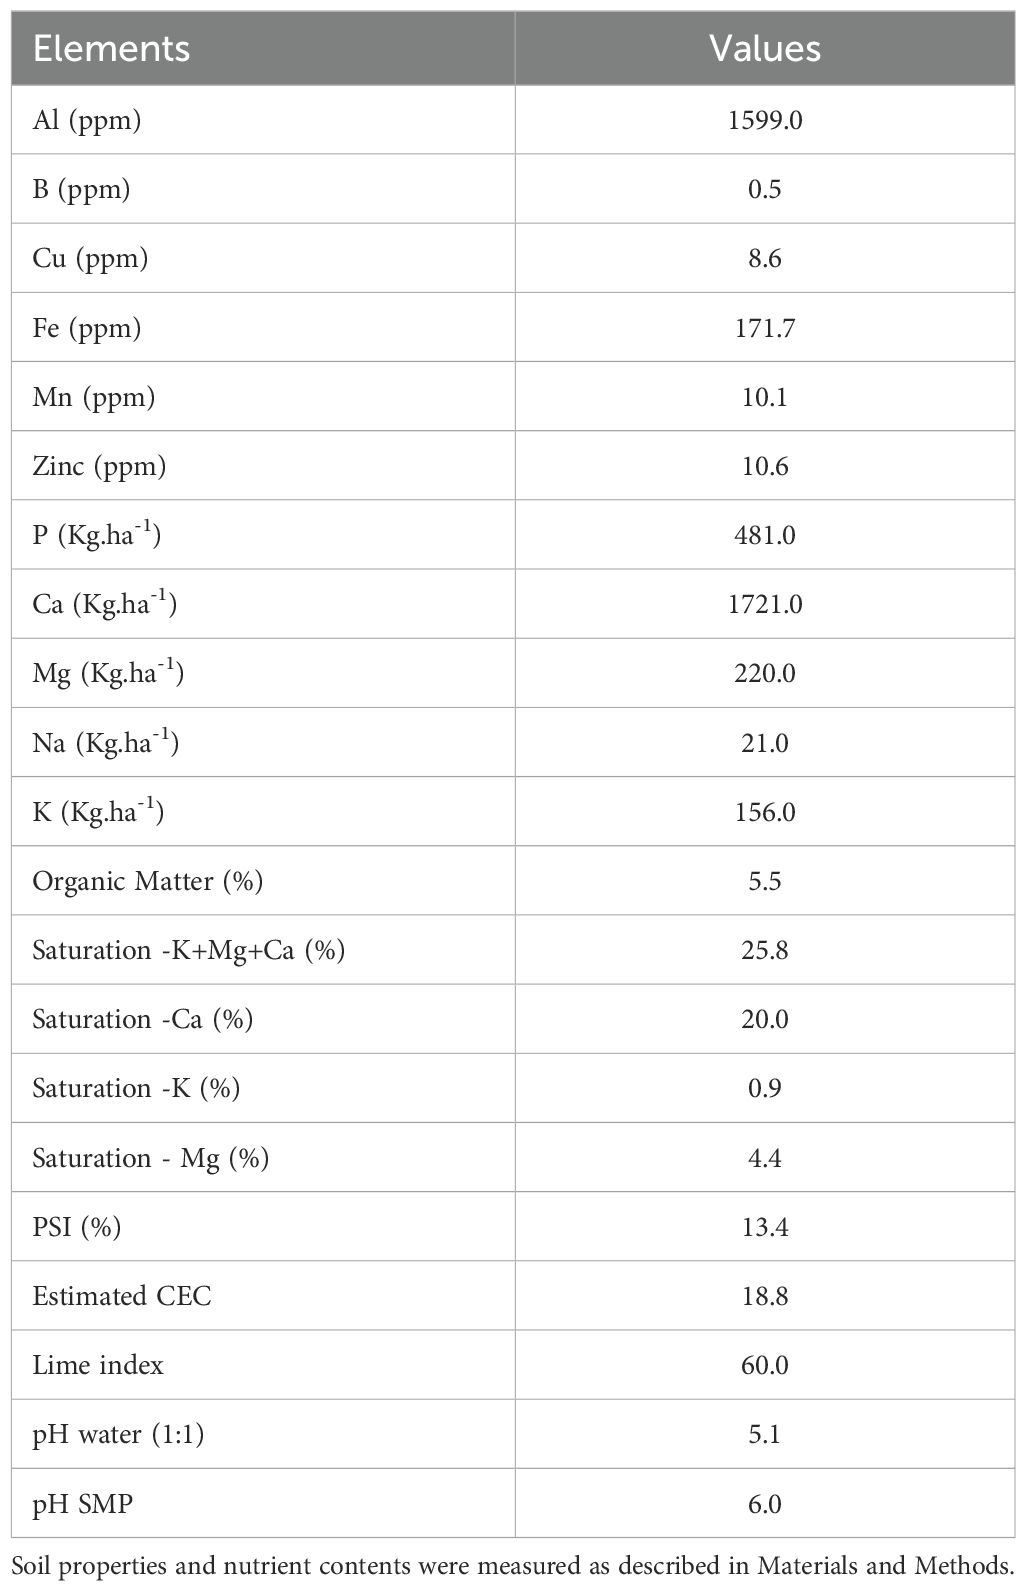
Table 1. Soil properties and nutrients content of the soil’s experimental site.
The fumigation of plots T3 and T4 was done by a well-trained soil fumigation service provider using Chloropicrin Pic Plus fumigant (Synagri, QC, Canada) injected under pressure with shank-injectors penetrating the first 15 cm of the soil. The fumigation process took place on May 19th, 2018. This method involved applying the fumigant to the soil to control soil-borne pests and diseases. Regarding the Bacillus species-based biostimulant application, Alpine Bio20 (AgBrima, QC, Casnada) is a mix of eight‐isolates from five Bacillus species: Bacillus subtilis, Bacillus amyloliquefaciens, Bacillus licheniformis, Bacillus pumilus, and Bacillus velezensis applied at around 5 x 10⁵ CFU.mL-1. These strains were selected based on their plant growth-promoting traits, including indole-3-acetic acid (IAA) production (>20 µg mL−¹), siderophore production, and phosphate solubilization. The application was done by inoculating the Bacillus species-based biostimulant at 30 L. ha-1 to the furrow on the potato seed pieces at plantation. This process occurred on May 29th, 10 days after the soil fumigation and during the plantation (10 DAF and 0 DAP). Indeed, certified seed tubers of ‘Russet Burbank’ were sourced from a single commercial lot (Patates Dolbec Inc., QC) and processed under SOP PB-DA-FT-2018-01 (“Seed Tubers Preparation Planting”). Tubers were mechanically graded to 6.4–7.6 cm diameter and cut into single-eye pieces weighing 50 g ± 5 g to ensure uniform size and vigor. Uniform seed piece size and weight promotes consistent emergence and root development, reducing variability in plant vigor and soil–tuber contact. Smaller or uneven pieces can delay canopy closure and increase soil exposure, creating more infection sites for Rhizoctonia solani. By standardizing seed characteristics, we minimized this source of variability in disease occurrence. The Table 2 presents the milestones of the project.
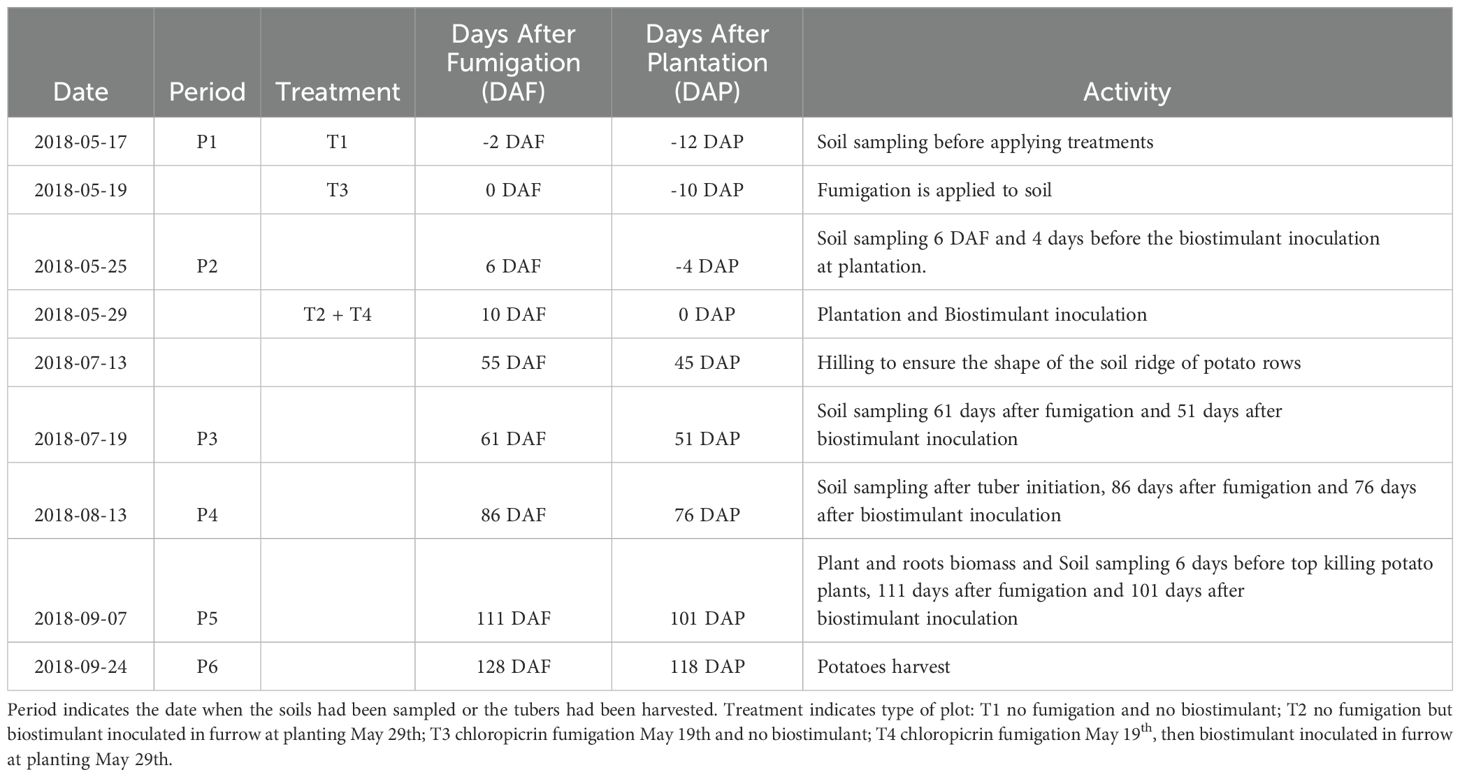
Table 2. Time-periods for treatment application, soil sampling and potatoes harvest.
Soil sampling and analysis
Composite of four soil cores (4.5 cm diameter and 0–20 cm depth) were sampled, one core in each corner of the rows adjacent to center rows of a plot at five time-periods during the growing season (Table 2). Soil samples were stored at 4°C for no more than a week until being processed for soil analysis. The soil was air-dried and sieved to 2 mm. A subsample was ground to 100 mesh to determine total carbon and nitrogen content using dry combustion analysis at 950C°(Leco-CNS) (26). The percentage of organic matter (% M.O.) was obtained by multiplying the C values by 1.724, as mentioned in the Fertilization Reference Guide (27). The water pH was determined on air-dried soils with an electrode in a soil and water solution in a 1:1 ratio. The buffer pH (SMP) was determined in a 1:2 ratio after adding the SMP buffer solution at pH 7.5 and after stirring for 15 minutes (27) The contents of P, K, Ca, Mg, Na, B, Al, Cu, Fe, Mn and Zn elements were extracted with Mehlich-3 solution in a soil:solution ratio of 1:10 (3 ml of weighed soil, 30 ml of solution) (28) and then determined by argon plasma emission spectrometry (ICP) (29, 30). The CEC was estimated with the sum of exchangeable bases and estimated exchangeable acidity (27).
Assessing plant agronomic performance and incidence of Rhizoctonia spp.
Two plants per row adjacent to the two centered rows were randomly sampled for a total of four plants per plot one hundred one days after planting. The roots were shaken to remove all adhering soil and placed in a paper bag, while the aerial parts of the plants were placed in a paper bag to determine plant root and plant aerial biomass respectively. Potatoes were harvested over 2 x 5 m (± 32 plants) targeting the two central rows of each plot. Following the harvest of the tubers from each of the two central rows (2 x 5 m), the number of plants and the number and weights of the tubers were recorded to calculate total gross yield. Tubers were sorted into five size classes based on maximum diameter: < 2 in (< 5.1 cm), 2 1/8–21/2 in (5.4–6.4 cm), 2 1/2–2 3/4 in (6.4–7.0 cm), 23/4–3 in (7.0–7.6 cm), and > 3 in (> 7.6 cm) to determine gross yield per class. For disease assessments, 25 tubers from the 21/2–23/4 in (6.4–7.0 cm) class and 15 tubers from the > 3 in (> 7.6 cm) class were examined per plot. Tubers were washed, air‐dried, and rated for rhizoctonia canker lesion coverage on a six‐point scale: 0 = no lesion; 1 = ≤ 1%; 2 = > 1–5%; 3 = > 5–10%; 4 = > 10–25%; 5 = > 25–50%; 6 = > 50%. The rhizoctonia disease indices were determined as the produce of the rate by the number of tubers showing this rate of lesion coverage, as described in Supplementary Table S1. The rhizoctonia index was estimated according to the adapted method of (31) following the formula: , where RI: rhizoctonia index, SI: sum of disease indices, which results by (with Rate i X Number of tubers i) and NTO: number of tubers observed. For each plot, tubers showing rhizoctonia symptoms on more than 5% of their surface were used to estimate the gross yield losses, the remaining harvested tubers representing the marketable yield.
Soil DNA extraction
The DNA extraction was carried out as described (32). In order to collect and prepare soil samples for DNA extraction, a 200 g aliquot of each soil sample was manually homogenized and sieved to 6 mm, then a 0.5 g subsample of the 6 mm sieved soil was added to 2 mL tubes containing 1.4 g of matrix E beads and 1 mL of lysis buffer that were supplied with the FastDNA™ SPIN Kit for Soil (MP Biomedicals, Solon, OH, USA), as described by (33). The homogenization step was done using a FastPrep-24™ instrument (MP Biomedicals, Solon, OH, USA). Quality control of DNA extracts was evaluated by spectrophotometry (Biophotometer, Eppendorf, Mississauga, ON, Canada) with a G1.0 microcuvette (mCuvette, Eppendorf) at 230, 260, and 280 nm.
Quantitative PCR analysis
The FF390 (5’-CGATAACGAACGAGACCT-3’) and FR1 (5’-AACCATTCAATCGGTAAT-3’) primers from (34) were used to amplify a partial 18S rRNA sequence (approximately 330 bp) from fungal DNA. qPCR was performed on a CFX96 instrument (Biorad, Hercules, CA) using SYBR green qPCR mix (Qiagen, Toronto, ON) as described by (33). Briefly, the thermal cycling conditions consisted of an initial activation step of 15 minutes at 95°C, followed by 40 cycles of 95°C for 1 minute, 30 seconds at the annealing temperature (51°C for fungi), and 72°C for 1 minute. Standard curves were generated from a known quantity of amplified DNA fragments, diluted over a 4-log range. This method was used to quantify the total fungal content in the soil samples, expressed as the number of amplified units per gram of dry soil (AU g−¹ dry soil). The data were normalized, and a log transformation was applied.
Library construction and sequencing
The eukaryotic fungal rRNA Internal Transcribed Spacer 1 (ITS1) region was amplified from soil DNA extracts to prepare amplicons for Illumina sequencing, following the protocol described by (33). Briefly, the ITS1 region was amplified using the primers ITS1F (5′-CTTGGTCATTTAGAGGAAGTAA-3′) (35) and ITS2 (5′-GCTGCGTTCTTCATCGATGC-3′) (36). A two-step dual-indexed PCR approach was employed, specifically designed for Illumina sequencing platforms by the Plateforme d’analyses génomiques (IBIS, Université Laval, Quebec City, QC, Canada).
In the first PCR step, the ITS1 region was amplified using the ITS1F and ITS2 primers with overhang adapters compatible with Illumina index and sequencing adapters. The PCR conditions were as follows: initial denaturation at 95°C for 3 minutes; 25 cycles of 95°C for 30 seconds, annealing at 55°C for 30 seconds, and extension at 72°C for 30 seconds; followed by a final extension at 72°C for 5 minutes.
The PCR products were then purified using AMPure XP beads (Beckman Coulter, Mississauga, ON, Canada) to remove excess primers and nucleotides. In the second PCR step, dual indices and Illumina sequencing adapters were added using the Nextera XT Index Kit (Illumina, San Diego, CA, USA). The indexing PCR conditions consisted of initial denaturation at 95°C for 3 minutes; 8 cycles of 95°C for 30 seconds, annealing at 55°C for 30 seconds, and extension at 72°C for 30 seconds; followed by a final extension at 72°C for 5 minutes.
The indexed PCR products were purified again using AMPure XP beads, quantified using a Qubit fluorometer (Thermo Fisher Scientific, Waltham, MA, USA), and pooled in equimolar amounts. The pooled library was validated using an Agilent Bioanalyzer (Agilent Technologies, Santa Clara, CA, USA) to confirm the size and purity of the amplicons. Sequencing was performed on an Illumina MiSeq platform using the MiSeq Reagent Kit v3 (600-cycle) to generate paired-end reads of 2 × 300 bp.
Statistical and bioinformatic analyses
The agronomic data collected were subjected to one-way analysis of variance (ANOVA) using SAS (Statistical Analysis System) software, version 9.3., following the mixed linear model procedure. Treatment, time, repetition and the interactions mean were compared by performing post hoc Duncan’s test at the p-value threshold of P ≤ 0.05.
Sequence analysis was performed under QIIME2 (37) using the DADA2 filtration approach (38) for determining the Amplicon Sequence Variants (ASV). The taxonomic assignment of ASVs was performed using a pre-trained classifier based on Unite (version 8) reference database (39) and a classification approach (40, 41).
R Studio software (version 4.1.3) was used to analyze the diversity indices, and the relative abundance of the most abundant taxa with treatment, sampling time points and blocks were considered as fixed factors. Non-normal data were normalised and scaled. Each of the inferred single DNA sequences recovered from a high-throughput analysis of marker genes, namely ASV, were subjected to several analyzes. Indeed, fungal alpha-diversity (Shannon), richness (Chao1), evenness (Pielou’s evenness), and observed number ASVs were estimated via Phyloseq package (42) using an Anova, following by a post hoc Duncan’s test at the p-value threshold of p ≤ 0.10, based on the selected ASV table at a depth of 4,890 sequences per sample. Non-metric multidimensional scaling (NMDS) and hierarchical classification analysis were performed using the Bray–Curtis distance matrix, using microeco package (43). Analysis of the β-diversity of the fungal community, as well as the multilevel pairwise comparisons between treatment and sampling periods were done using a permutational multivariate analysis of variance (PERMANOVA) via the Adonis function (with 999 permutations) as described by (44).
We analyzed the ASV sequences database obtained from each of four soil samples per treatment (T1, T2, T3 and T4) and per sampling periods (P3, P4 and P5) to assess the detection of fungal pathogens. For each of the targeted pathogens, the total number of sequences detected in the total soil samples of a treatment at the three sampling-periods P3, P4 and P5 has been calculated. This total number of sequences was then used to calculate the relative abundance of reads associated with a pathogenic fungus by dividing this total by the total number of sequences obtained from all the soils sampled for that treatment. The analysis of the evolution of the percentages per soil sampling-period, and of the total number of sequences per treatment as well as the proportion of sequences associated with the pathogen in the treatment soils allows to estimate the effectiveness of the treatments at reducing the presence of each pathogen at each time-period and at reducing their persistence in the treated soil during the season.
In order to analyse the changes in ASVs abundance and composition over time, we also used Venn diagram via the package microeco (43).
To investigate the relationships between fungal populations within the community in soil, we utilized an artificial network to examine co-occurrence patterns, by calculating all possible Spearman’s rank correlations between ASVs (860 ASVs) at the correlation threshold (P = 0.001). Indeed, Spearman correlation based on WGCNA package through the RMT theory (45) was applied to select the correlation threshold (COR_p_thres = 0.01, COR_cut = 0.8) to define robust associations within the fungal community. This previous filtering step was applied to remove poorly represented ASVs and reduced network complexity, facilitating the determination of the core soil community, as described by (46) via the microeco (43) and igraph (47) packages. To summarize the variation in relative abundance of ASVs within a module (as recommended by (25), we used the module eigen-gene, following the method described by (45) We identified communities or modules within the network using modularity, as described by (48). To assign each node’s role based on its within-module and among-module connectivity, we followed the approach outlined by (49). Various common network properties were measured to describe the network’s topological properties. This included connectedness, which is one of the most important measurements for summarizing hierarchical structures (50). Node degree, also known as connectivity, is the most commonly used concept for describing the topological property of a node in a network (51). Clustering coefficient, which describes how well a node is connected with its neighbors (52). Density, which is closely related to the average connectivity (53). Betweenness, which is used to describe the ratio of paths that pass through the ith node (a high betweenness node can serve as a broker similar to stress centrality (54). Centralization of degree, which is close to 1 for a network with a star topology and close to 0 for a network where each node has the same connectivity (53).
Then, we imported the data in Gephi’s program (55) where all statistical analyses were carried out. Therefore, the resulting network with node colors indicating calculated modules were visualized via the ForceAtlas2 algorithm (56) with the overlapping parameter’s speed 3.0, ratio (1.2) and margin 5.0. To estimate the number of nodes connected between different taxa or within one taxon in the soil, the function plot_sum_links was used to present the positive links from the function cal_sum_links via the chorddiag package (https://github.com/mattflor/chorddiag).
Results
Agronomic performance of potato plants and incidence of rhizoctonia canker disease
Various parameters (root biomass, aboveground biomass, tuber biomass, percentage of tubers showing rhizoctonia canker disease lesions, rhizoctonia canker disease index, gross yields and marketable yields) were measured to evaluate the effects of the fumigant chloropicrin and the Bacillus species-based biostimulant on agronomic performance of potato plants and rhizoctonia canker (black scurf) disease incidence caused by Rhizoctonia solani Kühn (Thanatephorus cucumeris). The results showed that the treatments had a significant impact on parameters variability. The application of biostimulant (T2) and fumigant (T3) alone led to a substantial increase in root biomass and tuber biomass measured at time-period P5 (Table 3). The application of biostimulant in fumigated soil (T4) showed the lowest aboveground biomass.
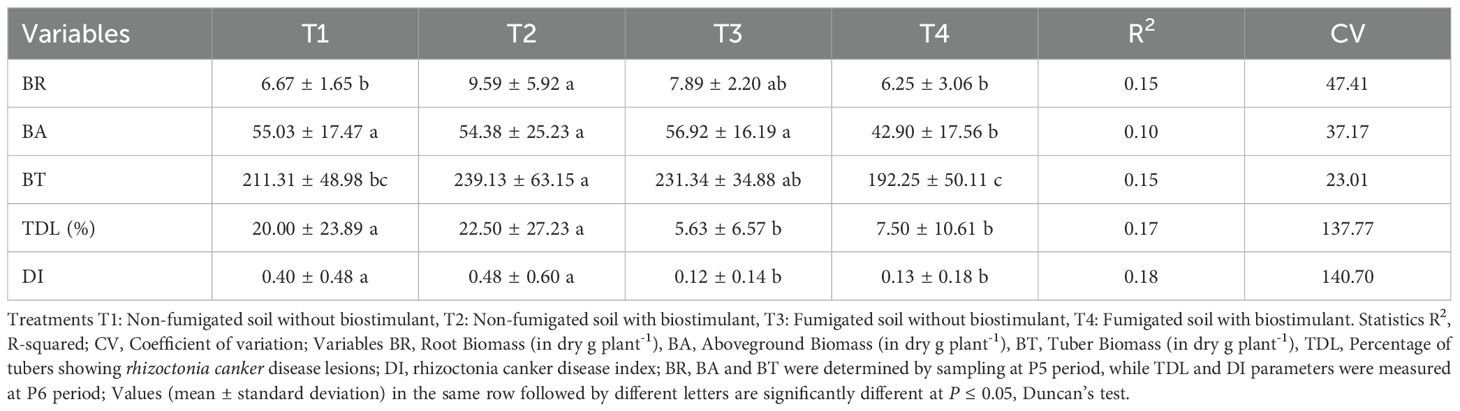
Table 3. Physio-agronomic performance of potato and incidence of rhizoctonia canker caused by Rhizoctonia solani in soil treated with fumigant and biostimulant alone or in combination.
The incidence of rhizoctonia canker disease varied among the plots treated with or without chloropicrin, as measured by the percentage of tubers showing disease lesions at harvested time P6. The control plots (T1) and the biostimulant inoculated in non-fumigated plots (T2) showed respectively 20.00% and 22.50% infected tubers, while the fumigated plots (T3) and the biostimulant inoculated in fumigated plots (T4) showed respectively 5.63% and 7.50% of diseased tubers (Table 3). The fumigation treatment, either alone or in combination with biostimulant, significantly reduced the rhizoctonia canker disease index (DI) values. Furthermore, DI values of treatments T3 and T4 are not different and are significantly smaller than the DIs of treatments T1 and T2 (Table 3). The T2 treatment increased the biomass values (root and tuber biomass) when applied to control soils, whereas the inoculation of the Bacillus species-based biostimulant in fumigated soils reduced the values of the three biomasses compared to fumigated soils without biostimulant inoculation (Table 3).
The results from the study on the agronomic performance of potato plants and incidence of rhizoctonia canker disease showed that there was a significant difference in the average gross yields among the four treatments. As depicted in Figure 1, the potato gross yields were 332.98, 317.23, 356.43, and 360.43 cwt. acre-1, respectively, for T1, T2, T3, and T4 treatments. The fumigated plots (T3 and T4) had a significantly higher yield compared to the non-fumigated plots, with an increase of 23.5 cwt. acre-1 (7.06%) and 28 cwt. acre-1 (8.41%), respectively, when compared to the average gross yield of T1 plots.
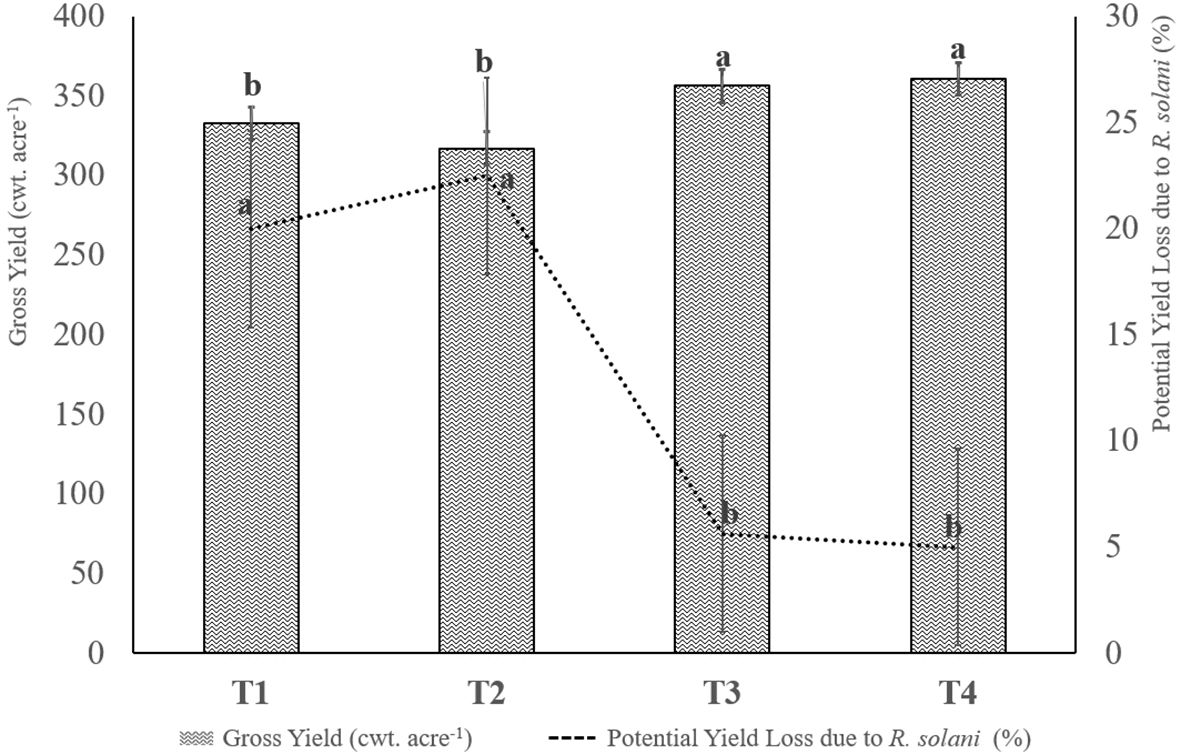
Figure 1. Effects of the treatments on potato gross yield and on relative proportion of potential yield losses due to the severity of Rhizoctonia solani disease (superficial lesions coverage of tuber surface ≥ 5%). Treatments not sharing a letter are significantly different at P ≤ 0.05 according to one-way analysis of variance (ANOVA) among treatments. T1: Non-fumigated soil without biostimulant, T2: Non-fumigated soil with biostimulant, T3: Fumigated soil without biostimulant, T4: Fumigated soil with biostimulant.
The intensity of rhizoctonia canker disease also had a significant impact on the marketable yield of potatoes. Control plots (T1) and non-fumigated soil with biostimulant, (T2) plots showed respectively a 20.0% and 22.5% loss in marketable yield due to the disease, while treated plots T3 and T4 had significantly lower losses of 5.6% and 5.0%, respectively. The losses were calculated based on the presence of rhizoctonia canker lesions symptoms covering more than 5% of the tuber surface.
Absolute fungi abundance in soil throughout the growing season
To investigate the effect of chloropicrin fumigation and Bacillus species-based biostimulant on the absolute fungi abundance in soil during the growing season, a qPCR protocol was used with specific primers targeting the ITS1 regions of fungi. The results showed that the number of fungi in soil varied depending on the fumigation of the plots (Figure 2). Prior to treatment (P1), the average quantity of fungi was estimated at 8.11± 0.14 Log AU g-1 dry soil across all experimental plots. At P2 (6 days after fumigation) the average number of fungi in non-fumigated T1 and T2 plots was 8.21± 0.17 Log AU g-1 dry soil, compared to 7.92± 0.08 Log AU g-1 dry soil in fumigated T3 and T4 plots. The small 6-day gap between fumigation and the P2 sampling-period of the composite soils may have allowed the extraction of DNA from fungal propagules killed by fumigation but whose DNA had not been completely destroyed. At P2, the assessment of absolute fungal abundance by qPCR could thus be overestimated and may reduce the perception of fumigation effects. The highest median numbers of fungi were observed in T1 and T2 soils during P4 and P5 time-periods, while the lowest median numbers of fungi were observed in T3 plots during P3, P4, and P5 time-periods (Figure 2). This indicates that the effect of chloropicrin fumigation treatment on reducing the number of fungi in soil may take a few weeks to manifest itself in qPCR results, but it can persist throughout the growing season.
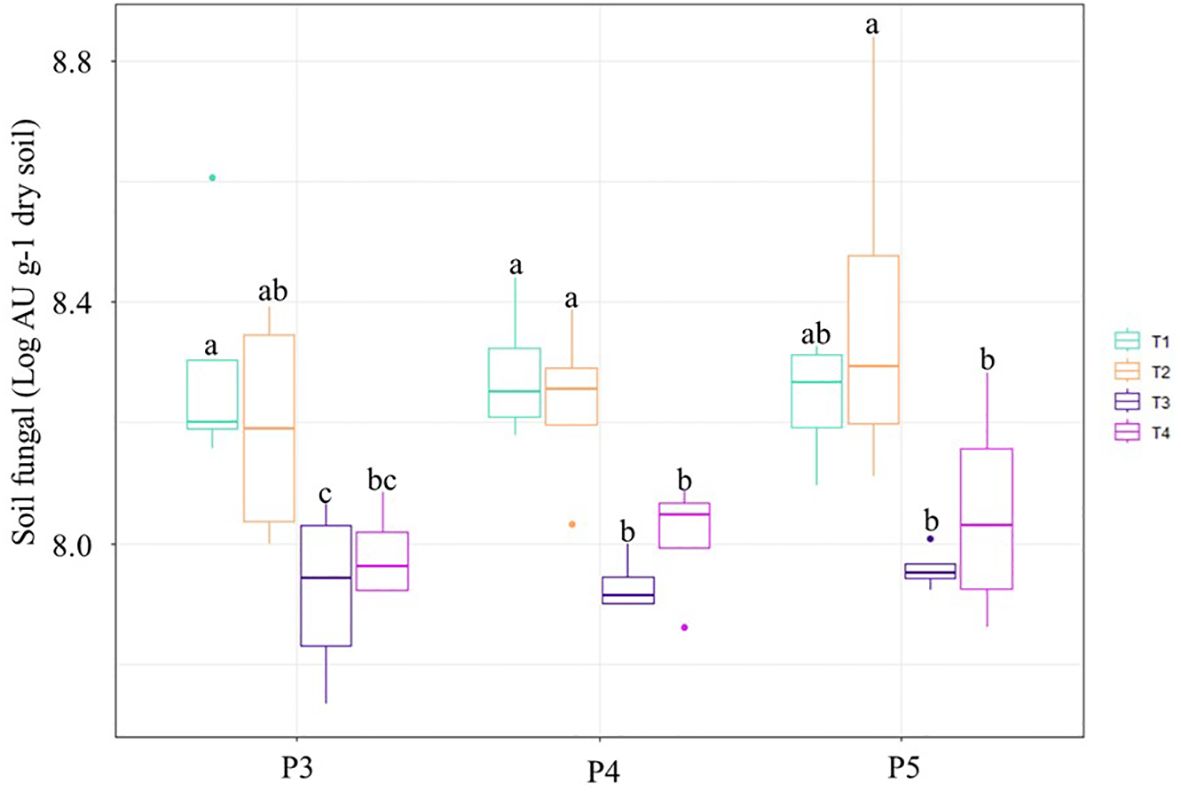
Figure 2. Box and whisker plots showing the quantitative abundances of soil fungi for each treatment and sampling-period points P3 to P5. The line inside the box represents the median, while the whiskers represent the lowest and highest values within the 1.5 interquartile range (IQR). Treatments comprised: non-fumigated soil without biostimulant (T1), Non-fumigated soil with biostimulant (T2), Fumigated soil without biostimulant (T3), Fumigated soil with biostimulant (T4). Treatments not sharing a letter above the boxes at any time-period are significantly different (Duncan test, P ≤ 0.05).
Assessment of alpha-diversity in soil fungal community
Several alpha-diversity indices were utilized to evaluate the effects of treatments and sampling time-periods on the richness and diversity of fungal communities (Figure 3). A significant interaction between treatments and time-periods was observed for the Shannon diversity, Pielou’s evenness, Chao1 richness, and unique ASV count (at P ≤ 0.05).

Figure 3. Violin plots of soil-fungal α-diversity indices across treatments (T1–T4) and sampling periods (P3–P5). (A) Shannon diversity; (B) Pielou’s evenness; (C) Chao1 richness; (D) Observed ASV count. Boxes show inter-quartile range, central lines indicate medians, and letters above violins denote significant differences between treatments at each period (Duncan test, P ≤ 0.05).
Results revealed that fumigated-treated soil (T3) and the biostimulant inoculation in fumigated soil (T4) exhibited lower Shannon diversity and Pielou’s evenness values at P3 and P4 time-periods than those of the control soil (T1) and the biostimulant-treated soil (T2) (Figures 3A, B). Additionally, the violin plots of Figure 3 showed bimodal distributions of fungal species as a function of time-periods for the four alpha-diversity indices variables in control (T1), biostimulant (T2), fumigant (T3) and combine biostimulant and fumigant -treated soils (T4).
This indicates that the T3 and T4 treatments had a transient effect on fungal Shannon diversity and Pielou’evenness during most of the growing season and the effect did not persist at P5 time-period. Figure 3 showed systematically higher variability among the values of Chao1 and Observed ASVs indices in biostimulant-treated non-fumigated soils (T2) from P3 to P5 time-periods, while during the same time-periods higher variability among the values of Shannon and Pielou’s evenness index was also observed in biostimulant-treated fumigated soils (T4).
Moreover, at P3 time-period only, the biostimulant-treated fumigated soil (T4) had significantly lower Chao1 richness and Observed index values compared to those of all other treatments (Figures 3C, D) (P ≤0.001). Additionally, the violin plots in Figure 3 showed bimodal distributions of fungal species, as a function of soil sampling-periods, for the four alpha diversity index variables in the control (T1), biostimulant (T2), fumigant (T3) or biostimulant-fumigant combination (T4) soils. This would suggest that specific groups of fungi were able to thrive in the fungal community at soil sampling-period because they were favored by the ecosystem conditions imposed by one, few, or all the treatments.
Assessing fungal diversity global composition under different treatments over time
Results from a permutational multivariate analysis of variance showed highly significant differences between the fungal diversity composition among the different treatments and time-periods (Table 4).
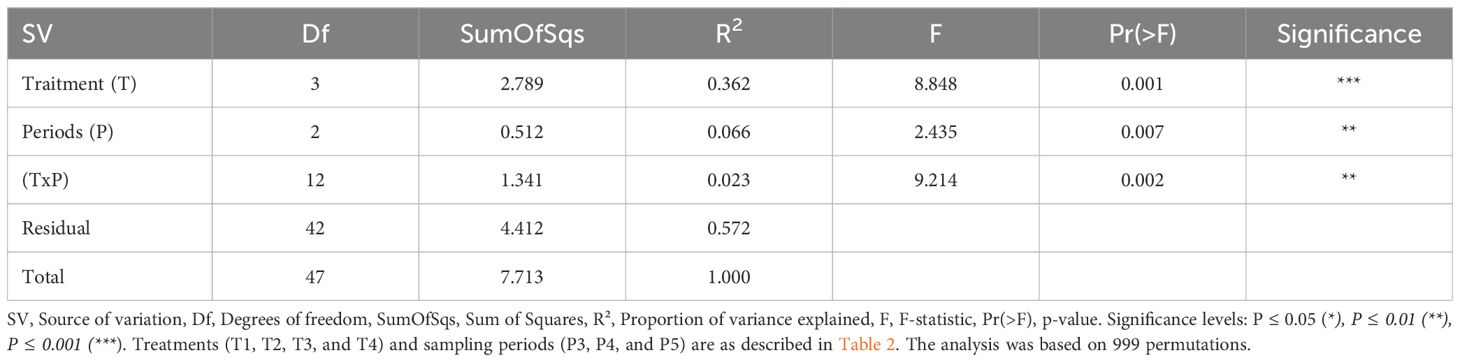
Table 4. Permutation test for adonis under reduced model of composition of fungal community composition in soils sampled at P3 through P5 periods.
A non-metric multidimensional scaling (NMDS) analysis also revealed an evolution in the composition of fungal diversity in plots of potato production over time (Figure 4). Fungal communities among the treatment plots at time-period P2 were less variable, indicating that the short-term effect of fumigation was not yet noticeable. However, from time-periods P3 to P5, the composition of fungal communities in treatments applied to non-fumigated soils (T1 and T2) were significantly different from those applied to fumigated soils (T3 and T4) (Figure 4). Interestingly, the biostimulant treatment also significantly altered the composition of fungi community in non-fumigated plots but it much less affected the composition in fumigated soils (Table 5, Supplementary Table S2). At P5, the composition of the soil fungal community became more variable among each treatment, with their fungal composition becoming less significantly different. Thus, our findings demonstrate a clear effect of the fumigant Chloropicrin and of the Bacillus species-based inoculant, which was particularly noticeable during time-periods P3 to P5 (Figure 4).
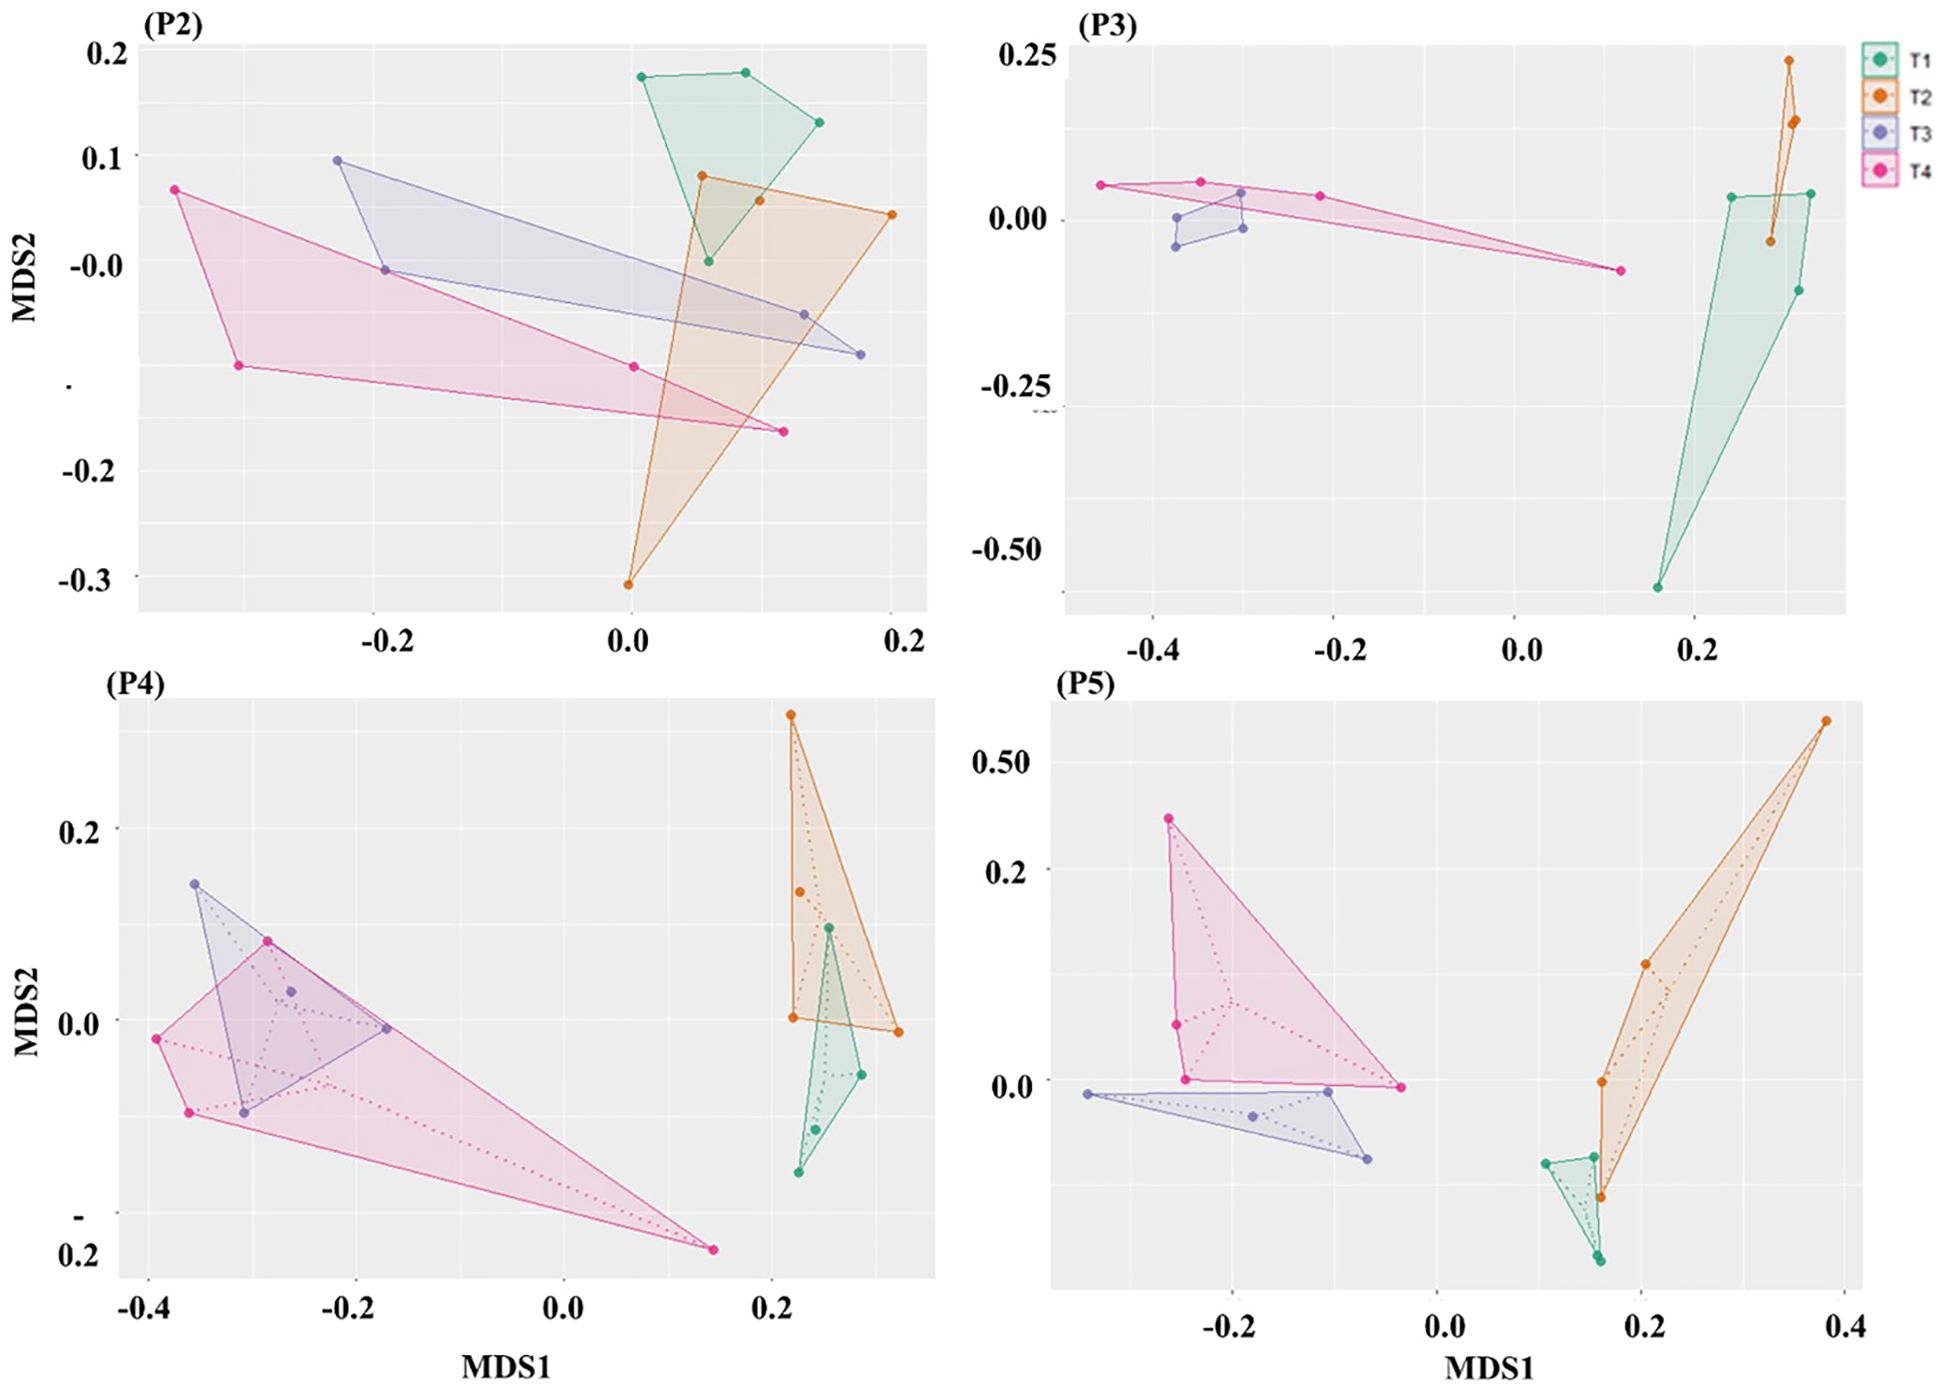
Figure 4. NMDS ordination based on Bray–Curtis distances comparing the composition of fungal community among treatments at each sampling time-period. The Non-metric Multidimensional Scaling (NMDS) ordination illustrates differences in fungal community composition across treatments (T1, T2, T3, T4) and sampling time-periods (P3, P4, P5) as described in Table 2. Significant differences in β-diversity between paired treatments at each time-period were assessed using PERMANOVA (permutations = 999, P ≤ 0.05).
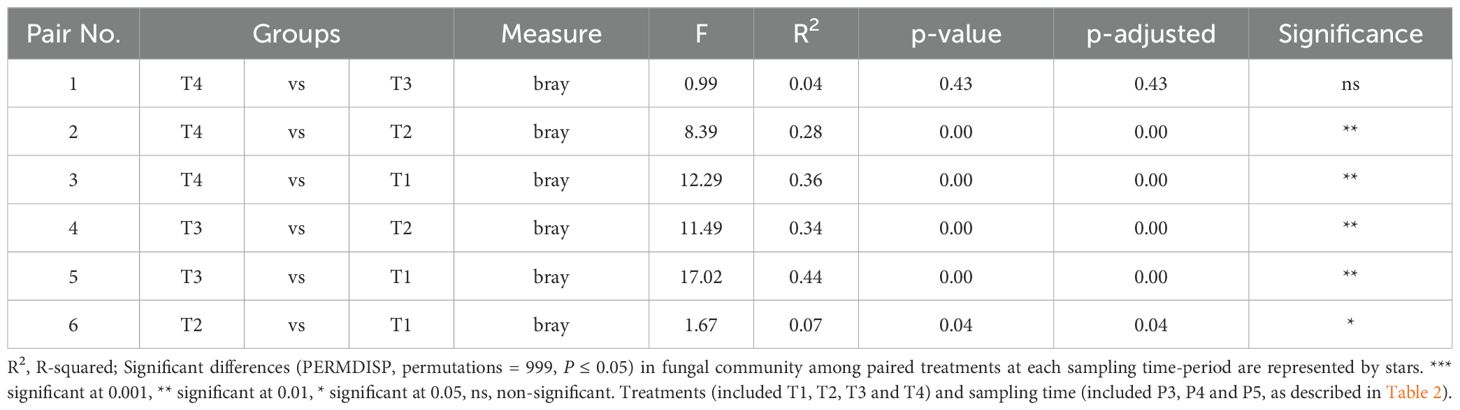
Table 5. PERMDISP test implemented to check multivariate homogeneity of treatments dispersions (variances) of fungal community compositions in soils sampled over all P3, P4 and P5 periods.
Fungal community composition
The taxonomic analyses of the fungal community composition provide insightful details into community shifts induced by soil treatments during the growing season. When the treatment fumigation alone (T3) was compared to the control (T1), the fungal family Hypocreaceae, and the genus and specie Trichoderma evansii, showed a noticeable high relative abundance in T3 plots throughout the growing season and the abundance of the family Aspergillaceae increased slightly at time-period P5. The relative abundance of several fungal families, genus and species in T3 plots decreased in comparison to those of T1 plots during time-periods P3-P4, while this decrease trend was less noticeable through P5 time-periods (Figure 5, Supplementary Table S2). When the treatment biostimulant alone (T2) was compared to the control (T1), the relative abundance of fungal family, genus and specie (Aspergillaceae, Aspergilus, A. caninus) increased at time-periods P4 and P5, while families (Chaetomiaceae, Plectosphaerellaceae, Nectriacea), genus (Humicola, Penicillium) and species (Plectosphaerella oratosquillae, Humicola olivacea) increased at P5. The biostimulant alone (T2) also decreased the relative abundance of families (Didymellaceae, Microascaceae, Hypocreaceae, Lasiosphaeriaceae), genus (Trichoderma, Cladorrhinum, Schizothecium, Nectria, Lophotrichus) and species (T. evansii, C. flexuosum, N. ramulariae, L.fimeti) (Figures 5). When the biostimulant inoculated in fumigated soil (T4) was compared to the treatment T3, only the families Chaetomiaceae and Microaeceae at time-period P3 and family Plectosphaerellaceae at time-period P5 showed an increased relative abundance (Figure 5A). The comparison of treatments T4 vs T3 showed an increase variability of the effect of the biostimulant measured on the relative abundance of the families, genus and species among the four T4 plots throughout the growing season (Figures 5).
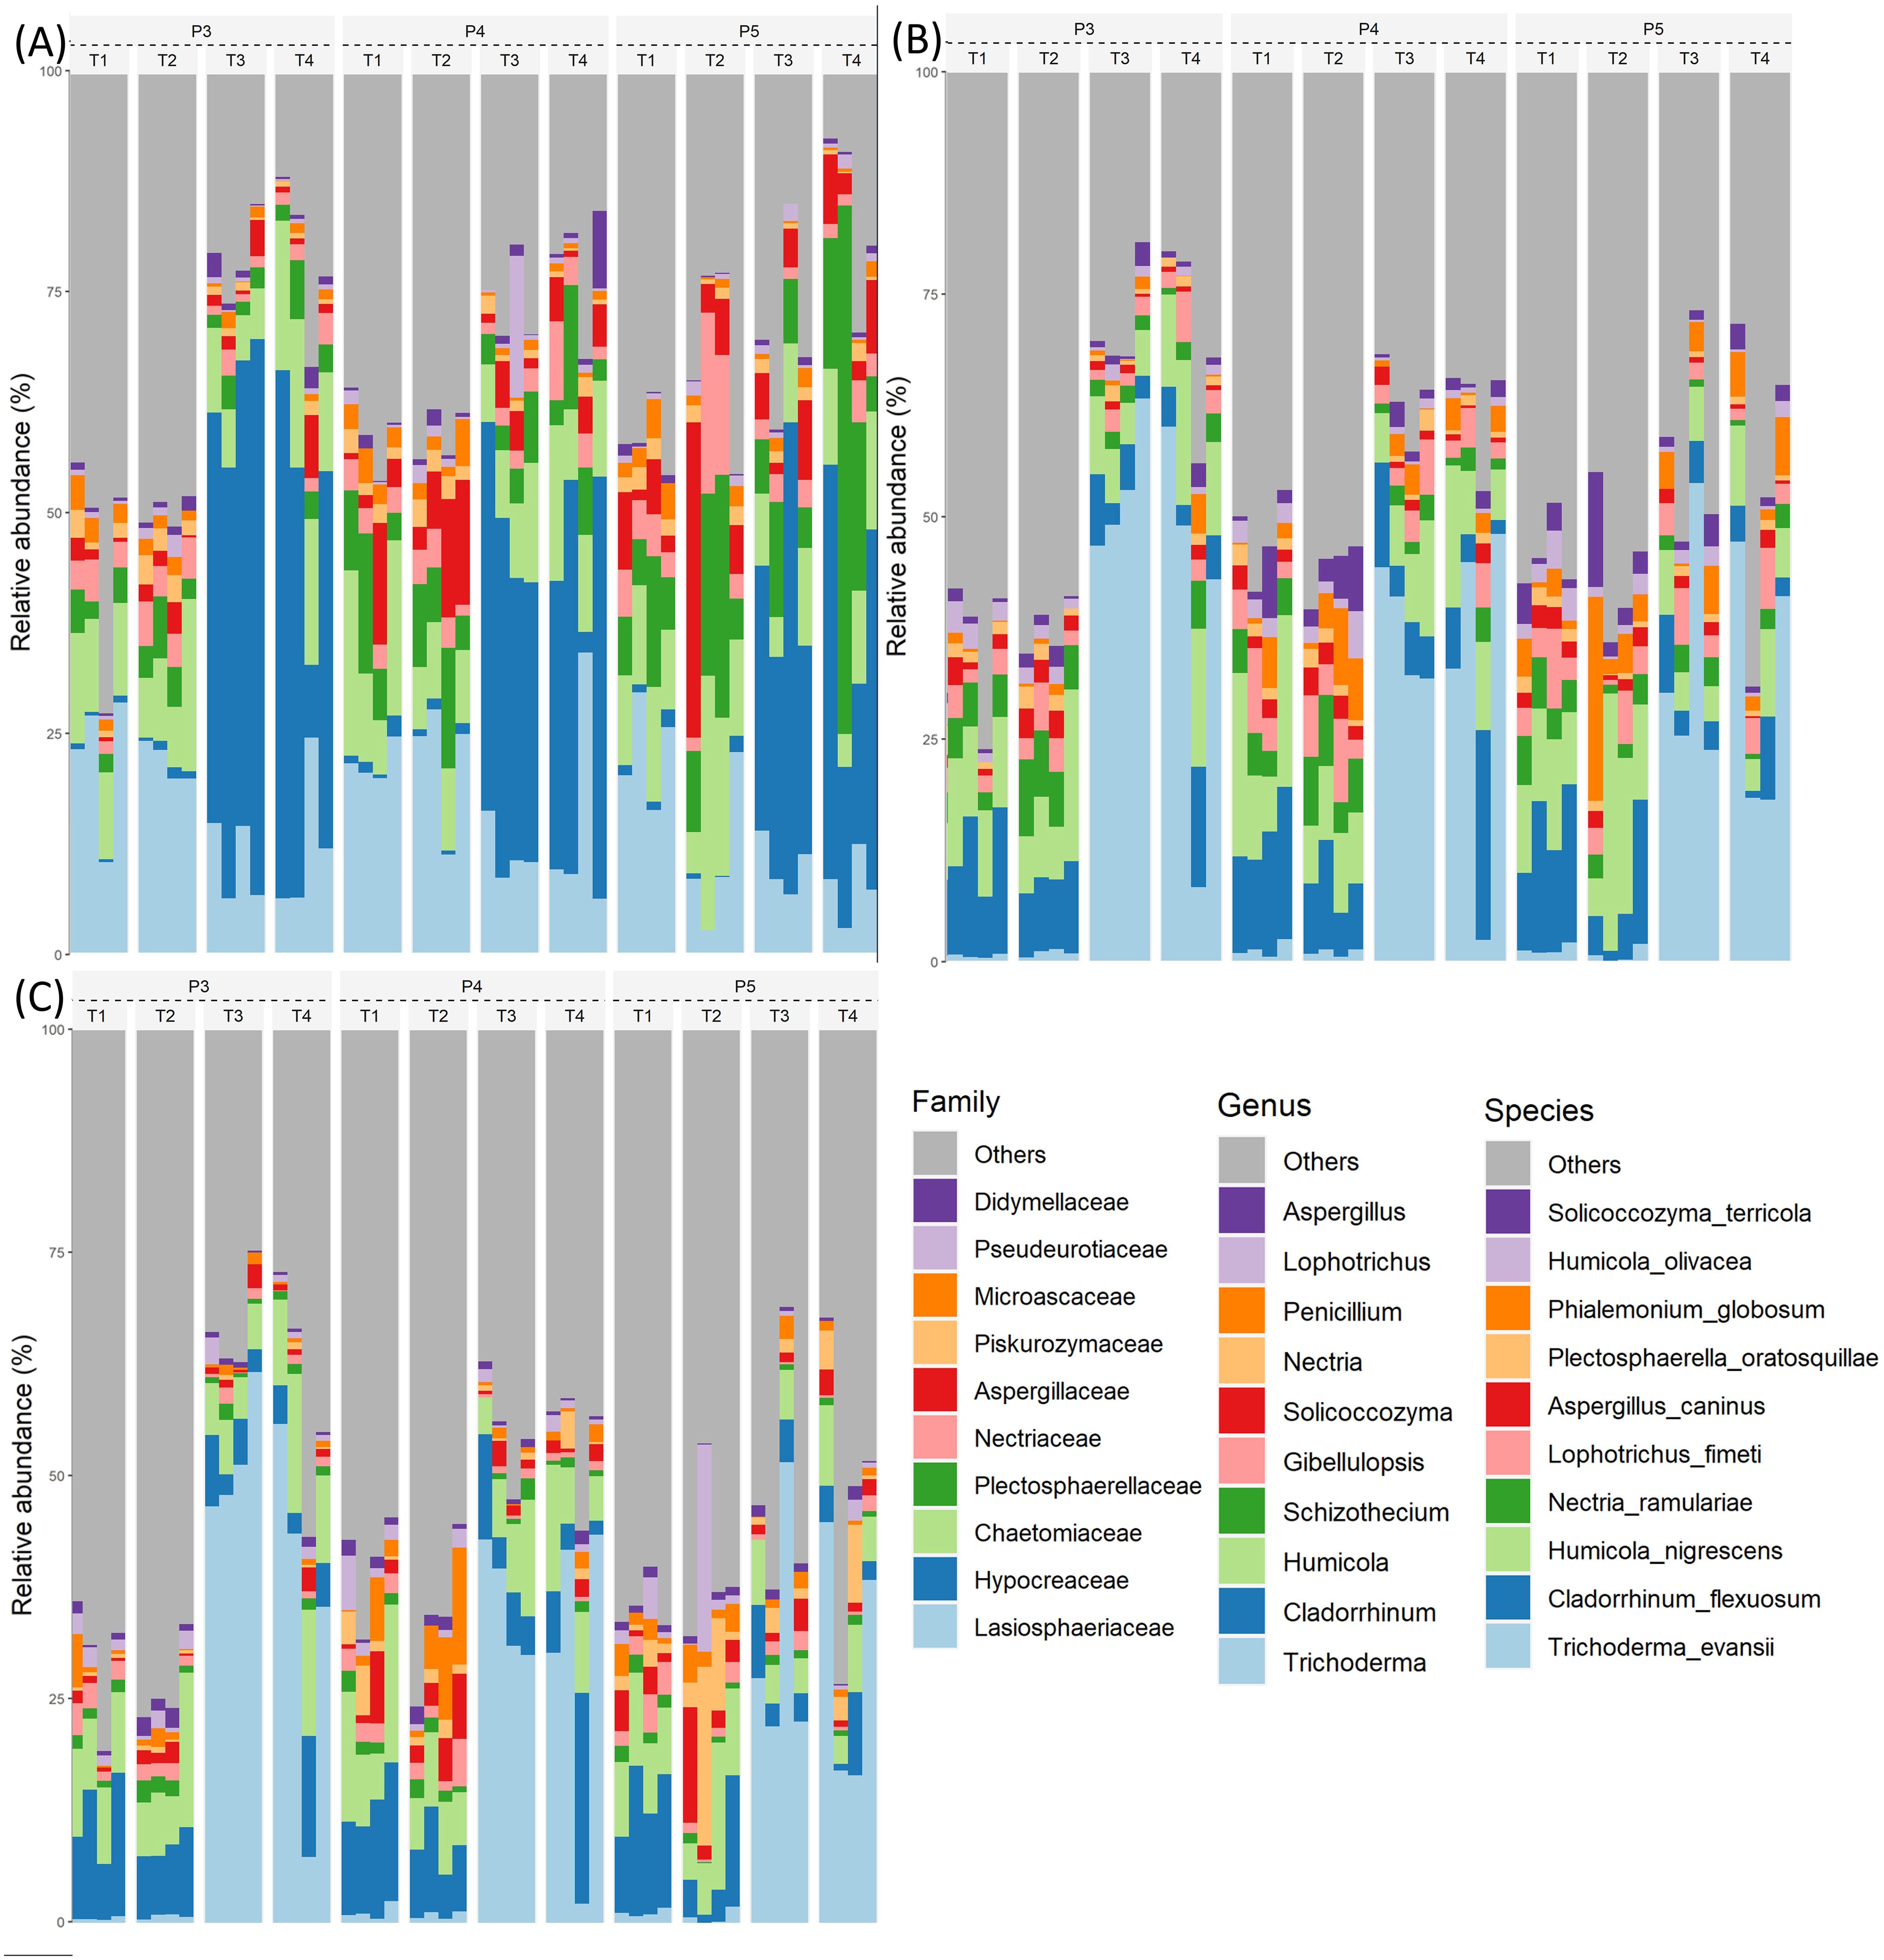
Figure 5. Relative abundance (%) of the top 10 fungal families (A), genera (B), and species (C) identified from ITS1 HTS amplicon sequencing over three time-periods (P3, P4 and P5) and across four different treatments (T1, T2, T3 and T4) Treatments and sampling time-periods are as described in Table 2.
Identification of fungal pathogens
We analysed our ITS1 ASV sequences database to provide taxonomic perspective where we observed many ASVs classified as Fungi – Basidiomycota – Agaricomycetes – Cantharellales, with no finer taxonomic assignment beside “NA” at Family/Genus level. The Cantharellales order includes Ceratobasidiaceae family known to harbor plant pathogenic fungi such as Rhizoctonia solani, a soil-borne pathogen causing stem canker and black scurf on potato tubers. Given its taxonomic placement in our database, the ASV 3b9531f47e78eff3daec652cc86ec07f likely represents a putative Rhizoctonia-like fungus. This putative Rhizoctonia spp. ASV was detected only in Basidiomycota sequences groups, suggesting that no Ascomycete pathogen (like Fusarium or Alternaria) shares this ASV’s sequence. The dynamics of ASV 3b9531f47e78eff3daec652cc86ec07f total number of sequences varied across treatments T1 to T4. and sampling-periods (P3-early, P4-mid, and P5-late season).
Indeed, in our ASVs database, a grand total of 91–507 sequences were detected in cumulative soil samples from treatment T1while the grand total of reads cumulated in soil samples from T2, T3 and T4 were respectively 98 483, 91–870 and 85 605 (Table 6). A total of 821 reads from a putative Rhizoctonia spp. ASV were detected in all three sampling-periods of the control (T1) and among these sequences, 27% were detected at P3, 4% at P4 and 68% at P5 (Table 6). For the biostimulant inoculated in non-fumigatd soil (T2), almost all the 786 total sequences were detected in P3 time-period. Finally, 74 reads were detected in fumigated soil T3 at time-period P5 while none read was detected in T4 at any time-period (P3 to P5). These observations indicate that the chloropicrin fumigation reduced drastically the detection of the putative Rhizoctonia spp. ASV and the effect of fumigation alone (T3) seems to vanish late in season (Table 6).
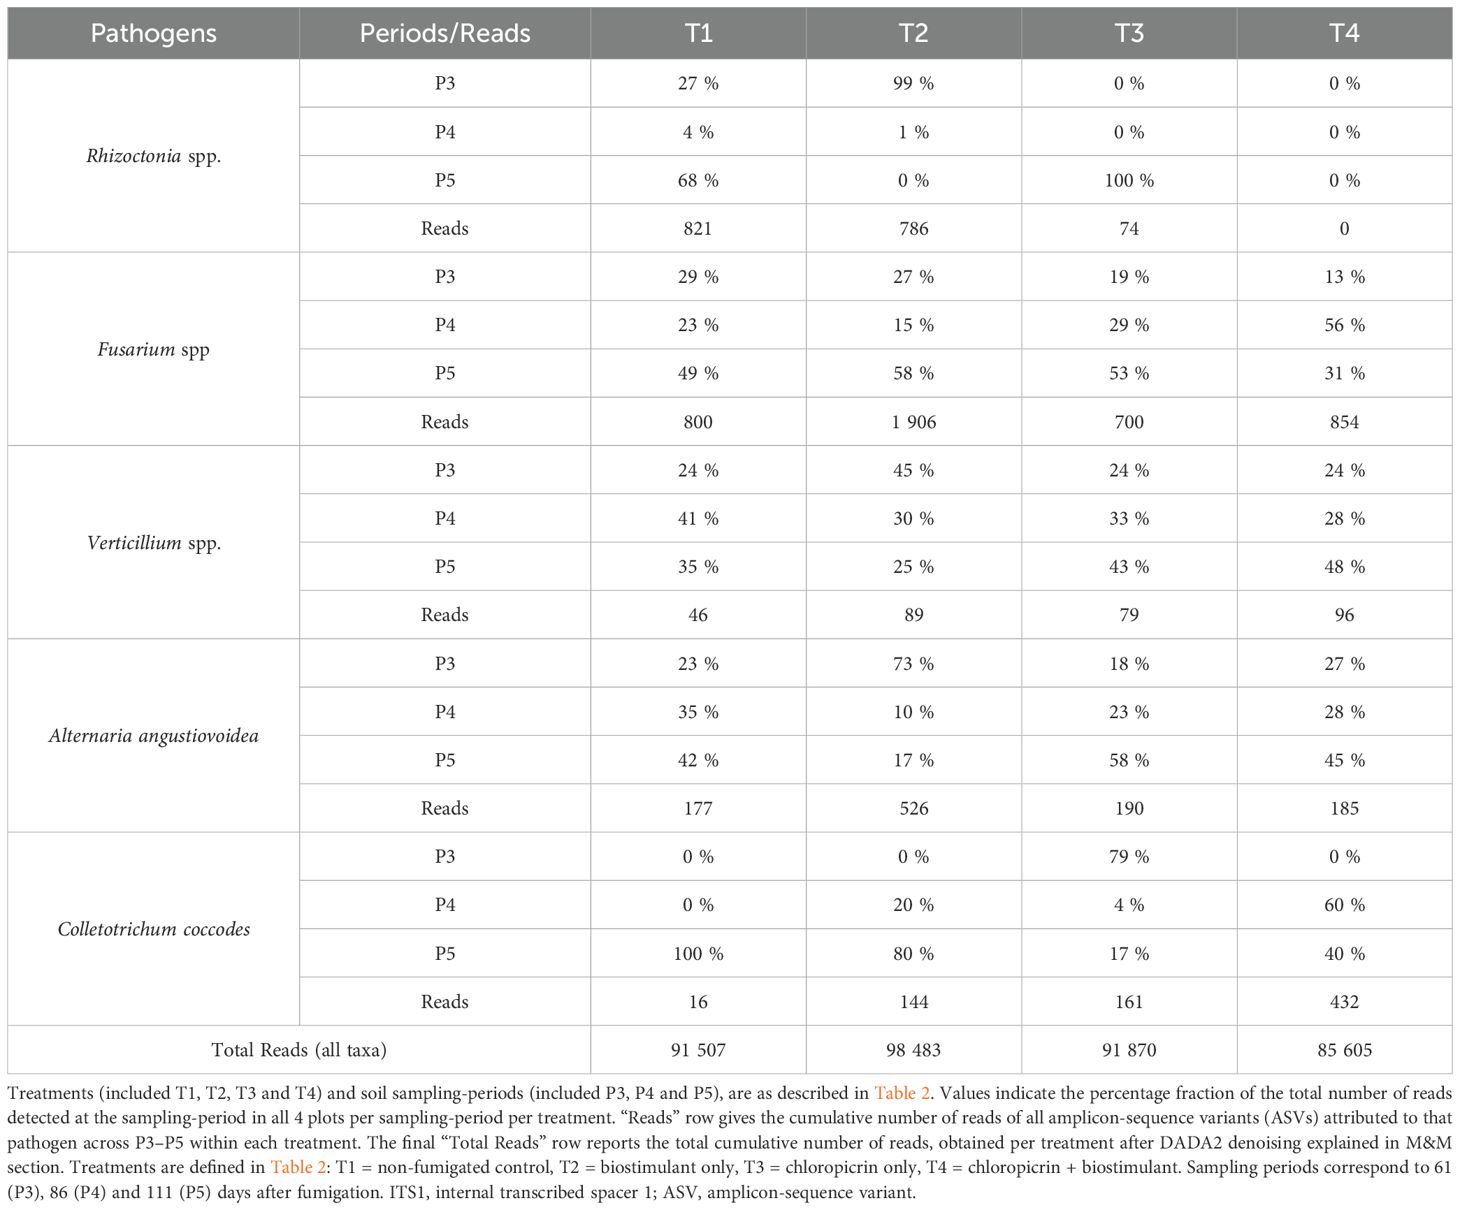
Table 6. Occurrence of potato pathogens across treatments and time-periods.
Our ITS metabarcoding analysis among ASV sequences database identified other fungal taxa associated with potato diseases. A number of ASV associated with known potato pathogenic fungi were detected, the majority of them at low relative abundance in the soil fungal community (Table 6). These included ASVs phylogenetically linked to Fusarium spp., or Verticillium spp., or Alternaria spp. or Colletotrichum coccodes (Table 6).
In our database, ASVs linked to genus Fusarium spp. showed 800, 1906, 700 and 854 total number of reads in respectively T1, T2, T3 and T4 plots (Table 6). In control soil (T1), among the 800 reads detected, the proportion of relative abundance varied from 29% (P3), 23% (P4) to 49% (P5). In biostimulant applied in non-fumigated soil (T2), among the 1906 reads detected, the percentage of relative abundance varied from 27% (P3) to 58% (P5). Meanwhile, a total of 700 and 854 reads were detected in fumigated soil (T3) and biostimulant applied in fumigated soils (T4) plots respectively showing the proportion of relative abundance of 19% and 13% at P3 sampling-time, of 29% and 56% at P4 and of 53% and 31% at P5 (Table 6). Globally, over a dozen Fusarium spp. are notorious causes of potato dry rot and other diseases. Interestingly, the biostimulant alone (T2) did not suppress Fusarium; in fact, T2 showed slightly higher reads of Fusarium ASVs at P5 than T1. This suggests that the Bacillus species-based biostimulant did not antagonize soil Fusarium spp. ASVs and may have indirectly favored their proliferation.
ASVs linked to genus Verticillium spp. were detected at a very low total number of reads, 46, 89, 79, 96 in respectively T1 to T4 treatments (Table 6). In all treatments, Verticillium spp. ASVs were detected in only a few samples (generally <5% of plots) but the percentage of the abundance was relatively similar among the three time-periods yielding negligible total number of reads for each treatment. Overall abundance was so low that no clear treatment trends emerged (all read values per treatment <0.05% total reads for the treatment).
ASVs linked to genus Alternaria spp. (including A. angustiovoidea) showed 177, 526, 190 and 185 total number of reads in respectively T1, T2, T3 and T4 plots (Table 6). In control soil (T1), among the 177 reads detected, the proportion of relative abundance varied from 23% (P3), 35% (P4) to 42% (P5). Among the 526 reads detected in T2 treatment, the percentage of relative abundance varied from 73% (P3) to 17% (P5). Meanwhile, a total of 190 and 185 reads were detected in fumigated soil (T3) and biostimulant applied in fumigated soils (T4) plots respectively showing the proportion of relative abundance of 18% and 27% at P3 sampling-time, of 23% and 28% at P4 and of 58% and 45% at P5 (Table 6). Overall, the total number of reads per treatment for Alternaria spp. was lower than those detected for Fusarium spp., but both genus showed similar trend when T1 and T2 treatments were compared to T3 and T4. By the end of the season at time-period P5, the proportion of relative abundance increased at the time when effect of the fumigation was fading.
ASVs linked to Colletotrichum coccodes were detected sporadically across treatments and sampling periods (Table 6). In non-fumigated soils T1 and T2 much of the reads have been detected at time-period P5, while in fumigated soil T3 the higher proportion of relative abundance was detected at P3 and at P4 in biostimulant applied in fumigated soil T4.
Venn diagram analysis of treatments effect on fungal ASVs repartition
Furthermore, we investigated the impact of biostimulant and chloropicrin fumigation treatments on the abundance of global Amplicon Sequence Variants (ASVs) in the soil fungal community. Our analysis focused on examining changes in ASV abundance and composition over time, as illustrated in Figure 6.
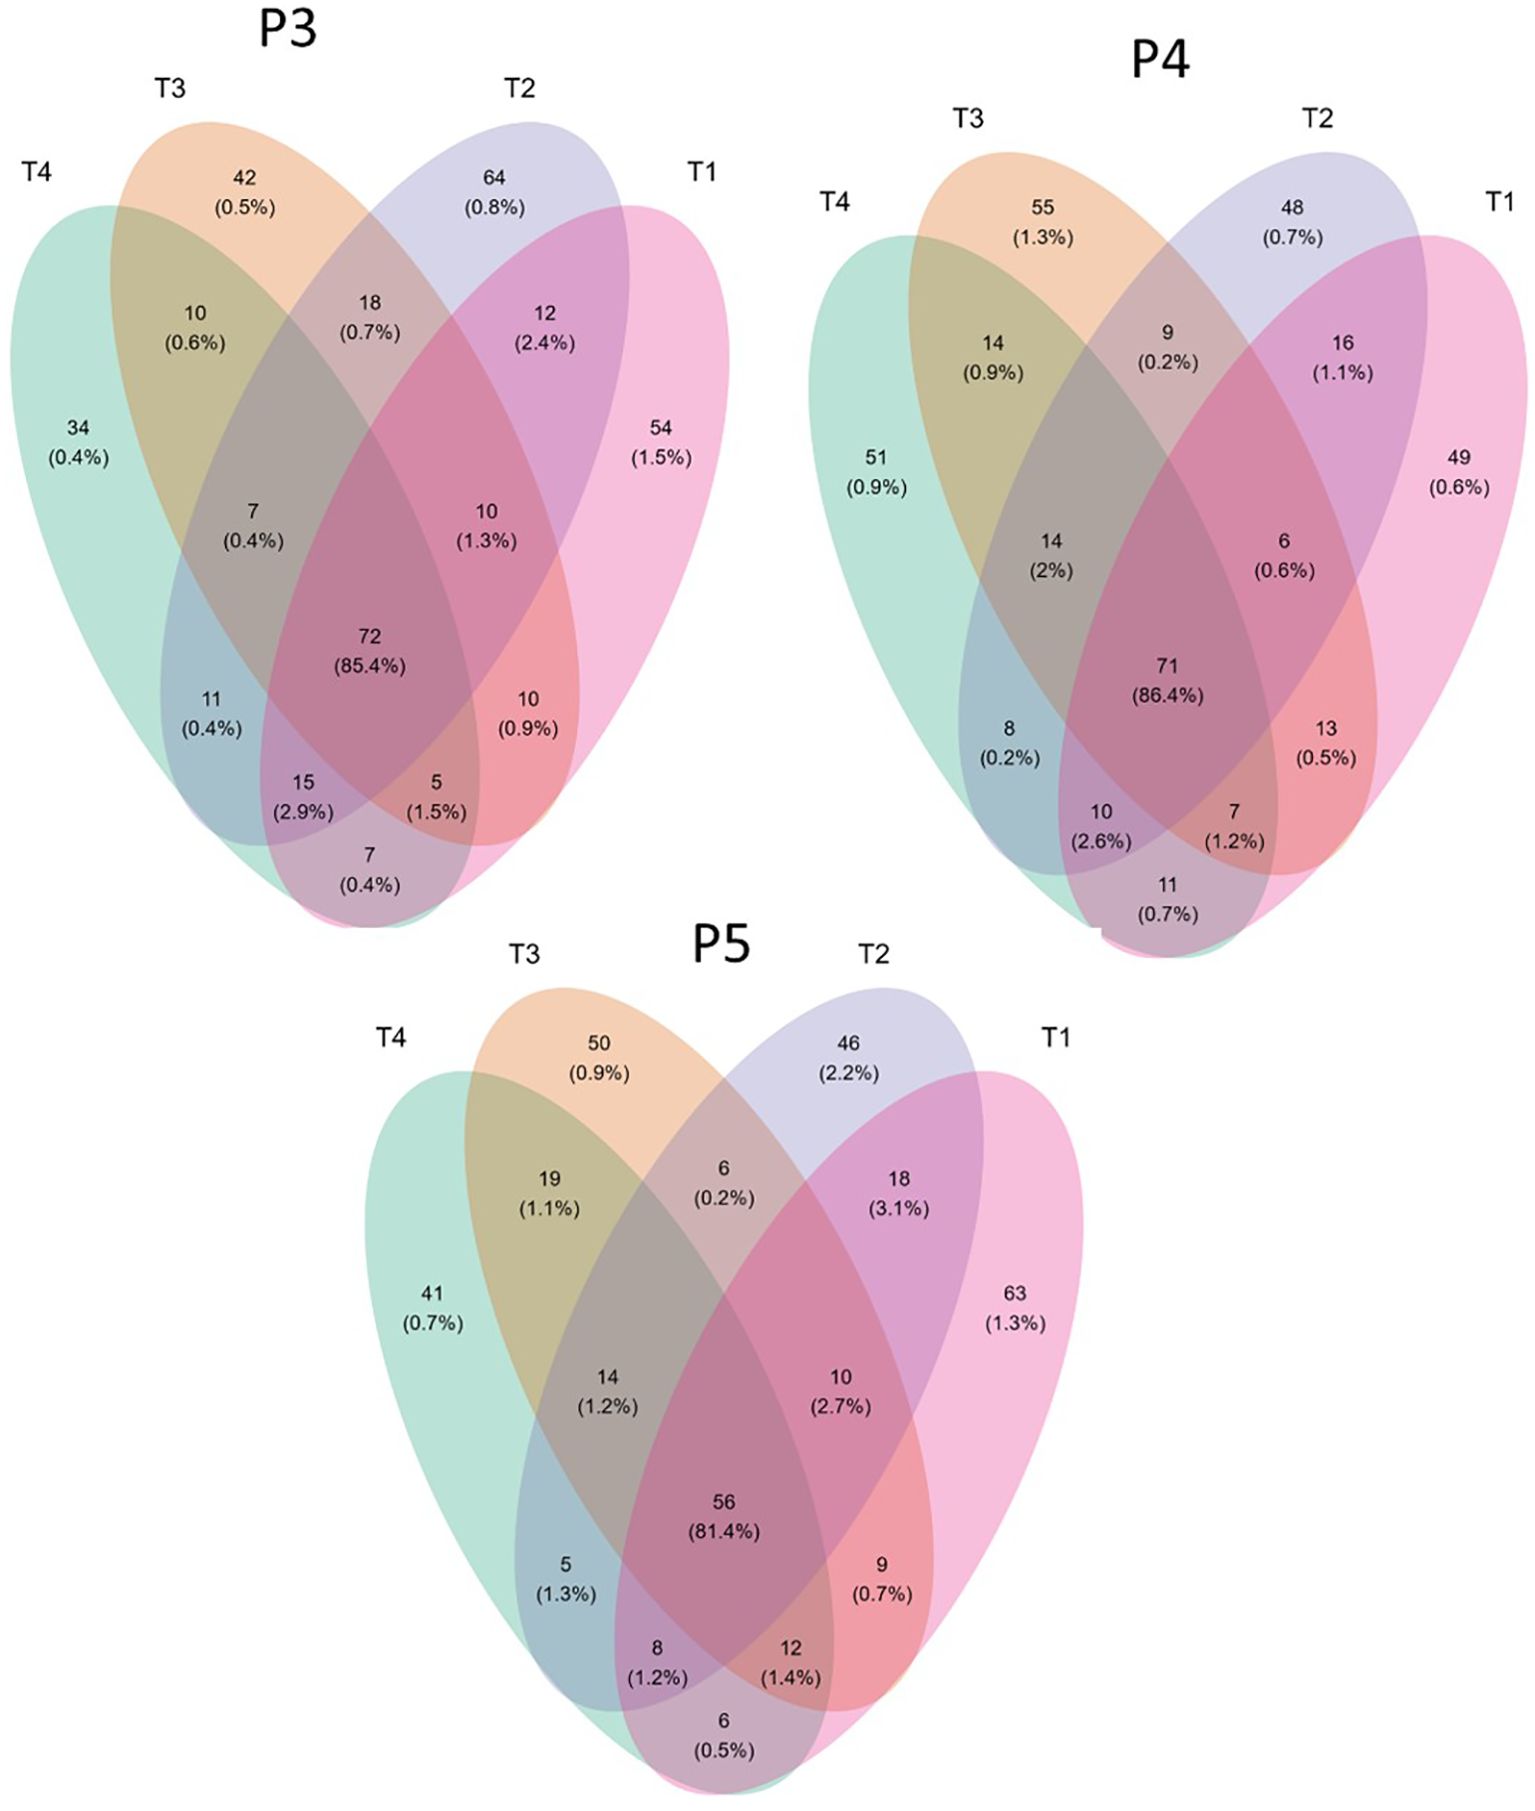
Figure 6. Venn diagram showing the overlapping rates of fungi abundance under different treatments and time-periods during growing season. Treatments (T1, T2, T3 and T4) and sampling time-periods (P3, P4 and P5), as described in Table 2.
During time-period P3, a total of 194 significant retained ASVs were identified. Specifically, 54 ASVs were exclusively found in untreated control soils (T1), while 42 ASVs were exclusively present in fumigated soil (T3). Additionally, 10 ASVs were shared between T1 and T3. 64 ASVs were exclusively found in biostimulant-treated plots (T2), with 12 ASVs overlapping between T1 and T2. In contrast, 34 ASVs were exclusively found in plots treated with both biostimulant and fumigation (T4), with 7 ASVs overlapping with T1.
In time-period P4, a total of 203 retained ASVs were identified. Among these, 49 ASVs were exclusively found in untreated control soils (T1), while 55 ASVs were exclusively present in fumigated soil (T3). Additionally, 13 ASVs were shared between T1 and T3. Moreover, 48 ASVs were exclusively found in T2 plots, with 16 ASVs overlapping with T1. Similarly, 51 ASVs were exclusively found in T4 plots, with 11 ASVs overlapping with T1.
For time-period P5, a total of 200 significant retained ASVs were identified. Among these, 63 ASVs were exclusively found in untreated control soils (T1), while 50 ASVs were exclusively present in fumigated soil (T3). Furthermore, 9 ASVs were shared between T1 and T3. Additionally, 46 ASVs were exclusively found in T2 plots, with 18 ASVs overlapping between T1 and T2. Similarly, 41 ASVs were exclusively found in T4 plots, with 6 ASVs overlapping with T1.
We observed a significant reduction in the number of ASVs in both T3 and T4 plots compared to T1 and T2 plots across the sampling dates from P3 to P5. This reduction can be attributed to the fumigation treatment. Of particular interest is the impact of the biostimulant application on the fungal community in both non-fumigated (T2) and fumigated (T4) soils. The application of Bacillus species-based biostimulant in T2 plots increased more the number of fungal ASVs at time-period P3, but less at time-periods P4 and P5 when compared to the impact of fumigated-only plots (T3).
Among the retained ASVs, 72, 71, and 56 were shared across the plots in P3, P4, and P5, respectively. These shared ASVs represented a significant proportion (85.4%, 86.4%, and 81.4% for P3, P4, and P5, respectively) of the cumulative relative abundance of ASVs.
In summary, our findings demonstrate that both biostimulant and fumigation treatments, as well as the time-periods, significantly influenced the composition of the soil fungal community, including the ASVs linked to potato’s pathogens, such as Ceratobasidiaceae family. Additionally, the application of biostimulant exhibited a positive impact on the fungal community in both non-fumigated or fumigated soils.
Effects of treatments on network of interactions within the soil fungal community
The effect of Bacillus species-based biostimulant on the network of interactions within the soil fungal community in non-fumigated or fumigated soil was investigated by assessing the number of linkages (edges) and nodes connected within and between different fungal taxa (Figure 7). Each treatment showed notable changes in the network of interactions observed among several fungal classes. Notably, our network analysis revealed marked alterations in the interactions among fungal taxa within the Agaricomycetes—which include Rhizoctonia solani, the principal pathogen causing rhizoctonia canker.
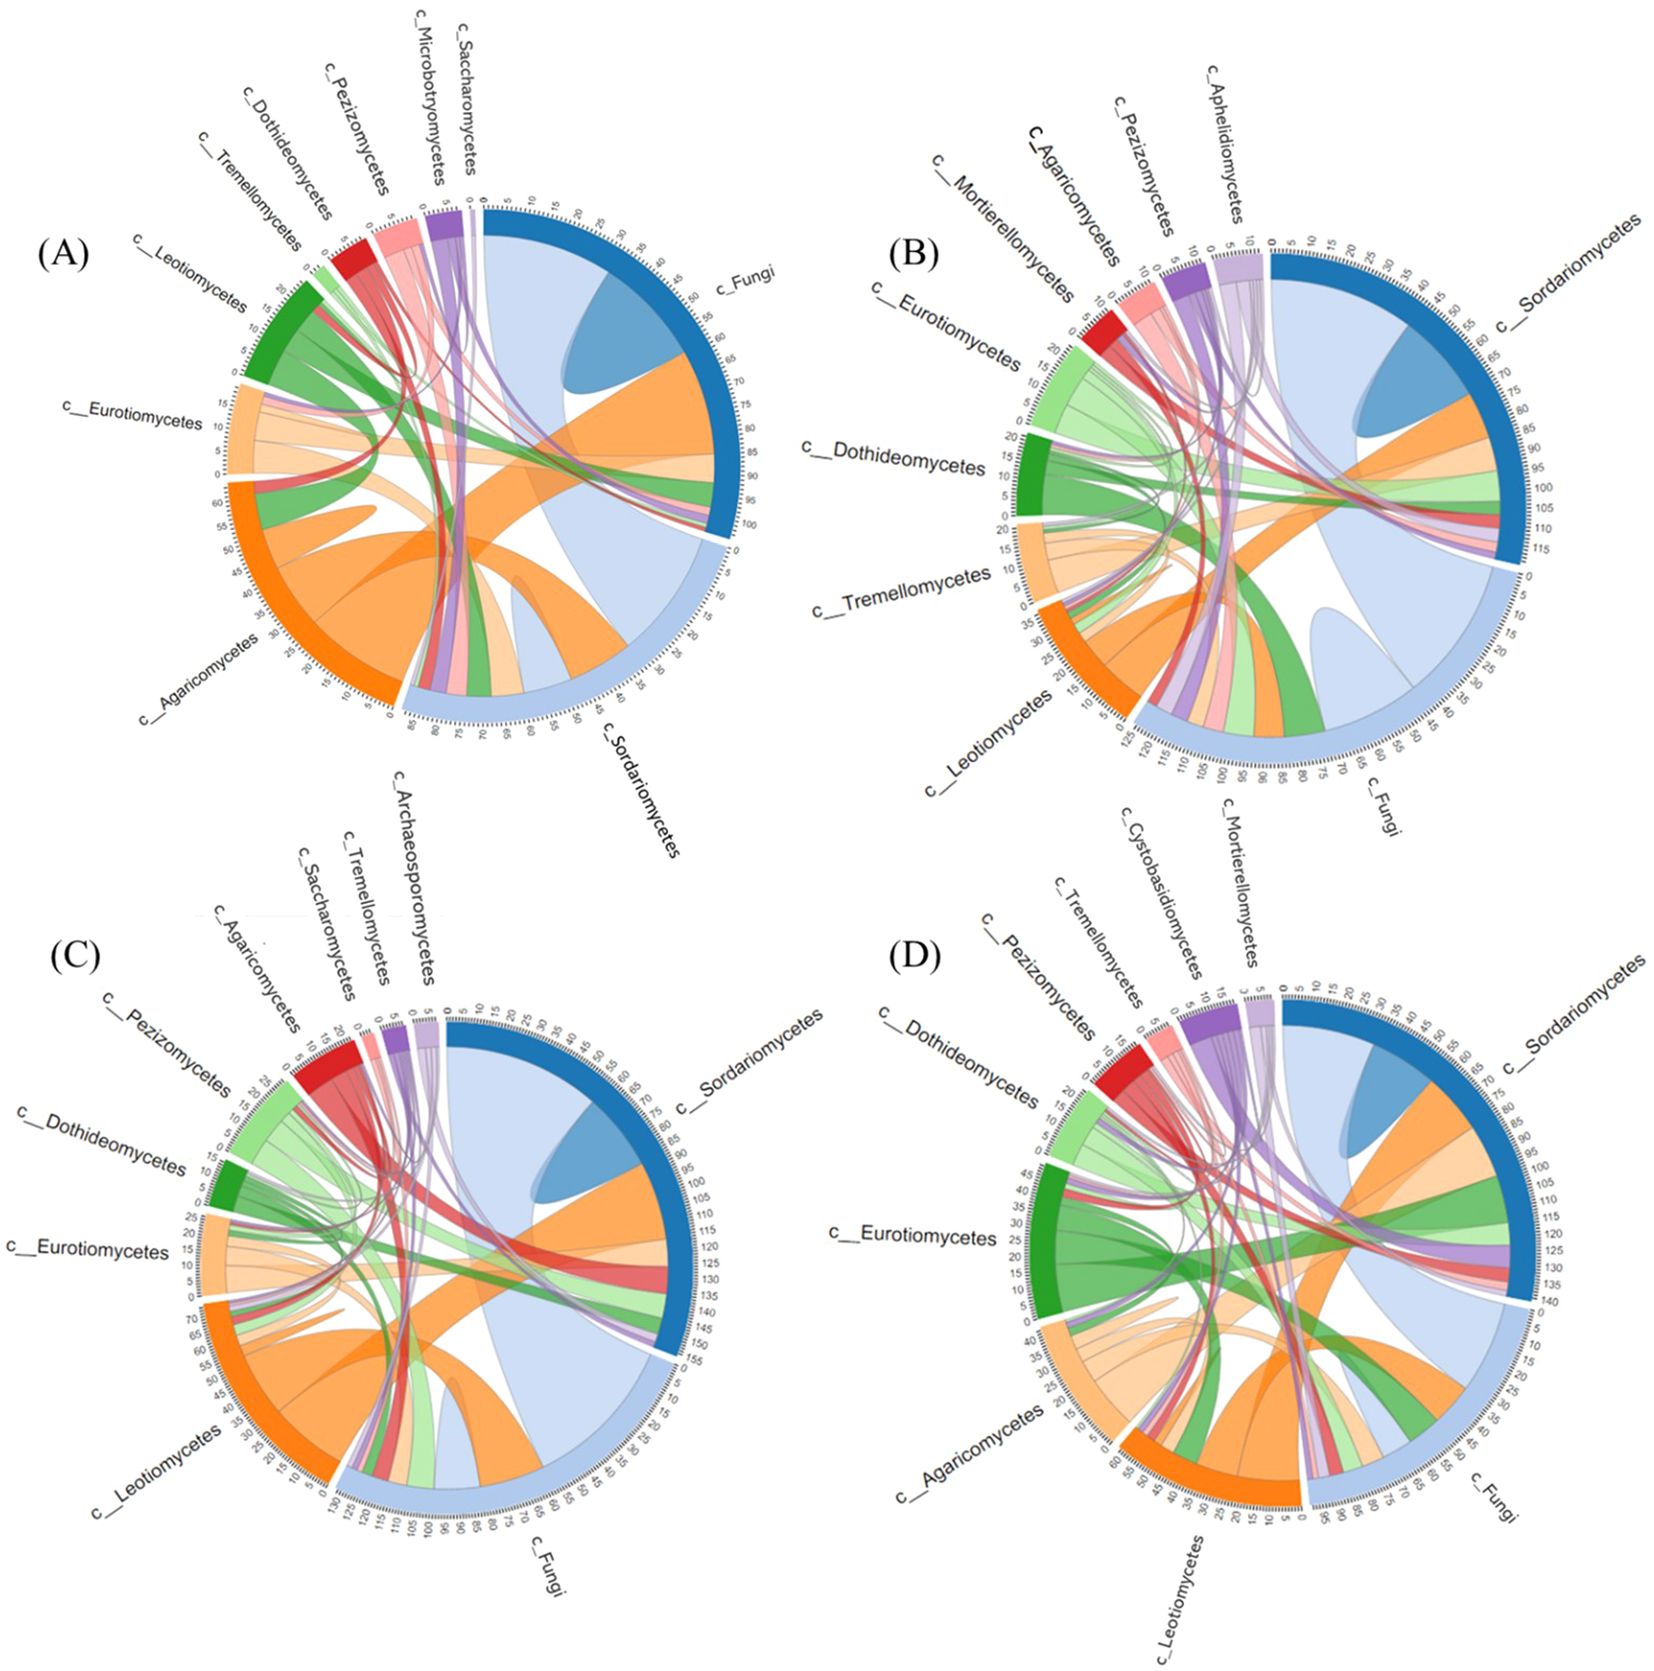
Figure 7. Plots showing the number of edges and nodes connected between different fungal taxa or within one taxon for treatments T1 (A), T2 (B), T3 (C) and T4 (D). The numbers along the outside of the circular plot represent how many edges or linkages are related within a fungal class. Treatments (T1, T2, T3 and T4) and sampling time-periods (P3, P4 and P5) are as described in Table 2. C_Fungi is a class non identified, corresponding to ASV ID: ba31d0645888ca71698061dda793e3ff.
As shown in Figures 7A, B, inoculating the biostimulant in non-fumigated soil (T2) increased the number of connections within and between several fungal classes in comparison to the treatment control T1 (Figure 7B). The increase effect was predominantly observed in the Tremellomycetes, Pezizomycetes, Dothideomycetes, Eurotiomycetes, Leotiomycetes, and Sordariomycetes classes. Conversely, in T2 plots, the number of connections of Agaricomycetes and Saccharomycetes decreased over the course of the season. In T2, this decrease in Agaricomycetes connectivity albeiting to a lesser degree, which may reflect competitive suppression or antagonistic interactions promoted by the biostimulant.
On the other hand, as shown in Figures 7A, C, soil fumigation alone (T3) induced a significant reduction in the number of connections within and between several fungal classes in comparison to the non-fumigated soil control (T1). This reduction effect was particularly noticeable in the Agaricomycetes class, which is one of the most abundant. The number of network connections within the Agaricomycetes was substantially reduced relative to the control (T1), suggesting that chloropicrin fumigation effectively suppresses populations of this pathogenic group. As well, this reduction was compensated by a substantial increase in connections within the Pezizomycetes, Dothideomycetes, Eurotiomycetes, Leotiomycetes, and Sordariomycetes classes (Figure 7C).
The combined use of the biostimulant and fumigant (T4) induced a reduction of the effect caused by the soil fumigation alone (T3) treatment, as depicted in Figure 7D. This reduction effect was observed in the Agaricomycetes, Saccharomycetes, and C_Fungi classes, indicating that adding the biostimulant to fumigated soil could enhanced the impact of fumigant. At the same time, the combined treatment (T4) increased the number of connections in the Mortierellomycetes, Cystobasidiomycetes, Tremellomycetes, Pezizomycetes, Dothideomycetes, Eurotiomycetes, and Leotiomycetes classes (Figure 7D). Furthermore, a detailed analysis of the Sordariomycetes class revealed interesting patterns. In the control soils (T1), approximately 85 edges were associated with ASVs in Sordariomycetes. Out of these, around 13 edges connected ASVs within Sordariomycetes, and approximately 35, 15, and 7 edges connected ASVs from Sordariomycetes with ASVs from C_Fungi, Agaricomycetes, and Eurotiomycetes, respectively (Figure 7A). Conversely, fumigated soils without biostimulant application (T3) had around 155 edges associated with ASVs in Sordariomycetes, of which roughly 25 edges connected ASVs within Sordariomycetes, and approximately 55, 10, and 10 edges connected ASVs from Sordariomycetes with ASVs from C_Fungi, Agaricomycetes, and Eurotiomycetes, respectively (Figure 7C). In biostimulant-treated non-fumigated soil (T2), around 115 edges were associated with ASVs of Sordariomycetes, of which roughly 25 edges connected ASVs within Sordariomycetes, and approximately 40, 5, and 10 edges connected ASVs from Sordariomycetes with ASVs from C_Fungi, Agaricomycetes, and Eurotiomycetes, respectively (Figure 7B). Finally, in biostimulant-treated fumigated soil (T4 plots), approximately 140 edges were associated with ASVs in Sordariomycetes, of which around 20 edges connected ASVs within Sordariomycetes, and around 35, 20, and 18 edges connected ASVs from Sordariomycetes with ASVs from C_Fungi, Agaricomycetes, and Eurotiomycetes, respectively (Figure 7D).
Overall, our findings suggest that chloropicrin fumigation (T3) significantly increased interactions within the soil fungal community, while the application of biostimulant to non-fumigated control (T2) or fumigated (T4) soils favored an increase in the number of nodes connected between different taxa or within one taxon. These findings imply that the treatments modulate the network dynamics of taxa including R. solani, and although fumigation suppresses its activity directly, the integration of biostimulant applications may help maintain a more balanced soil fungal community that could indirectly mitigate disease expression.
Modular structure and eigengene artificial networks inference within the soil fungal community
In this study, we predicted ecological relationships between soil fungal communities treated with fumigant and Bacillus species-based biostimulant against potato’s rhizoctonia disease by building directed hypergraphs of complex systems from the behavior of their components in fungal communities in soils. Network interactions were constructed for each of the four treatments (Figure 8 A1, B1, C1 et D1 by combining all significant pairwise relationships. The statistics of modular structure analysis, including the variables connectedness, connectivity, density, betweenness, and centralization, are presented in Table 7. The results showed that the non-fumigated soil treated with a biostimulant (T2) treatment had the highest number of linkages (57), average path length (1.01), network diameter (3), and modules (25) with a relative abundance varying from 0.01% to 5.02%, presenting 99.6% and 0.4% of positive and negative interactions, respectively. In contrast, the fumigated soil (T3) treatment had the highest number of connectedness/edges (278), average degree (5.35), heterogeneity (0.74), and centralization (0.07), with a relative abundance varying from 0.01% to 3.72%, showing 99.28% and 0.72% of positive and negative interactions, respectively. Indeed, the artificial network analysis revealed that the fumigation (T3) treatment significantly increased interactions within the soil fungal community, whereas non-fumigated soil treated with a biostimulant (T2) favored an increase in the number of nodes connected between different taxa or within one taxon. The network diameter and density of the associations decreased, but the ratio of positive associations increased with chloropicrin fumigation, indicating a shift in fungal interrelationships from competition to cooperation for utilizing available nutrients after organic material degradation. In plots that received the fumigated soil treated with biostimulant (T4) treatment, we observed a moderate number of connectedness/edges (260), linkage (58), average degree (5.15), average path length (1), network diameter (2.00), clustering coefficient (1.00), density (0.05), heterogeneity (0.66), centralization (0.05), and modules (23) with a relative abundance varying from 0.01% to 1.81% and 100% of positive interactions. The correlations between the modules’ own genes were used to define the own gene network, and more details about the components of each module are available in Supplementary Table S3 and Figure 8A2, B2 C2 and D2.
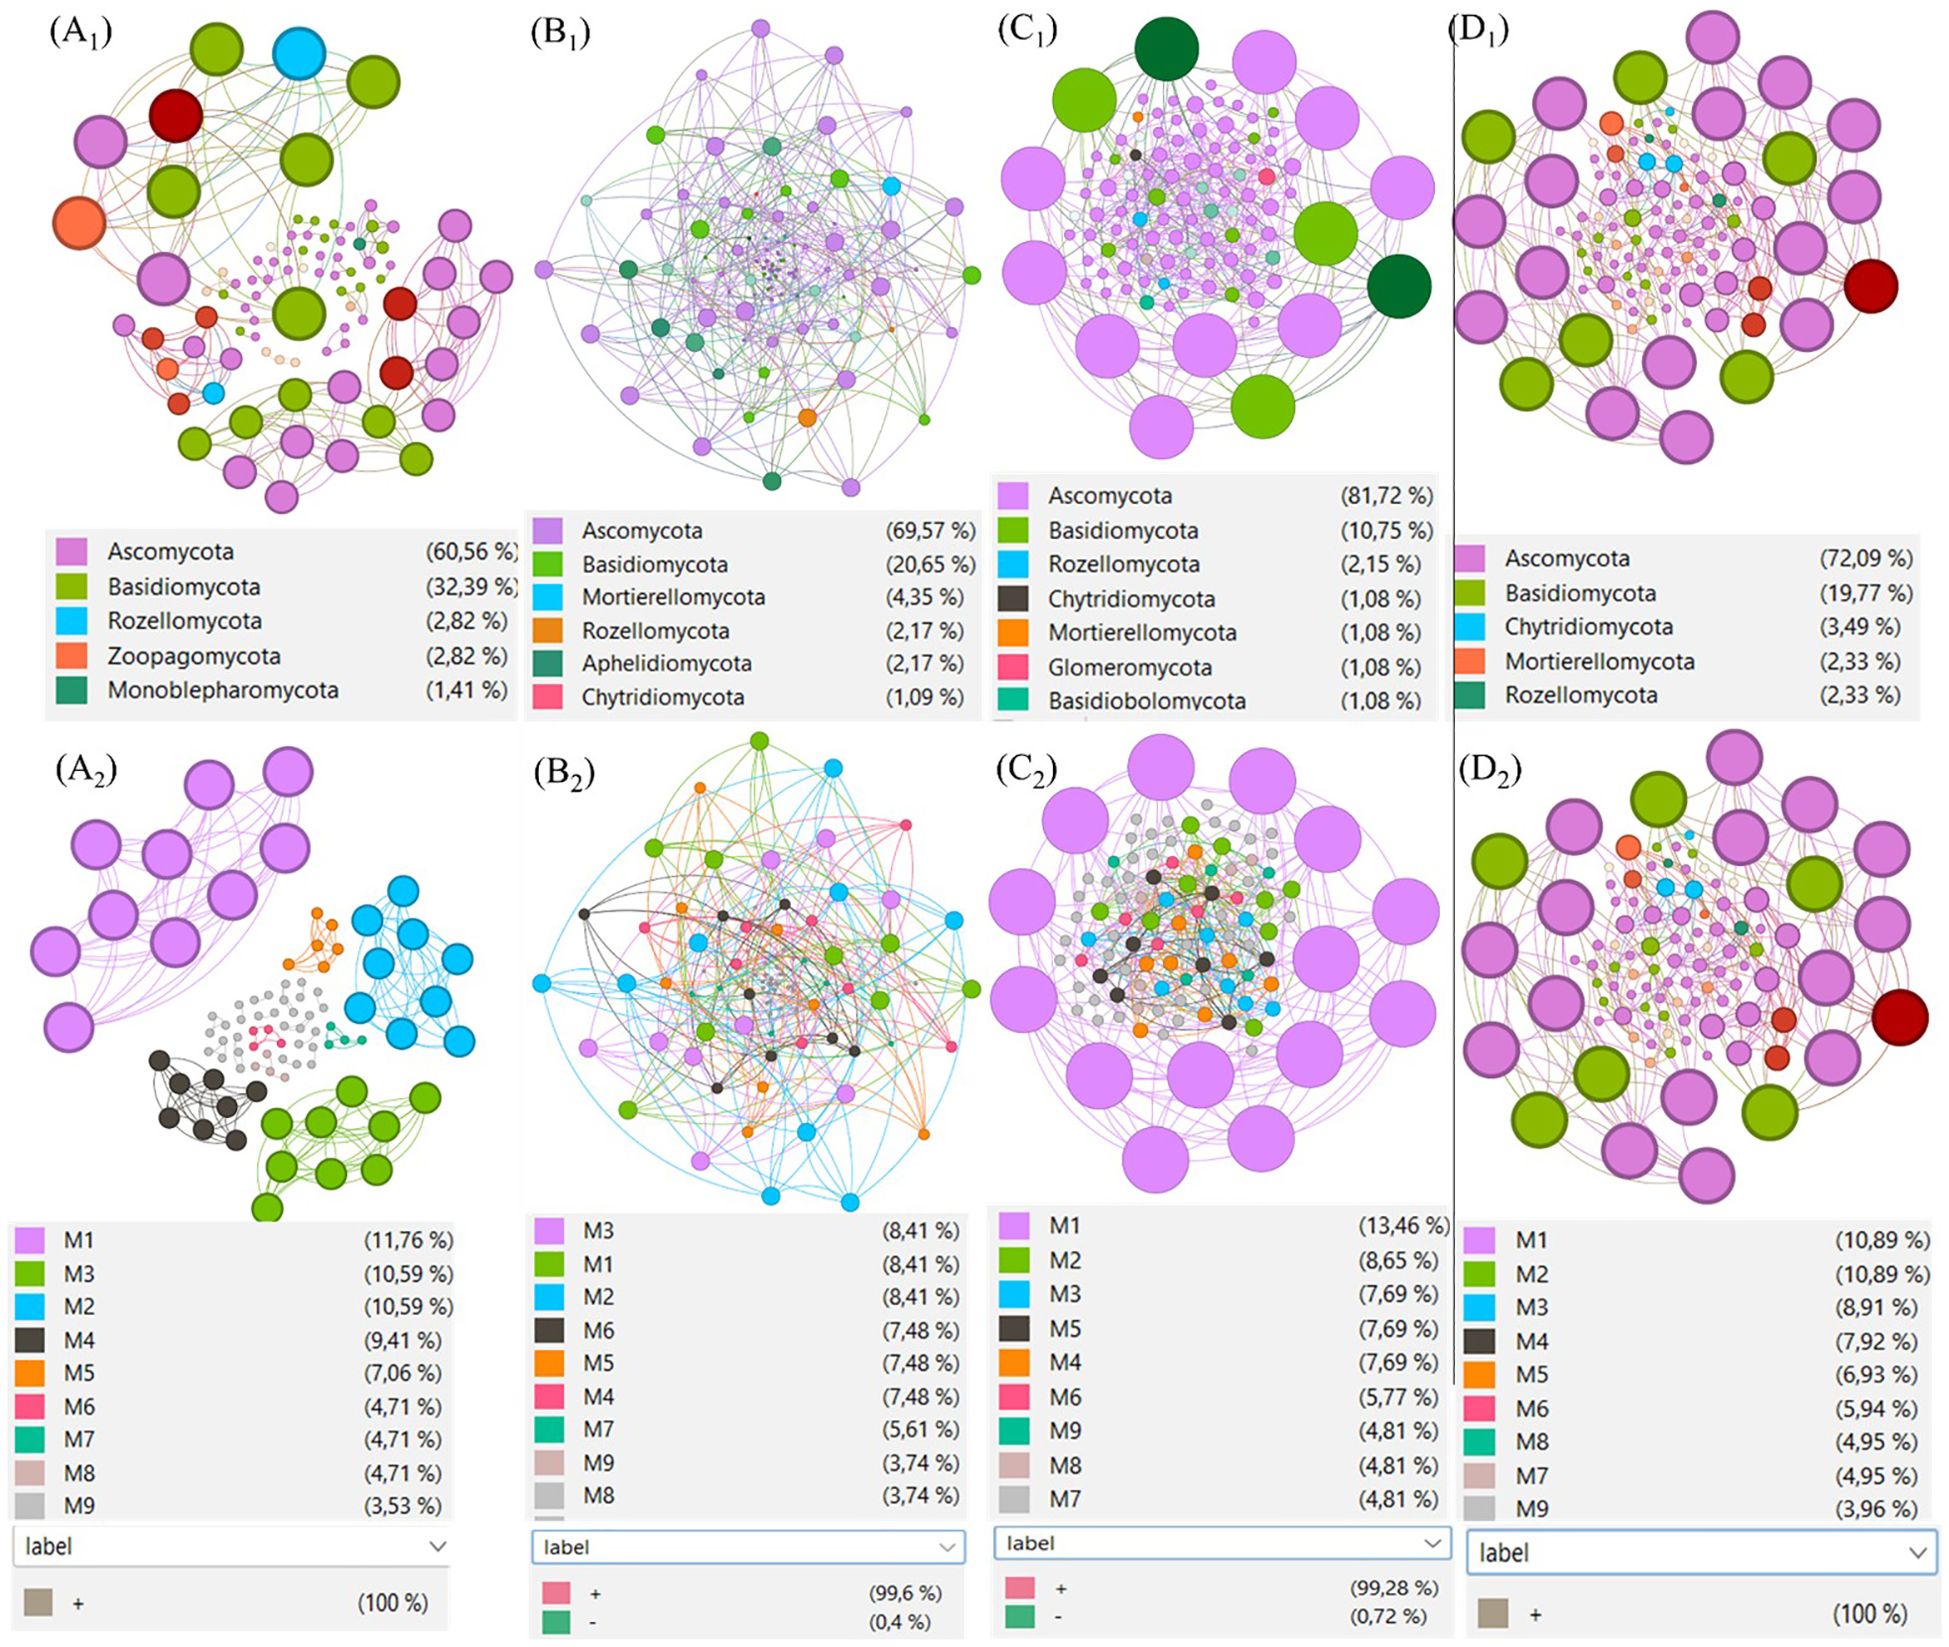
Figure 8. Co-occurrence networks of soil fungal communities under four treatments. (A1–D1) Networks coloured by phylum for non-fumigated control (T1, A1), biostimulant only (T2, B1), fumigant only (T3, C1) and fumigant + biostimulant (T4, D1). (A2–D2) Corresponding modularity-class views (M1–M9) for the same treatments, with node colours representing modules and node size proportional to degree. Edges represent significant Spearman correlations (r > 0.8, P < 0.01); for module composition see Supplementary Table S3. The dark-red node denotes an unidentified phylum (ASV ID: ba31d0645888ca71698061dda793e3ff).
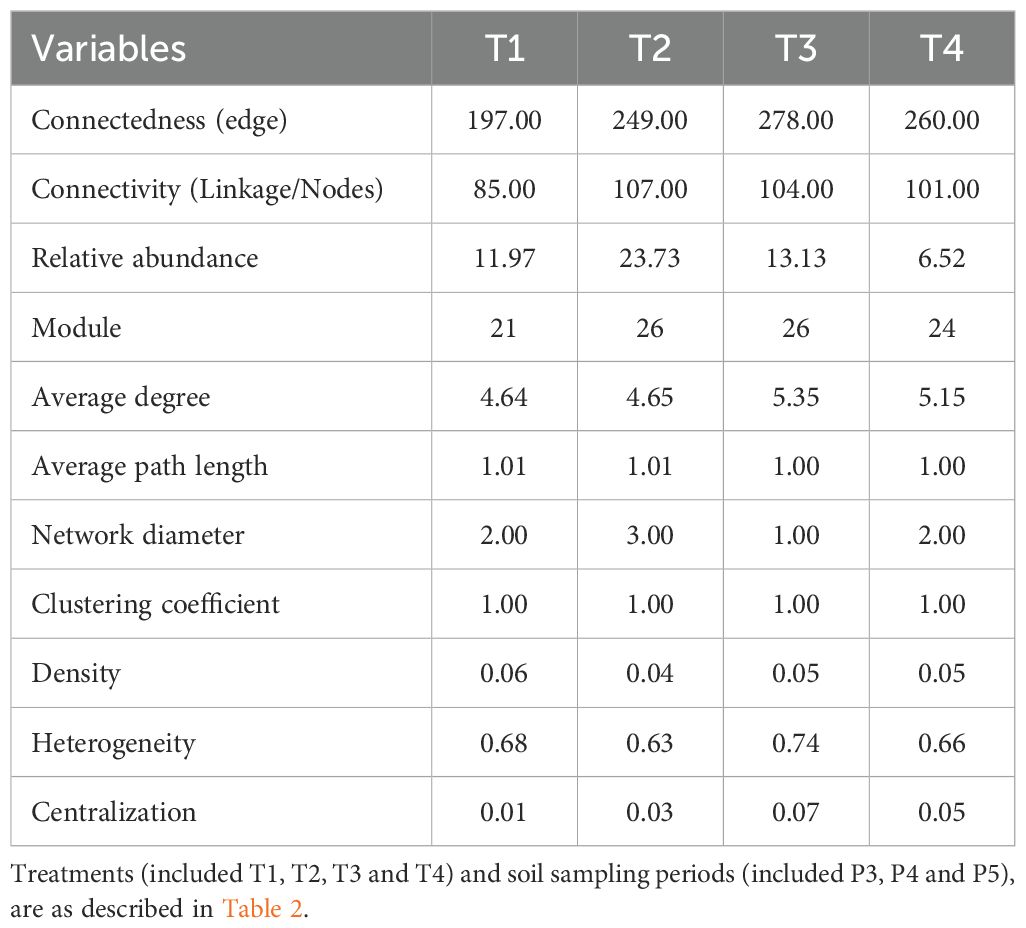
Table 7. Topological properties of fungal community networks for each treatment.
Discussion
Performance of potato plants and Rhizoctonia incidence
Our study aimed to demonstrate the potential of a biostimulant to reduce constraints to the use of chloropicrin fumigation to control losses caused by pathogenic fungi in potato cultivation. Our results indicated that chloropicrin fumigation most effectively reduced rhizoctonia canker symptoms and losses in total and marketable tuber yields. The use of a biostimulant based on five Bacillus species in non-fumigated soil improved significantly potato root and tuber biomass. The combination of the biostimulant with the fumigation reduced biomass values compared to those obtained with fumigation alone and it did not improve total and marketable tuber yields obtained with fumigation alone. These findings are consistent with previous studies (13, 59) that have reported soil fumigation as an effective practice for suppressing soilborne plant pathogens. Our findings suggest that fumigation treatment can be a promising method for potato production, especially in regions with a high incidence of bacterial such as the common scab caused by a complex of Streptomyces species (60) and of fungal pathogens such as rhizoctonia canker disease caused by Rhizoctonia solani (1, 2). Most interestingly, the use of the mix of Bacillus species-based biostimulant had significant effects on the fungal community in fumigated or non-fumigated soils during potato cultivation.
Absolute quantification of soil fungi under different treatments
Our qPCR survey showed a clear two-phase mycobiome response to chloropicrin fumigation. Fungal ITS copies dropped only ~0.3 log10 within six days after fumigation (6 DAF) but diverged sharply thereafter; by 61 DAF fumigated ridges carried ≈1.5 × 10⁶ fewer copies g−¹ than the untreated control plots, mirroring reports of persistent microbial biomass suppression for 60–90 days after chloropicrin, dazomet or allyl-isothiocyanate applications (61–64). Field studies likewise showed that long-term fumigant or herbicide inputs reshape β-diversity and soil functions (8, 65, 66). Variance in ITS fungal abundance was noticeable in fumigated plots alone at P3, which may reflect patchy chloropicrin dispersion and differential propagule survival (12). Similar heterogeneity has been linked to micro-zones of incomplete volatilisation or soil sealing (61). In-furrow delivery of the five Bacillus species consortium (T2) increased both the median and the dispersion of ITS counts at P3 and P5. Bacillus species derived lipopeptides and auxin analogues stimulate rhizodeposition, generating diverse C-sources that recruit heterotrophic fungi (67). Similar transient surges have been documented in lettuce and wheat systems (5). Adding the biostimulant to fumigated soil (T4) compressed the recovery window: by 111 DAF fungal ITS counts matched the untreated control, whereas fumigation alone still lagged significantly. This acceleration likely stems from Bacillus-mediated exudation and micro-aggregate formation that facilitate fungal ingress and root–fungus contacts (67). Collectively, these results confirm that chloropicrin is a potent—yet ecologically blunt—tool: it delivers sustained pathogen knock-down at the cost of lower fungal biomass and diversity. The Bacillus species-based biostimulant mitigates that cost by hastening recolonisation, but in non-fumigated soils it also creates activity “hot-spots” that could favour opportunists and induce greater variability in the dispersion of ITS counts. Interestingly, the application of the biostimulant in fumigated soil (T4) resulted in an increased variability of the number of fungi per gram of dry soil detected at P5 sampling period. This indicates that the T4 treatment may took more time to promote an increase of fungal community in fumigated soil towards the end of the growing season. Balancing chemical and biological inputs therefore remains essential for reconciling pathogen control with soil-function resilience (68).
Diversity and richness of fungal community in soils under different treatments
Our results indicate that exposure to chloropicrin in fumigated soil (T3) reduced fungal diversity and richness. The altered fungal evenness in chloropicrin-exposed soils may be attributed to varying sensitivities of fungi to the active compound, as reported in previous studies (11, 12, 61). Nonetheless, our findings suggest that management practices employed on both control methods could mitigate some of the negative effects of fumigation on soil microorganisms (12, 69, 70). Indeed, the biostimulant-treated soil (T2) showed significantly higher Shannon diversity and Pielou’s evenness at P3 and P4, while the fumigated-treated soil (T3) exhibited significantly lower Shannon diversity and Pielou’s evenness across all growing seasons, suggesting that the treatments may have selected for specific groups of fungi that dominated the soil community in the sampled roots area. Fumigation caused a 18% drop in Shannon diversity, consistent with mesocosm studies where chloropicrin reduced OTU richness by 15–25% and evenness by up to 30% (11). While richness began to recover later in the season, community evenness remained low, indicating proliferation by a limited number of opportunistic taxa. In contrast, the Bacillus species-based biostimulant restored evenness and even exceeded control levels by harvest. These results reflect similar findings in lettuce and cucumber systems, where amino-acid-rich exudates from Bacillus species-based consortia supported the resurgence of diverse fungal taxa (71). Soil fungal communities in field conditions may exhibit greater stability to chloropicrin perturbation (18). Soil fungi have an advantage in decomposing organic matter rapidly, allowing them to compete for soil niche space created by fumigation (72). However, other abiotic factors or management practices associated with each individual field, such as crop rotation (73), pH (74), soil type (75), and chemical properties of soils (9), can confound the effects of fumigation on soil fungal richness and diversity. Furthermore, community dissimilarity analyses showed that treatment explained 36% of fungal composition variance (PERMANOVA), a higher fraction than reported in legacy soils treated with metam-sodium (19%) (8). NMDS plots indicated early divergence of T2 from the control T1 within 51 DAP, highlighting the rapid and selective footprint of microbial metabolites and root exudates induced by the biostimulant. Indeed, our study found that the short-term effects of fumigation were not yet noticeable in fungal communities at 6 days after the application of fumigation (6DAF, P2). However, from 61 DAF (P3) to 111 DAF (P5), treatments involving non-fumigated soils (T1 and T2) were significantly different from fumigated soils (T3 and T4), indicating that the long-term effects of fumigation on fungal community were pronounced. Although the mechanism of soil microbial resilience to fumigation is not entirely clear, one explanation from (76) is that the relatively short half-life of the effective compound methyl isothiocyanate, which is decomposed from chloropicrin in soil within about 7 days, could play a role. However, chloropicrin fumigation reduced fungal richness and diversity over a period of 61 and 111 DAF (P5), suggesting that chloropicrin remained suppressive to soil fungi. This finding is consistent with other studies that have documented short-term and middle-term reductions in soil microbial populations caused by chloropicrin application (9, 11, 18, 63). Although (11) and (62) reported that fungal diversity and richness recovered after a disturbance, we did not observe such a recovery. This is likely because our sampling time was shorter, and the fungal communities present did not have enough resources to support their recovery. In general, soil microbial communities can be resistant or resilient to environmental perturbations, either not changing after a disturbance or returning to their original state after a period of time (77). Ultimately, our findings suggest that chloropicrin application negatively affects fungal diversity and richness over a longer period. This highlights the importance of considering the long-term effects of fumigation on soil microbial communities.
Effect of treatments on fungal community composition
The effect of chloropicrin fumigation on soil microbial composition varied by taxa, as evidenced by the change in relative abundance of fungal taxa depending on fumigation periods. Soil fungal composition was shifted based on fumigation during the growing season periods, with the relative abundance of Lasiosphaeriaceae, Chaetomiaceae, Plectosphaerellaceae, Nectriaceae, Piskurozymaceae, Microascaceae, Mortierellaceae, and Trichocomaceae decreasing while those of Hypocreaceae increasing in soils exposed to chloropicrin. This finding is consistent with the research of (18), who reported an increase in the abundance of genera represented by Chaetomiaceae, Pseudogymnoascus, Acremonium, and Lectera with metam-sodium fumigation exposure. The increase in Chaetomiaceae abundance following application of dazomet and various isothiocyanates has also been documented in previous studies (62, 78). Furthermore, our detailed taxonomic assessment revealed that soil fumigation (T3) effectively reduced pathogenic fungi across soil sampling-periods (P3–P5), corroborating previous findings on chloropicrin’s broad-spectrum pathogen suppression capability (79, 80). Notably, the application of Bacillus-species-based biostimulant (T2) and its combined use with fumigant (T4) selectively enriched beneficial fungal taxa such as Cladorrhinum flexuosum (Plectosphaerellaceae) in T2 and Trichoderma evansii (Hypocreaceae) in T4 and T3 especially during later soil sampling-periods (P4 and P5). These beneficial fungi are known for their biological control activities against critical potato pathogens, including R. solani (81, 82). Furthermore, the marked reduction of pathogenic species such as Nectria ramulariae (Nectriaceae) and Phialemonium globosum (Cephalothecaceae) after fumigation treatments (T3 and T4) highlights the effectiveness and potential long-term benefits of integrating soil fumigation and biostimulant application for sustainable disease management practices.
Dynamics of potato pathogens in response to fumigation and biostimulant treatments
Across all three post-planting soil samplings (P3–P5), the auxiliary ITS-based screen makes it clear that chloropicrin and the Bacillus species–based biostimulant did far more than curb rhizoctonia canker. Fumigation provided an early, broad-spectrum “knock-down” of multiple soil- and residue-borne fungi, whereas the biostimulant selectively favoured antagonistic or saprophytic taxa that can further restrain pathogen resurgence. By harvest, however, several opportunists (notably Fusarium species and Colletotrichum species) had recolonized fumigated soil, emphasising that a one-off fumigation must be integrated with biological and cultural tactics for season-long protection. Indeed, the putative Rhizoctonia ASV (3b9531f47e78eff3daec652cc86ec07f; order Cantharellales) surged in untreated plots at P3 (≤ 25 % of reads) and again at P5 (≤ 60 %), mirroring the high disease index and ~ 20 % marketable-yield loss in T1. Both chloropicrin (T3) and the combined biostimulant and fumigation treatment (T4) suppressed this ASV below the detection limit through P4, with only a minor rebound in one T3 replicate at harvest, confirming the well-documented efficacy of chloropicrin against R. solani. Remarkably, the Bacillus species-based biostimulant alone (T2) kept the pathogen undetectable at P5, suggesting antagonism by Bacillus species via antibiotic production or niche competition (19, 83). Similar Bacillus-mediated suppression of R. solani has been reported in potato and other crops (84). These dynamics echo field reports that chloropicrin provides an immediate but transient knock-down of R. solani inoculum and that recolonisation can occur within one season from surviving sclerotia or airborne sources, while multiple Bacillus species antagonise the pathogen via lipopeptides and cell-wall–degrading enzymes, blocking hyphal re-establishment on potato roots; taken together, the sequencing evidence substantiates our conclusion that integrating a Bacillus species-based biostimulant with chloropicrin fumigation confers durable season-long exclusion of R. solani, whereas either input alone affords only partial or temporal control.
Fusarium species (dry-rot and wilt complex) reads were ubiquitous (≥ 70 % detection in T1 at P5) and are known to cause dry-rot losses of up to 25 % in storage (85). Chloropicrin cut early-season abundance by an order of magnitude, yet populations rebounded to ~1 % of reads by harvest, consistent with the long-term survival of chlamydospores and the capacity of fumigated soils to be recolonized. The biostimulant did not curb Fusarium species T2 even trended slightly higher than T1 at P5, implying that Fusarium species can tolerate or exploit the rhizosphere shifts promoted by Bacillus species-based biostimulant enrichment. Hence additional tactics (seed-tuber fungicides, store sanitation) remain essential for dry-rot management. From an agronomic perspective, fumigation appears effective at reducing Fusarium species pressure early on, but its eventual recovery signals that one-time fumigation may not fully prevent Fusarium species-related tuber rots later in the season. Low but persistent detection of Alternaria angustiovoidea in T1 and T2 underscores the difficulty of eliminating foliar inoculum that overwinters in debris or arrives aerially (86). Fumigation temporarily eradicated Alternaria species (early blight/brown spot) at P3–P4, yet the pathogen re-appeared in up to 10 % of T3 replicates by time-period P5, highlighting rapid recolonization of fumigated ridges from surrounding sources. Because even low soil titers can promote the onset of foliar epidemics (87), integrating residue management and timely fungicide sprays is advisable.
While black-dot prevalence, induced by Colletotrichum coccodes, rose steadily in untreated soil (≤ 1 % reads, 45 % detection at harvest), it was not prevented by chloropicrin fumigation (T3) but only delayed since by time-period P5, the detection level caught up to the values measured in T1. This pattern agrees with reports that microsclerotia of C. coccodes survive fumigation and recolonise potato roots within a single season (88). The biostimulant had little direct effect, indicating that supplemental measures such as extended rotations or resistant cultivars are required for durable black-dot suppression.
Verticillium nubilum was sporadic (< 0.1 % reads) but detectable in late-season samples from non-fumigated plots. Chloropicrin virtually eliminated it, corroborating evidence that microsclerotia are highly sensitive to soil sterilants (89). Given the low initial inoculum and cool growing season, the verticillium wilt was unlikely to influence yield here; nevertheless, the data show fumigation’s collateral benefit against this elusive pathogen. Detection of Ilyonectria macrodidyma (root rot fungi) was confined to a few T1/T2 samples at P4–P5. Its near-absence in fumigated soil aligns with studies showing that Cylindrocarpon conidia are readily eradicated by fumigation (90). Although current impact appears minimal, metabarcoding alerts us to emerging root-rot threats that warrant surveillance in reduced-fumigant systems.
Similarity-based artificial network inference within fungal community
The interrelationships among soil microorganisms are complex and essential for soil functions and plant performance (68, 91). In our study, we investigated the biodiversity of fungal communities in soils treated with chloropicrin fumigant and Bacillus species-based biostimulant for rhizoctonia disease control, focusing on interactions among species as well as the number and abundance of species. This is crucial because previous research has shown that species interactions can be more critical to ecosystem functioning than species richness and abundance, particularly in complex ecosystems (58, 92). Previous research demonstrated the application of network analysis to describe interactions between microbial community features (46, 60, 93, 94).
By using network analysis, we examined soil fungal co-occurrence patterns and community stability in response to disturbance (95, 96). To our knowledge, this is the first study to investigate the soil fungal co-occurrence in response to chloropicrin fumigation and Bacillus species-based biostimulant. Our findings revealed that fumigation significantly increased interactions within the soil fungal community, whereas Bacillus species-based biostimulant application favored an increase in the number of nodes connected between different taxa or within one taxon, compared to previous studies (57, 60, 71, 97)), which revealed that fumigation and other types of fungicides exposure altered the network structure in bacterial and fungal communities. Specifically, the network diameter and density of the associations decreased, but the ratio of positive associations increased with chloropicrin fumigation, indicating a shift in fungal interrelationships from competition to cooperation for utilizing available nutrients after organic material degradation (5, 97). Network clusters can represent a group of fungi with similar or related functions (48, 91). Furthermore, we found that the clustering agreements in the fungal networks differed between fumigated and non-fumigated soils, respectively, implying potential functional changes, as described in previous studies with fungicides tebuconazole and boscalid (57, 98).
Network analysis revealed that chloropicrin reduced total edge count by 35% and network diameter to 1, but increased the positive:negative edge ratio to 99:1—an expected outcome in systems undergoing disturbance and reduced niche competition (5). Mortierellaceae emerged as keystone taxa in this simplified network, leveraging lysed biomass as nutrient sources and producing phospholipids that support co-resident bacteria (68). The biostimulant application reversed this trend, restoring edge density (+19%), network diameter (to 2), and doubling inter-phylum links (e.g., Sordariomycetes ↔ Tremellomycetes). Such interconnectivity is associated with higher microbial redundancy and faster recovery from environmental stress (91). Notably, a Trichoderma-dominated module was inversely correlated (r = –0.78) with Rhizoctonia ASV abundance, confirming the suppressive role of the biostimulant community (49). By employing high-throughput sequencing and artificial network inference analysis, our previous study (60) reports that the fumigation with chloropicrin significantly and persistently altered the composition of the soil bacterial community over the growing season, while the biostimulant had a positive impact on the diversity and richness of the bacterial community.
Overall, our study provides insights into the complexity of soil fungal interactions and highlights the importance of considering species interactions in ecosystem functioning. However, due to the limitations of co-occurrence network analysis (99), further studies are needed to characterize these fungal functional profiles in response to chloropicrin fumigation and Bacillus species-based biostimulant. This study highlights the importance of network interactions in fungal communities for research in microbial ecology and demonstrates the potential of using modular structure and eigengene artificial networks inference to understand soil fungal community dynamics. This shift indicates a restructured soil mycobiome favoring beneficial over pathogenic taxa, highlighting the potential of biostimulant-fumigant combinations for integrated pathogen suppression.
Contributions of the study
This research extends our previous focus on bacterial community (60) to explore soil fungal dynamics under chloropicrin fumigation and Bacillus species-based biostimulant applications in potato production. Unlike the earlier work that concentrated on bacteria, this study delves into how these treatments influence fungal communities, crucial for managing Rhizoctonia solani. A key innovation here is the detailed examination of shifts in fungal community structure and interactions, illustrating a transformative shift from competition to cooperation in response to soil treatments. This insight enriches our understanding of microbial ecology, offering a new perspective on fostering soil health and sustainability in agriculture.
Employing advanced high-throughput sequencing and network analysis, this work uncovers complex fungal network behaviors and interaction patterns previously unexplored in potato cropping systems. It highlights the potential of integrating fumigation and biostimulants to enhance microbial interactions that benefit soil management and disease suppression.
This study stands out by linking fungal dynamics with bacterial insights, providing a comprehensive view of the soil microbiome’s role in enhancing crop production and resilience against diseases.
Conclusion
Field-scale integration of chloropicrin fumigation with an eight-strains Bacillus species-based biostimulant proved to be a double dividend for intensive potato systems: it delivered reliable disease suppression while accelerating microbiome recovery. Fumigation alone cut the rhizoctonia canker index by ≈70% and lifted gross yield by 7%, confirming the long-standing efficacy of chloropicrin against R. solani and allied pathogens. Yet this chemical knock-down came at an ecological cost, an 18% drop in Shannon diversity and a collapse of negative (competitive) network edges hallmarks of a perturbed soil mycobiome. Introducing the five species Bacillus consortium tried rewiring that trajectory. When applied to unfumigated soil, it boosted plant biomass and selectively enriched antagonistic taxa such as Trichoderma species, echoing independent demonstrations of Bacillus-mediated growth promotion and pathogen inhibition. When paired with chloropicrin, the biostimulant eliminated the late-season resurgence of R. solani, restored network diameter and inter-phylum connectivity, and halved the time needed for fungal abundance to rebound to pre-fumigation levels. The resulting agroecosystem combined the highest marketable yield (+8%) with the most functionally cohesive fungal network, illustrating how targeted chemical control and microbial stimulation can be mutually reinforcing rather than antagonistic. Beyond potatoes, these findings strengthen a broader paradigm: pairing fast-acting fumigants with microbiome-friendly bio-inputs can reconcile short-term phytosanitary goals with long-term soil health.
Future work should (i) refine application timing and dose to minimise diversity losses while maximising yield gains, (ii) track multi-year legacy effects on carbon–nitrogen cycling and greenhouse-gas fluxes, and (iii) test whether similar network-level resilience emerges in other fumigated horticultural systems. Such efforts will help translate the present study into a blueprint for sustainable disease management that is both microbiologically informed and agronomically robust.
Data availability statement
The original contributions presented in the study are publicly available. This data can be found here: NCBI BioProject accession PRJNA1010157.
Author contributions
HT: Data curation, Formal analysis, Methodology, Software, Conceptualization, Visualization, Writing – original draft, Writing – review & editing. JD’A-P: Data curation, Formal analysis, Methodology, Writing – review & editing. TJ: Resources, Data curation, Methodology, Writing – review & editing. RH: Conceptualization, Funding acquisition, Investigation, Project administration, Resources, Supervision, Writing – original draft, Writing – review & editing.
Funding
The author(s) declare that financial support was received for the research and/or publication of this article. The authors declare that this study received funding from the Ministry of Agriculture, Fisheries and Food, as part of the Program to support the development of agriculture and agri-food in the region (project # PADAAR-1819-4051-011CN), and received in-kind support from Patates Dolbec Inc. The funders and Patates Dolbec’s suppliers were not involved in the study design, data collection, analysis, interpretation, writing of this article, or the decision to submit it for publication.
Acknowledgments
Authors are grateful to Dr. Elmer Iquira for his insightful comments on the draft of the manuscript, to Philippe Parent and Juliette Lévesque for their agronomic expertise, and to Vanessa Villeneuve and Véronique Gagné for their technical support.
Conflict of interest
The authors declare that the research was conducted in the absence of any commercial or financial relationships that could be construed as a potential conflict of interest.
Generative AI statement
The author(s) declare that no Generative AI was used in the creation of this manuscript.
Publisher’s note
All claims expressed in this article are solely those of the authors and do not necessarily represent those of their affiliated organizations, or those of the publisher, the editors and the reviewers. Any product that may be evaluated in this article, or claim that may be made by its manufacturer, is not guaranteed or endorsed by the publisher.
Supplementary material
The Supplementary Material for this article can be found online at: https://www.frontiersin.org/articles/10.3389/fsoil.2025.1559144/full#supplementary-material
References
1. Tariq M, Yasmin S, and Hafeez FY. Biological control of potato black scurf by rhizosphere associated bacteria. Braz J Microbiol. (2010) 41:439−51. doi: 10.1590/S1517-83822010000200026
2. Loit K, Soonvald L, Astover A, Runno-Paurson E, Öpik M, and Tedersoo L. Temporal and cultivar-specific effects on potato root and soil fungal diversity. Agronomy. (2020) 10:1535. doi: 10.3390/agronomy10101535
3. Wei F, Passey T, and Xu X. Amplicon-based metabarcoding reveals temporal response of soil microbial community to fumigation-derived products. Appl Soil Ecol. (2016) 103:83−92. doi: 10.1016/j.apsoil.2016.03.009
4. Brewer MT and Larkin RP. Efficacy of several potential biocontrol organisms against Rhizoctonia solani on potato. Crop Prot. (2005) 24:939−50. doi: 10.1016/j.cropro.2005.01.012
5. Banerjee S, Kirkby CA, Schmutter D, Bissett A, Kirkegaard JA, and Richardson AE. Network analysis reveals functional redundancy and keystone taxa amongst bacterial and fungal communities during organic matter decomposition in an arable soil. Soil Biol Biochem. (2016) 97:188−98. doi: 10.1016/j.soilbio.2016.03.017
6. Jing J, Cong WF, and Bezemer TM. Legacies at work: plant-soil-microbiome interactions underpinning agricultural sustainability. Trends Plant Sci. (2022) 27:781−92. doi: 10.1016/j.tplants.2022.05.007
7. Anees M, Tronsmo A, Edel-Hermann V, Gautheron N, Faloya V, and Steinberg C. Biotic changes in relation to local decrease in soil conduciveness to disease caused by Rhizoctonia solani. Eur J Plant Pathol. (2010) 126:29−41. doi: 10.1007/s10658-009-9517-0
8. Dangi SR, Tirado-Corbalá R, Gerik J, and Hanson BD. Effect of long-term continuous fumigation on soil microbial communities. Agronomy. (2017) 7:37. doi: 10.3390/agronomy7020037
9. Sennett LB, Goyer C, Burton DL, Zebarth BJ, and Whitney S. Chemical fumigation and biofumigation alter soil bacterial community diversity and composition. FEMS Microbiol Ecol. (2022) 98:fiac026. doi: 10.1093/femsec/fiac026
10. Gullino ML, Minuto A, Gilardi G, Garibaldi A, Ajwa H, and Duafala T. Efficacy of preplant soil fumigation with chloropicrin for tomato production in Italy. Crop Prot. (2002) 21:741−9. doi: 10.1016/S0261-2194(02)00031-5
11. Li J, Huang B, Wang Q, Li Y, Fang W, Han D, et al. Effects of fumigation with metam-sodium on soil microbial biomass, respiration, nitrogen transformation, bacterial community diversity and genes encoding key enzymes involved in nitrogen cycling. Sci Total Environ. (2017) 598:1027−36. doi: 10.1016/j.scitotenv.2017.02.058
12. Fang W, Yan D, Wang X, Huang B, Wang X, Liu J, et al. Responses of nitrogen-cycling microorganisms to dazomet fumigation. Front Microbiol. (2018) 9:2529/full. doi: 10.3389/fmicb.2018.02529/full
13. Shen Z, Xue C, Taylor P, Ou Y, Wang B, Zhao Y, et al. Soil pre-fumigation could effectively improve the disease suppressiveness of biofertilizer to banana Fusarium wilt disease by reshaping the soil microbiome. Biol Fertil Soils. (2018) 54:793–806. doi: 10.1007/s00374-018-1303-8
14. Zhang S, Liu X, Jiang Q, Shen G, and Ding W. Legacy effects of continuous chloropicrin-fumigation for 3-years on soil microbial community composition and metabolic activity. AMB Express. (2017) 7:178. doi: 10.1186/s13568-017-0475-1
15. Wang Q, Ma Y, Yang H, and Chang Z. Effect of biofumigation and chemical fumigation on soil microbial community structure and control of pepper Phytophthora blight. World J Microbiol Biotechnol. (2014) 30:507−18. doi: 10.1007/s11274-013-1462-6
16. Yakabe LE, Parker SR, and Kluepfel DA. Effect of pre-plant soil fumigants on Agrobacterium tumefaciens, pythiaceous species, and subsequent soil recolonization by A. tumefaciens. Crop Prot. (2010) 29:583−90. doi: 10.1016/j.cropro.2010.01.001
17. Balbín-Suárez A, Jacquiod S, Rohr AD, Liu B, Flachowsky H, Winkelmann T, et al. Root exposure to apple replant disease soil triggers local defense response and rhizoplane microbiome dysbiosis. FEMS Microbiol Ecol. (2021) 97:fiab031. doi: 10.1093/femsec/fiab031
18. Li X, Skillman V, Dung J, and Frost K. Legacy effects of fumigation on soil bacterial and fungal communities and their response to metam sodium application. Environ Microbiome. (2022) 17:59. doi: 10.1186/s40793-022-00454-w
19. Zhang X, Xue C, Fang D, He X, Wei M, Zhuo C, et al. Manipulating the soil microbiomes during a community recovery process with plant beneficial species for the suppression of Fusarium wilt of watermelon. AMB Express. (2021) 11:87. doi: 10.1186/s13568-021-01225-5
20. Dziugieł T and Wadas W. Effect of plant biostimulants on macronutrient content in early crop potato tubers. Agronomy. (2020) 10:1202. doi: 10.3390/agronomy10081202
21. Etesami H, Jeong BR, and Glick BR. Potential use of Bacillus spp. as an effective biostimulant against abiotic stresses in crops—A review. Curr Res Biotechnol. (2023) 5:100128. doi: 10.1016/j.crbiot.2023.100128
22. Crecchio C, Mimmo T, Bulgarelli D, Pertot I, Pii Y, Perazzolli M, et al. Beneficial soil microbiome for sustainable agriculture production Vol. 31. Lichtfouse E, editor. Cham: Springer International Publishing (2018). p. 443−81. doi: 10.1007/978-3-319-94232-2_9
23. Schloter M, Nannipieri P, Sorensen SJ, and van Elsas JD. Microbial indicators for soil quality. Biol Fertil Soils. (2018) 54:1−10. doi: 10.1007/s00374-017-1248-3
24. Rashidi HH, Tran NK, Betts EV, Howell LP, and Green R. Artificial intelligence and machine learning in pathology: the present landscape of supervised methods. Acad Pathol. (2019) 6:2374289519873088. doi: 10.1177/2374289519873088
25. Namkung J. Machine learning methods for microbiome studies. J Microbiol. (2020) 58:206−16. doi: 10.1007/s12275-020-0066-8
26. Quintero M and Comerford NB. Effects of conservation tillage on total and aggregated soil organic carbon in the andes. Open J Soil Sci. (2013) 03:361−73. doi: 10.4236/ojss.2013.38042
27. Issuu. Guide de référence en fertilisation (2015). Available online at: https://issuu.com/craaq/docs/extrait_feuilletage_psol0104guide_r (Accessed Sepetember 10, 2024).
28. Carter MR and Gregorich EG. Lime Requirement. In: Soil Sampling and Methods of Analysis, 2e éd. Boca Raton, FL: CRC Press (2007).
29. Eaton AD. Standard methods for the examination of water & wastewater. In: . Eaton AD and Mary Ann H, editors. Centennial ed./prepared and published jointly by American Public Health Association, American Water Works Association, Water Environment Federation; joint editorial board, 21st ed. American Public Health Association, Franson. Washington, DC (2005).
30. Banu N and Menakuru H. Enumeration of microbial contaminants in sachet water: a public health challenge. Health (N Y). (2010) 02:582−8. doi: 10.4236/health.2010.26086
31. Driscoll J, Coombs J, Hammerschmidt R, Kirk W, Wanner L, and Douches D. Greenhouse and field nursery evaluation for potato common scab tolerance in a tetraploid population. Am J Potato Res. (2009) 86:96−101. doi: 10.1007/s12230-008-9065-8
32. Overbeek W, Jeanne T, Hogue R, and Smith DL. Effects of microbial consortia, applied as fertilizer coating, on soil and rhizosphere microbial communities and potato yield. Front Agron. (2021) 3:714700. doi: 10.3389/fagro.2021.714700
33. Jeanne T, D’Astous-Pagé J, and Hogue R. Spatial, temporal and technical variability in the diversity of prokaryotes and fungi in agricultural soils. Front Soil Sci. (2022) 2:945888. doi: 10.3389/fsoil.2022.945888
34. Emerson JB, Keady PB, Brewer TE, Clements N, Morgan EE, Awerbuch J, et al. Impacts of flood damage on airborne bacteria and fungi in homes after the 2013 Colorado Front Range flood. Environ Sci Technol. (2015) 49:2675−84. doi: 10.1021/es503845j
35. McGuire KL, Payne SG, Palmer MI, Gillikin CM, Keefe D, Kim SJ, et al. Digging the new york city skyline: soil fungal communities in green roofs and city parks. PloS One 1 mars. (2013) 8:e58020. doi: 10.1371/journal.pone.0058020
36. Parada AE, Needham DM, and Fuhrman JA. Every base matters: assessing small subunit rRNA primers for marine microbiomes with mock communities, time series and global field samples. Environ Microbiol. (2016) 18:1403−14. doi: 10.1111/emi.2016.18.issue-5
37. Bolyen E, Rideout JR, Dillon MR, Bokulich NA, Abnet CC, Al-Ghalith GA, et al. Reproducible, interactive, scalable and extensible microbiome data science using QIIME 2. Nat Biotechnol. (2019) 37:852−7. doi: 10.1038/s41587-019-0209-9
38. Callahan BJ, McMurdie PJ, Rosen MJ, Han AW, Johnson AJA, and Holmes SP. DADA2: High-resolution sample inference from Illumina amplicon data. Nat Methods. (2016) 13:581−3. doi: 10.1038/nmeth.3869
39. Nilsson RH, Larsson KH, Taylor AFS, Bengtsson-Palme J, Jeppesen TS, Schigel D, et al. The UNITE database for molecular identification of fungi: handling dark taxa and parallel taxonomic classifications. Nucleic Acids Res. (2019) 47:D259−64. doi: 10.1093/nar/gky1022
40. Bokulich NA, Kaehler BD, Rideout JR, Dillon M, Bolyen E, Knight R, et al. Optimizing taxonomic classification of marker-gene amplicon sequences with QIIME 2’s q2-feature-classifier plugin. Microbiome. (2018) 6:90. doi: 10.1186/s40168-018-0470-z
41. Robeson MS, O’Rourke DR, Kaehler BD, Ziemski M, Dillon MR, Foster JT, et al. RESCRIPt: Reproducible sequence taxonomy reference database management. PloS Comput Biol nov. (2021) 17:e1009581. doi: 10.1371/journal.pcbi.1009581
42. McMurdie PJ and Holmes S. phyloseq: an R package for reproducible interactive analysis and graphics of microbiome census data. PloS One. (2013) 8:e61217. doi: 10.1371/journal.pone.0061217
43. Liu C, Cui Y, Li X, and Yao M. microeco: an R package for data mining in microbial community ecology. FEMS Microbiol Ecol. (2021) 97:fiaa255. doi: 10.1093/femsec/fiaa255
44. Anderson MJ. A new method for non-parametric multivariate analysis of variance. Austral Ecol. (2001) 26:32−46. doi: 10.1046/j.1442-9993.2001.01070.x
45. Deng Y, Jiang YH, Yang Y, He Z, Luo F, and Zhou J. Molecular ecological network analyses. BMC Bioinf. (2012) 13:113. doi: 10.1186/1471-2105-13-113
46. Barberán A, Bates ST, Casamayor EO, and Fierer N. Using network analysis to explore co-occurrence patterns in soil microbial communities. ISME J. (2012) 6:343−51. doi: 10.1038/ismej.2011.119
47. Csárdi G and Nepusz T. The igraph software package for complex network research (2006). Available online at: https://www.semanticscholar.org/paper/The-igraph-software-package-for-complex-network-Cs%C3%A1rdi-Nepusz/1d2744b83519657f5f2610698a8ddd177ced4f5c (Accessed January 10, 2023).
48. Newman MEJ. Modularity and community structure in networks. Proc Natl Acad Sci U.S.A. (2006) 103:8577−82. doi: 10.1073/pnas.0601602103
49. Guimerà R and Nunes Amaral LA. Functional cartography of complex metabolic networks. Nature. (2005) 433:895−900. doi: 10.1038/nature03288
50. Krackhardt D. Graph theoretical dimensions of informal organization. Comput Organ Theory. (1994) 89:89–111. doi: 10.4324/9781315806648-11
51. Guimerà R, Sales-Pardo M, and Amaral LAN. Classes of complex networks defined by role-to-role connectivity profiles. Nat Phys. (2007) 3:63−9. doi: 10.1038/nphys489
52. Ravasz E, Somera AL, Mongru DA, Oltvai ZN, and Barabási AL. Hierarchical organization of modularity in metabolic networks. Science. (2002) 297:1551−5. doi: 10.1126/science.1073374
53. Wasserman S and Faust K. Social Network Analysis: Methods and Applications. New York, NY, US: Cambridge University Press (1994). p. 825.
54. Brandes U, Erlebach T, Koschützki D, Lehmann KA, Peeters L, Richter S, et al. Network Analysis. In: Hutchison D, Kanade T, Kittler J, Kleinberg JM, Mattern F, Mitchell JC, et al, editors. Lecture Notes in Computer Science, vol. 3418. Springer, Berlin, Heidelberg (2005). doi: 10.1007/b106453
55. Bastian M, Heymann S, and Jacomy M. Gephi: an open source software for exploring and manipulating networks. Proc Int AAAI Conf Web Soc Media. (2009) 3:361−2. doi: 10.1609/icwsm.v3i1.13937
56. Jacomy M, Venturini T, Heymann S, and Bastian M. ForceAtlas2, a continuous graph layout algorithm for handy network visualization designed for the gephi software. PloS One. (2014) 9:e98679. doi: 10.1371/journal.pone.0098679
57. Han L, Xu M, Kong X, Liu X, Wang Q, Chen G, et al. Deciphering the diversity, composition, function, and network complexity of the soil microbial community after repeated exposure to a fungicide boscalid. Environ pollut. (2022) 312:120060. doi: 10.1016/j.envpol.2022.120060
58. Bascompte J. Networks in ecology. Basic Appl Ecol. (2007) 8:485−90. doi: 10.1016/j.baae.2007.06.003
59. Collins HP, Alva A, Boydston RA, Cochran RL, Hamm PB, McGuire A, et al. Soil microbial, fungal, and nematode responses to soil fumigation and cover crops under potato production. Biol Fertil Soils. (2006) 42:247−57. doi: 10.1007/s00374-005-0022-0
60. Tekeu H, Jeanne T, D’Astous-Pagé J, and Hogue R. Artificial network inference analysis reveals the impact of biostimulant on bacterial communities in fumigated soil for potato production against common scab. Front Soil Sci. (2023) 3:1208909/full. doi: 10.3389/fsoil.2023.1208909/full
61. Chen R, Jiang W, Xu S, Fan H, Chen X, Shen X, et al. An emerging chemical fumigant: two-sided effects of dazomet on soil microbial environment and plant response. Environ Sci pollut Res. (2022) 29:3022−36. doi: 10.1007/s11356-021-15401-4
62. Nicola L, Turco E, Albanese D, Donati C, Thalheimer M, Pindo M, et al. Fumigation with dazomet modifies soil microbiota in apple orchards affected by replant disease. Appl Soil Ecol. (2017) 113:71−9. doi: 10.1016/j.apsoil.2017.02.002
63. Sederholm MR, Schmitz BW, Barberán A, and Pepper IL. Effects of metam sodium fumigation on the abundance, activity, and diversity of soil bacterial communities. Appl Soil Ecol. (2018) 124:27−33. doi: 10.1016/j.apsoil.2017.10.012
64. Zhu J, Ren Z, Huang B, Cao A, Wang Q, Yan D, et al. Effects of fumigation with allyl isothiocyanate on soil microbial diversity and community structure of tomato. J Agric Food Chem. (2020) 68:1226−36. doi: 10.1021/acs.jafc.9b07292
65. Peixoto S, Henriques I, and Loureiro S. Long-term effects of Cu(OH)2 nanopesticide exposure on soil microbial communities. Environ pollut. (2021) 269:116113. doi: 10.1016/j.envpol.2020.116113
66. Seghers D, Verthé K, Reheul D, Bulcke R, Siciliano SD, Verstraete W, et al. Effect of long-term herbicide applications on the bacterial community structure and function in an agricultural soil. FEMS Microbiol Ecol. (2003) 46:139−46. doi: 10.1016/S0168-6496(03)00205-8
67. Maslennikova VS, Tsvetkova VP, Shelikhova EV, Selyuk MP, Alikina TY, Kabilov MR, et al. Bacillus subtilis and Bacillus amyloliquefaciens Mix Suppresses Rhizoctonia Disease and Improves Rhizosphere Microbiome, Growth and Yield of Potato (Solanum tuberosum L.). J Fungi. (2023) 9:1142. doi: 10.3390/jof9121142
68. Wagg C, Schlaeppi K, Banerjee S, Kuramae EE, and van der Heijden MGA. Fungal-bacterial diversity and microbiome complexity predict ecosystem functioning. Nat Commun. (2019) 10:4841. doi: 10.1038/s41467-019-12798-y
69. Cheng H, Zhang D, Huang B, Song Z, Ren L, Hao B, et al. Organic fertilizer improves soil fertility and restores the bacterial community after 1,3-dichloropropene fumigation. Sci Total Environ. (2020) 738:140345. doi: 10.1016/j.scitotenv.2020.140345
70. Li Q, Zhang D, Cheng H, Ren L, Jin X, Fang W, et al. Organic fertilizers activate soil enzyme activities and promote the recovery of soil beneficial microorganisms after dazomet fumigation. J Environ Manage. (2022) 309:114666. doi: 10.1016/j.jenvman.2022.114666
71. Zhang H, Song J, Zhang Z, Zhang Q, Chen S, Mei J, et al. Exposure to fungicide difenoconazole reduces the soil bacterial community diversity and the co-occurrence network complexity. J Hazard Mater. (2021) 405:124208. doi: 10.1016/j.jhazmat.2020.124208
72. de Boer W, Folman LB, Summerbell RC, and Boddy L. Living in a fungal world: impact of fungi on soil bacterial niche development☆. FEMS Microbiol Rev. (2005) 29:795−811. doi: 10.1016/j.femsre.2004.11.005
73. Kracmarova M, Uhlik O, Strejcek M, Szakova J, Cerny J, Balik J, et al. Soil microbial communities following 20 years of fertilization and crop rotation practices in the Czech Republic. Environ Microbiome. (2022) 17:13. doi: 10.1186/s40793-022-00406-4
74. Rousk J, Bååth E, Brookes PC, Lauber CL, Lozupone C, Caporaso JG, et al. Soil bacterial and fungal communities across a pH gradient in an arable soil. ISME J. (2010) 4:1340−51. doi: 10.1038/ismej.2010.58
75. Girvan MS, Bullimore J, Pretty JN, Osborn AM, and Ball AS. Soil type is the primary determinant of the composition of the total and active bacterial communities in arable soils. Appl Environ Microbiol. (2003) 69:1800−9. doi: 10.1128/AEM.69.3.1800-1809.2003
76. Ajwa HA, Trout T, Mueller J, Wilhelm S, Nelson SD, Soppe R, et al. Application of alternative fumigants through drip irrigation systems. Phytopathology®. (2002) 92:1349−55. doi: 10.1094/PHYTO.2002.92.12.1349
77. Allison SD and Martiny JBH. Resistance, resilience, and redundancy in microbial communities. Proc Natl Acad Sci. (2008) 105:11512−9. doi: 10.1073/pnas.0801925105
78. Hu P, Hollister EB, Somenahally AC, Hons FM, and Gentry TJ. Soil bacterial and fungal communities respond differently to various isothiocyanates added for biofumigation. Front Microbiol. (2015) 5:729. doi: 10.3389/fmicb.2014.00729
79. Castellano-Hinojosa A, Karlsen-Ayala E, Boyd NS, and Strauss SL. Impact of repeated fumigant applications on soil properties, crop yield, and microbial communities in a plastic-mulched tomato production system. Sci Total Environ. (2024) 919:170659. doi: 10.1016/j.scitotenv.2024.170659
80. Strauss SL and Kluepfel DA. Anaerobic soil disinfestation: A chemical-independent approach to pre-plant control of plant pathogens. J Integr Agric. (2015) 14:2309−18. doi: 10.1016/S2095-3119(15)61118-2
81. Druzhinina IS, Seidl-Seiboth V, Herrera-Estrella A, Horwitz BA, Kenerley CM, Monte E, et al. Trichoderma: the genomics of opportunistic success. Nat Rev Microbiol. (2011) 9:749−59. doi: 10.1038/nrmicro2637
82. Luan P, Yi Y, Huang Y, Cui L, Hou Z, Zhu L, et al. Biocontrol potential and action mechanism of Bacillus amyloliquefaciens DB2 on Bipolaris sorokiniana. Front Microbiol. (2023) 14:1149363/full. doi: 10.3389/fmicb.2023.1149363/full
83. Chowdhury SP, Hartmann A, Gao X, and Borriss R. Biocontrol mechanism by root-associated Bacillus amyloliquefaciens FZB42 – a review. Front Microbiol. (2015) 6:780/full. doi: 10.3389/fmicb.2015.00780/full
84. Compant S, Duffy B, Nowak J, Clément C, and Barka EA. Use of plant growth-promoting bacteria for biocontrol of plant diseases: principles, mechanisms of action, and future prospects. Appl Environ Microbiol. (2005) 71:4951−9. doi: 10.1128/AEM.71.9.4951-4959.2005
85. Tiwari RK, Kumar R, Sharma S, Sagar V, Aggarwal R, Naga KC, et al. Potato dry rot disease: current status, pathogenomics and management. 3 Biotech. (2020) 10:503. doi: 10.1007/s13205-020-02496-8
86. Schmey T, Tominello-Ramirez CS, Brune C, and Stam R. Alternaria diseases on potato and tomato. Mol Plant Pathol. (2024) 25:e13435. doi: 10.1111/mpp.13435
87. Shattock R. Compendium of Potato Diseases, 2nd ed., Vol. 51. Stevenson WR, editor. St. Paul, MN: APS Press (2002), p. 520−520.
88. Johnson DA and Geary B. (Lahkim) Tsror L. Potato black dot – the elusive pathogen, disease development and management. Am J Potato Res. (2018) 95:340−50. doi: 10.1007/s12230-018-9633-5
89. Larkin RP, Honeycutt CW, and Olanya OM. Management of verticillium wilt of potato with disease-suppressive green manures and as affected by previous cropping history. Plant Dis. (2011) 95:568−76. doi: 10.1094/PDIS-09-10-0670
90. Vitale A, Aiello D, Guarnaccia V, Perrone G, Stea G, and Polizzi G. First Report of Root Rot Caused by Ilyonectria (=Neonectria) macrodidyma on Avocado (Persea americana) in Italy. J Phytopathol. (2012) 160:156−9. doi: 10.1111/j.1439-0434.2011.01869.x
91. Jiao S, Lu Y, and Wei G. Soil multitrophic network complexity enhances the link between biodiversity and multifunctionality in agricultural systems. Glob Change Biol. (2022) 28:140−53. doi: 10.1111/gcb.15917
92. Montoya JM, Pimm SL, and Solé RV. Ecological networks and their fragility. Nature. (2006) 442:259−64. doi: 10.1038/nature04927
93. Taketani RG, Moitinho MA, Mauchline TH, and Melo IS. Co-occurrence patterns of litter decomposing communities in mangroves indicate a robust community resistant to disturbances. PeerJ. (2018) 6:e5710. doi: 10.7717/peerj.5710
94. Wu X, Yang J, Ruan H, Wang S, Yang Y, Naeem I, et al. The diversity and co-occurrence network of soil bacterial and fungal communities and their implications for a new indicator of grassland degradation. Ecol Indic. (2021) 129:107989. doi: 10.1016/j.ecolind.2021.107989
95. Proulx SR, Promislow DEL, and Phillips PC. Network thinking in ecology and evolution. Trends Ecol Evol. (2005) 20:345−53. doi: 10.1016/j.tree.2005.04.004
96. van der Heijden MG and Hartmann M. Networking in the plant microbiome. PloS Biol. (2016) 14:e1002378. doi: 10.1371/journal.pbio.1002378
97. Ge AH, Liang ZH, Xiao JL, Zhang Y, Zeng Q, Xiong C, et al. Microbial assembly and association network in watermelon rhizosphere after soil fumigation for Fusarium wilt control. Agric Ecosyst Environ. (2021) 312:107336. doi: 10.1016/j.agee.2021.107336
98. Han L, Kong X, Xu M, and Nie J. Repeated exposure to fungicide tebuconazole alters the degradation characteristics, soil microbial community and functional profiles. Environ pollut. (2021) 287:117660. doi: 10.1016/j.envpol.2021.117660
Keywords: chloropicrin, bacillus species-based biostimulant, Rhizoctonia solani, fungal community, MiSeq metabarcoding, machine-learning analysis, network interaction
Citation: Tekeu H, D’Astous-Pagé J, Jeanne T and Hogue R (2025) High-throughput sequencing metabarcoding and network analysis elucidate the effects of soil fumigation and biostimulant on potato yield, rhizoctonia canker, and fungal community. Front. Soil Sci. 5:1559144. doi: 10.3389/fsoil.2025.1559144
Received: 11 January 2025; Accepted: 02 June 2025;
Published: 24 June 2025.
Edited by:
Anna Maria Puglia, University of Palermo, ItalyReviewed by:
Massimiliano Fenice, University of Tuscia, ItalyDomenico Schillaci, University of Palermo, Italy
Copyright © 2025 Tekeu, D’Astous-Pagé, Jeanne and Hogue. This is an open-access article distributed under the terms of the Creative Commons Attribution License (CC BY). The use, distribution or reproduction in other forums is permitted, provided the original author(s) and the copyright owner(s) are credited and that the original publication in this journal is cited, in accordance with accepted academic practice. No use, distribution or reproduction is permitted which does not comply with these terms.
*Correspondence: Richard Hogue, cmljaGFyZC5ob2d1ZUBpcmRhLnFjLmNh