 Workina Geleta
 Fekadu Fufa
 Abdissa Bekele3†
- 1Department of Soil Resource and Watershed Management, Wollega University, Nekemte, Ethiopia
- 2School of Civil and Environmental Engineering, Jimma University, Institute of Technology, Jimma, Oromia, Ethiopia
- 3College of Natural Resources and Environmental Science, Oda Bultum University, Chiro, Oromia, Ethiopia
The infiltration process is a significant driver of soil quality and ecological performance that is influenced by several factors, including the soil’s hydraulic characteristics, land use types, and soil depth. This study examines the effects of land use types and soil depth on soil hydraulic properties at the Arjo-Dhidhessa Estate Sugar Factory in Western Ethiopia. Composite soil samples were collected from five distinct land-use types (cropland, irrigated land, forest land, shrubland, and fallow land) at three different soil depths (0–30 cm, 30–60 cm, and 60–90 cm). Field infiltration rates were measured using a double-ring infiltrometer to assess variations in soil hydraulic properties. Results revealed significant variations in soil hydraulic properties among land-use types. Forestland exhibited the highest field capacity (51.46%), available water-holding capacity (21.23%), and soil moisture content (23.74%). In contrast, irrigated land demonstrated the lowest infiltration rates (19.6 cm/hr) and sorptivity (75.3 cm/hr), attributed to soil compaction and nutrient depletion. Hydraulic properties also varied with soil depth, showing diminished water retention and infiltration in deeper layers. These findings highlight the necessity for diversified land management strategies to optimize soil health and water resource sustainability. Integrating forest and shrubland conservation practices can enhance soil organic matter and structural integrity. Additionally, adopting techniques such as conservation tillage and reforestation may mitigate soil degradation and compaction, fostering sustainable agricultural productivity. This study underscores the pivotal role of land use in governing soil hydraulic dynamics. The results advocate for management approaches that prioritize soil health and hydrological efficiency, particularly through the preservation of forest and shrubland ecosystems. By implementing these strategies, policymakers and land managers can support long-term agricultural resilience amid ongoing land-use changes.
Highlights
● The study investigates how different land use types, such as farmland, fallow land, forest, and irrigated land, affect soil hydraulic properties.
● The findings reveal that forestlands have superior soil hydraulic properties, including higher field capacity (51.46%) and available water-holding capacity (21.23%).
● The study emphasizes how crucial sustainable farming methods are essential to preserving water supplies and soil health
● The study suggests conservation tillage to enhance water retention and reduce soil erosion.
● According to the study, sorptivity and transmissivity significantly decrease on irrigated land, indicating challenges including nutrient depletion and soil compaction.
1 Introduction
Environmental degradation is largely caused by changes in land use types, which have a major effect on biodiversity, soil health, hydrological cycles, and ecosystem services globally. Land-use activities that drastically change the amount of organic matter, soil structure, and water dynamics include deforestation, agricultural expansion, and urbanization. These changes can lead to soil compaction, reduced infiltration rates, increased surface runoff, and disruption in groundwater recharge processes (1–4). The soil’s ability to retain and move water is directly impacted by land management practices, and this ability is critical for plant growth, nutrient cycling, and ecosystem stability (5, 6).
Ethiopia has significant environmental challenges due to rapid LULC changes, as do many developing countries. The expansion of agricultural land, overgrazing, and deforestation have led to increased soil erosion, decreased soil fertility, and disturbed hydrological balances. Large-scale agricultural initiatives, particularly irrigation projects, have made soil degradation and water resource constraints worse (7, 8). The conversion of natural landscapes into agricultural fields without the application of sustainable land management techniques puts long-term agricultural productivity and environmental sustainability at particular risk because it exacerbates soil compaction and reduces infiltration capacity (9, 10).
Ethiopia continues to attempt to encourage economic growth and industrialization through agro-industrial development, particularly through large sugarcane estates such as Arjo-Dhidhessa Sugar Estate. However, there are significant environmental effects associated with the implementation of such extensive irrigation schemes. The production of sugarcane, which demands extensive irrigation and land modification, changes the hydrological processes and soil structure, frequently leading to a reduction in soil permeability and an increased susceptibility to land degradation (11). Despite their economic significance, if soil-water interactions are not properly managed, these agro-industrial developments may unintentionally jeopardize soil health and water supplies.
Land use has a significant impact on essential soil hydraulic properties such as infiltration rate, water retention capacity, and moisture dynamics that are critical for sustaining agricultural productivity and ecosystem health (12, 65). While most of present-day study is focused on surface-level changes, changes in land cover affect both subsurface and surface soil properties. It is important to understand the depth-specific impacts of different land uses before designing sustainable land and water management plans, especially in intensive agricultural systems like irrigated sugarcane plantations.
Previous studies have evaluated regional hydrological implications (13) and irrigation possibilities (66) in the Dhidhessa River Basin. However, there are still important gaps in the knowledge of how land-use changes brought about by agro-industrial irrigation affect water-holding capacity, field capacity, wilting point, and infiltration rates across different land uses and soil depths under intensive sugarcane cultivation and the empirical relationships between land-use practices, soil compaction, and hydraulic characteristics in Ethiopia’s agro-industrial systems. While surface-level consequences are the focus of current study, subsurface differences that are crucial for sustainable land management are overlooked.
This study aims to address these gaps by evaluating certain soil hydraulic characteristics (such as moisture content, water retention, and infiltration rate) at the Arjo-Dhidhessa Sugar Estate under various land use types and soil depths. The study aims to encourage solutions that decrease soil degradation, increase irrigation effectiveness, and improve agricultural resilience in Ethiopia’s rapidly changing agro-industrial landscapes by integrating spatial and depth-resolved soil data. Therefore, the main objective of this study is to evaluate selected soil hydraulic properties under varied land use types and soil depths at the Arjo-Dhidhessa Estate Sugar Factory.
2 Materials and methods
2.1 Description of the study area
2.1.1 Study area and location map
Arjo-Dhidhessa Sugar Estate is located in the East Wallaga Zones, Oromia region, 395 km from Addis Ababa and 18 km from Jimma Arjo District (Figure 1). The factory shares boundaries with specific areas of the Buno Bedele and Jimma Zones, which are located in the west of Ethiopia, at 7°36’00″ and 9°36’00″ North and 35°32’00″ and 37°34’00″ East. The average altitude of the area is 1,350 m above sea level (a.s.l.). The region experiences a hot and humid climate. The slope distribution in the region shows that approximately 67.2% of the area has slopes greater than 8%, whereas the remaining 32.8% range from mild to less severe (< 8%) (14).
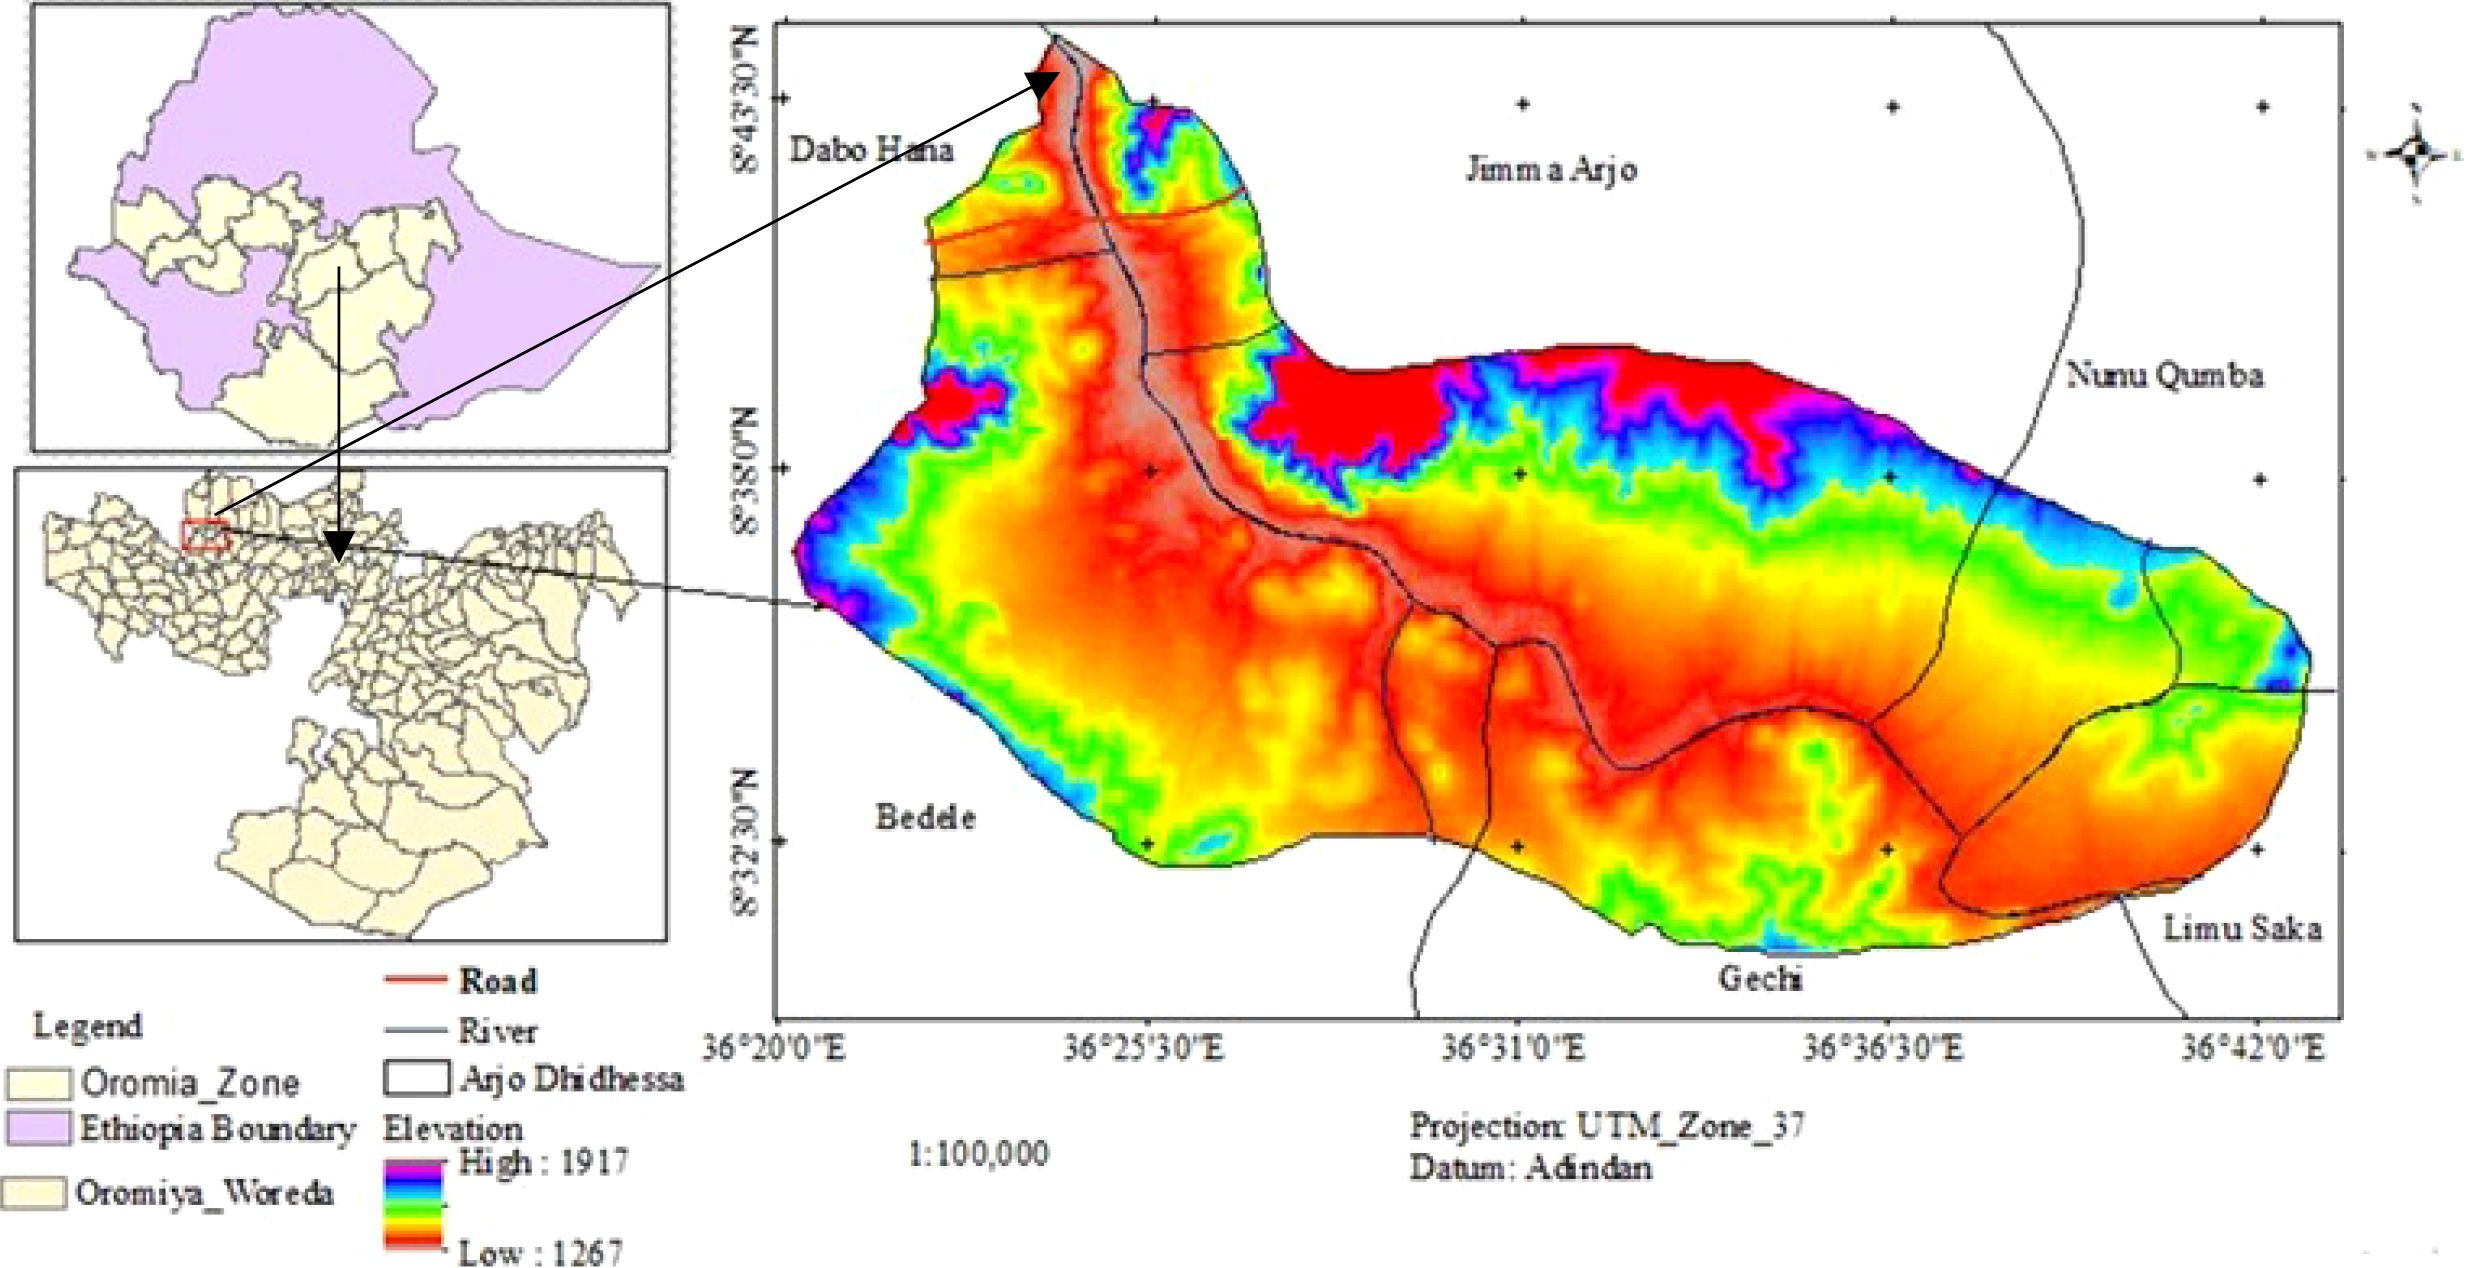
Figure 1. Map of the study area.
2.1.2 Soil and geology
The Arjo-Dhidhessa have a variety of soil types that are interconnected to the region’s geomorphology. The soil types are mostly black soil and occasionally red and brown soil, which makes it suitable for sugarcane development (15). The soils of the area are well-drained, clay loam-to-clay-textured that characterize the soils of a plateau that are stream-dissected and have flat to mild undulations (16). Precambrian basement rocks, which are high-grade genetic and pre-tectonic granites that are part of the Algae group, comprise the majority of the research area (17).
2.1.3 Climate
The study area receives 1,400 mm of unimodal annual rainfall, with the rainy season dominating from May to October. The rainfall maximum is in July (428.3 mm), and the trough is in January (16.98 mm) (Figure 2). The average monthly temperature is 23.7°C, with monthly extremes ranging from 11.2°C (lowest) to 38.5°C (highest). The annual temperature varies moderately. Monthly highs range from 29 to 29–38.5°C, while monthly lows stay between 11.2 and 11.2–17.1°C, indicating a moderate, seasonally stable climatic regime.
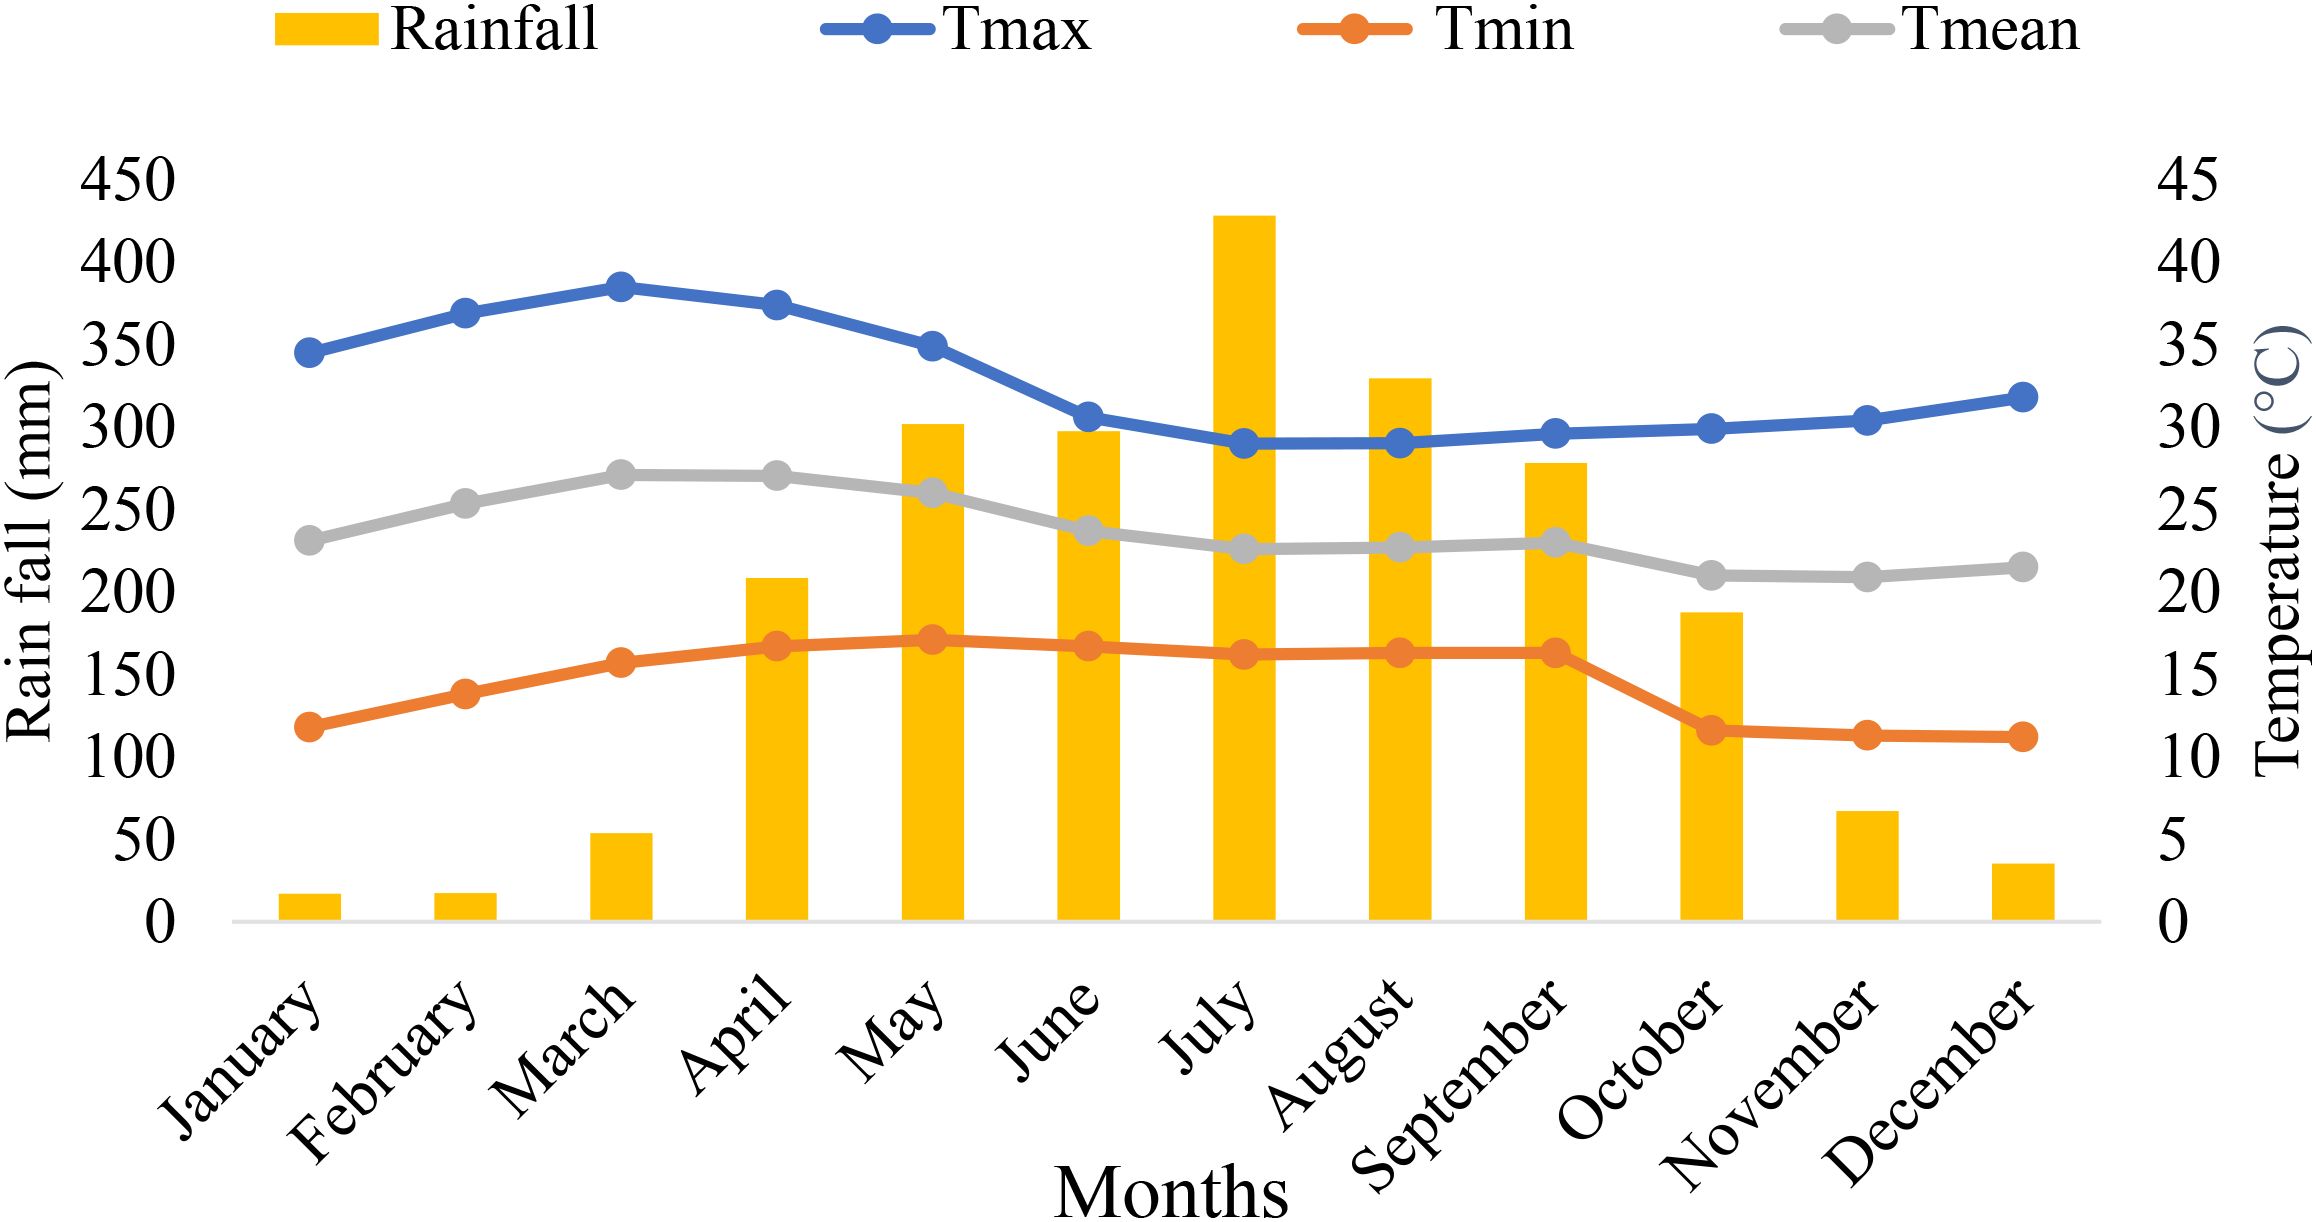
Figure 2. Rainfall and temperature distributions in the study area.
2.2 Methodology
2.2.1 Soil sample collection and preparation
To obtain a basic idea of the variances in the study area, an image-based survey was first carried out. To choose sampling sites that are typical of the land use system in Arjo-Dhidhessa Estate Sugar Factory, western Ethiopia, consideration was given to the available land use types. Five main land use types and vegetation categories, cropland, forestland, irrigated land, fallow land, and shrub land, were identified in the study area on the basis of the available land use type histories. The soil was randomly sampled via a soil auger for each land use type. The GPS coordinates of the sampling locations are shown in Figure 3. There were five typical (20 m × 20 m) plots for each form of land use type next to the forest, with a maximum distance of 200 m between them. Subsamples from each of the three depths of soil samples were used to produce a single composite sample, which was then taken from each plot via a basic random technique for each land use type. Each sampling location was cleared of gravel debris, tree roots, and nearby regions before the collection of the soil samples.
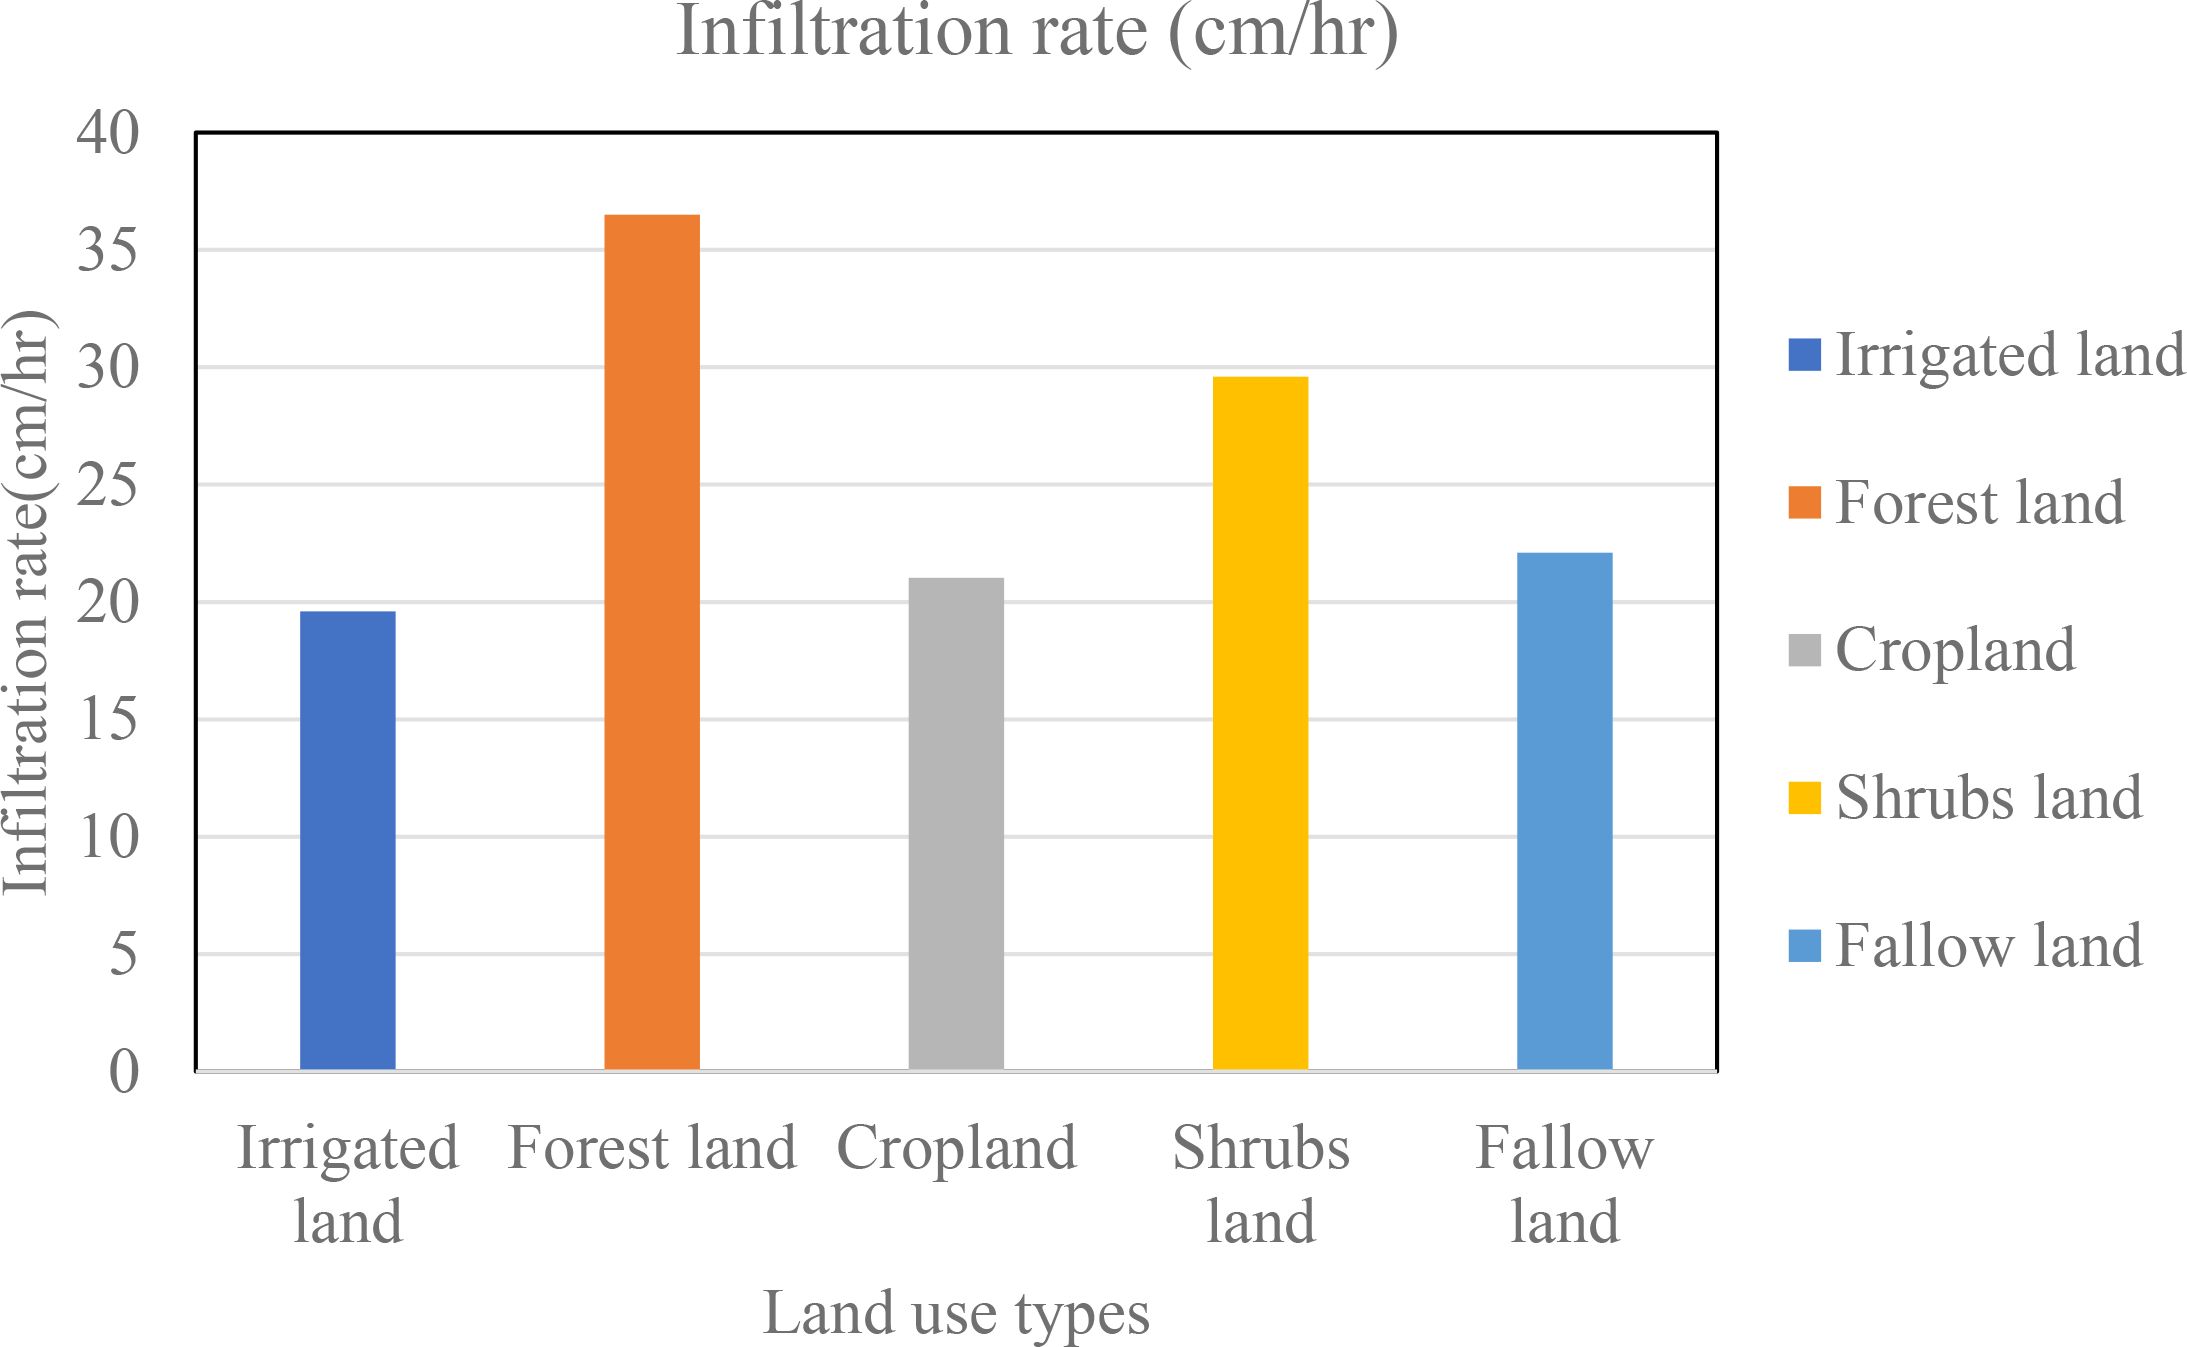
Figure 3. Infiltration rate across land use types.
For all types of land use, three soil depths were used to collect samples of both disturbed and undisturbed soil. Thus, a total of 15 undisturbed and 15 composite soil samples were collected at three different soil depths (0–30, 30–60, and 60–90 cm).
To determine the bulk density and soil moisture content, undisturbed soil samples were collected from the pits at three distinct depths via a core sampler. Except for total nitrogen (TN) and organic carbon (OC), which were run through a 0.5 mm sieve, packed in a labeled polyethylene bag, authorized, and delivered to the soil testing laboratories of Fincha Sugar Estate and the central soil laboratory of Haromaya University, the collected combined soil samples were dried in the air, carefully mixed, smashed and passed through a 2 mm sieve for each parameter examined.
2.2.2 Analysis and processing of soil samples
The United States Department of Agriculture (USDA) is a visual tool dispersion of the soil particles (sand, silt, and clay) to determine a soil’s textural class and is based on the hydrometer methods described by Bouyoucos (18). A gravimetric moisture content was determined as the mass of moisture in the soil sample divided by the mass of the dry soil multiplied by 100 (19).
The core technique was used to determine the bulk density and total porosity of the soil (Equations 1, 2), whereas the gravimetric approach was used to determine the soil water content.
Where ρb is expressed in (g/cm3, DM is the dry mass in grams, and Vis is the volume of the core sampler in (cm3).
The total porosity was calculated from the measurements of the dry bulk density (ρb) of the soil and the soil particle density (ρs) as follows:
where ρb is the bulk density (g cm-3) and ρs is the particle density, which is assumed to be 2.65 g cm-3.
A pressure device apparatus was used to measure the field capacity and permanent wilting point at 33kpa, according to the method described by Klute and Dirksen (20). Available water capacity was measured as the difference between field capacity and permanent wilting point and then multiplied by 1000 to express it in millimeters per meter of soil depth.
A pH potentiometer (model-4070) was used to measure the soil pH (1:2.5) (67). The Walkley and Black method by dichromate oxidation techniques was used to measure the soil organic carbon (SOC) (68) and the organic matter in the soil (SOM) was obtained by multiplying the SOC values by 1.724 (organic matter = 1.724 × % carbon). The Kjeldahl digestion, distillation, and titration methods were used to quantify total nitrogen.
2.2.3 Experimental site and area characterization
2.2.3.1 Measurement of infiltration rates
The soil infiltration rate was measured using a double ring infiltrometer (Humboldt Mfg. Co., Elgin, IL, USA, ASTM D3385-09) in accordance with the ASTM (21) established procedure for field infiltration testing. To assist with the measurements, we also used some basic tools, including a wooden plank, a water-filled jar, a scale and ruler, a timer, a calculator, a cross-shaped galvanized steel plate, and a steel hammer.
The infiltrometer consisted of two concentric rings with inner and outer diameters of 30 and 60 cm, respectively. Both rings were 25 cm in height, composed of 12-gauge steel, and featured sharpened bottom edges for easier insertion into the ground. Making sure that around 5 cm of each ring was above the soil’s surface, we hammered the rings into the ground with the steel hammer and galvanized plate.
To reduce extra resistance to water infiltration, we carefully eliminated any grass or vegetation inside the inner ring area before the tests. The outer edges of the ring were carefully tamped to prevent soil disturbance or leaks, and a pad was positioned inside the inner ring to stop puddling as water was being poured.
The infiltration testing procedure involved the following steps:
✔ Simultaneously filling both the inner and outer rings with water to a depth of at least 5 cm.
✔ Maintain roughly equal water levels in both rings throughout the test to limit lateral flow from the inner ring.
✔ Recording the drop in water level inside the inner ring at specific time intervals: 2, 5, 10, 20, 30, 45, and 60 minutes.
✔ Calculating cumulative infiltration and infiltration rates based on the recorded measurements.
✔ Continue the test until the rate of water level decrease slows significantly, indicating that a steady state has been reached.
The infiltration rate was recorded as the terminal (steady state) infiltration rate once it had stabilized. Measurements were performed between March and May for five different land use types, with 15 replicate samples for each type. All fieldwork was conducted in the same weather situations during the day to maintain consistency. For each land use type, the complete process was repeated in order to provide reliable assessments of the behaviors of soil infiltration.
2.2.4 Sorptivity and transmissivity
Field data were analyzed using the estimated linear infiltration formula of Philip (69) to determine sorptivity and transmissivity, which is a measure of a soil’s ability to retain or conduct water flow. The fundamental information consisted of determining accumulated infiltration (Ic) values as a function of time reported in centimeters (Equation 3).
where Ic (cm) represents the accumulated infiltration at time t (s). The sorptivity of the soil water, S(cm/√t), was determined from the slope of Ic vs. √t, where A(cm−1) is the transmissivity obtained from the intercept of the infiltration rate equation (Equation 4).
2.2.5 Statistical analysis
The statistical analysis was conducted using an Excel spreadsheet and R Software (Version 4.3.2, Boston, MA, USA). To find variations in the soil properties between the various land use categories and soil depths (P<0.05), a test of variance (ANOVA) was employed. LSD tests are used for mean comparisons when ANOVA indicates significant variation (P < 0.05) due to LSD’s focus on specific comparisons; it can be easier to interpret in certain experimental designs.
3 Results and discussions
3.1 Effects of land use types and soil depth on selected soil hydraulic properties
3.1.1 Particle size distribution (sand, silt, and clay)
The particle size distribution (clay, silt, and sand) varies significantly (P ≤ 0.01) and is affected by the interaction of land use and soil depth (Table 1). Compared with fallow and irrigated land, the surface layer of forestland had the highest percentages of sand (27.28%) due to the interaction effects of land use and soil depth. Conversely, the bottom surface layer of the cropland had the maximum amount of clay (72.16%), whereas the top layer of fallow land had the minimum amount of clay (54.56%) (Table 1).
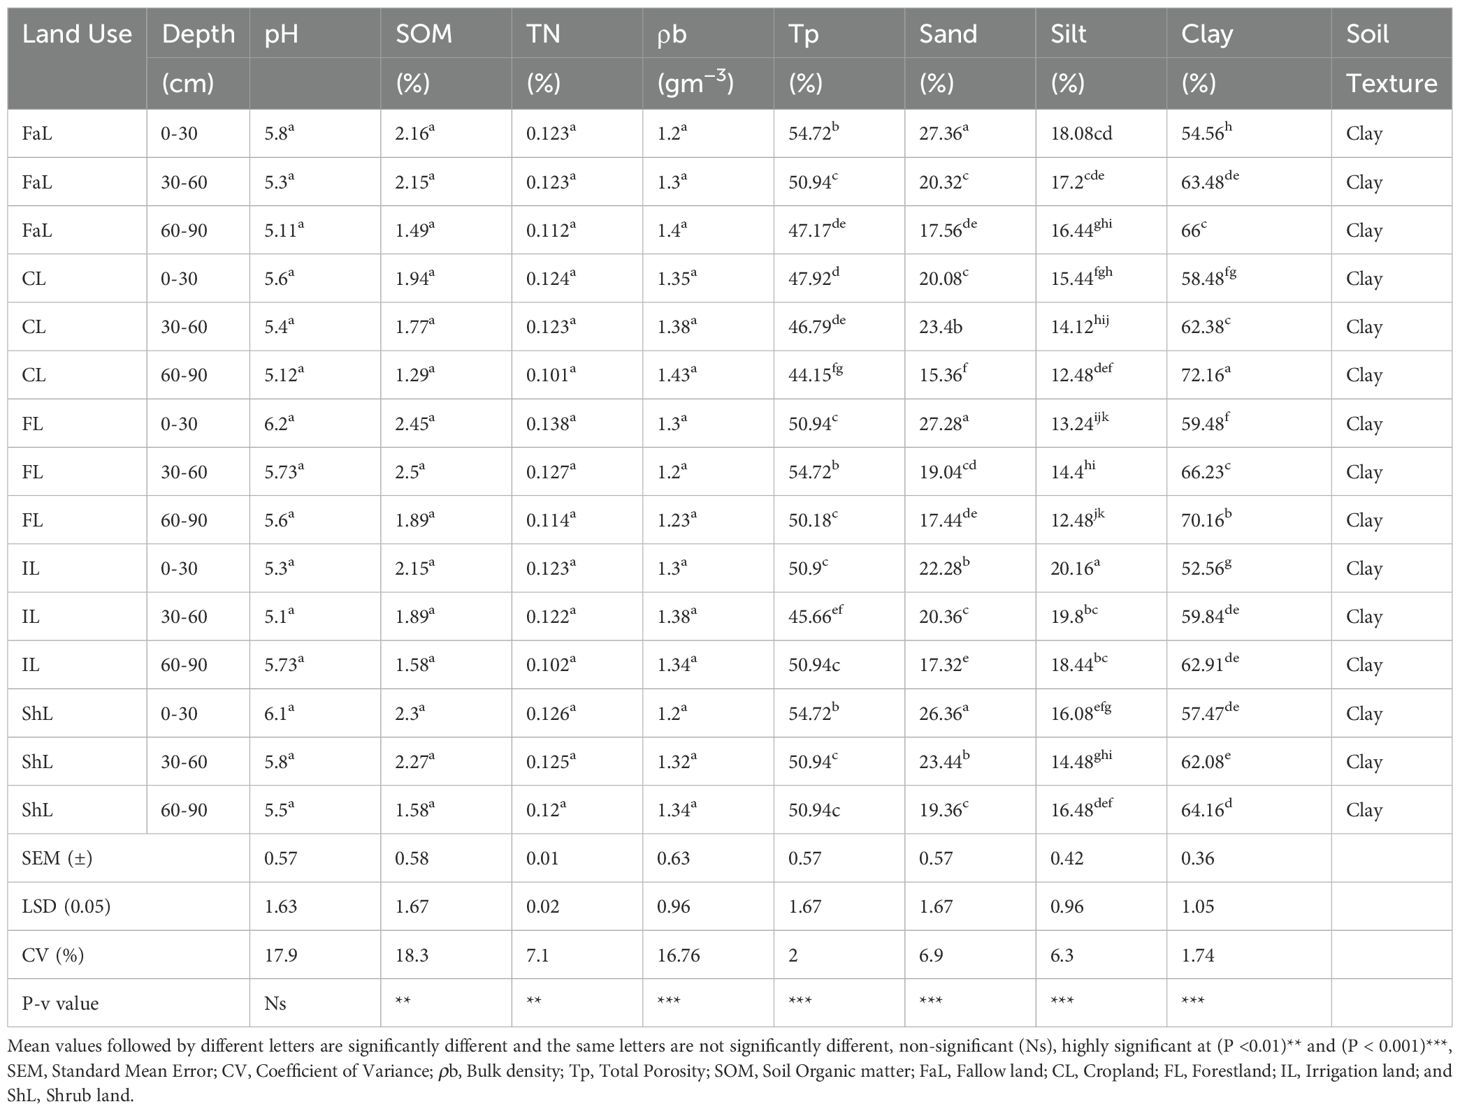
Table 1. Effects of different land use types on some soil physicochemical properties.
The higher sand and silt contents in forestland under the surface layer could be attributed to factors such as organic matter decomposition, leaf litter, and root growth, which can enhance the soil structure and increase sand and silt accumulation. On the other hand, the higher clay content in the subsurface layer of cropland may be due to tillage practices, which can mix and redistribute soil particles, leading to a higher clay content at greater depths (70, 71, 22). The current results are in line with those of Masha et al. (23), who noted that because the soil selectively removes clay fractions from the surface, croplands have lower clay fractions and higher sand fractions. The accumulation of organic matter and vegetation cover under forestland is what causes the highest amount of clay, although significant rainfall in the area may be the cause of the highest sand content (22). While the sand and silt contents reduce the soil depth in the soil profile from the surface to the subsurface, the clay content increases under all land use types (24, 72, 25).
3.1.1 Bulk density
The bulk density (ρb) was substantially (P > 0.05) not influenced by the interaction between land use and soil depth (Table 1). Considering the main effect of land use and soil depth, subsurface cropland had the highest bulk density (1.43 g/cm3), and the surface layer of forestland had the lowest bulk density (1.2 g/cm3) (Table 1). This result is in line with findings of Regassa et al. (26) Tigist et al. (27), and Haile et al. (72), who reported that the cultivated areas in the western Ethiopian region of Abobo presented the lowest bulk densities in the surface soil layer (0–20 cm). Low organic matter content, increased soil disturbance, animal trampling, recurrent tillage operations, and compaction may contribute to croplands having the highest bulk density by eliminating pore space and degrading soil organic matter (8, 22, 28). Because of compaction, reduced organic matter content, less aggregation, and fewer pore spaces in subsurface soil layers, the bulk density (ρb) increases with soil depth under all land-use regimes (29, 30).
3.1.2 Total porosity
The total porosity (Moc) content was significantly (P < 0.001) affected by the interaction effects of land use and soil depth (Table 1). Considering the interaction effect of land use and soil depth, the highest total porosity (54.72%) observed on the surface of forestland, whereas the lowest total porosity (45.66%) was recorded under the subsurface of irrigated land (Table 1). The highest total porosity above surface forestland may be attributed to the accumulation of surface litter and decomposing biomass in forest soils. Soil aggregation is encouraged by these organic materials. Stable pore holes result in enhanced porosity (31). The lowest SOM under the subsurface of irrigated land may be a result of continuous tillage, and the low organic matter content in irrigated areas may lead to reduced soil porosity and increased soil compaction. This could be the explanation for why the subsurface of irrigated areas had the lowest total porosity (32, 73). The weight of the soil layer on the surface and the decline in soil organic matter with depth might be the source of the overall reduction in porosity (33).
3.1.3 Soil pH
The soil pH was not significantly (P > 0.05) affected by the interaction of land use and soil depth (Table 2). The soil pH data revealed that most land uses fall within the moderately acidic range, with fallow land (pH 5.8), cropland (pH 5.6), forestland (pH 5.62), and shrubland (pH 5.80) categorized as moderately acidic. In contrast, irrigated land, with a pH of 5.1, is classified as “strongly acidic”. These pH values can significantly impact nutrient availability and biological activity within the soil, which are essential factors for plant growth. Therefore, it is advisable to consider soil amendments, such as lime, for irrigated land to increase pH levels and improve nutrient availability, whereas other land uses should implement regular monitoring and management practices to maintain optimal pH levels. The application of inorganic fertilizers is responsible for variations in pH (27). This result corresponds with previous studies conducted in northern Ethiopia (49).
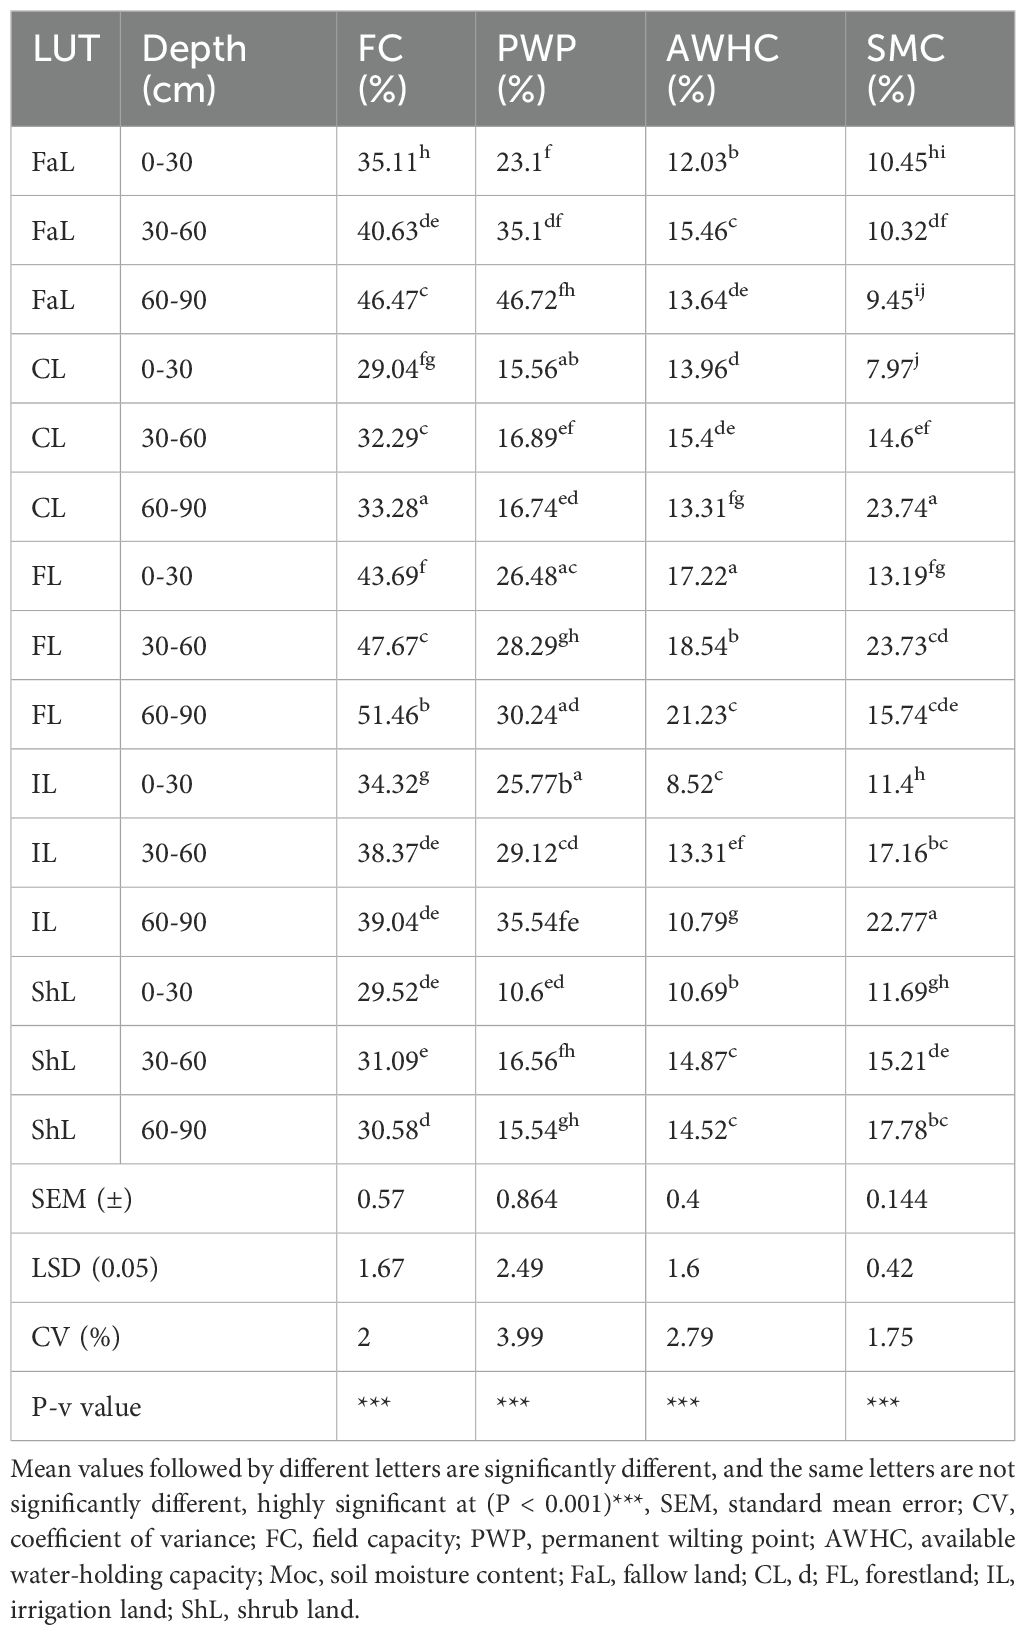
Table 2. Effects of land use types and soil depth on selected soil hydraulic properties.
The slight pH increase with depth could be explained by the migration of cations from the top layer of soil to the bottom surface of the soil (28, 34). In the subsurface soil layer, the pH of the soil was greater than that in the surface soil layer. Mulugeta et al. (25) reported that the pH varied between 5.17 and 5.84, which is mildly acidic, in all five land-use groups. This result corresponds with the findings of earlier research carried out in northern Ethiopia (49).
3.1.4 Soil organic matter
The soil organic matter content was substantially (P ≤ 0.01) influenced by the interaction between land use and soil depth (Table 2). Considering the interaction effect of land use and soil depth, the highest total SOM (2.45%) observed on the surface of forestland, whereas the lowest SOM (1.29%) was recorded under the subsurface of cropland (Table 2) The highest concentration of SOM beneath the surface of forest land may be caused by the natural deposit of SOM in the topsoil by forest ecosystems due to various significant mechanisms. The substantial organic matter that forests contribute through deadwood, leaf litter, and root turnover enriches the surface layer. Similar results have been published by He et al. (35), who pointed out that crop yields are eventually impacted by agricultural methods that result in low SOM levels (below 2%) in croplands. According to these findings, regulating SOM through organic amendments and cover crops is crucial for enhancing soil sustainability and quality in agricultural systems (22, 36, 37). The higher levels of soil organic matter in the topsoil layer across all land-use types can be attributed to the return of biomass, decomposition in the soil surface layer, and deposition of plant remains and animal waste (25, 29).
The lowest SOM in the subsurface of cropland may be the result of long-term degradation brought on by intensive cultivation. Subsurface layers of crop may retain a moderate quantity of SOM from crop remnants, despite the fact that erosion and tillage limit accumulation. Low inputs, compaction, and anaerobic conditions all contribute to the SOM depletion of subterranean layers. This result is consistent with the findings of other Ethiopian studies (38, 39). The result is in line with Bufebo and Elias’s (39) findings that soil SOM declines as soil depth increases.
3.1.5 Total nitrogen
Total nitrogen was significantly (P < 0.001) influenced by the interaction between land use and soil depth (Table 2). In terms of the relationship between land use and soil depth, total nitrogen was highest (0.138%) in the top layer of forestland, whereas it was lowest (0.101%) in the subsurface layer of cropland (Table 2). The highest total nitrogen observed under the surface of forest land attributed due to the nitrogen released during mineralization and the desirable forest climate conditions that temper soil temperature and thus decrease total nitrogen loss through volatilization, the relatively high total nitrogen content under forestland may be related to the high organic matter content. Organic matter is the primary source of total nitrogen in the soil (22, 27). This result consistent with the result of Chemeda et al. (40), who found that forestland yields a higher total nitrogen content than nearby farmed and grazing areas do.
However, the lowest total nitrogen content under irrigation and cropland may be caused by ongoing cultivation, vegetation removal for plows that deplete organic matter residues and expose the surface layer of irrigated and cropland to direct raindrop generation, loss of residue during crop harvest, and inadequate fertilizer replacement (8, 41). This result is in line with Abadeye et al. (42) and Tebekew et al. (74), who found that the decrease in total nitrogen from the surface to the subsurface is caused by nitrogen materials, such as organic matter on the surface, plant matter, and animal waste.
3.2 Effects of land use types on soil hydraulic properties
3.2.1 Field capacity
The FC was significantly (P < 0.001) influenced by land use and soil depth (Table 1). The maximum FC (51.46%) was observed in the subsurface layer (60–90 cm) of forestlands, while the lowest capacity (29.04%) was found in the surface layer (0–30 cm) of cropland (Table 1). These findings align with Assefa et al. (43) and Garedew et al. (44), who demonstrated that forested areas had significantly higher moisture retention across all depths compared to adjacent croplands. The highest soil FC on forest land and the lowest under cropland could be due to forest land being more able to retain moisture content compared to cropland, likely due to forest land having greater vegetative cover, organic matter content, deeper root systems, improved soil structure, and higher water retention and infiltration rates, whereas the FC in cropland due to reduced SOM, agricultural residue removal, and intensive tillage deteriorates soil structure by lowering pore connectivity and increasing surface-layer compaction (23, 45). This finding aligns with those of Wang et al. (46), who reported similar patterns across various land uses. Subsurface layers show higher field capacity than surface layers, indicating that deeper soil layers may contain more clay and possess a better structure for water retention (47). This observation is consistent with Hu et al. (48), who noted a higher water storage capacity in deeper soil layers due to increased porosity and reduced evaporation.
3.2.2 Permanent wilting point
The PWP was significantly (P < 0.001) influenced by land-use type and soil depth (Table 1). The highest percentage of PWP (46.72%) was observed in the subsurface layer (60–90 cm) of fallow land, while the lowest percentage (10.6%) was found in the surface layer (0–30 cm) of shrublands (Table 1). The higher PWP in subsurface fallow land may be attributed to deeper root penetration, increased organic matter content, and improved soil structure, leading to greater water-holding capacity (24, 49). Conversely, surface shrublands have reduced PWP, which is linked to shorter roots, coarser textures, and less organic matter, all of which limit the quantity of water that is available during droughts (8). Forests help PWP by retaining soil moisture, lowering evaporation, and capturing rainfall (10). Despite surface restrictions, shrublands may reduce water scarcity by improving moisture retention through root-mediated mechanisms (45).
3.2.3 Available water holding capacity
The AWHC was significantly (P < 0.001) influenced by the interaction between land use and soil depth (Table 1). Forestland in the subsurface layer (60–90 cm) exhibited the highest AWHC at 21.23% (Table 1). The highest available water-holding capacity (AWHC) was found in forestland subsurface soils (60–90 cm) (Table 1), most likely due to the buildup of organic matter and the retention-enhancing effects of well-structured soils (50). This is consistent with findings by Terefe et al. (51), who reported that forest ecosystems promote the development of stable soil aggregates and organic carbon retention at deeper layers, enhancing moisture retention. The lowest AWHC (10.69%) was found in surface shrublands (0–30 cm), which are linked with shallow roots and low organic inputs that decrease moisture storage (11). The findings are consistent with wider studies indicating that forest ecosystems are better at maintaining soil water reserves than shrublands due to their deeper root systems and ecologically dense subsurface layers (52).
3.2.4 Soil moisture content
The SMC was significantly (P < 0.001) influenced by land use and soil depth (Table 1). Forestland exhibited the highest SMC at 23.74%, while the cropland surface layer (0–30 cm) had the lowest at 7.97% (Table 1). The higher SMC (23.74%) in forestland is attributed to its dense vegetation, organic matter accumulation, deep root systems that enhance water retention, and reduced evaporation (45). Conversely, the lowest SMC (7.97%) was found in cropland surface layers (0–30 cm), most likely due to increased crop water demand, soil compaction from cultivation, and reduced organic inputs that restrict water-holding capacity (53). Soil moisture’s tendency to increase with depth was made worse by higher clay content in subsurface layers, which improves retention (38). These findings align with agroecological studies carried out in Ethiopia, which emphasize the significance of vegetation type, land management, and soil depth in regulating moisture dynamics (29).
3.3 Effects of different land use types on infiltration rate
3.3.1 Infiltration rate and cumulative infiltration
Land use types significantly influenced infiltration rates and cumulative infiltration (Figures 3, 4). Forest land showed the highest average infiltration rate (36.5 cm/hr) and cumulative infiltration (12.8 cm) (Figures 3, 4), attributed to organic matter enrichment and deep root systems that stabilize soil structure and enhance porosity (5, 54). These results align with global evidence linking forests to superior hydrological function
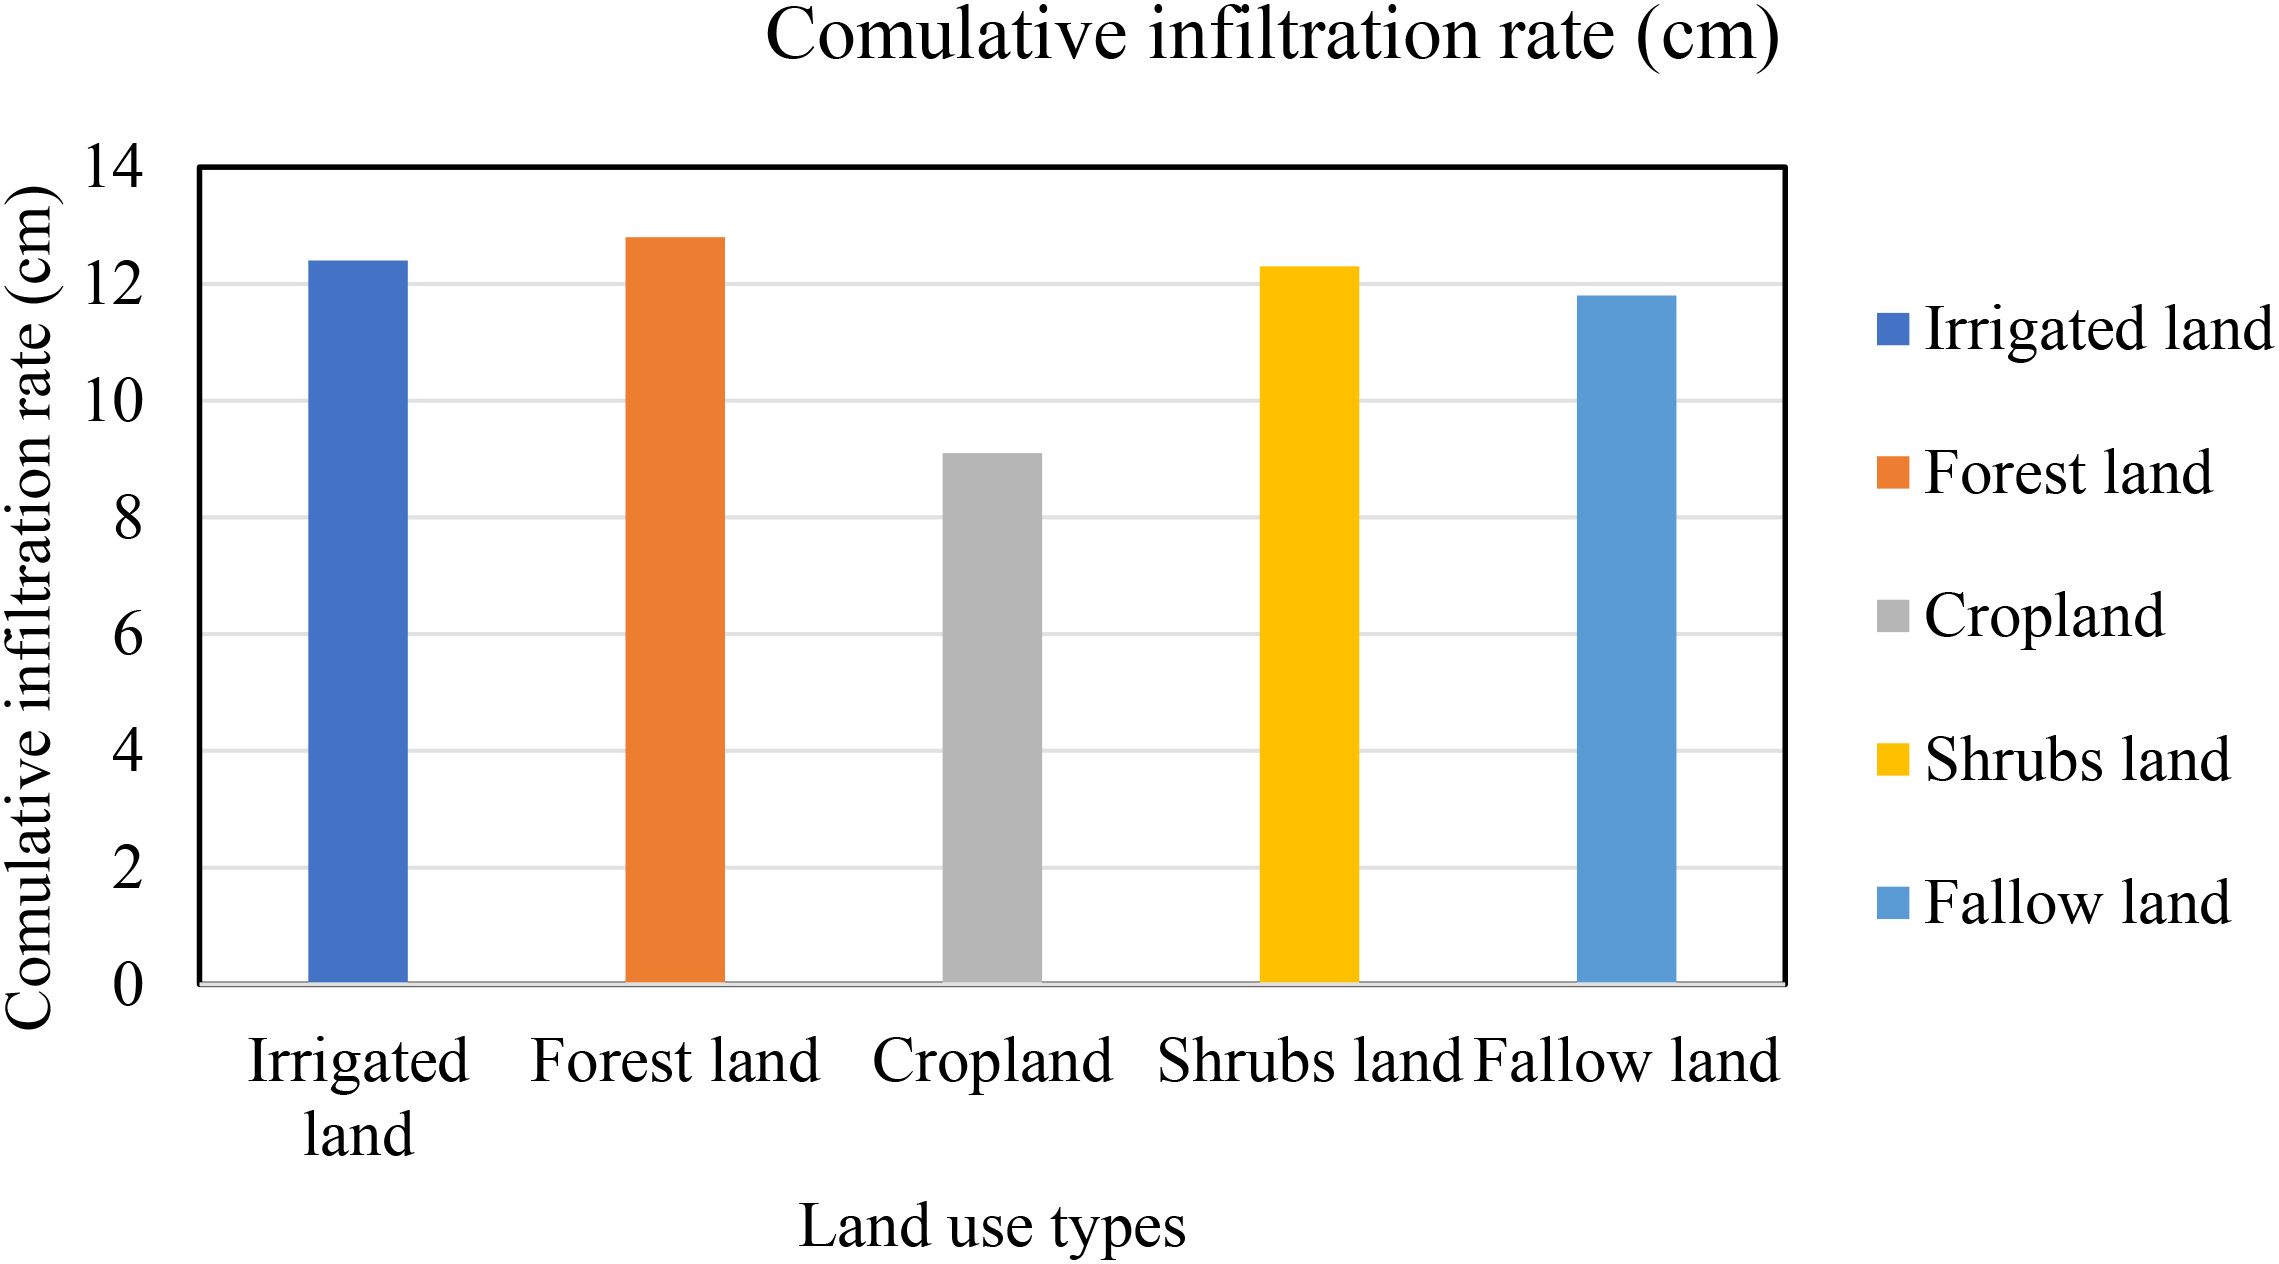
Figure 4. Cumulative infiltration across land use types.
In contrast, irrigated land had lower performance on infiltration rate and cumulative (19.6 cm/hr; 12.4 cm) (Figures 3, 4), likely due to soil compaction from frequent irrigation and machinery use, which reduces permeability (55, 56). Cropland exhibited the lowest infiltration rate and cumulative (21.03 cm/hr; 9.1 cm), reflecting compaction and organic matter depletion from intensive tillage (57).
Shrubland demonstrated strong water management with an average infiltration rate and a cumulative infiltration (29.6 cm/hr; 12.3 cm) (Figures 3, 4), as shrub roots mitigate erosion and sustain moderate porosity, though less effectively than forests (58, 59). Fallow land showed intermediate values of infiltration rate and cumulative (22.1 cm/hr; 11.8 cm), suggesting partial soil recovery during rest periods but insufficient biological activity to match vegetated systems (75). These findings underscore the critical role of vegetation and land management in soil hydrology. Forests and shrublands outperform agricultural systems due to organic inputs and stable structure, while irrigation and tillage degrade infiltration capacity. Prioritizing agroforestry and reduced tillage could mitigate water scarcity in vulnerable ecosystems (5, 55).
3.3.2 Sorptivity
Shrubland had the highest average sorptivity at (146.5 cm/hr), while croplands exhibit significantly lower sorptivity values at (75.3 cm/hr) (Figure 5). The highest sorptivity under shrubland may be due to the increased soil organic matter and structural porosity that vegetation fosters, which encourages water infiltration. These findings are in line with trends that were shown to be dependent on land use by Debebe et al. (60). On the other hand, the lower sorptivity in croplands may be due to soil being packed down and losing organic matter from regular tilling, which agrees with Miller et al. (4) and Agbai Williams et al. (57), who point out that farming methods significantly affect soil water properties. The pattern of sorptivity rates is as follows: shrubland (146.5 cm/hr) > fallow land (113.9 cm/hr) > forest land (113.4 cm/hr) > irrigated land (90.2 cm/hr) > cropland (75.3 cm/hr) (Figure 5). This pattern supports previous research by Failache and Zuquette (61), which found that sorptivity is influenced by different land use systems.
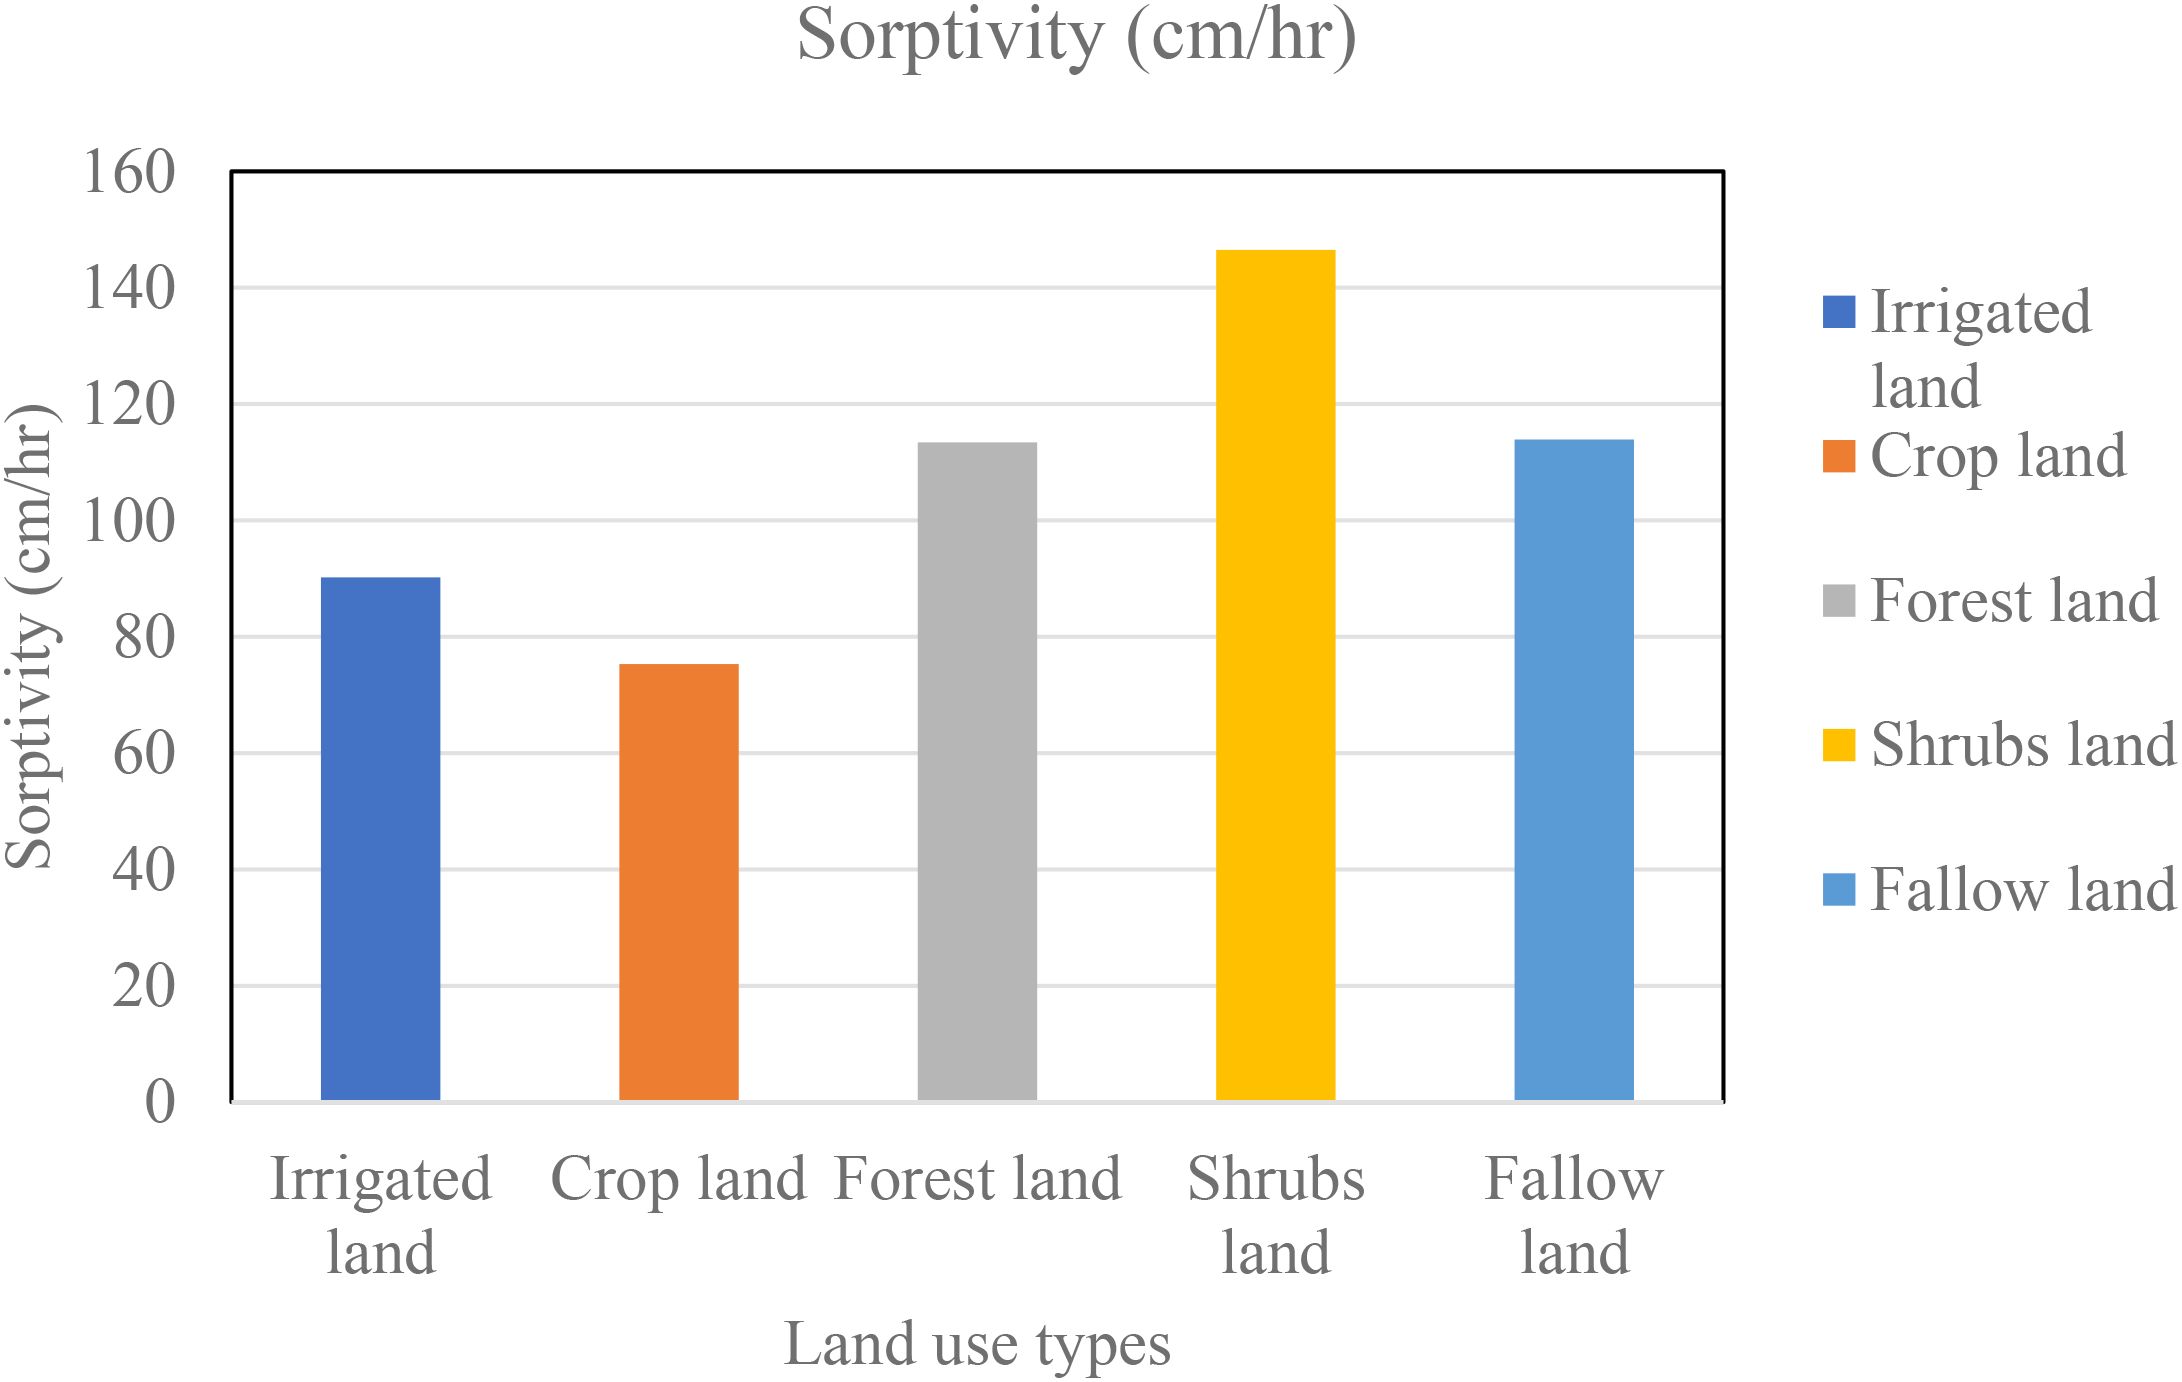
Figure 5. Average sorptivity across land use types.
3.3.3 Transmissivity (A)
Forest land exhibited the highest transmissivity at (1.01 cm/hr), while, in contrast, irrigated land showed lower transmissivity at (0.3 cm/hr) (Figure 6). Forest land had the highest soil transmissivity, likely due to their organic matter and well-developed soil structure, which allowed water to move easily. In contrast, irrigated lands had the lowest, maybe due to compaction and decreased porosity from frequent irrigation, which increased the risk of waterlogging (62). These findings are consistent with those of Karahan and Yalim (5) and Agbai Williams et al. (57), who connected hydraulic features to land-use practices. They are also supported by Zhang et al. (63) and Müller (64), who pointed out that extensive irrigation breaks down soil stability. The results underscore how important land management is to preserve the hydrological function of soil, especially in agricultural settings where sustainable practices may reduce waterlogging and improve permeability.
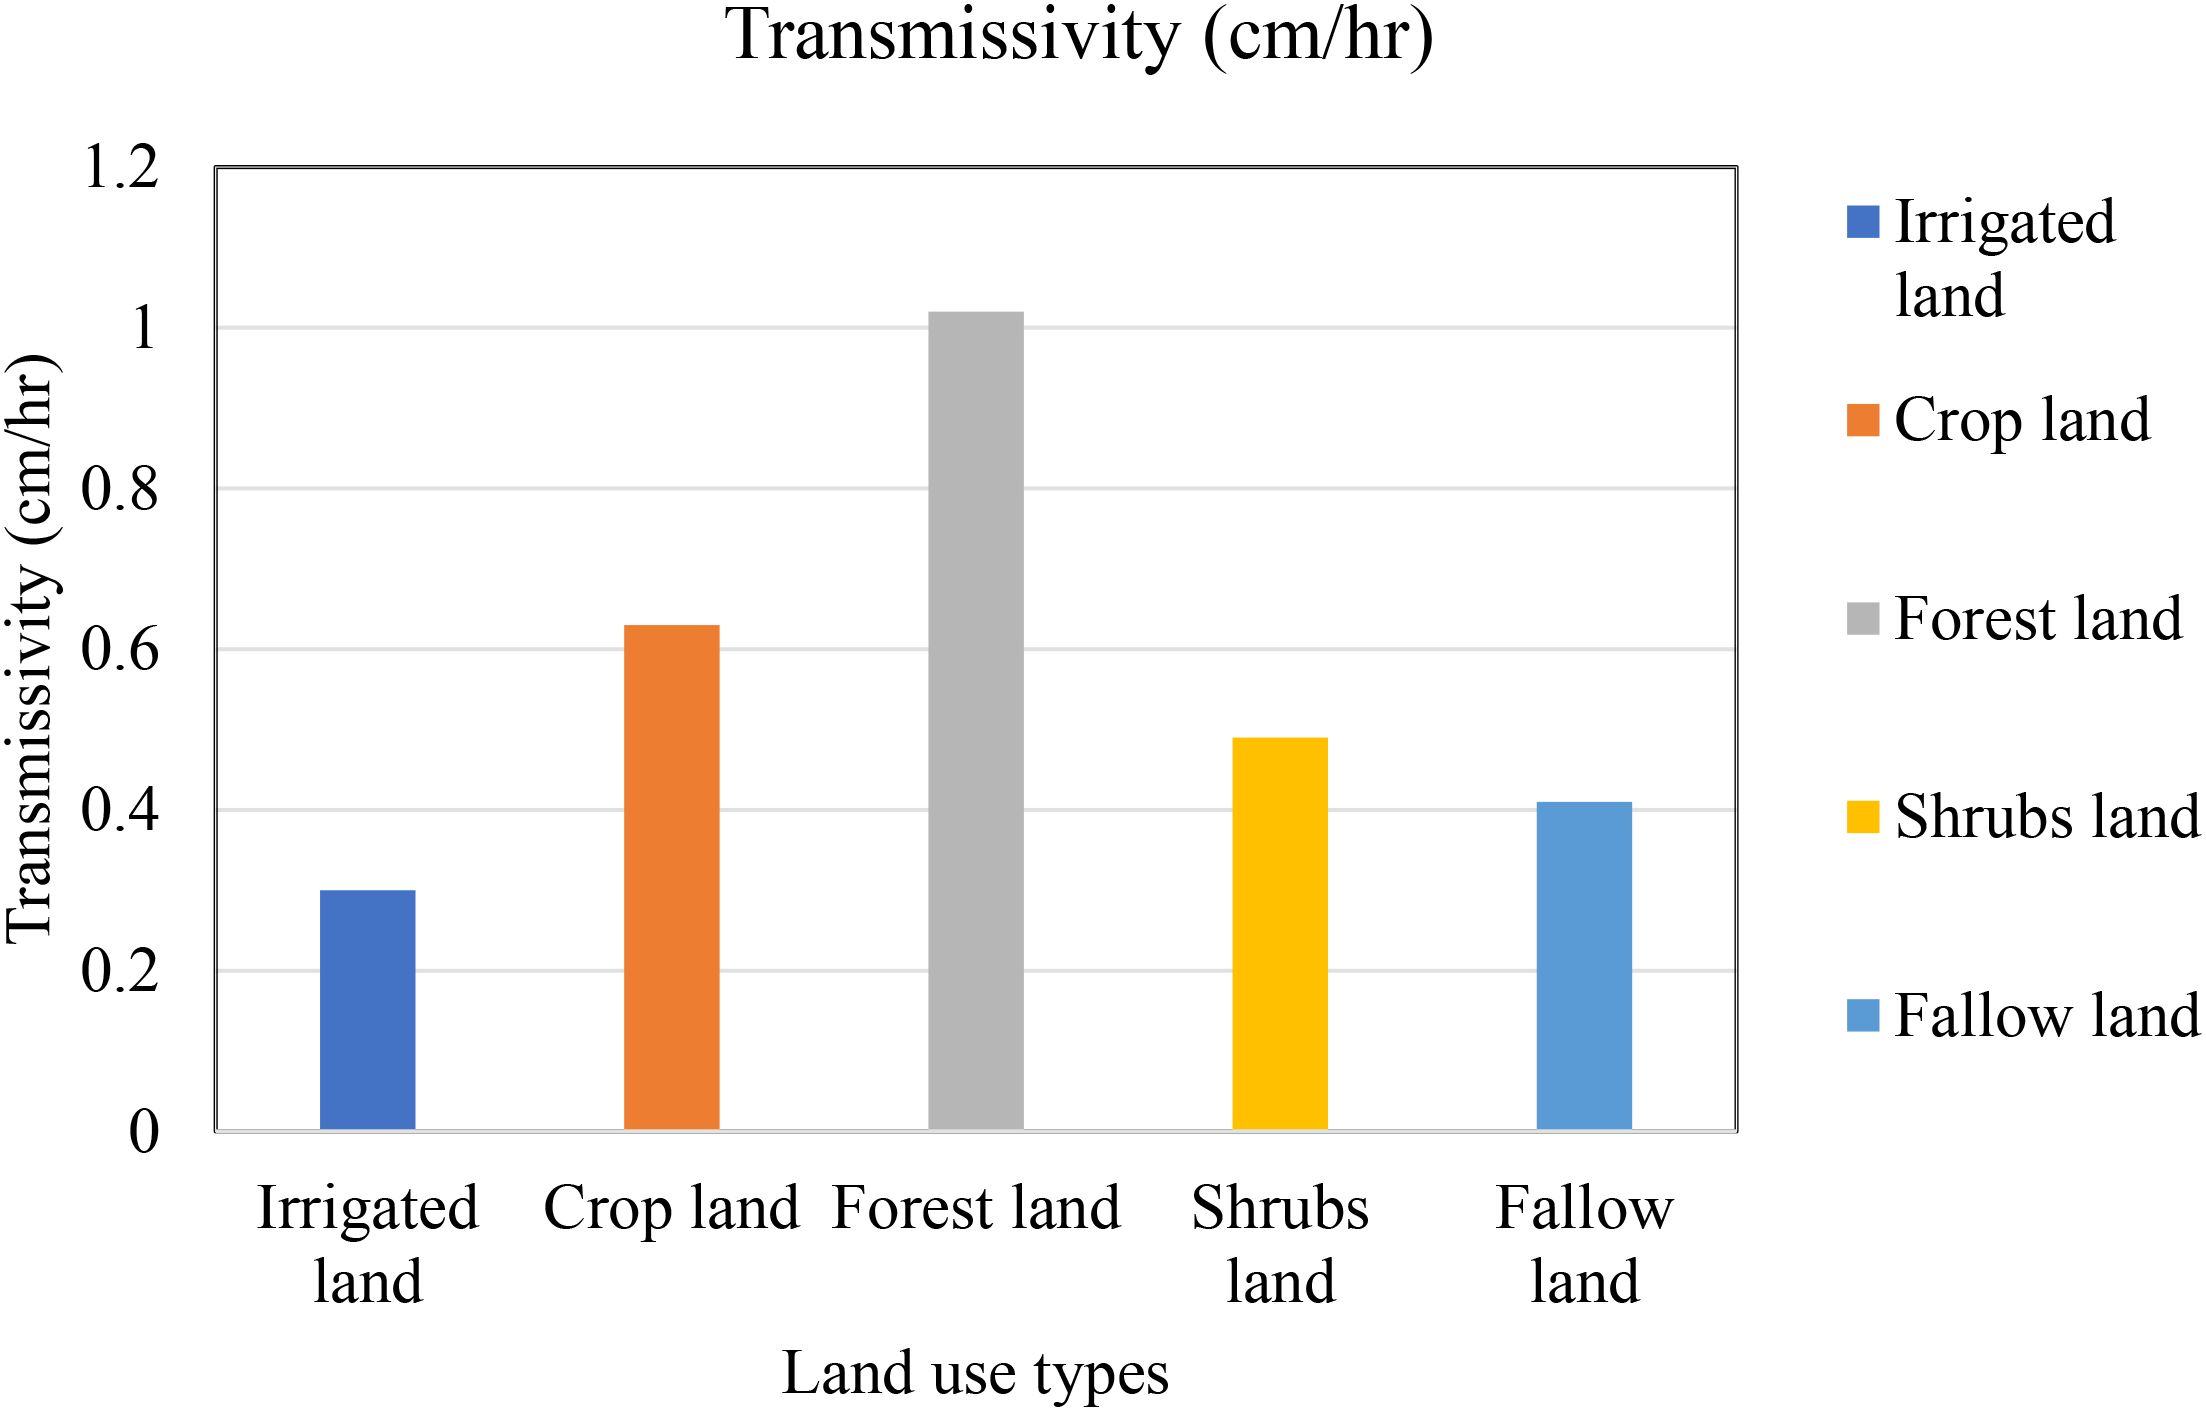
Figure 6. Average soil transmissivity across land use types.
3.4 Practical implications of the study
The study on soil hydraulic properties under varied land use types at the Arjo-Dhidhessa Sugar Estate in Western Ethiopia presents several practical implications for agriculture and land management:
3.4.1 Sustainable agricultural practices
The findings indicate that relying solely on agricultural practices may not be sustainable for maintaining soil health. This suggests that integrating diverse land use practices, such as incorporating forest and shrubland, can enhance soil health and water retention, which is crucial for sustainable agriculture.
3.4.2 Water resource management
The research highlights the complex interactions between land use, soil depth, and hydraulic properties. This information is valuable for developing effective farming practices that support water resource management in the region. Policymakers and land managers can utilize these insights to promote practices that enhance water retention and soil quality.
3.4.3 Impact of land use changes
The study identifies the lasting effects of land use changes on hydraulic soil characteristics. This underscores the need for further research to develop effective water conservation strategies that can be applied in similar agricultural contexts, thereby improving water resource management.
3.4.4 Soil management techniques
The research suggests that specific land management techniques, such as conservation tillage, replanting, and reducing soil compaction, are essential for maintaining soil health. These practices can help mitigate issues like soil compaction and nutrient depletion observed in irrigated lands, which showed lower sorptivity and infiltration rates.
3.4.5 Vegetation protection
The study emphasizes the importance of protecting vegetation, particularly in forestlands, which exhibited superior soil moisture content and hydraulic properties. This highlights the role of vegetation in maintaining soil quality and water retention, suggesting that land management should prioritize the conservation of natural vegetation.
3.4.6 Policy recommendations
The findings provide essential insights for policymakers, advocating for the integration of diverse land use practices to improve soil health and water retention. This can lead to more effective agricultural policies that support long-term sustainability in the face of ongoing land transformation.
4 Conclusions and recommendations
4.1 Conclusions
The study conducted at Arjo-Dhidhessa Sugar Estate underscores the significance soil depth and land use have in influencing hydraulic properties. The higher soil moisture retention and sorptivity (146.5 cm/hr in shrublands) and vegetation-driven organic matter buildup in forest and shrubland systems have been attributed to structural porosity and vegetation. In contrast, irrigated lands exhibited significant decreases in transmissivity (0.3 cm/hr) and sorptivity (75.3 cm/hr), which were attributed to nutrient depletion and compaction from intensive activities. The permanent wilting point (PWP) was highest in deeper fallow layers (60–90 cm) and lowest in shrubland topsoil (0–30 cm), suggesting that subsurface moisture reserves are essential for drought resilience. This suggests that soil depth further influenced moisture dynamics.
4.2 Recommendations
To mitigate degradation in irrigated systems, farmers could adopt conservation tillage, precision irrigation, and organic matter restoration strategies. Governments and organizations should prioritize vegetation-based strategies (e.g., agroforestry, shrubland preservation) to enhance soil organic matter accumulation, porosity, soil infiltration and water retention, especially in regions that have been degraded or heavily farmed and are affected by semi-arid or arid conditions. Farmers should optimize irrigation strategies to reduce compaction and nutrient depletion in irrigated lands and convert to precision irrigation systems (such as drip irrigation systems) and integrate conservation tillage in land preparation.
4.3 Limitations
✔ Geographic specificity: Findings originate from a single estate; validation across different soil types and climates is essential for broader relevance.
✔ Temporal constraints: Since the data only cover a single period, they cannot provide valuable information about seasonal variability or long-term trends.
✔ Socioeconomic factors: Labor and cost barriers to implementing suggested practices were not assessed.
4.4 Future research direction
✔ Multi-regional studies: Investigate hydraulic characteristics in a range of agroecological zones to determine general compared to situation-specific management recommendations.
✔ Long-term research: Evaluate the long-term effects of methods of conservation (such as agroforestry and reduced tillage) on soil resilience and health.
Data availability statement
The original contributions presented in the study are included in the article/supplementary material. Further inquiries can be directed to the corresponding author.
Author contributions
WG: Writing – original draft, Writing – review & editing. FF: Writing – original draft, Writing – review & editing. AB: Writing – original draft, Writing – review & editing.
Funding
The author(s) declare that no financial support was received for the research and/or publication of this article.
Acknowledgments
We acknowledge Wollega University for its ongoing oversight, guidance, and direction in this PhD dissertation research.
Conflict of interest
The authors declare that the research was conducted in the absence of any commercial or financial relationships that could be construed as a potential conflict of interest.
Generative AI statement
The author(s) declare that no Generative AI was used in the creation of this manuscript.
Publisher’s note
All claims expressed in this article are solely those of the authors and do not necessarily represent those of their affiliated organizations, or those of the publisher, the editors and the reviewers. Any product that may be evaluated in this article, or claim that may be made by its manufacturer, is not guaranteed or endorsed by the publisher.
References
1. Kalhoro SA, Xu X, Ding K, Chen W, Shar AG, and Rashid M. The effects of different land uses on soil hydraulic properties in the Loess Plateau, Northern China. Land Degradation Dev. (2018) 29:3907–16. doi: 10.1002/ldr.3138
2. da Silva AJP, Pinheiro EAR, and de Jong van Lier Q. Determination of soil hydraulic properties and its implications for mechanistic simulations and irrigation management. Irrigation Sci. (2020) 38:223–34. doi: 10.1007/s00271-020-00664-5
3. Ayele HA, Aga AO, Belayneh L, and Wanjala TW. Hydrological responses to land use/land cover changes in Koga watershed, upper Blue Nile, Ethiopia. Geographies. (2023) 3:60–81. doi: 10.3390/geographies3010004
4. Miller PR, Jones CA, Zabinski CA, Tallman SM, Housman ML, D’Agati KM, et al. Long-term cover crop effects on biomass, soil nitrate, soil water, and wheat. Agron J. (2023) 115:1705–22. doi: 10.1002/agj2.21336
5. Karahan G and Yalim YŞ. Evaluation of the relationship between infiltration rate and some soil properties under different land use. Yuzuncu Yil Univ J Agric Sci. (2022) 32:623–34. doi: 10.29133/yyutbd.1130123
6. Gedefaw M, Denghua Y, and Girma A. Assessing the impacts of land use/land cover changes on water resources of the nile river basin, Ethiopia. Atmosphere. (2023) 14. doi: 10.3390/atmos14040749
7. Mogas A. Land use/land cover change and its impact on soil properties in the Ethiopian highlands. Land Degradation Dev. (2020) 31:865–76.
8. Leul Y, Assen M, Damene S, and Legass A. Effects of land use types on soil quality dynamics in a tropical sub-humid ecosystem, western Ethiopia. Ecol Indic. (2023) 147:110024. doi: 10.1016/j.ecolind.2023.110024
9. Gashu K and Gebre-Egziabher T. Spatiotemporal trends of urban land use/land cover and green infrastructure change in two Ethiopian cities: Bahir Dar and Hawassa. Environ Syst Res. (2018) 7. doi: 10.1186/s40068-018-0111-3
10. Zhang R, Zhao X, Zhang C, and Li J. Impact of rapid and intensive land use/land cover change on soil properties in arid regions: A case study of Lanzhou new area, China. Sustainability (Switzerland). (2020) 12:1–16. doi: 10.3390/su12219226
11. Jiru EB and Wegari HT. Soil and water conservation practice effects on soil physicochemical properties and crop yield in Ethiopia: review and synthesis. Ecol Processes. (2022) 11. doi: 10.1186/s13717-022-00364-2
12. Dionizio EA and Costa MH. Influence of land use and land cover on hydraulic and physical soil properties at the cerrado agricultural frontier. Agric (Switzerland). (2019) 9:1–14. doi: 10.3390/agriculture9010024
13. Duguma T. Application of SWAT (Soil and water assessment tool) to the abay river basin of Ethiopia: the case of didessa sub basin. (2018). doi: 10.20944/preprints-201805.0147.v1
14. Merga BB, Moisa MB, Negash DA, Ahmed Z, and Gemeda DO. Land surface temperature variation in response to land-use and land-cover dynamics: a case of the Didessa River sub-basin in Western Ethiopia. Earth Syst Environ. (2022) 6:803–15. doi: 10.1007/s41748-022-00303-3
15. Tadese M, Kumar L, Koech R, and Kogo BK. Mapping of land-use/land-cover changes and its dynamics in the Awash River Basin using remote sensing and GIS. Remote Sens Applications: Soc Environ. (2020) 19:100352. doi: 10.1016/j.rsase.2020.100352
16. Gemeda DO, Korecha D, and Garedew W. Evidence of climate change is present in the wettest parts of southwest Ethiopia. Heliyon. (2021) 7:e08009. doi: 10.1016/j.heliyon.2021.e08009
17. Feyissa M. Remote sensing GIS-based spatio-temporal land use/cover study of western Ethiopian highlands—A case of jima arjo district. Science Technol Arts Res J. (2015) 4:139. doi: 10.4314/star.v4i1.24
18. Bouyoucos GJ. Hydrometer method improved for making particle size analysis of soils. Agron J. (1962) 54:464–5. doi: 10.2134/agronj1962.00021962005400050028x
19. Aikins SHM and Afuakwa JJ. Effect of four different tillage practices on soil physical properties under cowpea. Agric Biol J Northa. (2012) 3:17–24. doi: 10.5251/abjna.2012.3.1.17.24
20. Klute A and Dirksen C. Hydraulic conductivity and diffusivity: Laboratory methods. Methods Soil Analysis Part 1: Phys Mineralogical Methods. (2018) 9:687–734. doi: 10.2136/sssabookser5.1.2ed.c28
21. ASTM. D3385-09, Standard Test Method for Infiltration Rate of Soils in Field Using Double-Ring Infiltrometer. West Conshohocken, PA: ASTM International (2009).
22. Geremew B, Tadesse T, Bedadi B, Gollany HT, Tesfaye K, and Aschalew A. Impact of land use/cover change and slope gradient on soil organic carbon stock in Anjeni watershed, Northwest Ethiopia. Environ Monit Assess. (2023) 195:971. doi: 10.1007/s10661-023-11537-7
23. Masha M, Belayneh M, Bojago E, Tadiwos S, and Dessalegn A. Impacts of land use and topography on soil physicochemical properties in the Wamancho watershed, Southern Ethiopia. J Agric Food Res. (2023) 14:100854. doi: 10.1016/j.jafr.2023.100854
24. Bayle D, Feyissa S, and Tamiru S. Effects of land use and slope position on selected soil physicochemical properties in Tekorsh Sub-Watershed, East Gojjam Zone, Ethiopia. Open Agric. (2023) 8. doi: 10.1515/opag-2022-0147
25. Mulugeta T, Melese A, and Wondwosen TENA. Effects of land use types on selected soil physical and chemical properties: The case of Kuyu District, Ethiopia. Eurasian J Soil Sci. (2019) 8:94–109. doi: 10.18393/elss.510744
26. Regassa A, Assen M, Ali A, and Gessesse B. Major soil types. In: The soils of Ethiopia. Springer International Publishing, Cham (2023). p. 77–110. doi: 10.21203/rs.3.rs-3371625/v1
27. Tigist AK, Abayneh B, Yigzaw M, and Birhan TA. The effect of land use type on selected soil physicochemical properties in Shihatig watershed, Dabat district, Northwest Ethiopia. Heliyon. (2023) 9. doi: 10.1016/j.heliyon.2023.e16038
28. Weldewahid Y, Habtu S, Taye G, Teka K, and Gessesse TA. Effects of long-term irrigation practice on soil quality, organic carbon and total nitrogen stocks in the drylands of Ethiopia. J Arid Environments. (2023) 214:104982. doi: 10.1016/j.jaridenv.2023.104982
29. Fentie SF, Jembere K, Fekadu E, and Wasie D. Land use and land cover dynamics and properties of soils under different land uses in the tejibara watershed, Ethiopia. Sci World J. (2020) 2020. doi: 10.1155/2020/1479460
30. Liao Y, Dong L, Li A, Lv W, Wu J, Zhang H, et al. Soil physicochemical properties and crusts regulate the soil infiltration capacity after land-use conversions from farmlands in semiarid areas. J Hydrology. (2023) 626:130283. doi: 10.1016/j.jhydrol.2023.1302283
31. Chimdi A and Gurmessa E. Effects of land use on selected soil properties and carbon sequestration in the Gurra watershed: The case of Chalia District, West Shoa Zone, Oromia, Ethiopia. South Afr J Bot. (2023) 156:21–8. doi: 10.1016/j.sjb.2023.036
32. Eyayu M and Mamo Y. The effects of land use types and soil depth on soil properties of Agedit watershed, Northwest Ethiopia. Ethiopian J Sci Technol. (2018) 11:39–56. doi: 10.4314/ejst.v11i1.4
33. Elias E. Selected chemical properties of agricultural soils in the Ethiopian highlands: a rapid assessment. South Afr J Plant Soil. (2019) 36:153–6. Available online at: https://hdi.handle.net/10520/EJC-168f69876a.
34. Girma K, Yimer F, Tamirat T, and Abdelkadir A. Effect of land use change on soil physico-chemical properties under different land use systems in arsi zone, oromia region, Ethiopia. J Biol Nat. (2023) 15:57–69. doi: 10.56557/JOBAN/2023/v15i18076
35. He Y, Wang Y, and Zhang H. Effects of land use on soil organic carbon and nitrogen in the Loess Plateau, China. Catena. (2019) 175:27–36.
36. Lal R. Soil organic matter and its role in sustainable agriculture. J Soil Water Conserv. (2020) 75:47A–54A. doi: 10.2489/jswc.75.3.47A
37. Shibabaw T, George MOR, and Gärdenäs AI. The combined impacts of land use change and climate change on soil organic carbon stocks in the Ethiopian highlands. Geoderma Regional. (2023) 32:e00613. doi: 10.1016/j.geodrs.2023.e00613
38. Assefa F, Elias E, Soromessa T, and Ayele GT. Effect of changes in land-use management practices on soil physicochemical properties in kabe watershed, Ethiopia. Air Soil Water Res. (2020) 13. doi: 10.1177/1178622120939587
39. Bufebo B and Elias E. Effects of land use/land cover changes on selected soil physical and chemical properties in Shenkolla watershed, south Central Ethiopia. Adv Agric. (2020) 2020:1–8. doi: 10.1155/2020/5145483
40. Chemeda M, Kibret K, and Fite T. Influence of different land use types and soil depths on selected soil properties related to soil fertility in Warandhab Area, Horo Guduru Wallaga Zone, Oromiya, Ethiopia. Int J Environ Sci Natural Resour. (2017) 4:555634. doi: 10.19080/IJESNR.2017.04.555634
41. Tamiru B, Soromessa T, Warkineh B, and Legese G. Mapping soil parameters with environmental covariates and land cover projection in tropical rainforest, hangadi watershed, Ethiopia. Sustainability. (2023) 15:1066. doi: 10.3390/ju.15021066
42. Abadeye T, Yitbarek T, Zewide I, and Adimasu K. Assessing soil fertility influenced by land use in Moche, Gurage Zone, Ethiopia. Sci Temper. (2023) 14:80–92. doi: 10.58414/Scientifictemper.2023.14.1.10
43. Assefa D, Taddese H, and Tolossa D. Effects of land-use change on soil physical properties and moisture retention in the Ethiopian Highlands. Geoderma Regional. (2023) 32:e00574. doi: 10.1016/j.geodrs.2023.e00574
44. Garedew M, Ayalew Z, and Taddese H. Effects of land use changes on soil hydraulic properties in the Ethiopian highlands. Soil Tillage Res. (2023) 231:105762. doi: 10.1016/j.still.2023.105762
45. Damtie BB, Mengistu DA, Waktola DK, and Meshesha DT. Impacts of soil and water conservation practice on soil moisture in debre mewi and sholit watersheds, abbay basin, Ethiopia. Agric (Switzerland). (2022) 12. doi: 10.3390/agriculture12030417
46. Wang L, Zhang H, Wang N, and Xu J. Effects of contemporary land use change on soil infiltration capacity in a typical hilly basin on the Loess Plateau, China. Catena. (2018) 160:81–9. doi: 10.1016/j.scitotenv.2018.01.104
47. Abdulrahman S, Malami SI, Adedokun TA, Haruna A, Attahiru YB, and Haruna SI. Effect of crude oil spillage on engineering properties of tropical residual soil. IOP Conf Series: Earth Environ Sci. (2020) 476. doi: 10.1088/1755-1315/476/1/012048
48. Hu YF, Peng JJ, Yuan S, Shu XY, Jiang SL, Pu Q, et al. Influence of ecological restoration on vegetation and soil microbiological properties in Alpine-cold semi-humid desertified land. Ecol Eng. (2016) 94:88–94. doi: 10.1016/j.ecoleng.2016.05.061
49. Seifu W, Elias E, Gebresamuel G, Feyisa GL, and Tefera W. Characterisation and mapping of soil-landscape for site-specific soil management in ayiba watershed, northern highlands of Ethiopia. Appl Environ Soil Sci. (2023) 2023. doi: 10.1155/2023/8899956
50. Tamer M. Assessment of rainfall-runoff relation/mechanisms under different land uses and landscape position in Northwestern Ethiopia. (2023), 0–23. doi: 10.21203/rs.3.rs-2959773/v1
51. Terefe M, Bewket W, and Teketay D. Impact of land use and land cover change on soil physical and hydrological properties in tropical highlands of Ethiopia. Catena. (2023) 229:107070. doi: 10.1016/j.catena.2023.107070
52. Aneseyee AB, Soromessa T, Elias E, Noszczyk T, and Feyisa GL. Evaluation of water provision ecosystem services associated with land use/cover and climate variability in the winike watershed, omo gibe basin of Ethiopia. Environ Manage. (2022) 69:367–83. doi: 10.1007/s00267-021-01573-9
53. Abdallah AM, Jat HS, Choudhary EF, Abdelaty P, Sharma C, and Jat ML. Conservation agriculture effects on soil water-holding capacity and water conservation varied with management practices and agroecological conditions: a review. Agronomy. (2021) 11. doi: 10.3390/agronomy11091681
54. Lestariningsih ID, Mewar FR, Anggara AD, Lathif S, Sukbara GP, Riza S, et al. Impact of reforestation after forest fire on infiltration and other soil physical properties. J Trop Soils. (2024) 29.
55. Asfawesen Molla G, Desta G, and Dananto M. Soil management and crop practices affect soil water infiltration and soil water storage in the humid lowlands of the Beles sub-basin, Ethiopia. Hydrology. (2022) 10:1. doi: 10.11648/j.hyd.20221001.11
56. Sattari MT, Mirabbasi R, Dolati H, Sureh FS, and Ahmad S. Investigating the effect of managing scenarios of flow reduction and increasing irrigation water demand on water resources allocation using system dynamics (case study: Zonouz dam, Iran). J Tekirdag Agric Faculty. (2020) 17:406–21. doi: 10.33462/jotaf.703167
57. Agbai Williams P, Kosuowei Mouna T, and Efenudu Ufuoma I. The infiltration capacity of soils under different land-use systems in Yenagoa and Southern Ijaw local government areas of Bayelsa State. Afr J Agric Food Sci. (2022) 5:17–28. doi: 10.52589/ajafs-liaii98m
58. Wen Y, Hu C, Zhang G, and Jian S. Response of the parameters of the excess infiltration and excess storage model to land use cover change. J Hydrology Hydromechanics. (2020) 68:99–110. doi: 10.2478/johh-2020-0006
59. Li H, Liao X, Zhu H, Wei X, and Shao M. Soil physical and hydraulic properties under different land uses in the black soil region of northeast China. Can J Soil Sci. (2019) 99:406–19. doi: 10.1139/cjss-2019-0039
60. Debebe W, Yirgu T, and Debele M. Dynamics of soil physical and chemical properties under different current land use types and elevation gradients in the sala watershed of ari zone, south Ethiopia. Appl Environ Soil Sci. (2024) 2024:7389265. doi: 10.1155/2024/7389265
61. Failache MF and Zuquette LV. Soil water infiltration under different land use conditions: in situ tests and modeling. RBRH. (2021) 26:e26. doi: 10.1590/2318-0331.262120210063
62. Marie Mireille N,M, Mwangi H,K, Mwangi J, and Mwangi Gathenya J. Analysis of land use change and its impact on the hydrology of Kakia and Esamburmbur sub-watersheds of Narok County, Kenya. Hydrology. (2019) 6:86. doi: 10.3390/hydrology6040086
63. Zhang W, Zhu X, Xiong X, Wu T, Zhou S, Lie Z, et al. Changes in soil infiltration and water flow paths: Insights from subtropical forest succession sequence. CATENA. (2023) 221:106748. doi: 10.1016/J.CATENA.2022.106748
64. Müller EV. Analysis of forest-specific ecosystem services with regard to water balance components: runoff and groundwater recharge in the forest. (2023). doi: 10.25353/ubtr-xxxx-6762-a1b9
65. Ikechukwu AF and Hassan MM. Assessing the extent of pavement deterioration caused by subgrade volumetric movement through moisture infiltration. Int J Pavement Res Technol. (2022). 15:676–92. doi: 10.1007/s42947-021-00044-y
66. Muche M, Yemata G, Molla E, Adnew W, and Muasya M. Land use and land cover changes and their impact on ecosystem service values in the north-eastern highlands of Ethiopia. Plos One. (2023). 18:e0289962.
67. Thomas GW. Soil pH and soil acidity. In: Sparks DL, Page AL, Helmke PA, Loeppert RH, Soltanpour PN, Tabatabai MA, et al. Methods of soil analysis: part 3. Chemical methods. (1996). Madison, WI: Soil Science Society of America and American Society of Agronomy
68. Neilson DW and Somers IE. Total carbon, organic carbon, and organic matter, chemical and microbiological properties. Am Soc Agro Bio J. (1982). 9:639–79.
69. Philip JR. The theory of infiltration: 1. The infiltration equation and its solution. Soil Sci. (1957). 83:345–58.doi: 10.1097/00010694-195705000-00002
70. Fetene EM and Amera MY. The effects of land use types and soil depth on soil properties of Agedit watershed, Northwest Ethiopia. Ethiopia J Sci Technol. (2018). 11:39–56. doi: 10.4314/ejst.v11i1.4
71. Amsalu A and Yesgat S. Effect of eucalyptus plantations on soil properties: The case of Entoto Area, Northern Addis Ababa, Ethiopia. J Environ Earth Sci. (2019). 9:49–62. doi: 10.7176/JEES
72. Haile G, Lemenih M, and Agegnehu G. Soil property and crop yield responses to variation in land use and topographic position: a case study from the southern highland of Ethiopia. Heliyon. (2024). 10(3). doi: 10.1016/j.heliyon.2024.e25098
73. Jamal K and Tesgaye H. Soil physicochemical property characterization along with different land use systems in Gurage zone, southern Ethiopia. Mod CChem. (2020). 8:40.
74. Tebekew FA, Tadesse TB, Alemu DA, and Ayalew AA. Soil physicochemical properties variation under annual crop and coffee landuse in the Chentale Watershed, Upper Blue Nile Basin, Ethiopia. Appl Environ Soil Sci. (2023). doi: 10.1155/2024/2921614
Keywords: ecosystem services, infiltration, soil hydraulic function, soil physical properties, soil
Citation: Geleta W, Fufa F and Bekele A (2025) Soil hydraulic properties under different land use types and soil depth at Arjo-Dhidhessa estate sugar factory, Western Ethiopia. Front. Soil Sci. 5:1565143. doi: 10.3389/fsoil.2025.1565143
Received: 22 January 2025; Accepted: 14 July 2025;
Published: 31 July 2025.
Edited by:
Sunita K. Meena, Dr. Rajendra Prasad Central Agricultural University, IndiaReviewed by:
Sunday Ewele Obalum, University of Nigeria, Nsukka, NigeriaMesfin Hailemariam Habtegebriel, Addis Ababa University, Ethiopia
Copyright © 2025 Geleta, Fufa and Bekele. This is an open-access article distributed under the terms of the Creative Commons Attribution License (CC BY). The use, distribution or reproduction in other forums is permitted, provided the original author(s) and the copyright owner(s) are credited and that the original publication in this journal is cited, in accordance with accepted academic practice. No use, distribution or reproduction is permitted which does not comply with these terms.
*Correspondence: Workina Geleta, d29ya2luYWdhQHdvbGxlZ2F1bml2ZXJzaXR5LmVkdS5ldA==
†ORCID: Workina Geleta, orcid.org/0009-0008-6316-2601
Fekadu Fufa, orcid.org/0000-0001-8974-0328
Abdissa Bekele, orcid.org/0000-0003-2354-5815