 Yujia Liu1*
 Henri M. P. Siljanen2
 Björn Kemmann3,4
 Per Ambus1Dhiraj Paul2Krishnapriya Thiyagarasaiyar2
 Bo Elberling1
 Florian Wichern5
 Kristian Thorup-Kristensen6Carsten W. Mueller1,3
 Daniel M. N. Poultney1,7,8
- 1Department for Geoscience and Natural Resource Management, University of Copenhagen, Copenhagen, Denmark
- 2Department of Environmental and Biological Sciences, University of Eastern Finland, Kuopio, Finland
- 3Chair of Soil Science, Institute of Ecology, Technische Universität Berlin, Berlin, Germany
- 4Department of Renewable Resources, University of Alberta, Edmonton, AB, Canada
- 5Soil Science and Plant Nutrition, Sustainable Food Systems Research Centre, Rhine-Waal University of Applied Sciences, Kleve, Germany
- 6Department of Plant and Environment Science, University of Copenhagen, Taastrup, Denmark
- 7CIRAD, UMR Eco&Sols, Montpellier, France
- 8Eco&Sols, University of Montpellier, CIRAD, INRAe, Institut Agro, IRD, Montpellier, France
Background and aims: Eastern Denmark’s agricultural landscapes feature numerous topographic depressions that are frequently flooded during late winter and spring. These poorly drained, carbon- and nitrogen-rich depression soils receive eroded material from adjacent slopes. Fertilization and water saturation create N2O emission hotspots. However, the potential legacy effects of these topographic locations on microbial communities involved in N2O production and reduction remain unclear. One approach to mitigating high denitrification rates (as a source of N2O) is to alter microbial pathways by adding nonhazardous levels of copper.
Methods: We conducted an incubation study using upland and depression soils from the same site, incorporating varying Cu levels (0, 130, and 260 mM) and water levels (60% and 90% water holding capacity).
Results: Depression soils emitted eight times more N2O than upland soils at 90% WHC. Cu addition did not reduce cumulative N2O emissions but delayed or lowered the flux peak. Depression soils exhibited 3,000- and 4,000-fold higher 16S rRNA and nosZ clade I abundances, respectively, compared to upland soils. Cu addition significantly decreased 16S rRNA abundance, eliminated AOB amoA in upland soils, and slightly reduced the tested gene abundances in depression soils. The nosZ gene community structure differed significantly between the two soils.
Conclusions: Overall, our study suggests that erosional differentiation of soil properties, together with frequent waterlogging conditions, can result in distinct microbial communities, fostering legacy effects that lead to differences in N2O emissions between upland and depression soils. Adding Cu to these intensively managed soils is unlikely to be an effective strategy for mitigating N2O emission hotspots in arable fields.
1 Introduction
Nitrous oxide (N2O) is a long-lasting greenhouse gas (~ 120-year lifetime) with approximately 300 times greater global warming potential than carbon dioxide (CO2) (over a 100-year time horizon), and it is also the primary cause of ozone depletion (1, 2). Agricultural activities contribute about 60% of global anthropogenic N2O emissions due to the extensive use of synthetic N fertilizers and manure (3). In countries with intensive agriculture, such as Denmark, farming activities accounted for 89% of national total N2O emissions in 2018 (4). Consequently, atmospheric N2O concentrations have been rising continuously since 1960 (5). Without effective mitigation measures, N2O emissions are projected to double by 2050 (6).
The main sources of N2O production from soils are the two microbial processes of nitrification and denitrification. N2O is a by-product of nitrification during the oxidation of NH4+ to NO3− by ammonia oxidizers and is formed under O2-limiting conditions (7). Ammonia oxidation is considered the rate-determining step of nitrification, catalyzed by the ammonia monooxygenase (AMO) enzyme, specifically its active subunit A gene (amoA), and is performed by ammonia-oxidizing bacteria (AOB) or ammonia-oxidizing archaea (AOA) (8). Nitrification-related N2O emissions are assumed to be the major source under low soil water conditions (9). Under the described soil conditions of landscape depressions, denitrification is considered the dominant microbial process contributing to N2O emissions from soils. Denitrification is favored under oxygen-limited conditions, where NO3− is converted via NO2−, NO, N2O, and eventually N2 (7). This process is governed by substrate availability (NO3−, carbon), soil pH, and soil aeration (7).
It is crucial to understand how factors such as soil type, topography, and plant–microorganism–soil interactions influence the fate of soil inorganic N and its emission as N2O. Therefore, it is important to determine whether certain landscape forms are more prone to high N2O emissions than others. Landscapes with depressions, which can be observed as small-scale, lower-lying areas, are particularly at risk of substantial N2O emissions (10, 11). Eastern Denmark is characterized by a glacial landscape, which has widespread low-lying landscape depressions, dividing the landscape into upland areas and slopes toward depressions. These topographic depressions in Denmark are characterized by temporal waterlogging and high soil moisture conditions, typically from late autumn until early spring of the following growing season. Soil moisture, among other factors, creates spatially distinct patterns and differences in soil redox regimes at the field scale (12). Nonetheless, these topographic reliefs in the typical glacial landscape of Eastern Denmark are mostly located within croplands and are therefore under intensive agricultural use, receiving high nitrogen (N) inputs.
It was recently shown that depressions within agricultural fields in Eastern Denmark have far greater N2O emission potential, presumably from denitrification, than the surrounding upland areas (10). However, the reasons for this discrepancy in emissions along the topographical slopes are still not entirely understood. One possible reason could be distinct soil moisture conditions that determine soil aeration, along with a timely overlap with N fertilizer application. Additionally, soils from the frequently flooded depression areas and from well-drained uplands exhibit significantly different soil chemical and physical properties, as well as differing microbial community compositions (12, 13). For example, soil texture is well known to be greatly affected by soil erosion and deposition, leading to finer-textured soils in the depression area (14). This can result in poor drainage, more frequent anaerobic conditions, and consequently, a potentially higher soil organic carbon (SOC) sequestration and denitrification rate in these depression areas (15). Few studies have clearly shown that topography at the field scale not only affects soil physical and chemical properties but also, consequently, the soil microbial community structure (16, 17). In understanding the factors that determine the properties of specific glacial depression soils, the actual legacy of repeated soil flooding could play a determining role in the biogeochemical regulation of spatially heterogeneous N2O emission at the field scale (12, 18). However, studies on flooding legacy induced by topographic positions at the field scale are scarce, and researchers have mainly focused on pure topographic effects rather than process-level considerations of microbial ecology (17).
The net N2O flux from soils results from the balance between N2O production and N2O consumption by soil microbes. However, the only known N2O sink in the ecosystem is the microbial reduction of N2O to N2, catalyzed by nitrous oxide reductase (N2OR) (19). The N2OR active site is encoded by the Z subunit gene (nosZ), which contains two central Cu atoms, a binuclear CuA center, and a tetranuclear CuZ cluster (20). Therefore, Cu bioavailability in the environment may regulate N2OR synthesis and influence N2O fluxes as well (21). Additionally, in the nitrification pathway, AOA and AOB both require Cu as a cofactor for the AMO active sites (22). A reduction in AOA abundance has been shown to correlate with lower Cu availability (23).
Cu deficiency has been reported in numerous agricultural soils under intensive farming practices, including historically in Denmark, where 25% of arable land was predicted to be Cu deficient in 2008 (24). Conversely, excessive Cu accumulation in soils poses a risk, as Cu is a heavy metal and toxic to a wide range of soil microorganisms. For example, 89 mg Cu kg−1 for clay soils and 26 mg Cu kg−1 for sandy soils have been suggested as the maximum no-effect concentrations in Denmark (25). On average, 14% of the total Cu concentration is bioavailable (26). Due to the high livestock density, some Danish farmland even receives considerable amounts of Cu through large Cu inputs via manure, mainly from pig slurry (25). Both Cu deficiency and excess influence the soil nitrogen cycling by affecting microbial activity and function (27–30). Since microbially available Cu promotes complete denitrification, the mitigation potential of this mechanism has been investigated with the aim of increasing N2O reduction to N2 by enhancing nosZ gene expression through available Cu. For example, low nosZ gene activity has been observed in microbial cultures under Cu-deficient conditions (28). However, in soil systems, Cu effects on nosZ gene abundance remain inconsistent, ranging from no clear impact to increased abundance (27, 29, 31). This clearly suggests that Cu effects on nosZ gene expressions and, thus, on net N2O emissions from the generally very complex soil systems still remain unclear and require further study.
Based on these research gaps, we studied how soil flooding in landscape depressions can foster differences in N2O emissions, with a particular focus on the sustained effects of the legacy of repeated flooding on microbial community structure. Furthermore, we studied whether increased Cu availability could decrease N2O emissions from upland and depression soils as affected by different water saturation levels. We assumed that the soil flooding legacy, water saturation, and Cu amendment control N2O emissions in agricultural soils, and hypothesized that (1) depression soils show higher levels of N2O emissions compared to upland soils at similar soil water saturation; (2) the highest N2O emissions occur when water levels are high with no Cu addition; and (3) the abundance of nosZ genes increases with increased Cu availability in soils.
2 Materials and methods
2.1 Study site and soil sampling
Soils were collected from a long-term monitoring site near Sorø (55.453702 N, 11.519423 E), Denmark, on 25 May 2022. The study site, planted with winter wheat in the year of sampling, is characterized by a gradient along a slope between a glacial depression and an upland area. Corresponding with the field N2O gas monitoring locations, soils from the upland and the depression positions were collected at a depth of 0–5 cm. Both upland and depression sampling areas are located within the same field, separated by a distance of 10 m along the slope. At this site, four replicate subsamples were taken from both the upland and depression areas. Subsamples from each area (upland or depression) were pooled together for later use. Soils were air-dried and sieved to 2 mm, and coarse plant material and stones were removed. The maximum soil water holding capacity was determined to be 27% for upland soils and 41% for depression soils. Soil properties are presented in Table 1.
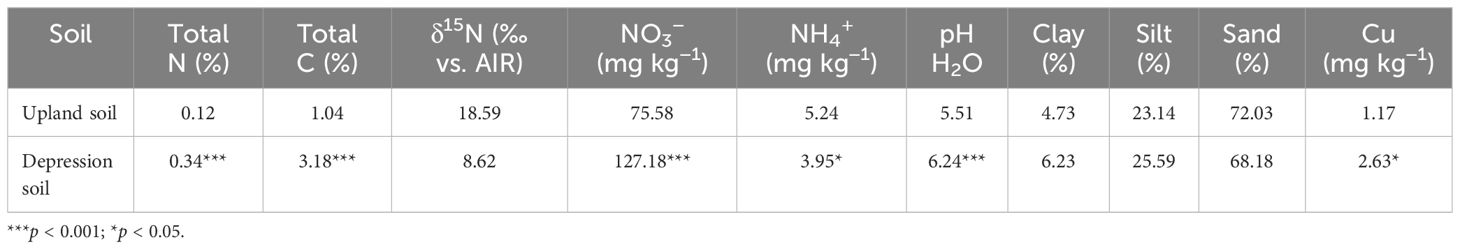
Table 1. Soil properties used in the incubation experiment.
2.2 Experimental design and soil preparation
For this experiment, we compared both the effects of Cu addition and water availability on N2O emission from both depression and upland soils. The influence of three factors on N2O emissions was tested: Cu addition (0, 130, and 260 mM), different water saturation levels (60%, 90% maximal water holding capacity [WHC]), and soil locations (upland and depression). Soils were labeled with either 15NH415NO3 or 14NH415NO3 to differentiate between N2O production pathways derived from nitrification (15NH4+) or denitrification (15NO3−). All treatments were incubated in four replicates, with a total of 96 samples.
Soils were prewetted 24 h before the experiment using deionized water. Samples were placed in zip-lock plastic bags (equivalent to 70 g air-dried soil), and 0.5 mL of 0, 130, or 260 mM CuSO4 was applied (corresponding to 0, 4.13, and 8.26 mg Cu). The soil was carefully mixed in the zip-lock bag to ensure a homogeneous distribution of CuSO4. To trace the N2O production pathways, soils were labeled with either 15NH415NO3 or 14NH415NO3 solution (10 atom percent excess) at an application concentration of 5.13 mg N kg−1 soil (equivalent to 10 kg N ha−1). After carefully mixing in a zip-lock bag, soils (equivalent to 70 g air-dried soil, 0.88 g cm−3 bulk density) were weighed into PVC rings and loosely packed by tapping the bottom of the ring to ensure that the soil surface was level with the top of the PVC ring (inner diameter: 4.5 cm; height: 5 cm). The bottom of the PVC rings was covered with a fine mesh, allowing for gas exchange. Maximum water holding capacity was determined separately for upland and depression soils. The targeted soil water content of 60% and 90% WHC was achieved at the start of the experiment by gently pipetting deionized water from the top. Water-filled pore space (WFPS) was equivalent to 32.7% and 49.0% for 60% and 90% WHC depression soil treatments, respectively, and 21.0% and 31.5% for 60% and 90% WHC upland soil treatments, respectively. Each of the PVC rings was then placed into 0.4 L Mason jars, which were covered with Parafilm, with small holes to allow for gas exchange. Soils were maintained at either 60% or 90% WHC by repeatedly weighing the individual jars throughout the course of the experiment and adding water from the top via pipetting when necessary. The incubation experiment began immediately after establishing the two water levels and was carried out in a temperature-controlled room at 20°C for 27 days.
2.3 Gas measurements and soil analysis
N2O production was measured by connecting each incubation jar to an LGR 914–0027 Isotopic N2O Analyzer (Los Gatos Research, Quebec, Canada, CA, USA) for 5 min. N2O concentrations were logged in parts per billion (ppb) every 10 s. Measurements from the first 210 s after closing the incubation jar were discarded, as this period was required to ensure adequate mixing between residual air and the N2O sample within the analyzer. N2O measurements were carried out on days 1, 3, 7, 10, 13, 19, and 27. Simultaneously, 15N2O concentrations were recorded by the analyzer.
On day 27, after the final N2O measurements, soils were sampled from the PVC rings. Soil mineral N (SMN: NO3− and NH4+) was extracted from fresh soil using a 1-M KCl solution (1:5, w:v). The extraction suspension was shaken for 1 h at room temperature, then centrifuged and filtered using 0.45 µm syringe filters (LLG Labware syringe filters, pore size: 0.45 µM). SMN concentrations were measured with a flow-injection analyzer (Tecator 5000 FIAStar, Höganäs, Sweden). Soil pH was measured using a pH meter in a water extract (1:5, w:v). Soil bioavailable Cu was extracted using a DTPA extraction solution (1:2, w:v), shaken for 2 h, filtered with 0.45 µm syringe filters, and then measured by ICP-MS (iCAP-Qc, Thermo Scientific, UAS, UK). Additional subsamples of the incubated soils (around 5 g) for DNA extraction were collected in zip-lock plastic bags and immediately frozen at − 20°C until analysis.
2.4 Molecular analyses
2.4.1 Soil DNA extractions
Only soil samples receiving either 0 or 260 mM Cu were further analyzed due to budget constraints. The total community DNA was extracted from soil using the NucleoSpin® Soil Kit (Machery-Nagel, Düren, Germany), following the manufacturer’s instructions. In brief, a 300-mg homogenized soil sample was added to a Bead Tube containing buffer and enhancer solution. Cell lysis was performed by bead-beating using a FastPrep FP120 device (Thermo Savant, USA, USA), for 30 s at 5 m s−1, followed by vortexing at maximum speed for 5 min. After precipitation, the binding buffer was added to the solution, followed by centrifugation. The silica membrane was then washed four times with a kit-derived solution. DNA was eluted to a final volume of 50 µL. The quality and quantity of the extracted DNA were checked and estimated using a Nanodrop ND-1000 spectrophotometer (Thermo Scientific, USA) and a Qubit 1.0 Fluorometer (Invitrogen, USA), respectively. DNA extracts were diluted to approximately 1 ng µL−1 before quantitative PCR (qPCR). The effect of the inhibitory compounds was assessed by testing the diluted samples. Based on the tested dilutions, no inhibitory effects were observed.
2.4.2 Quantification of 16S rRNA, amoA genes, and nosZ genes
Bacterial 16S rRNA, ammonia-oxidizing archaea (AOA amoA), ammonia-oxidizing bacteria (AOB amoA), and nosZ clade I and clade II genes were quantified using qPCR. Quantification of AOB and AOA was based on standard control solutions containing 103–107 copies µL−1 of amoA fragments amplified from the genomic DNA of Nitrosospira multiformis or Nitrososphaera viennensis EN76, respectively. Standard control solutions for nosZ clades I and II contained 104–108 copies µL−1 of nosZ fragments from Pseudomonas stutzeri and Dyanobacter fermentas genomic DNA, respectively. For 16S rRNA, standard solutions contained 101–108 copies µL−1 of 16S rRNA fragments from Escherichia coli genomic DNA. Amplifications were performed in different reaction volumes (Supplementary Table S1) using a BioRad CFX Connect system (BioRad, USA, CA, USA) with GoTaq DNA polymerase (Promega, UK, USA). For the primers and thermocycling conditions used, see Supplementary Tables S2, S3. The qPCR efficiency was 67% for bacterial 16S rRNA. For amoA genes, the qPCR efficiency was 70% for archaeal amoA and 75% for bacterial amoA. For nosZ clades I and II, the qPCR efficiencies were 76% and 62%, respectively. Melting curve analysis and gel electrophoresis were performed to verify the specificity of the qPCR products.
2.4.3 Sequencing and identification of nosZ genes
The nosZ clade I and II gene fragments, 267 and 300 base pairs (bp) in length (20, 32), respectively, were amplified using specific primers (Supplementary Table S3). A second, shorter amplification was then performed using primers that included TruSeq sequencing adaptors. Indexing was carried out at the Eurofins laboratory. Sequencing was performed on an Illumina MiSeq sequencer platform using 2 bp × 300 bp paired-end chemistry.
Each sample generated an average of 3 million raw paired-end reads. The quality of the raw reads was assessed using FastQC (33), and high-quality sequences (Q > 30) were selected using Trimmomatic (34). The high-quality forward and reverse reads were combined and used for further analysis. The nosZ clade I and clade II analysis was carried out using graftM (35), followed by the Gappa tool (36), and aligned against nosZ-specific databases (37).
2.5 Calculations and statistics
All calculations and statistical analyses were performed using R (38). The δ15N of the N2O for each measurement was calculated using the Keeling plot method (39), by applying a linear regression model to the reciprocal N2O concentration and δ15N values. The δ15N was derived from the intercept of 1/N2O = 0. Regression models with p-values > 0.05 and r2 > 0.20 were selected. Only 29% of all models met these criteria, among which only the depression soils under the 90% WHC treatment had sufficient data points for further comparison. N2O fluxes were calculated using the R package “gasflux” (40), employing a robust linear regression model. Briefly, the N2O molar fraction was converted to mass fraction according to ideal gas law. Cumulative N2O emissions were calculated by linear interpolation between measurement dates over the entire incubation period using the gasflux package.
Differences in soil properties of upland and depression soils (soil texture, pH, total C, and N) were compared using a t-test. Treatment effects on cumulative fluxes over 27 days were tested by fitting linear models for upland and depression soils separately using the R package “stats”. To account for variance heterogeneity, cumulative N2O emissions were log10-transformed. Post-hoc comparisons were performed using the R package “emmeans”. The effects of Cu and water content on functional gene abundance were analyzed using linear regression models. Functional gene abundances were log10-transformed to meet the normality assumption before analysis.
The community structure of nosZ clades I and II differed distinctly between upland and depression soils. Therefore, sequencing data were analyzed separately for depression and upland soils at the genus level. Statistical analyses were conducted using the “vegan” package (41) in R. Taxa with relative abundances smaller than 3% were grouped as “Other”. The effects of water level and Cu on nosZ community diversity were assessed using permutational analysis of variance (PERMANOVA) with the “adonis2” function in R, employing 9,000 permutations. Similarity percentages analysis (SIMPER) was performed to evaluate the dissimilarities between treatments in terms of nosZ gene community structure. Nonmetric multidimensional scaling analysis (NMDS) was conducted separately for depression and upland soils to describe the nosZ community structure. To assess the effects of environmental continuous factors (soil properties) and cumulative N2O flux on nosZ community structure, the “envfit” function was used, and results were plotted onto NMDS plots as vectors.
3 Results
3.1 Soil properties
Soil pH was significantly higher in depression soils than in upland soils before incubation, averaging 6.24 and 5.51, respectively (p < 0.001; Table 1). Soil total C and total N were also significantly higher in depression soils than in upland soils (total C: 3.18% and 1.04%, respectively; total N: 0.34% and 0.12%, respectively) (p < 0.001; Table 1). Depression soils had a C/N ratio of 9.4, while upland soils had a ratio of 8.7. Depression soils had a finer texture than upland soils, with 68% sand and 6.2% clay compared to 72% sand and 4.7% clay in upland soils. The initial bioavailable Cu content of depression soils was twofold higher than that of upland soils before the incubation (Table 1; p = 0.01). However, the soil bioavailable Cu content from each Cu treatment was comparable between the soils after incubation (Table 2). Bioavailable Cu increased significantly with increasing Cu addition (Table 2).
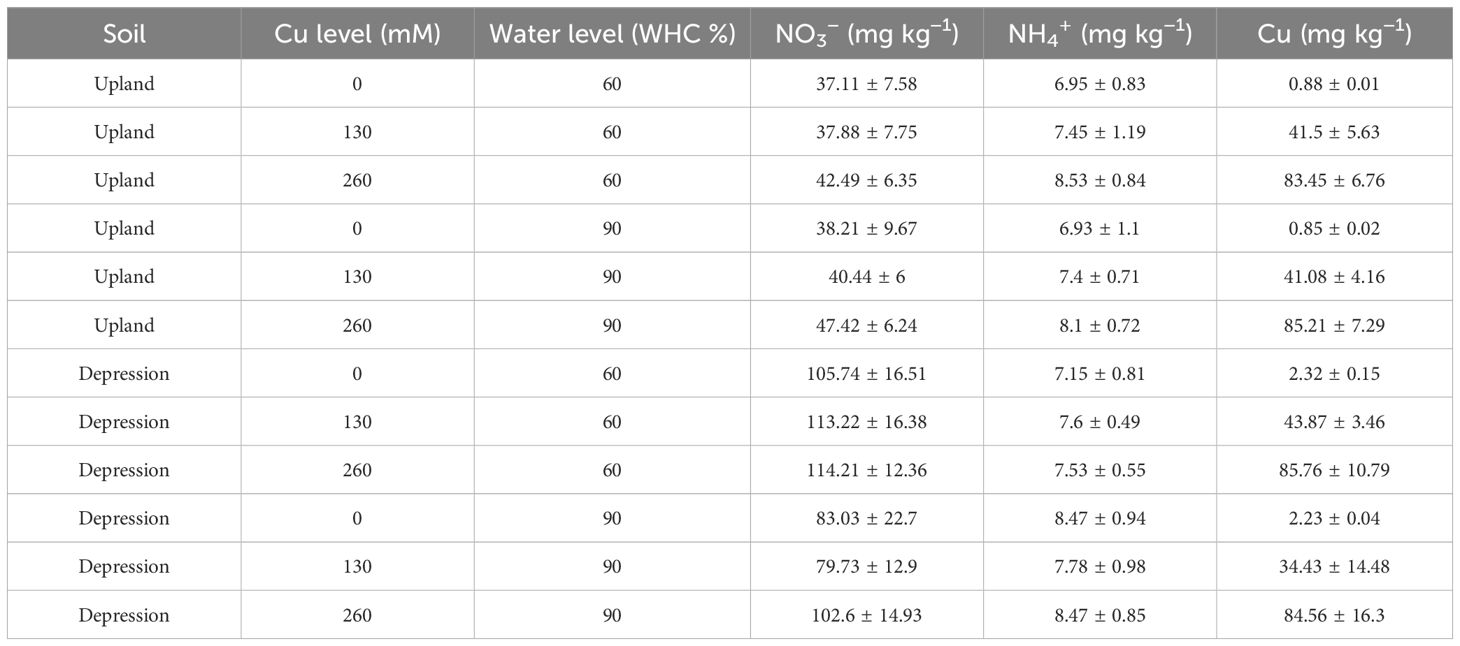
Table 2. Bioavailable Cu concentrations (mg kg−1) at the end of the experiment in upland and depression soils at 60% and 90% WHC (mean ± 1 standard deviation, n = 8).
SMN (NH4+ + NO3−) concentration differed significantly between depression and upland soils before incubation (p < 0.001; Table 1). Depression soils at 90% WHC had a significantly lower SMN content at the end of the incubation (p < 0.001), averaging 97 mg N kg−1 soil, compared to 60% WHC depression soils, which averaged 118 mg N kg−1 soil. For upland soils after incubation, SMN content did not differ significantly between water treatments (p = 0.66; Table 2). There was no significant difference in soil mineral nitrogen content after incubation with different Cu additions in either depression or upland soils. The NO3−/SMN ratio was 0.97 and 0.93 for depression and upland soils, respectively, at the beginning of the experiment. The decrease in NO3−/SMN ratio was significantly more pronounced (p < 0.001) in depression soils at 90% WHC compared to those at 60% WHC (Supplementary Figure S1). The decrease in the NO3−/SMN ratio was marginally lower in upland soils at 90% WHC compared to 60% WHC (Supplementary Figure S1). The increase in the NO3−/SMN ratio was greater in depression soils with 260 mM Cu compared to 0 mM (p = 0.14). However, the NO3−/SMN ratio of upland soils was not affected by Cu addition (p = 0.69).
3.2 Effect of soil moisture and Cu on N2O flux
For the incubated depression soils, high N2O production was measured on day 1, immediately after the start of the experiment (Figure 1A). The N2O flux rate in depression soils was significantly higher at 90% compared to 60% WHC during the first 7 days of incubation (p < 0.001). However, after 3 days, the N2O flux from depression soils at 90% WHC decreased rapidly. In contrast, for depression soils at 60% WHC, after the initial peak in N2O flux on day 1 (ranging from 6.3 to 12.6 µg N2O-N kg−1 soil h−1 across the three Cu levels), the N2O production rate was low and continued to decline for the rest of the incubation period. Surprisingly, the lowest cumulative N2O flux (80.6 µg N2O-N kg−1 soil) was observed in depression soils at 60% WHC. Increased soil moisture in depression soils at 90% WHC resulted in significantly higher cumulative N2O emissions compared to those at 60% WHC (p < 0.001, Figure 1C), ranging from 80.6 to 187.6 µg N2O-N kg−1 soil at 60% WHC and from 2,947.3 to 3,507.6 µg N2O-N kg−1 soil at 90% WHC. The addition of copper to depression soils at 90% WHC delayed and amplified the maximum N2O fluxes, shifting from days 1 to 3 (Figure 1A). In contrast, the addition of copper had no effects on the N2O flux rates of depression soils at 60% WHC or on the cumulative N2O emissions at either soil moisture level. The addition of 260 mM Cu tended to decrease the cumulative N2O flux from depression soils at 60% WHC (p = 0.19) compared to the same soil under the same WHC (Figure 1C).
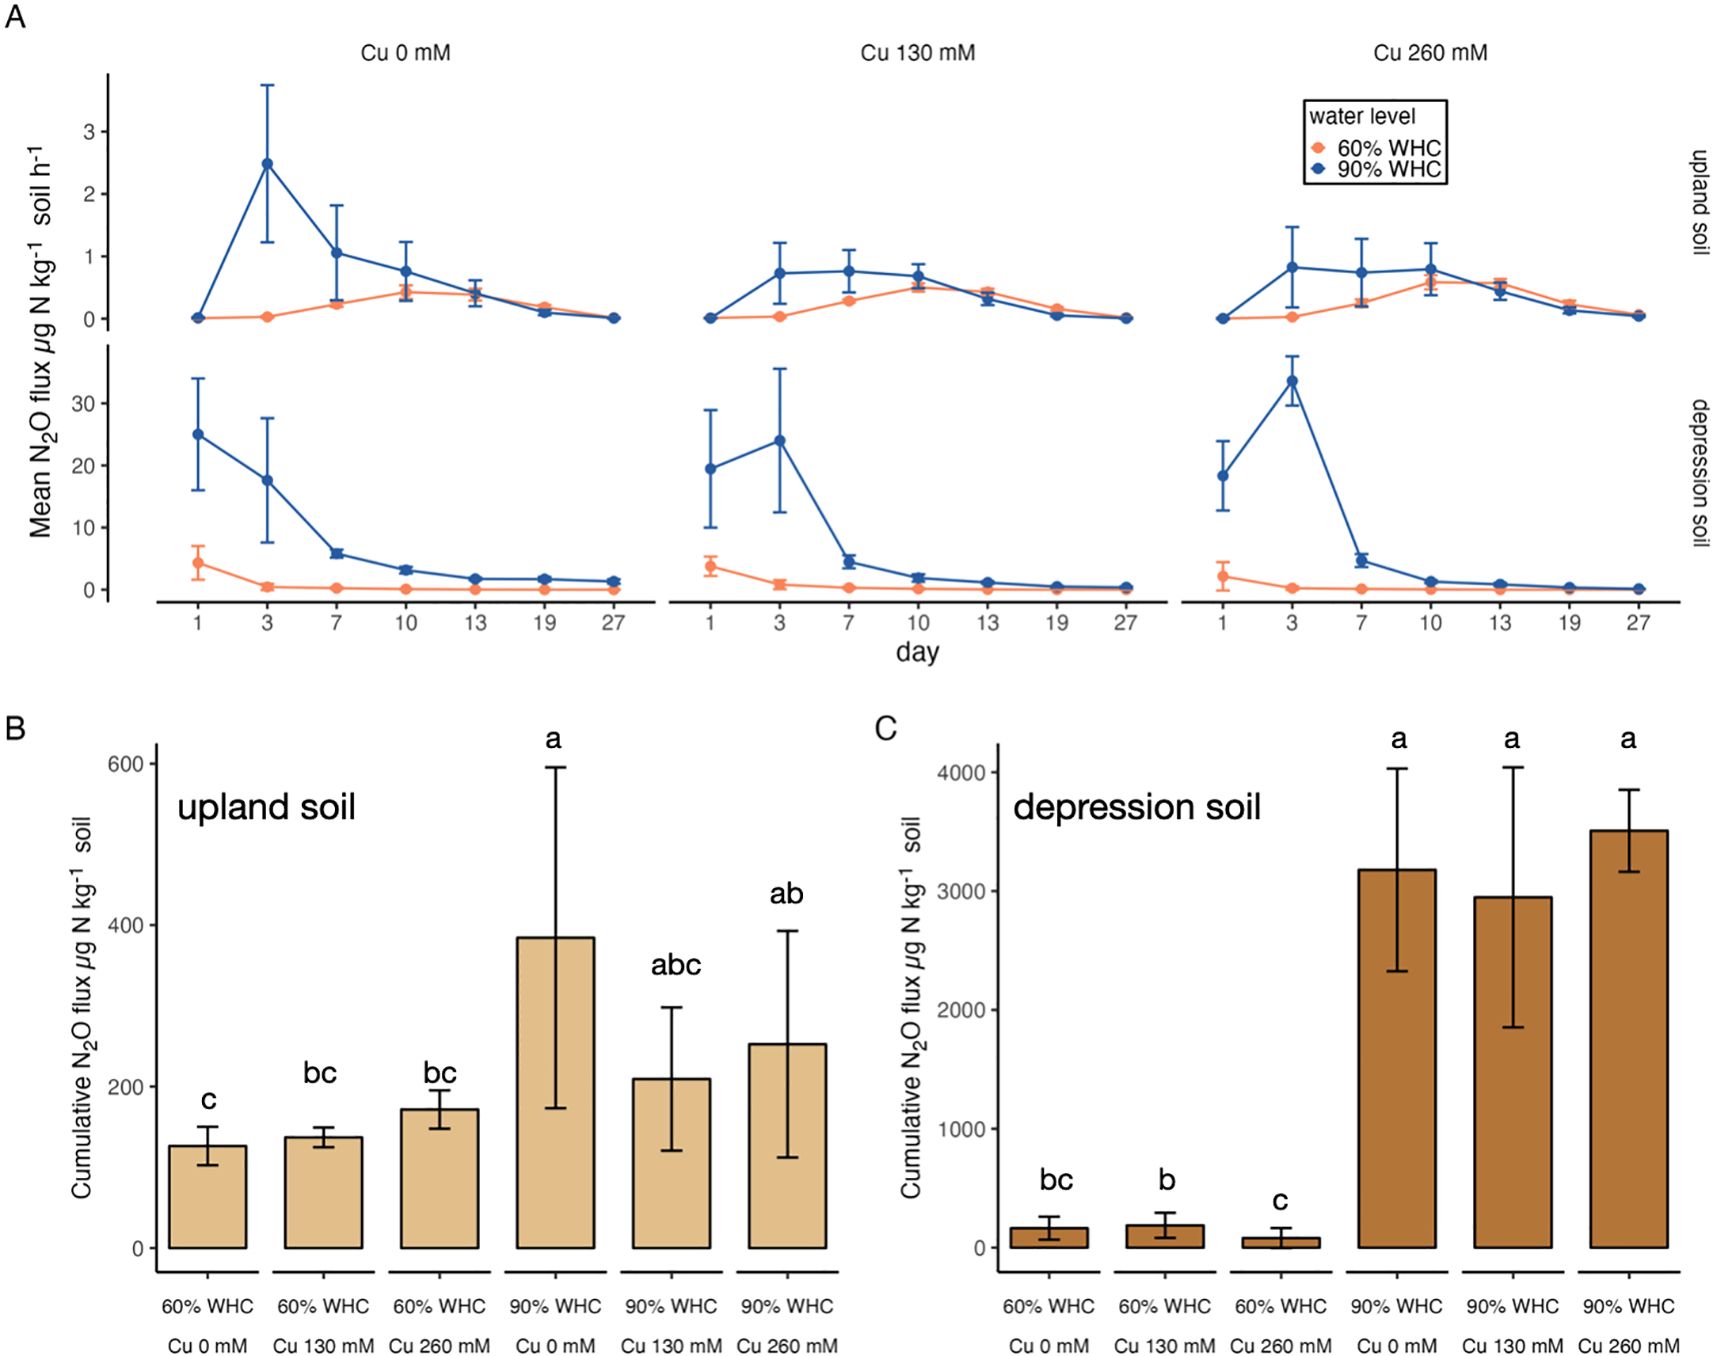
Figure 1. (A) N2O flux over the 27-day incubation period from upland and depression soils at 60% WHC and 90% WHC, with three levels of Cu addition (µg N2O-N kg−1 soil h−1). Note the different y-axis scales. (B) Cumulative N2O flux for the 27-day incubation period for upland soils, and (C) depression soils, under different WHC conditions and Cu additions (µg N2O-N kg−1 soil). Lowercase letters indicate significant differences across treatments (mean ± 1 standard deviation, n = 8).
In contrast to the depression soils, no N2O emissions were observed from upland soils on day 1 regardless of the soil water level (Figure 1A). Water level also played an important role in regulating cumulative N2O fluxes in upland soils (p < 0.001, Figure 1B). Emissions from incubated upland soils at 90% WHC peaked on day 3 (ranging from 0.76 to 2.5 µg N2O-N kg−1 soil h−1 across the three Cu levels), whereas emissions from upland soils at 60% WHC peaked on day 10 (ranging from 0.43 to 0.58 µg N2O-N kg−1 soil h−1). Unlike depression soils, upland soils at both water levels showed a gradual decrease in N2O production rate following the peak on either day 3 or 10, continuing until the end of the incubation. Cu effects on upland soils varied between the water treatments. In contrast to depression soils, both 130 and 260 mM Cu additions significantly reduced the maximum N2O flux rate from upland soils at 90% WHC on day 3 and tended to decrease the cumulative N2O flux (p < 0.34). However, the 130- and 260-mM Cu upland treatments slightly stimulated the maximum N2O flux rate at 60% WHC on day 10, and 260 mM Cu addition significantly increased cumulative N2O flux (p < 0.05).
Soil type significantly influenced the cumulative N2O flux in this study (p < 0.001, Figures 1B, C). Depression soils at 90% WHC exhibited significantly higher fluxes (more than 3,000 µg N2O-N kg−1 soil) compared to all other treatments. Additionally, N2O fluxes from depression soils at 90% WHC were at least 10 times higher than those from the upland soils at 90% WHC during the first 7 days of incubation (Figure 1A).
Due to low N2O fluxes from upland soils, both at 60% and 90% WHC, and depression soils at 60% WHC, δ15N derived from these fluxes could not be obtained. Therefore, only the 15N2O results from depression soils at 90% WHC are presented in Supplementary Table S4. No significant difference was observed in the cumulative 15N2O flux for different 15N-labeled treatments. However, soils receiving only 15NO3 emitted a higher amount of 15N2O overall. There was no significant difference in cumulative 15N2O emissions between Cu treatments.
3.3 Soil microbial community
3.3.1 Gene abundance
Overall, bacterial 16S rRNA abundance was over 3,000 times higher in depression soils than in upland soils (Figure 2A, p< 0.01). Both Cu and water treatments had significant effects on bacterial 16S rRNA gene abundance (p < 0.01 and p < 0.05, respectively). In both upland and depression soils, increased water content and Cu addition reduced bacterial 16S gene abundance. These effects were more pronounced in upland soil than in depression soils (Figure 2A). The largest difference was observed between upland soils at 60% WHC without Cu and those at 90% WHC with 260 mM Cu, with the latter showing a 12-fold higher bacterial 16S rRNA gene abundance (p = 0.11).
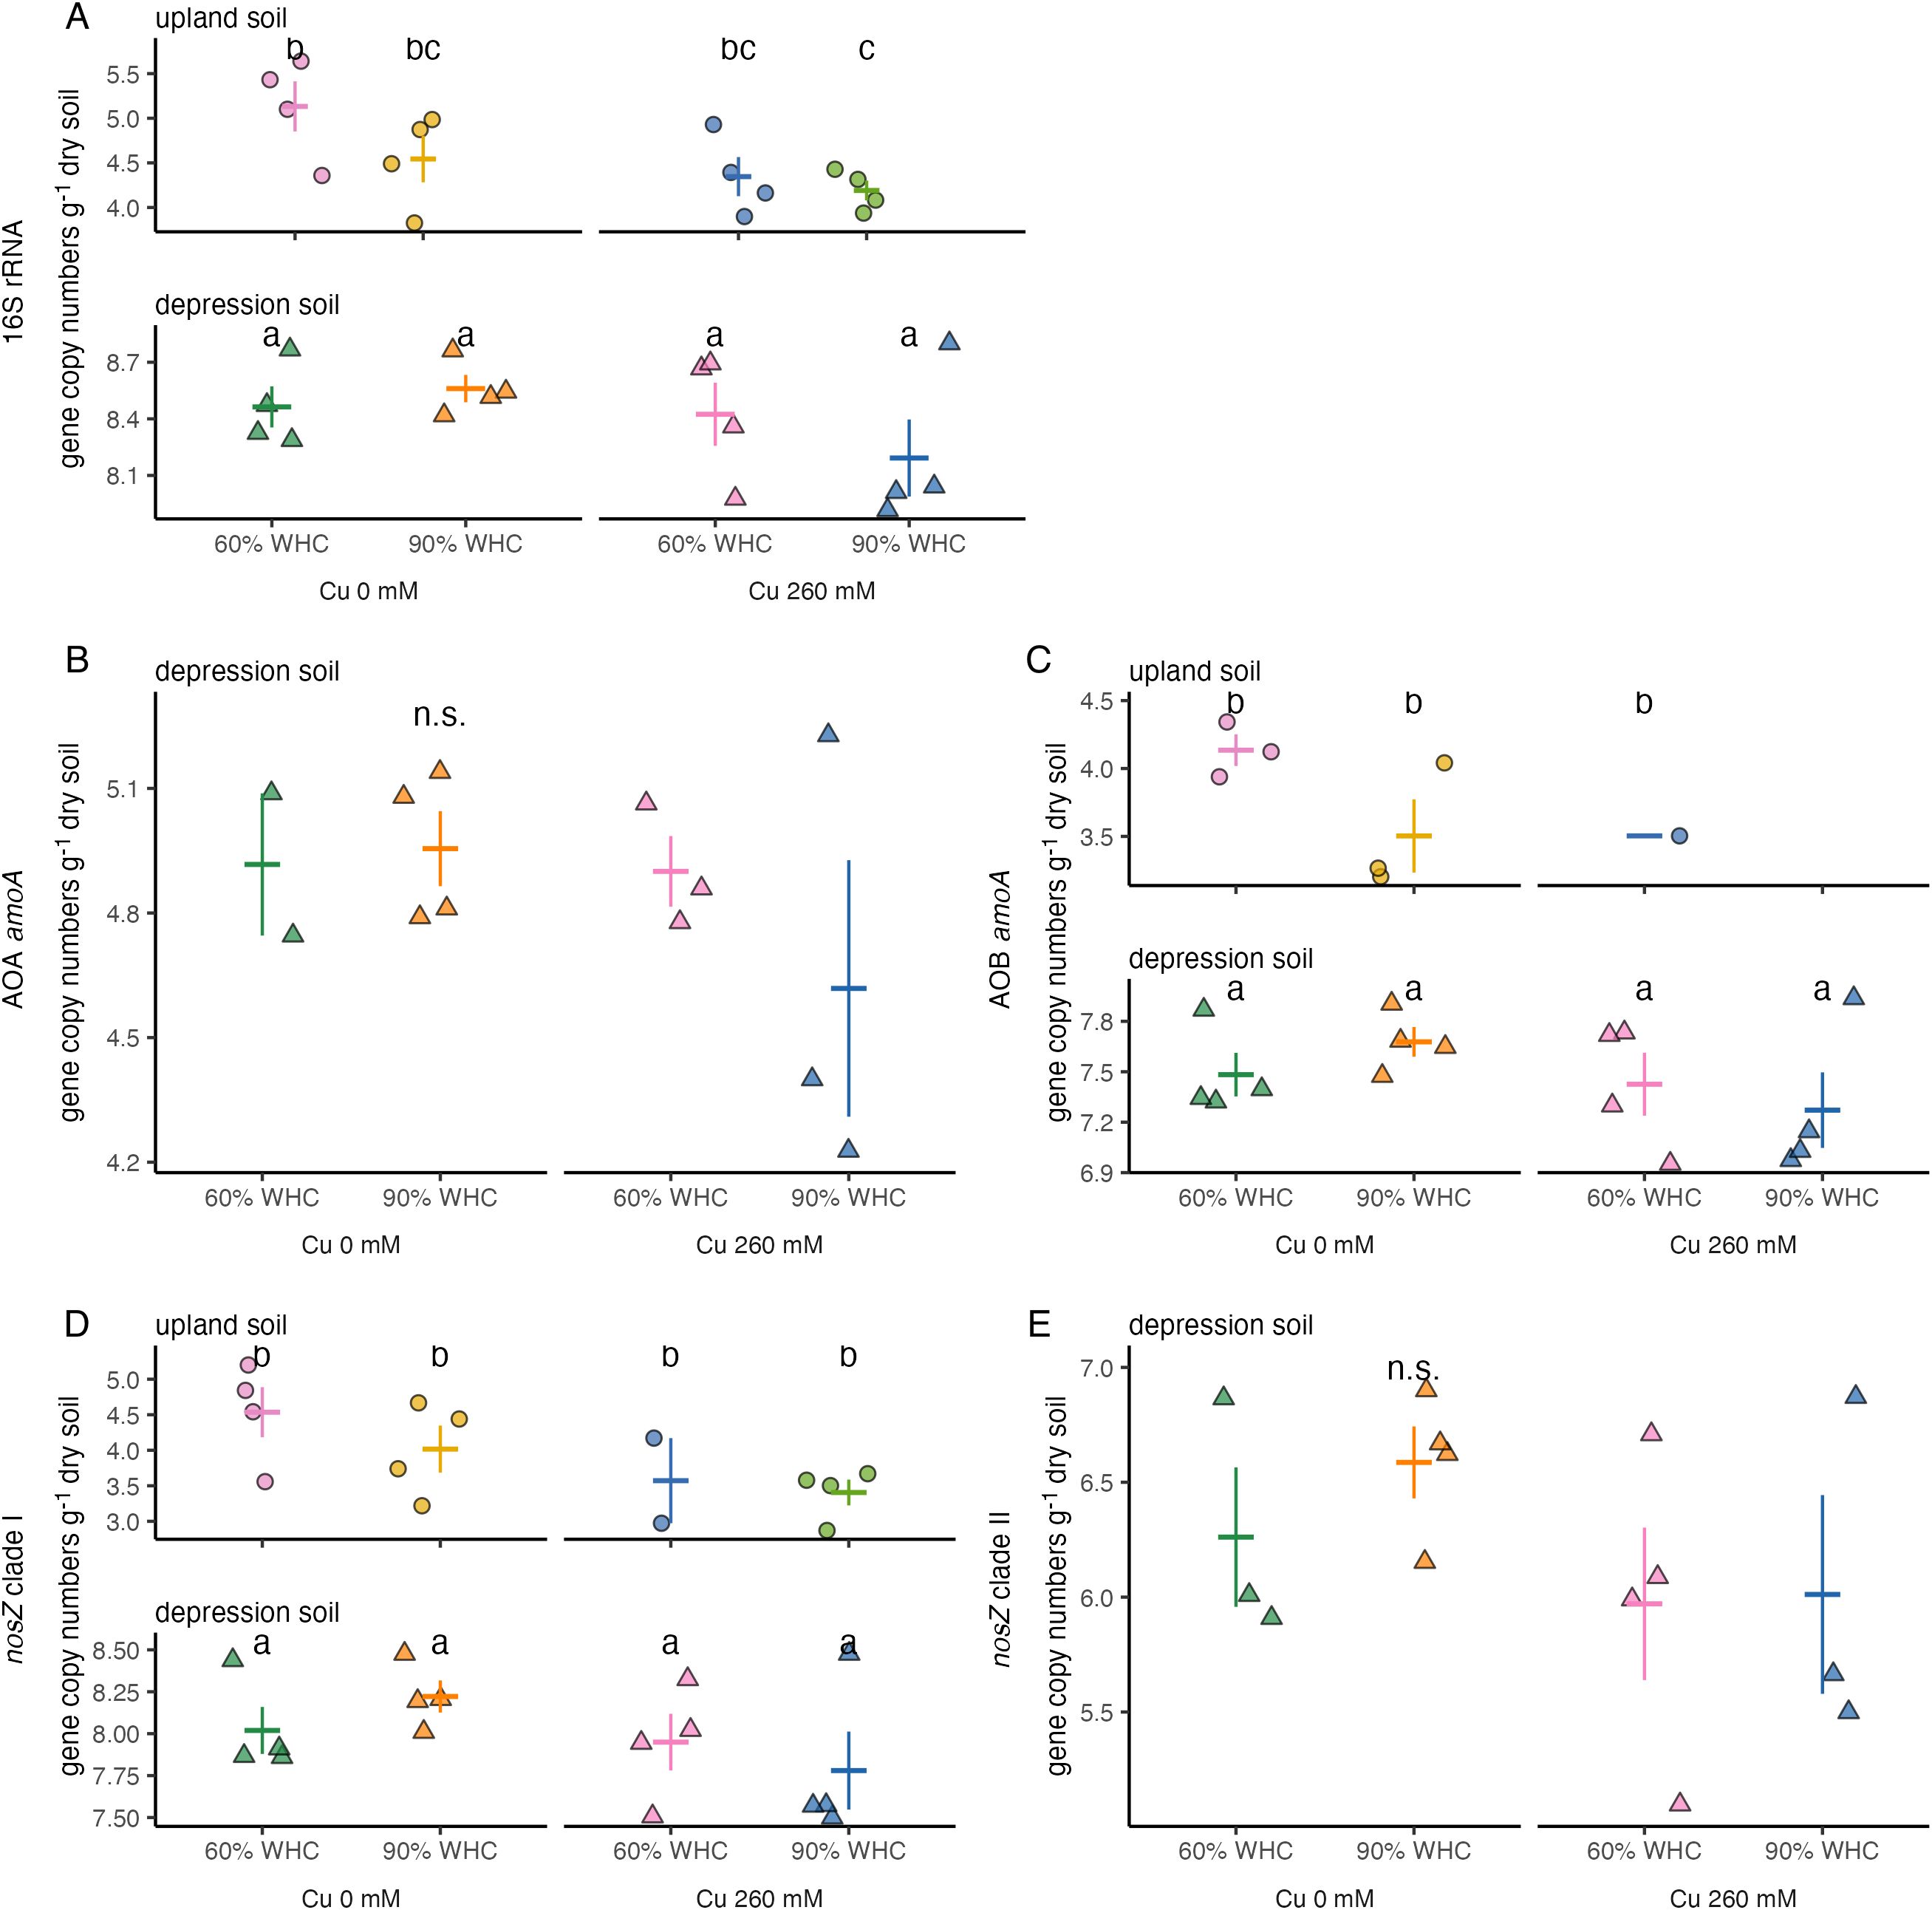
Figure 2. Abundance of (A) bacterial 16S rRNA, (B) archaeal amoA genes, (C) bacterial amoA genes, (D) nosZ clade I genes, and (E) nosZ clade II genes in upland soils (circles) and depression soils (triangles) at 60% and 90% WHC, with no Cu and 260 mM Cu addition. Each symbol represents an individual sample. Lowercase letters indicate significant differences within each gene. A cross indicates the mean ± 1 standard deviation. ns, non significant.
In depression soils, AOA amoA abundance was slightly suppressed by 90% WHC and Cu addition (Figure 2B). No AOA amoA was detected in upland soils. The abundance of AOB amoA in depression soils was 4,000 times higher than in upland soils (Figure 2C). Neither water level nor Cu content affected AOB amoA abundance in depression soils. However, both copper content and water treatment tended to influence AOB amoA abundance in upland soils, similar to their effects on bacterial 16S rRNA abundance. AOB amoA was detected in only one replicate of upland soils at 60% WHC with 260 mM Cu.
The abundance of nosZ clade I genes was over 4,000 times higher in depression soils than in upland soils (Figure 2D). In depression soil, nosZ clade I abundance was slightly higher under 90% WHC compared to 60% WHC (Figure 2D). The addition of Cu reduced nosZ clade I gene abundance by 1.4-fold in depression soils. In upland soils, nosZ clade I gene abundance was inhibited by both Cu addition and the 90% WHC treatment. Specifically, Cu addition resulted in a 10-fold decrease, and 90% WHC caused a threefold decrease in nosZ clade I gene abundance in upland soils. No nosZ clade II genes were detected in upland soils (Figure 2E). In depression soils, the abundance of nosZ clade II genes did not differ significantly among treatments (Figure 2E).
In general, the ratios of AOA, AOB, and nosZ clades I and II to bacterial 16S rRNA decreased with the addition of 260 mM Cu and increased under the 90% WHC treatment in depression soils (Supplementary Figure S2). In upland soils, the ratios of AOB and nosZ clade I to bacterial 16S rRNA exhibited a similar pattern to that observed in depression soils, although the decrease in nosZ clade I was more pronounced (Supplementary Figure S2).
3.3.2 Sequencing of nosZ genes
After quality filtering the sequence data, there were 59,677 to 109,817 reads and 54,960 to 94,012 reads of nosZ clade I for depression and upland soil samples, respectively, and 50,398 to 91,287 reads of nosZ clade II for depression soil samples. The sequencing results showed that the nosZ clade I community from both depression and upland soils was dominated by Bradyrhizobium and Afipia (Figure 3), while the nosZ clade II community from depression soils was dominated by Cytophagaceae bacterium (50.6%) and Flavisolibacter (17.6%) (Supplementary Figure S3). For depression soils, the nosZ clade I community was significantly affected by Cu addition (PERMANOVA p = 0.02; Supplementary Table S5), while for upland soils, the nosZ clade I community was significantly influenced by water level (PERMANOVA p = 0.02; Supplementary Table S5). Water treatment on depression soils tended to impact the community structure of nosZ clade II (PERMANOVA p = 0.06; Supplementary Table S5). However, no interaction was found between Cu and water level for the nosZ community in either depression soils or upland soils.
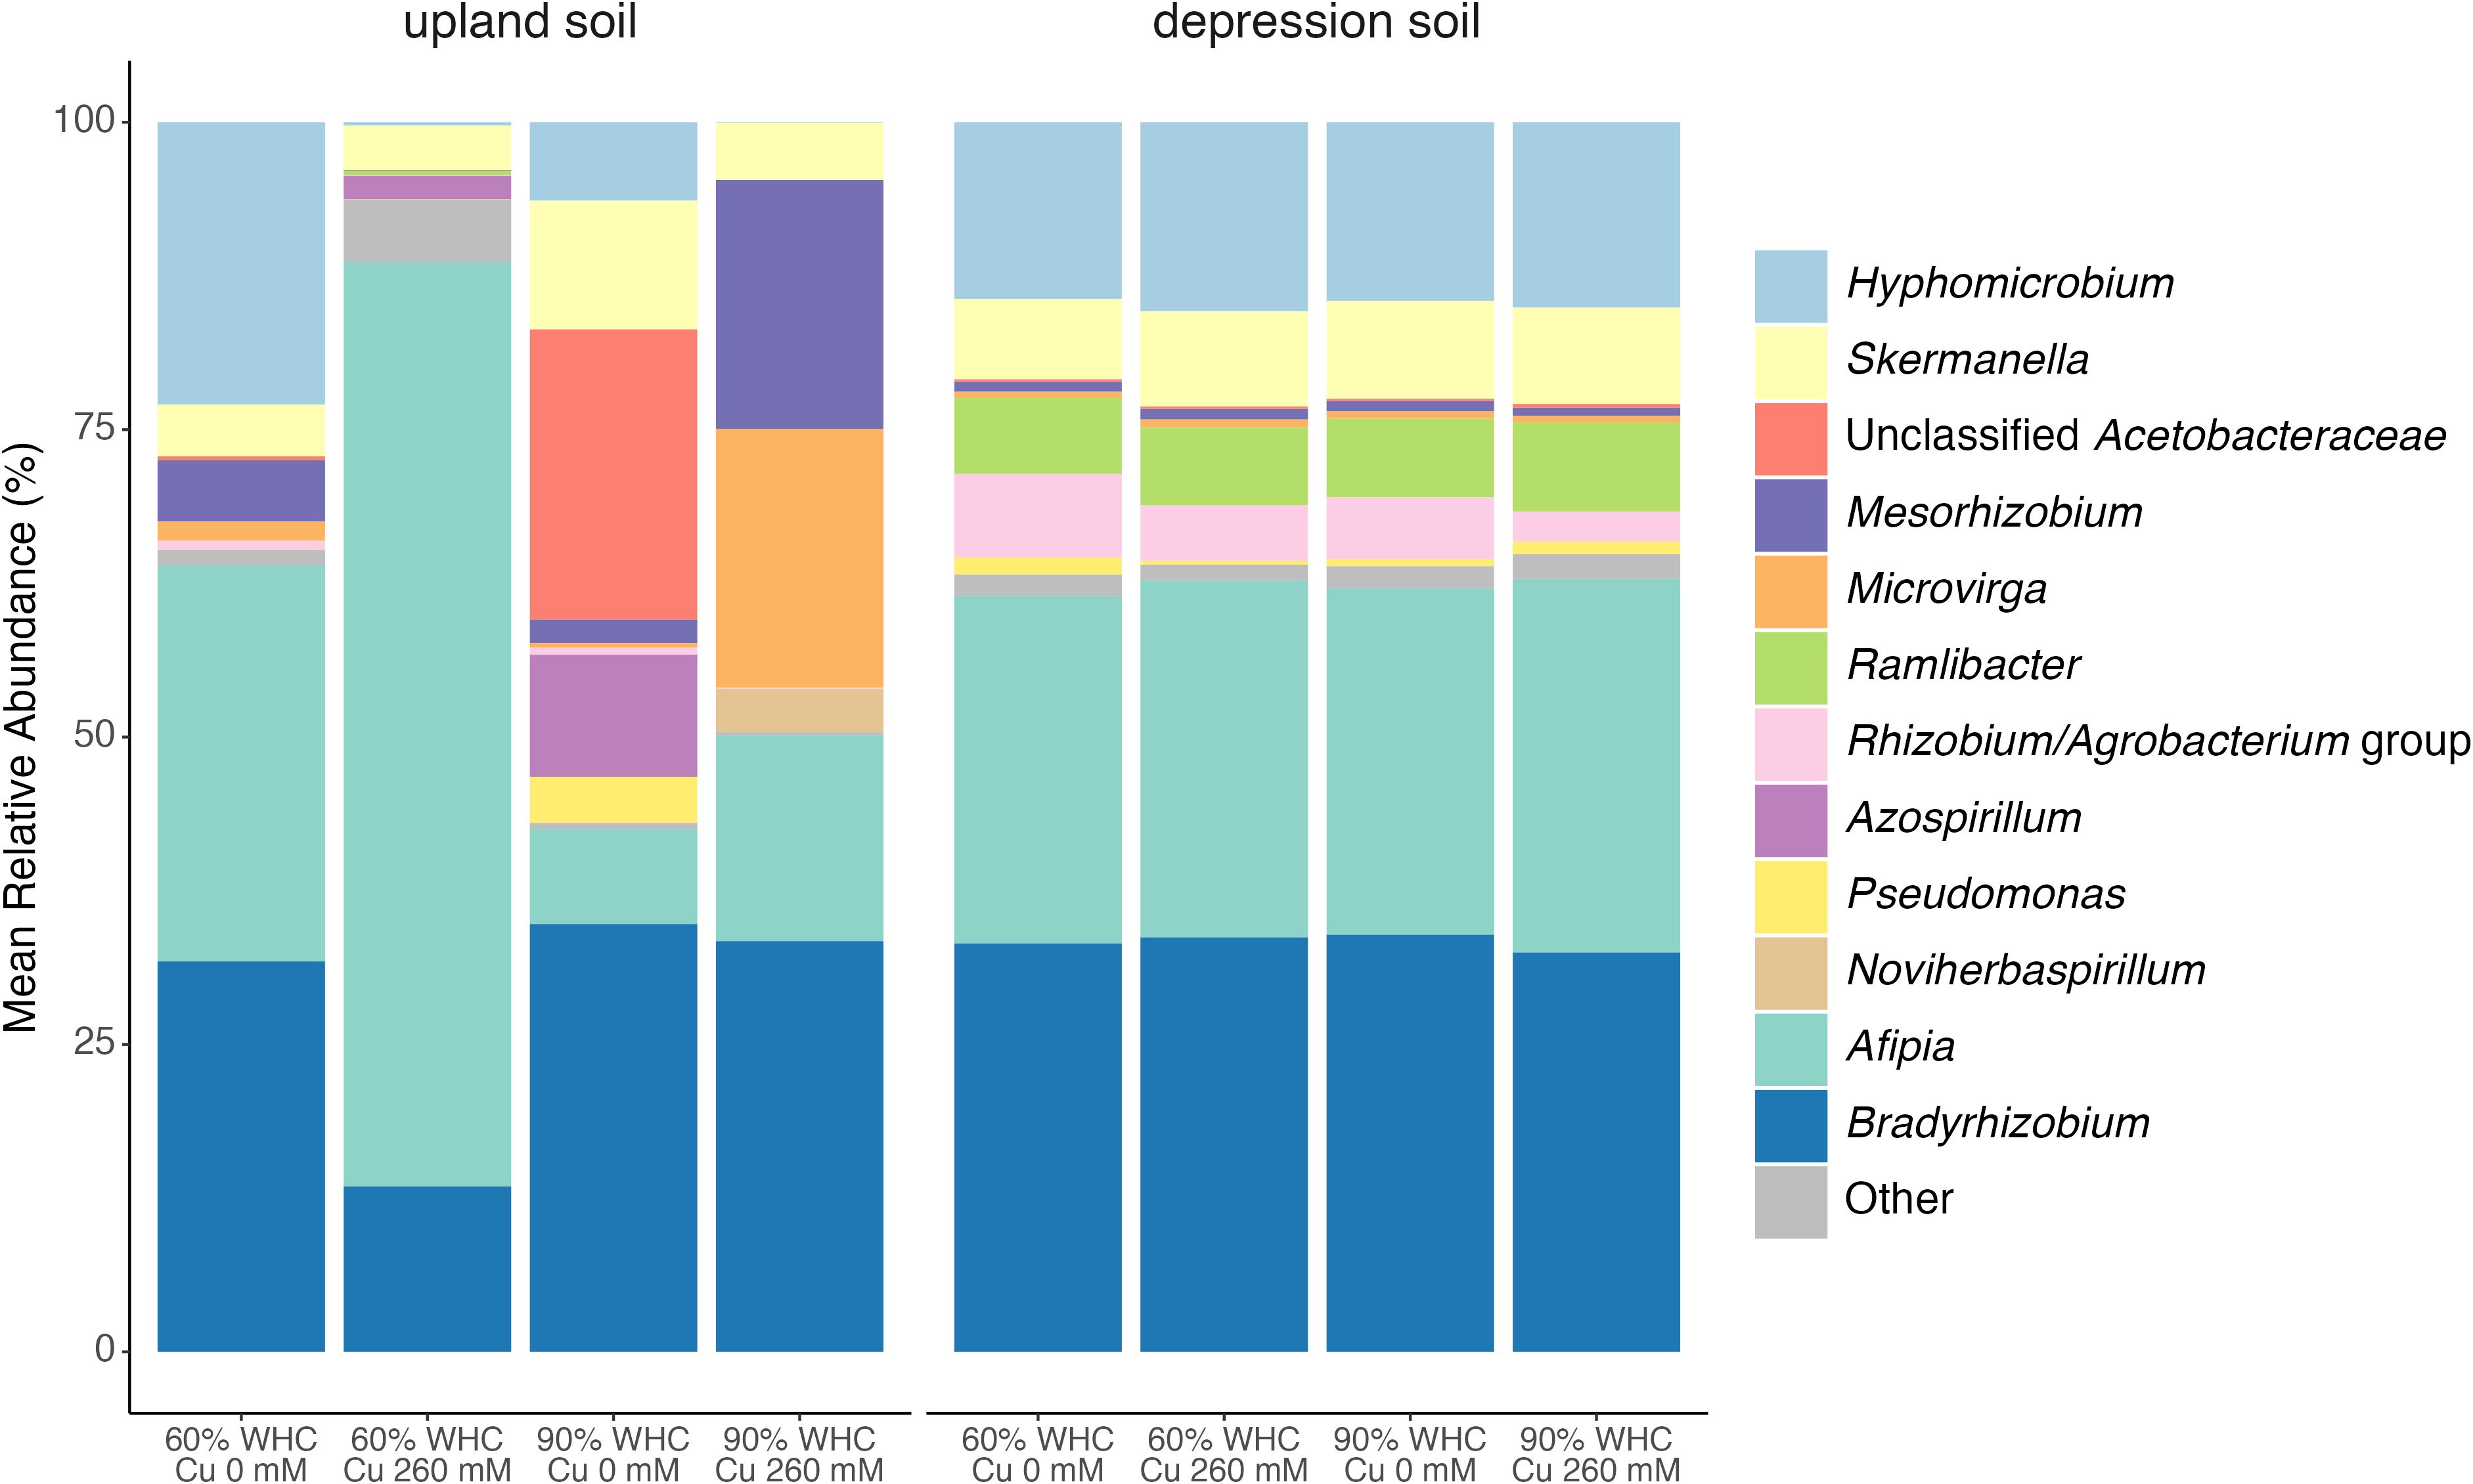
Figure 3. Average relative abundance of nosZ clade I sequences affiliated with taxonomic groups at the genus level in upland and depression soils at 60% and 90% WHC, with no Cu and 260 mM Cu addition. Taxonomic groups with < 3% relative abundance were grouped into “Other”. n = 4.
SIMPER showed that the 90% WHC treatment in upland soils significantly decreased the relative abundance of Afipia (p = 0.006; Supplementary Table S6, Figure 3) and Hyphomicrobium (p = 0.50; Supplementary Table S6, Figure 3). In contrast, the 90% WHC treatment only marginally altered the nosZ clade I community structure in depression soils (Supplementary Table S7, Figure 3). Cu addition significantly decreased the relative abundance of the Rhizobium/Agrobacterium group in the nosZ clade I communities from both depression and upland soils (p = 0.012 and 0.033, respectively; Supplementary Tables S8, S9, Figure 3). The relative abundance of Afipia in depression soils with 260 mM Cu was significantly reduced (p = 0.028; Supplementary Table S8, Figure 3), whereas in upland soils, the decrease was not significant (p = 0.12; Supplementary Table S9, Figure 3). For the nosZ clade II community structure in depression soils, the 90% WHC treatment significantly increased Chitinophaga (p = 0.023; Supplementary Table S10, Supplementary Figure S3) but significantly decreased Flavisolibacter and Pedobacter (p = 0.035 and p = 0.015, respectively; Supplementary Table S10, Supplementary Figure S3). These findings are linked to the significant effect observed in the envfit test of the clade II community on N2O flux in depression soils (Table 3). However, Cu did not alter the composition of the nosZ clade II community structure in depression soils (Supplementary Table S11, Supplementary Figure S3).
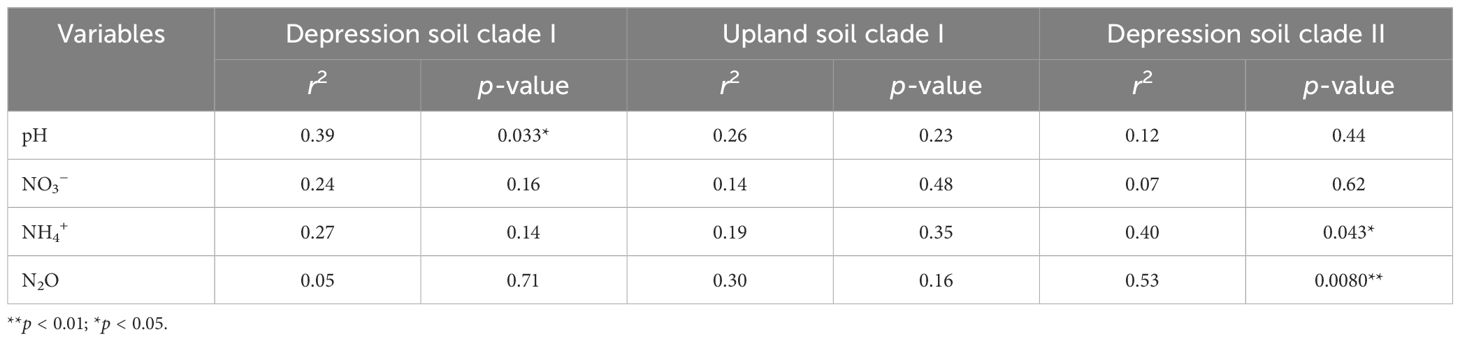
Table 3. Correlation of environmental variables and N2O flux with NMDS ordination of nosZ clade I and II communities, with significance based on the envfit test (permutation = 999).
Environmental factors explaining the variance in the nosZ gene community structure are presented in Table 3. Soil pH was significantly correlated with the nosZ clade I community structure in depression soils (p = 0.033; Table 3; Figure 4). No significant correlation was found between the environmental factors and the nosZ clade I community structure in upland soils (Figure 5). However, patterns in community composition are visible, such as the negative correlation between N2O flux and the Afipia genus (Supplementary Table S6) and the higher abundance of Hyphomicrobium and Rhizobium/Agrobacterium genus under lower Cu concentrations (Figure 5; Supplementary Table S9). Soil NH4+ (p = 0.043; Table 3; Figure 6) and soil N2O flux (p = 0.0080; Table 3; Figure 6) were significantly associated with the nosZ clade II community structure in depression soils.
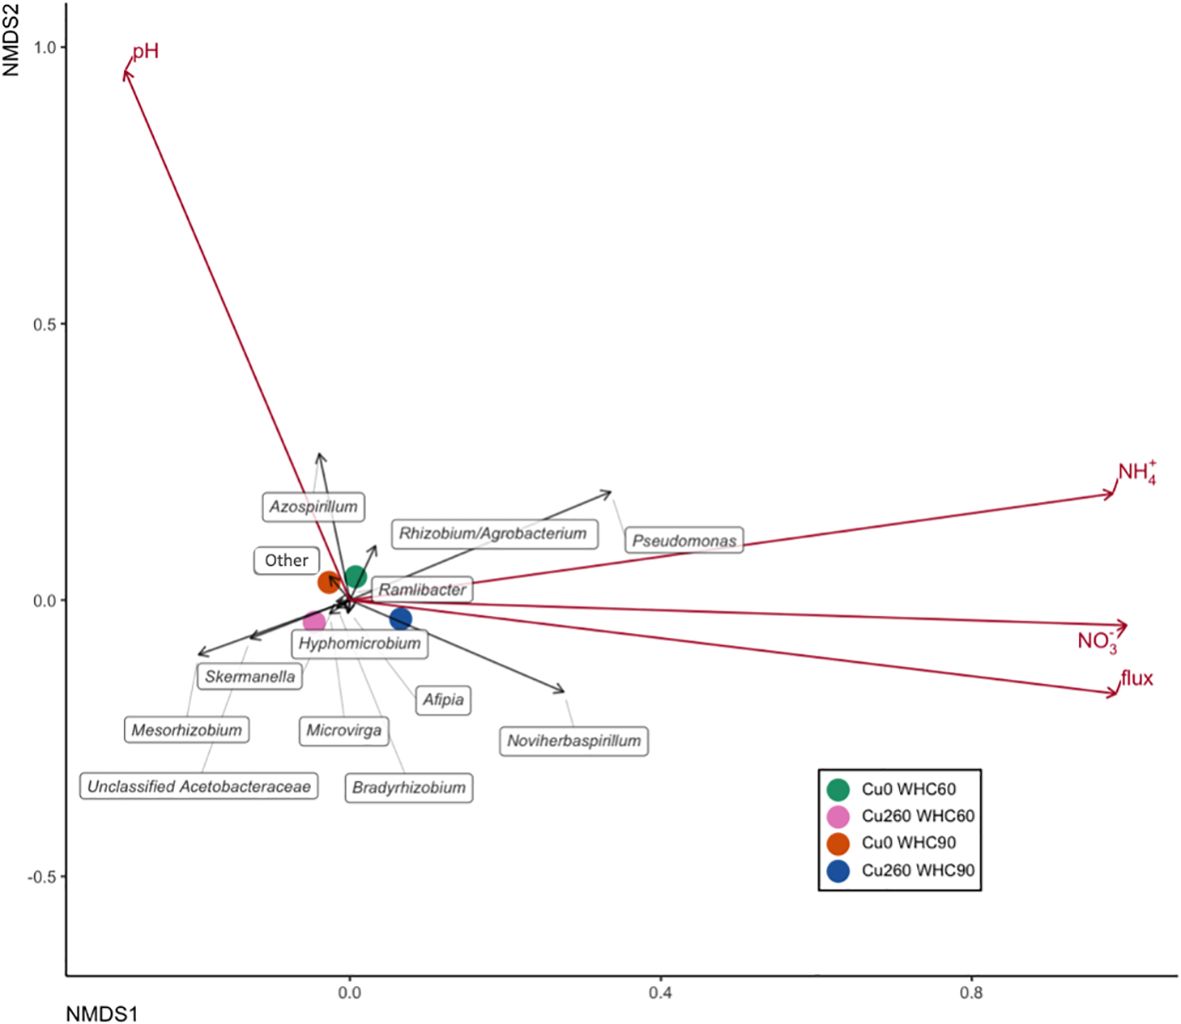
Figure 4. Nonmetric multidimensional scaling (NMDS) based on relative abundance illustrating nosZ clade I community structure across treatments in depression soils. Treatment centroids are shown as four colored dots. Taxa are represented by black arrows. Environmental variables and cumulative N2O emissions were overlaid onto the two-dimensional Bray–Curtis distance ordination using the envfit function and are shown as red arrows. Arrow directions indicate an increasing correlation of taxa with the respective variables.
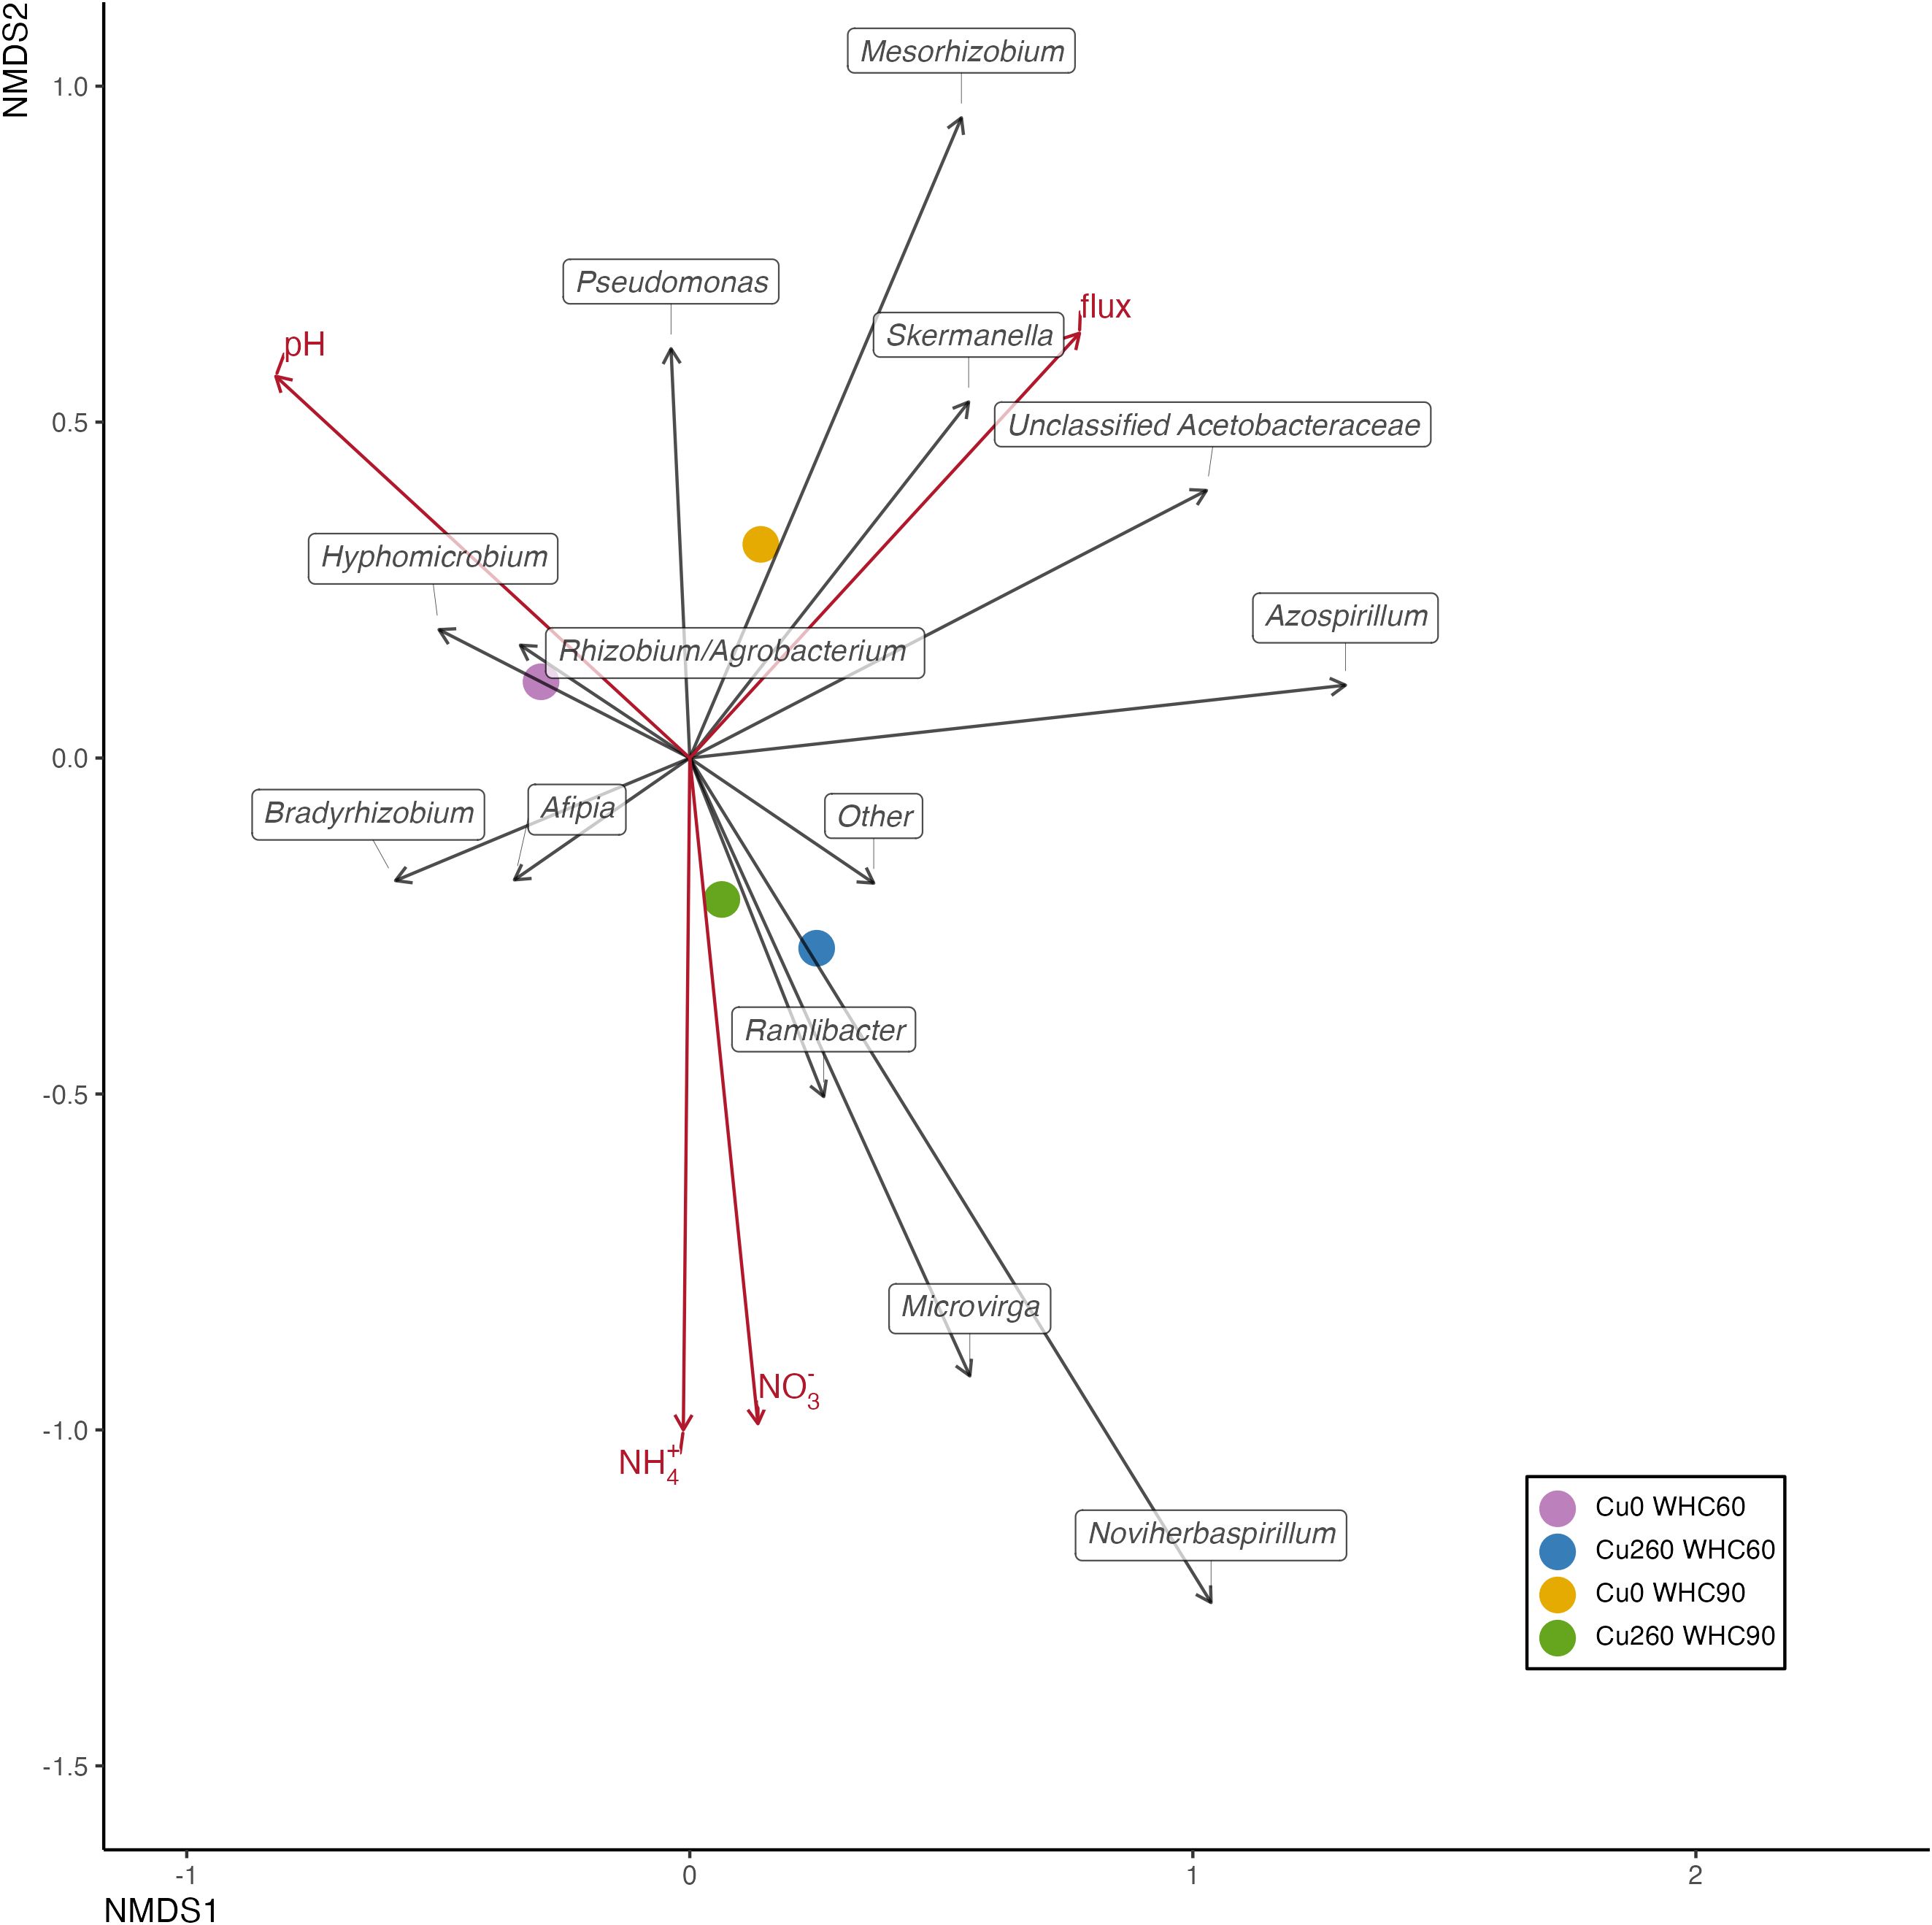
Figure 5. Nonmetric multidimensional scaling (NMDS) based on relative abundance depicting nosZ clade I community structure across treatments in upland soils. Treatment centroids are shown as four colored dots. Taxa are shown as black arrows. Environmental variables and cumulative N2O emissions were added onto the two-dimensional Bray–Curtis distance ordination using the envfit function and are shown as red arrows. Arrow directions indicate an increasing correlation of taxa with the corresponding variable.
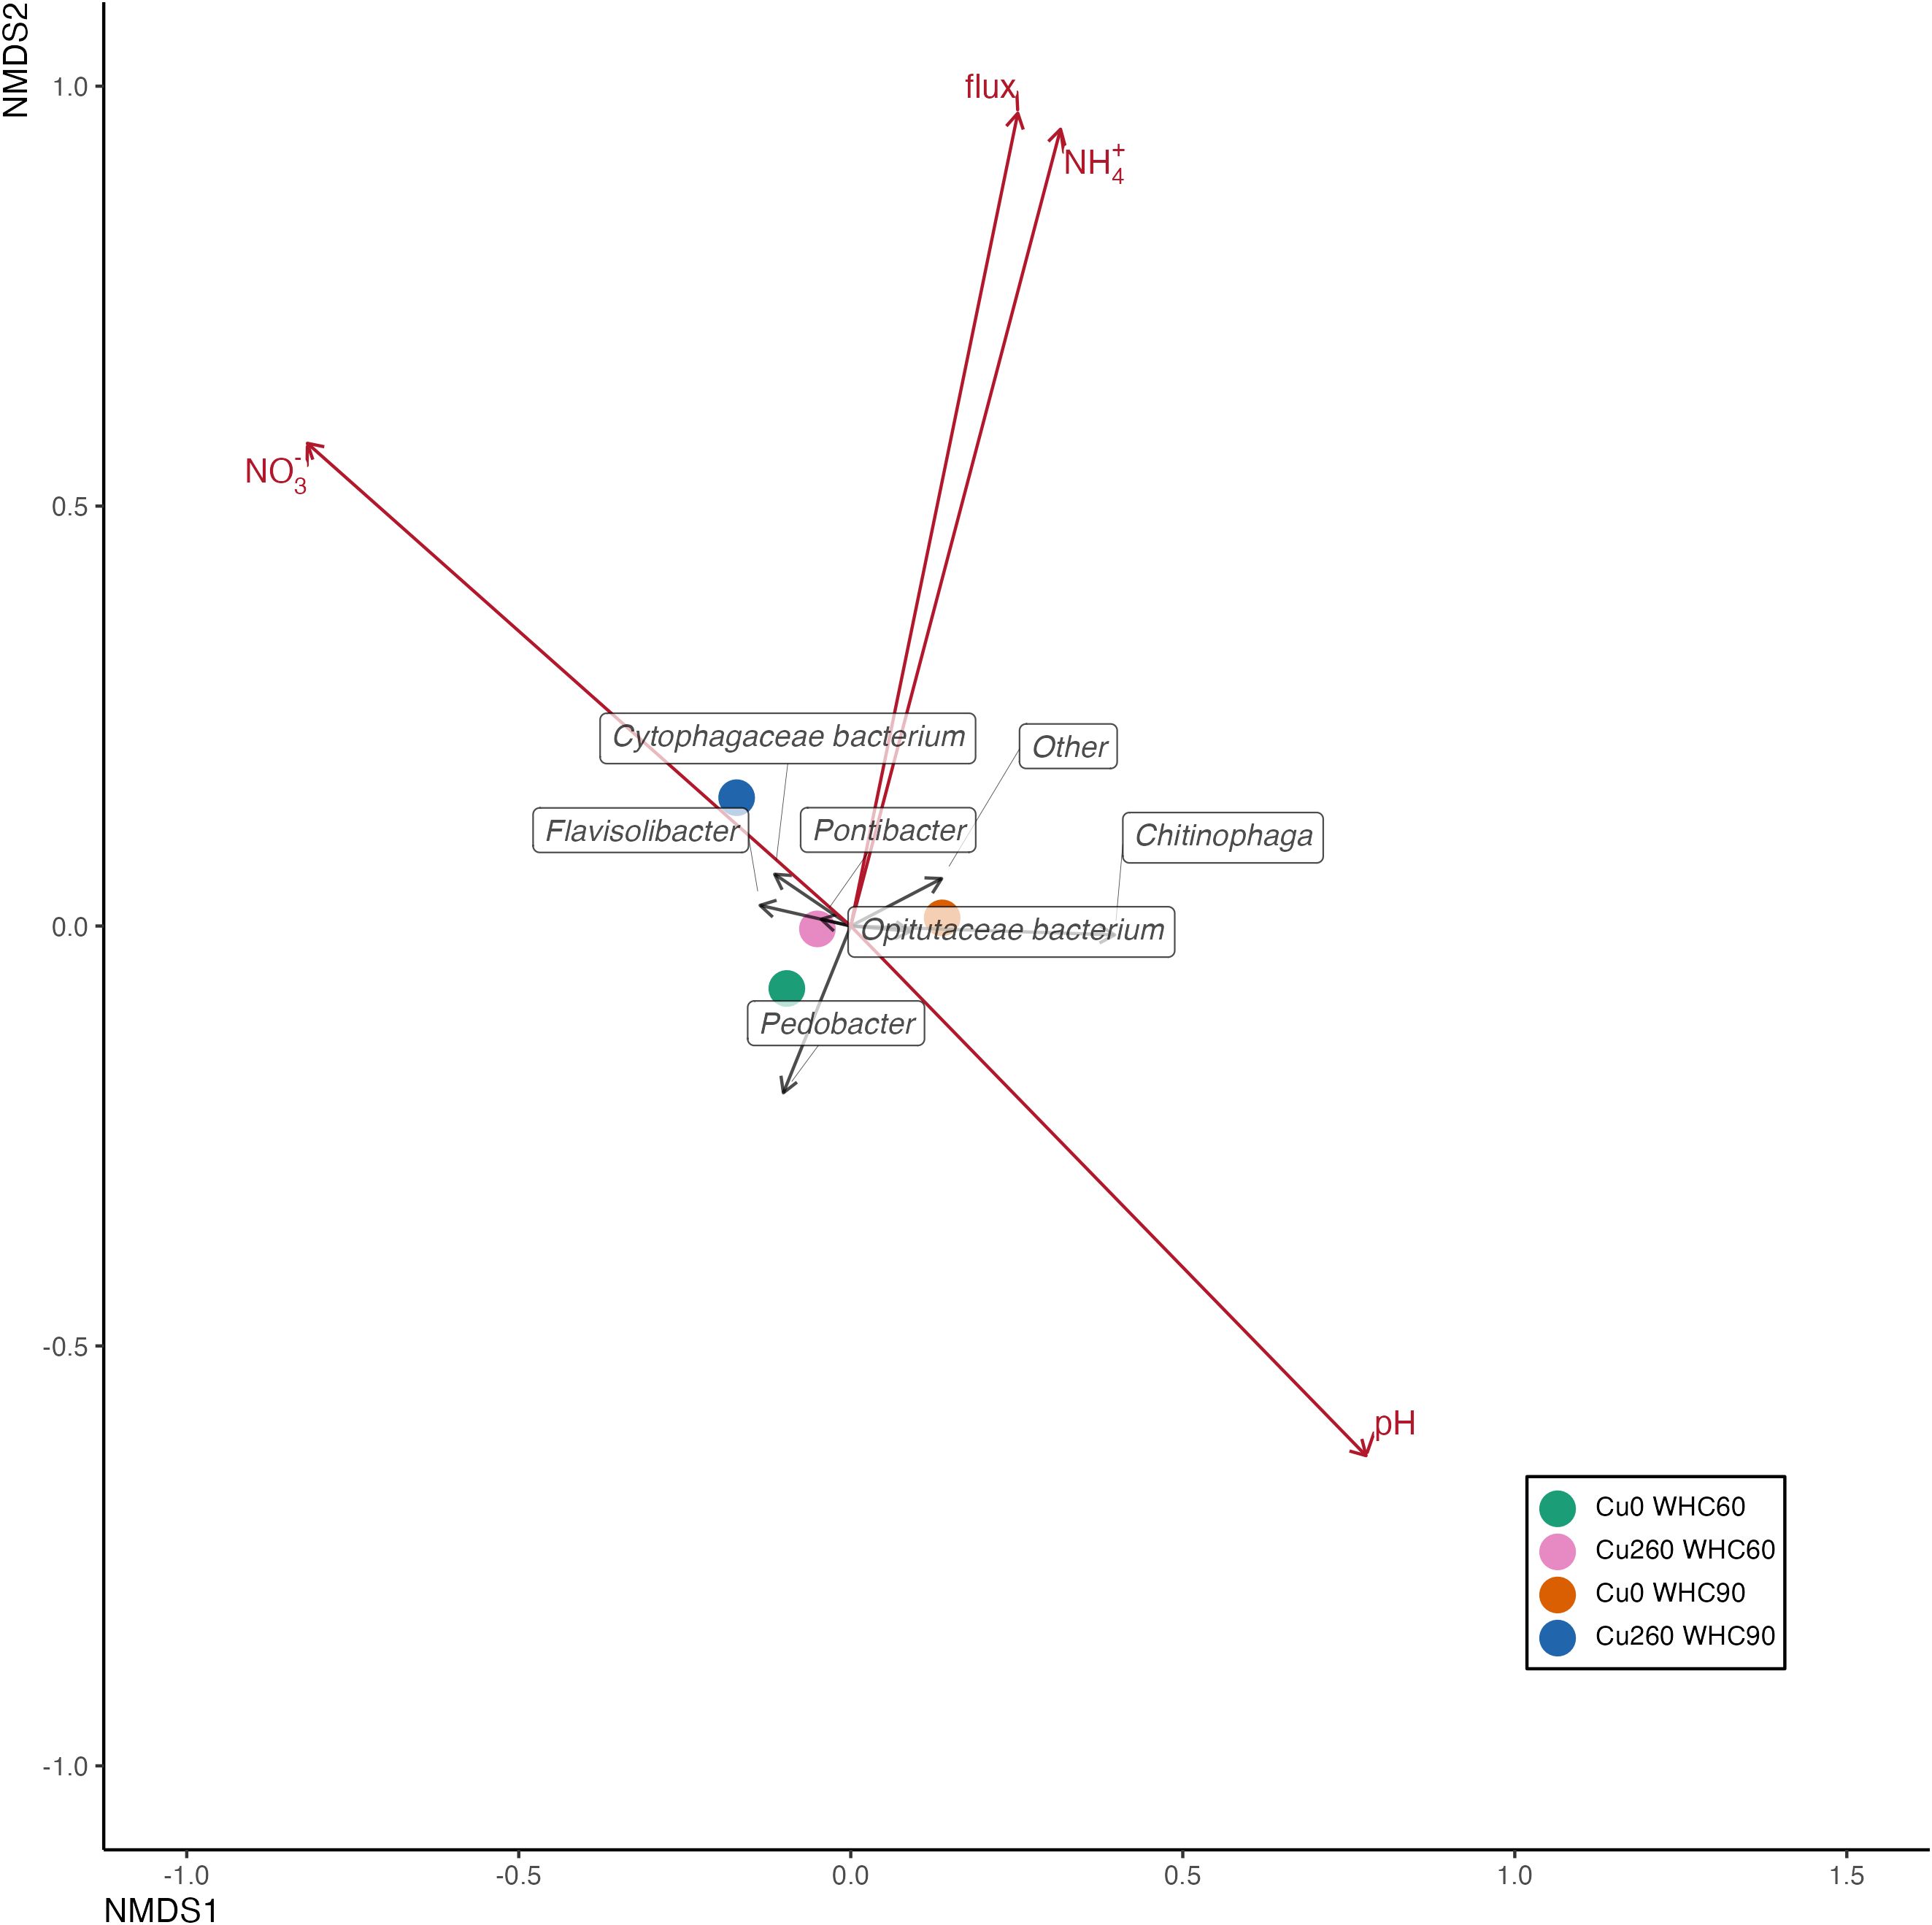
Figure 6. Nonmetric multidimensional scaling (NMDS) based on relative abundance illustrating nosZ clade II community structure across treatments in depression soils. Treatment centroids are shown as four colored dots. Taxa are represented by black arrows. Environmental variables and cumulative N2O emissions were overlaid onto the two-dimensional Bray–Curtis distance ordination using the envfit function and are shown as red arrows. Arrow directions indicate an increasing correlation of taxa with the respective variables.
4 Discussion
4.1 Effects of soil properties on N2O emissions in depression and upland soils
In this study, depression soils (mean across treatments: 1,677 µg N2O-N kg−1) emitted significantly more cumulative N2O than upland soils (mean across treatments: 213 µg N2O-N kg−1). This pattern aligns with field observations by Elberling et al. (10), who reported N2O fluxes from depression areas up to times higher than those from upland areas following fertilization.
The specific properties of soils in landscape depressions develop through the continuous deposition of nutrients and soil particles eroded from surrounding slopes. These processes are likely the primary drivers of the differences observed between upland and depression soils, which are located within just 10 m of each other. These specific properties include significant differences in total C and N content, soil pH, and texture (Table 1). The variation in soil physical and chemical properties between upland and depression soils appears to contribute substantially to the observed discrepancy in N2O emissions along the slope. Lee et al. (42) reported that denitrification is the primary N2O production pathway in soils originating from depression areas. This finding aligns well with the high emissions of 15N2O observed from the 15NO3-labeled depression soil at high water saturation in this study (Supplementary Table S4; depression soils at 90% WHC). However, the extent to which denitrification dominated the N2O fluxes in treatments exhibiting low N2O emissions remains unclear due to weak 15N signals in this study.
On a global scale, denitrification rates are positively correlated with SOC and total N (43). Higher N and C levels—particularly labile C—as found in depression soils, enhance N2O formation by providing substrates for both nitrification and denitrification (11). At the end of the incubation, NO3− contents averaged 41 mg kg−1 in upland soils and 100 mg kg−1 in depression soils, suggesting that NO3− availability did not limit denitrification in either soil. Moreover, although not significantly different, the depression soil in this study had higher silt and clay contents, likely due to erosion from the upland soil (Table 1). Higher silt and clay contents are associated with greater nutrient content and availability, as well as higher water retention, which can prolong periods of low soil gas diffusivity, thereby favoring N2O formation (44).
Another substantial difference between depression and upland soils is that depression soils are frequently exposed to waterlogging or extremely high soil moisture. Frequent and prolonged waterlogging can alter N transformation processes, which may be directly or indirectly linked to N2O emissions. Suriyavirun et al. (16) reported legacy effects on microbial community compositions, which may represent distinct microbial functional differences in biogeochemical processes between depression and upland soils. For example, anaerobic metabolizing taxa were found to be more abundant in depression soils than in upland soils (16), leading to entirely different N cycling processes (17). In line with these findings, the significantly higher N2O emissions observed in incubated depression soils in our study may be directly linked to the functional composition of the microbial community, which was distinctly different from that in upland soils (Figure 3, Supplementary Figure S3). This diverse N-cycling microbial community has been shown to significantly contribute to the variation in N2O emissions between upland and depression soils (Krichels et al., 2025). This highlights that landscape depressions are strong sources of N2O not only due to substrate (C and N) availability and soil aeration but also because of the long-term conditions associated with their topographic location.
4.2 Effects of water and Cu treatments on N2O
4.2.1 Water levels strongly affect soil N2O emissions
The cumulative N2O production from soils increased with higher water content in both upland and depression areas (Figures 1B, C). However, this tendency was much more pronounced in depression soils, where cumulative N2O emissions exhibited a substantially greater increase than in upland soils. Depression soils at 90% WHC had a 22-fold higher cumulative N2O flux (3,211 µg ± 282 µg N2O-N kg−1) compared to depression soils at 60% WHC (144 µg ± 56 µg N2O-N kg−1). In contrast, the cumulative N2O flux in upland soils at 90% WHC (282 µg ± 91 µg N2O-N kg−1) was only two times higher than upland soils at 60% WHC (145 µg ± 23 µg N2O-N kg−1). Although 60%—and especially 90%—WHC cannot, of course, be considered low soil moisture, the low soil bulk density in the incubation vessels (0.88 g cm−3) resulted in WFPS values of only 32.7% and 49.0% for the 60% and 90% WHC depression soil treatments, and 21.0% and 31.5% for the 60% and 90% WHC upland soil treatments, respectively. This highlights that the inherent differences in soil properties between the two soils—despite being collected from the same field—lead to substantially different maximal WHC (45, 46).
Studies investigating the relationship between soil water content and N2O emissions, such as the one conducted by Davidson (47), have demonstrated a general relationship between N2O emissions and WFPS, with net N2O production occurring between 30% and 90% WFPS and peaking at 65% WFPS. The increased N2O production from soils with 35% WFPS compared to 20% WFPS is often attributed to limited substrate diffusion and reduced water availability for microbes (45). However, the most important explanation for increased N2O production with rising WFPS in arable soil is the drastically reduced gas diffusivity in water, which favors anaerobic conditions in the soil. The greater effect of increasing water content on N2O emissions in depressed soils is likely due to their higher susceptibility to hypoxia (48). This supports the assumption that, under nonsubstrate-limiting conditions, high denitrification rates can be expected even at relatively low WFPS, as demonstrated by the high N2O emissions from the 90% WHC depression soil treatment. In loosely structured soils, a large fraction of the soil volume may remain air-filled at 90% WHC, potentially leading to the formation of anoxic microsites at the aggregate surface, in small pores, or concentrated around organic material. Therefore, hysteresis, or the sponge-like effect of organic material combined with high microbial activity, may lead to oxygen-depleted hotspots with high rates of N2O formation, even at low WFPS (49, 50). Similar observations have been made in other incubation studies, as well as in studies on N2O emissions from mixed and disrupted (tillaged) soils (51, 52). However, due to the low bulk density, WFPS remained relatively low, minimizing restrictions on gas diffusivity and the exchange of N2O at the soil-atmosphere interface. As a result, only a small proportion of N2O may have been further reduced to N2, due to the short residence time of N2O in the soil, especially given the shallow soil depth in our setup. This could explain the sharp response of N2O fluxes to even minor changes in soil moisture levels, particularly in the more biologically active depression soils.
4.2.2 Cu addition altered soil N2O flux peak
In our study, the upland and depression soils responded differently to Cu addition in terms of N2O emissions. Overall, Cu effects on cumulative N2O emissions in both soils were not significant, which corroborates previous findings (31, 53). Two key observations were that the addition of Cu delayed the peak N2O flux in depression soils at 90% WHC from days 1 to 3, and significantly lowered the peak N2O flux on day 3 for upland soils at 90% WHC (Figure 1A).
We did not observe a consistent decreasing trend in N2O emissions with Cu addition (Figure 1A). The Cu addition in our study resulted in a bioavailable Cu concentration of up to 85 mg kg−1, which exceeded the toxicity threshold of 25.6 mg kg−1 (25), and had a stronger effect on the microbial community, particularly in upland soils (see Section 4.3). However, the impact of Cu addition on soil N2O emissions remained minimal. The absence of a significant and clear effect of the Cu addition on N2O emissions in both soils suggests that the additional Cu did not inhibit the microbial processes involved in N2O formation or reduction in the analyzed Danish soils (54), despite the facts that Danish agricultural soils generally have a soil Cu content of around 8 mg kg−1 (55). While there is strong evidence that Cu availability affects the reduction of N2O to N2 (54, 56, 57), the effects of the tested Cu levels on the N2O reduction cannot be fully assessed with our data, as N2 emissions were not quantified, and cumulative N2O emissions were not significantly affected. Therefore, quantifying both N2 and N2O in future studies would provide a more complete understanding of the potential role of Cu amendments in regulating N2O emissions.
4.3 Water and copper treatment effects on microbial community
We found more than a 100-fold higher nosZ clade I abundance in depression soils compared to upland soils, and even an absence of nosZ clade II in upland soils (Figure 2). To our surprise, Cu addition did not increase the abundance of nosZ genes; instead, it inhibited nosZ clade I genes and certain genera within the community in upland soils or had no effects in depression soils. Other studies have also reported no clear impact of Cu on nosZ genes in soil systems (27) or demonstrated enhanced nosZ gene expression (28, 54, 58, 59). These inconsistent results suggest that denitrifying bacteria respond differently to Cu addition at the genus level (54). Furthermore, the initial Cu concentration in the depression soil samples was twofold higher than in the upland soil (p = 0.01), suggesting that the microbial community, including denitrifying bacteria, in depression soils is generally adapted to higher Cu availability (e.g., NOR). However, the incubation experiment lasted only 27 days, which was not sufficient to alter the legacy effects of repeated annual flooding from the field, though it was long enough to observe microbial responses to the treatments (60). Due to budget constraints, soils from the 130-mM Cu treatment were not included in the DNA analyses. As a result, potential changes in microbial abundance and community composition under this moderate Cu addition cannot be evaluated. Many studies have reported nosZ clade II-dominated soil systems, although approximately half of the nosZ clade II variants often lack nitrite reductase and are therefore incapable of complete denitrification (61, 62). This contrasts with our findings, which reveal a nosZ clade I-dominated soil system. Due to its low substrate affinity and higher maximum utilization rate, nosZ clade I often tends to dominate in environments characterized by high N2O emissions (63). Furthermore, nosZ clade II was found to be more sensitive to environmental factors than nosZ clade I (64), which is particularly relevant to our study and also suggests that these two clades exhibit niche differentiation under different soil conditions (20, 65, 66). High water content stimulated both nosZ clade I and clade II in depression soils but did not stimulate nosZ clade I in upland soils. Depression soils that are occasionally flooded may therefore be more favorable for bacteria harboring nosZ genes (67). Flooding at the sampling site played an important role in regulating soil microbial communities. As Ligi et al. (67) showed, soils from areas that were occasionally flooded contained more nosZ genes than soils from permanently flooded areas. Higher pH might be another reason why depression soils contained significantly more nosZ genes than upland soils (68). The combination of these environmental factors (soil moisture, soil NO3−, and soil pH) has been shown to drive the high abundance of nosZ genes at the field scale (69), which is consistent with our study.
At the end of the incubation, both upland and depression soils were dominated by AOB (with the absence of AOA in upland soils) (Figure 2), which is consistent with findings from nitrogen-rich agricultural soil systems (70–72). In contrast, AOA tends to dominate in low-nitrogen input ecosystems, such as grasslands and peatlands (73, 74). Soil pH plays a significant role in shaping the ammonia-oxidizing microbe communities (75). The abundance of nitrifying bacteria (AOB) and denitrifiers (nosZ) in depression soils increased slightly under the 90% WHC treatment, while the abundance of bacterial 16S rRNA genes in depression and upland soils showed opposite trends (Figure 2). Studies have shown that seasonal changes, such as temperature and soil water content, do not result in significant shifts in soil bacterial communities in C-rich soil systems (e.g., total C > 10%) (76, 77). The high amount of bioavailable SOC is sufficient to maintain bacterial community structure despite fluctuations in soil water content (78, 79). The only significant microbial abundance response to Cu treatment was the reduced bacterial 16S rRNA gene abundance and the elimination of AOB amoA from upland soils. Thus, the toxic effects of Cu were more pronounced in upland soils than in depression soils. Normally, heavy metal availability in soils is negatively correlated with SOC and soil clay content (80). However, the bioavailable Cu in upland and depression soils did not differ significantly among the Cu treatments. This suggests that the preconditioned soil properties—such as the higher background soil Cu content—and soil moisture history played important roles in influencing the physiological status of microbes and, consequently, their ability to tolerate the addition of heavy metals (30, 81). Our results suggest that microbial abundance in depression soils is more stable in response to abiotic changes compared to upland soils.
Depression and upland soils differ significantly not only in 16S rRNA, AOA, AOB, and nosZ gene abundance but also in the nosZ gene community structure. The nosZ clade I community structure of upland soils was more widely spread compared to that of depression soils (Figure 3). Our results suggest that long-term flooding regimes in the field can shape the nosZ community structure and affect its activity differently in upland and depression soils (82). Numerous studies have shown that microbial composition and function are largely shaped by topography (83–86). Bacterial community diversity and richness are higher in the poorly drained lower slope compared to the erosional upslope (85, 86). This alteration in the bacterial community was shaped by both abiotic and biotic soil properties, most notably by soil nutrients (e.g., SOC, NO3−, and NH4+) (86). Spatial-temporal variation in denitrification has been found to be driven by the legacy effects of complex interactions between soil properties and topography at the field scale (87). Water level and Cu addition altered the nosZ clade I community differently in the two soil types (Supplementary Table S5, Figure 3), with the nosZ clade I community in depression soils being more sensitive to Cu addition (p = 0.02), and the nosZ clade I community in the upland soils being more sensitive to high water levels (p = 0.02). As previously described, the depression soils were collected from a temporally flooded depression area in the field; thus, the denitrifying microbes can be assumed to be more adapted to fluctuations in soil moisture. Cu addition in depression soils altered the nosZ clade I community structure rather than gene abundance, a finding consistent with other studies (88). The Rhizobium/Agrobacterium group was significantly suppressed within the nosZ clade I community in both soils by Cu addition, and Hyphomicrobium was suppressed in upland soils (p < 0.05; Figure 3; Supplementary Tables S8, S9). Moreover, these groups were positively positioned in the NDMS plot at lower Cu concentrations (Figures 5, 4). The Rhizobium/Agrobacterium group was found to be Cu-sensitive and is considered an indicator of heavy metal pollution (89). Bradyrhizobium dominated the nosZ clade I community in upland soils at 90% WHC. Bradyrhizobium has been shown to adapt to a wide range of soil moisture conditions but thrives best at higher moisture levels (90).
In our study, the two most abundant genera (Bradyrhizobium and Afipia) of the nosZ clade I community were negatively positioned with the N2O flux in the NMDS plot (Figures 5, 4), suggesting that these two genera from upland and depression soils were mainly responsible for N2O reduction (91, 92). Environmental factors contributed to shifts in the nosZ community structure. Soil pH (p = 0.033; Table 3) was significantly associated with the nosZ clade I community in depression soils, while soil NH4+ and N2O flux were found to influence the nosZ clade II community structure in depression soils (p = 0.043 and p = 0.008, respectively; Table 3). It can be assumed that the nosZ clade I and II communities responded differently to soil properties (93, 94). An increased diversity or abundance of the nosZ clade II community, which correlated with either decreased N2O production or increased N2O consumption, has been reported in other studies (64, 93). The nosZ clade I community in upland soil was not affected by environmental factors. Overall, other studies have also found that soil moisture and soil pH are positively associated with changes in the nosZ gene community (82).
5 Conclusion
Based on our incubation experiment, we clearly demonstrate that soils from landscape depressions pose a higher risk of elevated N2O emissions compared to upland soils. In addition, increased soil moisture significantly stimulated N2O emissions in both upland and depression soils. This effect was particularly pronounced in depression zone soils, which are characterized by colluvic properties, enriched in clay and silt content, limiting soil aeration under increased moisture. These soils also contain higher levels of presumably more labile C and N, which are important precursors for denitrification. Hence, the distinct chemical and physical properties of the soils contribute to the greater N2O emission potential in depression soils compared to upland soils. Furthermore, depression soils exhibited a distinct abundance and composition of the microbial community associated with N cycling, including a higher abundance of denitrifying bacteria compared to the upland soils. The increased presence of the facultative anaerobic genera Afipia and Hyphomicrobium suggests that, in addition to the chemical and physical soil properties, frequent soil water saturation likely shapes a distinct denitrifier community in depression soils, contrasting with the microbial community in upland soils. We thus demonstrate a legacy effect of the frequent seasonal waterlogging, which leads to the development of a distinct denitrifier community in the soils of these landscape depressions. These specific microbial communities may promote more complete denitrification under waterlogged conditions. Although we expected a reduction in N2O emissions with Cu addition, no significant effect of Cu on cumulative N2O emissions was observed under the tested conditions. This suggests that Cu amendments to intensively managed soils, which already contain moderate levels of Cu, may not be an effective strategy for mitigating N2O emission hot spots in arable lands. Instead, our findings highlight the adaptability of the microbial community shaped by waterlogging conditions in the field, which drive N2O emissions, particularly in depression soils. This study enhances our understanding of how a history of regular flooding influences soil properties and microbial processes, shaping N-cycling microbes and resulting in substantially different N2O emissions.
Data availability statement
The datasets presented in this study can be found in online repositories. The names of the repository/repositories and accession number(s) can be found in the article/Supplementary Material.
Author contributions
YL: Formal analysis, Investigation, Methodology, Software, Writing – original draft, Writing – review & editing. HS: Formal analysis, Methodology, Software, Writing – review & editing. BK: Formal analysis, Software, Writing – review & editing. PA: Conceptualization, Funding acquisition, Methodology, Supervision, Writing – review & editing. DP: Methodology, Software, Writing – review & editing. KT: Methodology, Writing – review & editing. BE: Funding acquisition, Supervision, Writing – review & editing. FW: Conceptualization, Writing – review & editing. KT-K: Funding acquisition, Supervision, Writing – review & editing. CM: Conceptualization, Funding acquisition, Methodology, Supervision, Validation, Writing – review & editing. DMNP: Supervision, Writing – review & editing.
Funding
The author(s) declare that financial support was received for the research and/or publication of this article. This study was funded by the Independent Research Fund Denmark project “Limiting N2O Emission from Hot Spots in Danish Agricultural Soils—Linking Crop Roots and Nitrate Dynamics to Develop New Strategies to Mitigate Trace Gasses” (Funding Number: 0217-00322B). PA was also supported by the Pioneer Center for Landscape Research in Sustainable Agricultural Futures (Land-CRAFT), funded by the Danish National Research Foundation (Grant Number P2).
Acknowledgments
HS and DP acknowledge Prof. Sara Hallin and Dr. Christopher Jones from SLU Uppsala, Sweden, for discussions on nosZ taxonomic analytical pipelines.
Conflict of interest
The authors declare that the research was conducted in the absence of any commercial or financial relationships that could be construed as a potential conflict of interest.
Generative AI statement
The author(s) declare that no Generative AI was used in the creation of this manuscript.
Publisher’s note
All claims expressed in this article are solely those of the authors and do not necessarily represent those of their affiliated organizations, or those of the publisher, the editors and the reviewers. Any product that may be evaluated in this article, or claim that may be made by its manufacturer, is not guaranteed or endorsed by the publisher.
Supplementary material
The Supplementary Material for this article can be found online at: https://www.frontiersin.org/articles/10.3389/fsoil.2025.1566135/full#supplementary-material
References
1. Ravishankara AR, Daniel JS, Portmann RW. Nitrous oxide (N2O): The dominant ozone-depleting substance emitted in the 21st century. Science. (2009) 326:123–5. doi: 10.1126/science.1176985
2. Lee H, Calvin K, Dasgupta D, Krinner G, Mukherji A, Thorne P, et al. IPCC, 2023: Climate Change 2023: Synthesis Report, Summary for Policymakers. Contribution of Working Groups I, II and III to the Sixth Assessment Report of the Intergovernmental Panel on Climate Change. Core Writing Team, Lee H, Romero J, editors. Geneva, Switzerland: IPC (2023).
3. Bouwman AF, Beusen AHW, Griffioen J, Van Groenigen JW, Hefting MM, Oenema O, et al. Global trends and uncertainties in terrestrial denitrification and N2O emissions. Philos Trans R Soc B Biol Sci. (2013) 368. doi: 10.1098/rstb.2013.0112
4. Albrektsen R, Mikkelsen MH, Gyldenkærne S. Danish emission inventories for agriculture. no Sci Rep from DCE–Danish Cent Environ Energy. Denmark, Vol. 443. (2021).
5. Davidson EA. The contribution of manure and fertilizer nitrogen to atmospheric nitrous oxide since 1860. Nat Geosci. (2009) 2:659–62. doi: 10.1038/ngeo608
6. Aryal B, Gurung R, Camargo AF, Fongaro G, Treichel H, Mainali B, et al. Nitrous oxide emission in altered nitrogen cycle and implications for climate change. Environ Pollut. (2022) 314:120272. doi: 10.1016/j.envpol.2022.120272
7. Butterbach-Bahl K, Baggs EM, Dannenmann M, Kiese R, Zechmeister-Boltenstern S. Nitrous oxide emissions from soils: How well do we understand the processes and their controls? Philos Trans R Soc B Biol Sci. (2013) 368. doi: 10.1098/rstb.2013.0122
8. Van Kessel MAHJ, Speth DR, Albertsen M, Nielsen PH, Op Den Camp HJM, Kartal B, et al. Complete nitrification by a single microorganism. Nature. (2015) 528:555–9. doi: 10.1038/nature16459
9. Hu HW, Chen D, He JZ. Microbial regulation of terrestrial nitrous oxide formation: Understanding the biological pathways for prediction of emission rates. FEMS Microbiol Rev. (2015) 39:729–49. doi: 10.1093/femsre/fuv021
10. Elberling B, Kovács GM, Hansen HFE, Fensholt R, Ambus P, Tong X, et al. High nitrous oxide emissions from temporary flooded depressions within croplands. Commun Earth Environ. (2023) 4:1–9. doi: 10.1038/s43247-023-01095-8
11. Butterbach-Bahl K, Gundersen P, Ambus P, Augustin J, Beier C, Boeckx P, et al. Nitrogen processes in terrestrial ecosystems. Eur Nitrogen Assess. (2011), 99–125. doi: 10.1017/CBO9780511976988.009
12. Krichels A, DeLucia EH, Sanford R, Chee-Sanford J, Yang WH. Historical soil drainage mediates the response of soil greenhouse gas emissions to intense precipitation events. Biogeochemistry. (2019) 142:425–42. doi: 10.1007/s10533-019-00544-x
13. Hawkes CV, Keitt TH. Resilience vs. historical contingency in microbial responses to environmental change. Ecol Lett. (2015) 18:612–25. doi: 10.1111/ele.2015.18.issue-7
14. Ambus P, Christensen S. Spatial and seasonal nitrous oxide and methane fluxes in Danish forest-, grassland-, and agroecosystems. American Society of Agronomy, Crop Science Society of America, and Soil Science Society of America: Wiley Online Library (1995).
15. Turner PA, Griffis TJ, Mulla DJ, Baker JM, Venterea RT. A geostatistical approach to identify and mitigate agricultural nitrous oxide emission hotspots. Sci Total Environ. (2016) 572:442–9. doi: 10.1016/j.scitotenv.2016.08.094
16. Suriyavirun N, Krichels AH, Kent AD, Yang WH. Microtopographic differences in soil properties and microbial community composition at the field scale. Soil Biol Biochem. (2019) 131:71–80. doi: 10.1016/j.soilbio.2018.12.024
17. Yu W, Lawrence NC, Sooksa-nguan T, Smith SD, Tenesaca C, Howe AC, et al. Microbial linkages to soil biogeochemical processes in a poorly drained agricultural ecosystem. Soil Biol Biochem. (2021) 156:108228. doi: 10.1016/j.soilbio.2021.108228
18. Ambus P. Nitrous oxide production by denitrification and nitrification in temperate forest, grassland and agricultural soils. Eur J Soil Sci. (1998) 49:495–502. doi: 10.1046/j.1365-2389.1998.4930495.x
19. Philippot L, Andert J, Jones CM, Bru D, Hallin S. Importance of denitrifiers lacking the genes encoding the nitrous oxide reductase for N2O emissions from soil. Glob Chang Biol. (2011) 17:1497–504. doi: 10.1111/j.1365-2486.2010.02334.x
20. Jones CM, Graf DRH, Bru D, Philippot L, Hallin S. The unaccounted yet abundant nitrous oxide-reducing microbial community: A potential nitrous oxide sink. ISME J. (2013) 7:417–26. doi: 10.1038/ismej.2012.125
21. Hallin S, Philippot L, Löffler FE, Sanford RA, Jones CM. Genomics and ecology of novel N2O-reducing microorganisms. Trends Microbiol. (2018) 26:43–55. doi: 10.1016/j.tim.2017.07.003
22. Reyes C, Hodgskiss LH, Kerou M, Pribasnig T, Abby SS, Bayer B, et al. Genome wide transcriptomic analysis of the soil ammonia oxidizing archaeon Nitrososphaera viennensis upon exposure to copper limitation. ISME J. (2020) 14:2659–74. doi: 10.1038/s41396-020-0715-2
23. Gwak JH, Jung MY, Hong H, Kim JG, Quan ZX, Reinfelder JR, et al. Archaeal nitrification is constrained by copper complexation with organic matter in municipal wastewater treatment plants. ISME J. (2020) 14:335–46. doi: 10.1038/s41396-019-0538-1
24. Alloway BJ. Micronutrients and crop production: An introduction. Micronutr Defic Glob Crop Prod. (2008), 1–39. doi: 10.1007/978-1-4020-6860-7
25. Jensen J, Larsen MM, Bak J. National monitoring study in Denmark finds increased and critical levels of copper and zinc in arable soils fertilized with pig slurry. Environ Pollut. (2016) 214:334–40. doi: 10.1016/j.envpol.2016.03.034
26. Elberling B, Breuning-Madsen H, Hinge H, Asmund G. Heavy metals in 3300-year-old agricultural soils used to assess present soil contamination. Eur J Soil Sci. (2010) 61:74–83. doi: 10.1111/j.1365-2389.2009.01202.x
27. Li S, Yang X, Buchner D, Wang H, Xu H, Haderlein SB, et al. Increased copper levels inhibit denitrification in urban soils. Earth Environ Sci Trans R Soc Edinburgh. (2019) 109:421–7. doi: 10.1017/S1755691018000592
28. Sullivan MJ, Gates AJ, Appia-Ayme C, Rowley G, Richardson DJ. Copper control of bacterial nitrous oxide emission and its impact on vitamin B12-Dependent metabolism. Proc Natl Acad Sci U S A. (2013) 110:19926–31. doi: 10.1073/pnas.1314529110
29. Lu L, Chen C, Ke T, Wang M, Sima M, Huang S. Long-term metal pollution shifts microbial functional profiles of nitrification and denitrification in agricultural soils. Sci Total Environ. (2022) 830. doi: 10.1016/j.scitotenv.2022.154732
30. Rijk I, Berkelund L, Ekblad A, Hallin S, Kleja DB, Taylor A, et al. Effects of copper contamination on N cycling microbial guilds and plant performance in two contrasting grassland soils. Soil Biol Biochem. (2023) 180:109015. doi: 10.1016/j.soilbio.2023.109015
31. Black A, Wakelin S, Hamonts K, Gerard E, Condron L. Impacts of long term copper exposure on abundance of nitrogen cycling genes and denitrification activity in pasture soils. Appl Soil Ecol. (2019) 138:253–61. doi: 10.1016/j.apsoil.2019.03.009
32. Henry S, Bru D, Stres B, Hallet S, Philippot L. Quantitative detection of the nosZ gene, encoding nitrous oxide reductase, and comparison of the abundances of 16S rRNA, narG, nirK, and nosZ genes in soils. Appl Environ Microbiol. (2006) 72:5181–9. doi: 10.1128/AEM.00231-06
33. Andrews S. FastQC: a quality control tool for high throughput sequence data. United Kingdom: Cambridge (2010).
34. Bolger AM, Lohse M, Usadel B. Trimmomatic: a flexible trimmer for Illumina sequence data. Bioinformatics. (2014) 30:2114–20. doi: 10.1093/bioinformatics/btu170
35. Boyd JA, Woodcroft BJ, Tyson GW. GraftM: a tool for scalable, phylogenetically informed classification of genes within metagenomes. Nucleic Acids Res. (2018) 46:e59. doi: 10.1093/nar/gky174
36. Czech L, Barbera P, Stamatakis A. Genesis and Gappa: processing, analyzing and visualizing phylogenetic (placement) data. Bioinformatics. (2020) 36:3263–5. doi: 10.1093/bioinformatics/btaa070
37. Graf DRH, Jones CM, Zhao M, Hallin S. Assembly of root-associated N2O-reducing communities of annual crops is governed by selection for nosZ clade I over clade II. FEMS Microbiol Ecol. (2022) 98:1–11. doi: 10.1093/femsec/fiac092
39. Keeling CD. The concentration and isotopic abundances of atmospheric carbon dioxide in rural areas. Geochim Cosmochim Acta. (1958) 13:322–34. doi: 10.1016/0016-7037(58)90033-4
40. Fuß R, Hueppi R, Asger R. Gasfluxes: Greenhouse gas flux calculation from chamber measurements. R package version 0.4–4. (2020).
42. Lee A, Winther M, Priemé A, Blunier T, Christensen S. Hot spots of N2O emission move with the seasonally mobile oxic-anoxic interface in drained organic soils. Soil Biol Biochem. (2017) 115:178–86. doi: 10.1016/j.soilbio.2017.08.025
43. Li Z, Tang Z, Song Z, Chen W, Tian D, Tang S, et al. Variations and controlling factors of soil denitrification rate. Glob Chang Biol. (2022) 28:2133–45. doi: 10.1111/gcb.16066
44. Lal R. Soil organic matter and water retention. Agron J. (2020) 112:3265–77. doi: 10.1002/agj2.v112.5
45. Bateman EJ, Baggs EM. Contributions of nitrification and denitrification to N2O emissions from soils at different water-filled pore space. Biol Fertil Soils. (2005) 41:379–88. doi: 10.1007/s00374-005-0858-3
46. Kemmann B, Wöhl L, Fuß R, Schrader S, Well R, Ruf T. N2 and N2O mitigation potential of replacing maize with the perennial biomass crop Silphium perfoliatum—An incubation study. GCB Bioenergy. (2021) 13:1649–65. doi: 10.1111/gcbb.v13.10
47. Davidson EA. Fluxes of nitrous oxide and nitric oxide from terrestrial ecosystems. In: Microb Prod Consum Greenh Gases Methane, Nitrogen Oxides, Halomethanes (1991). p. 219–35.
48. Schlüter S, Lucas M, Grosz B, Ippisch O, Zawallich J, He H, et al. The anaerobic soil volume as a controlling factor of denitrification: a review. Biol Fertil Soils. (2024).
49. Lucas M, Gil J, Robertson GP, Ostrom NE, Kravchenko A. Changes in soil pore structure generated by the root systems of maize, sorghum and switchgrass affect in situ N2O emissions and bacterial denitrification. Biol Fertil Soils. (2024) 1–23. doi: 10.1007/s00374-023-01761-1
50. Kravchenko AN, Toosi ER, Guber AK, Ostrom NE, Yu J, Azeem K, et al. Hotspots of soil N 2 O emission enhanced through water absorption by plant residue. Nat Geosci. (2017) 10:496–500. doi: 10.1038/ngeo2963
51. Lussich F, Dhaliwal JK, Faiia AM, Jagadamma S, Schaeffer SM, Saha D. Cover crop residue decomposition triggered soil oxygen depletion and promoted nitrous oxide emissions. Sci Rep. (2024) 14:1–14. doi: 10.1038/s41598-024-58942-7
52. Pfülb L, Elsgaard L, Dörsch P, Fuß R, Well R. Impact of liming and maize residues on N2O and N2 fluxes in agricultural soils: an incubation study. Biol Fertil Soils. (2024).
53. Doroski AA, Helton AM, Vadas TM. Greenhouse gas fluxes from coastal wetlands at the intersection of urban pollution and saltwater intrusion: A soil core experiment. Soil Biol Biochem. (2019) 131:44–53. doi: 10.1016/j.soilbio.2018.12.023
54. Shen W, Xue H, Gao N, Shiratori Y, Kamiya T, Fujiwara T, et al. Effects of copper on nitrous oxide (N2O) reduction in denitrifiers and N2O emissions from agricultural soils. Biol Fertil Soils. (2020) 56:39–51. doi: 10.1007/s00374-019-01399-y
55. Panagos P, Ballabio C, Lugato E, Jones A, Borrelli P, Scarpa S, et al. Potential sources of anthropogenic copper inputs to European agricultural soils. Sustain. (2018) 10:39–51. doi: 10.3390/su10072380
56. Tortosa G, Pacheco PJ, Hidalgo-García A, Granados A, Delgado A, Mesa S, et al. Copper modulates nitrous oxide emissions from soybean root nodules. Environ Exp Bot. (2020) 180. doi: 10.1016/j.envexpbot.2020.104262
57. Giannopoulos G, Hartop KR, Brown BL, Song B, Elsgaard L, Franklin RB. Trace metal availability affects greenhouse gas emissions and microbial functional group abundance in freshwater wetland sediments. Front Microbiol. (2020) 11:1–12. doi: 10.3389/fmicb.2020.560861
58. Felgate H, Giannopoulos G, Sullivan MJ, Gates AJ, Clarke TA, Baggs E, et al. The impact of copper, nitrate and carbon status on the emission of nitrous oxide by two species of bacteria with biochemically distinct denitrification pathways. Environ Microbiol. (2012) 14:1788–800. doi: 10.1111/j.1462-2920.2012.02789.x
59. Black A, Hsu PCL, Hamonts KE, Clough TJ, Condron LM. Influence of copper on expression of nirS, norB and nosZ and the transcription and activity of NIR, NOR and N2OR in the denitrifying soil bacteria Pseudomonas stutzeri. Microb Biotechnol. (2016) 9:381–8. doi: 10.1111/mbt2.2016.9.issue-3
60. Unger IM, Kennedy AC, Muzika RM. Flooding effects on soil microbial communities. Appl Soil Ecol. (2009) 42:1–8. doi: 10.1016/j.apsoil.2009.01.007
61. Domeignoz-Horta LA, Putz M, Spor A, Bru D, Breuil MC, Hallin S, et al. Non-denitrifying nitrous oxide-reducing bacteria - An effective N2O sink in soil. Soil Biol Biochem. (2016) 103:376–9. doi: 10.1016/j.soilbio.2016.09.010
62. Graf DRH, Jones CM, Hallin S. Intergenomic comparisons highlight modularity of the denitrification pathway and underpin the importance of community structure for N2O emissions. PloS One. (2014) 9:1–20. doi: 10.1371/journal.pone.0114118
63. Shan J, Sanford RA, Chee-Sanford J, Ooi SK, Löffler FE, Konstantinidis KT, et al. Beyond denitrification: The role of microbial diversity in controlling nitrous oxide reduction and soil nitrous oxide emissions. Glob Chang Biol. (2021) 27:2669–83. doi: 10.1111/gcb.v27.12
64. Domeignoz-Horta LA, Spor A, Bru D, Breuil MC, Bizouard F, Léonard J, et al. The diversity of the N2O reducers matters for the N2O:N2 denitrification end-product ratio across an annual and a perennial cropping system. Front Microbiol. (2015) 6. doi: 10.3389/fmicb.2015.00971
65. Domeignoz-Horta LA, Philippot L, Peyrard C, Bru D, Breuil MC, Bizouard F, et al. Peaks of in situ N2O emissions are influenced by N2O-producing and reducing microbial communities across arable soils. Glob Chang Biol. (2018) 24:360–70.
66. Xu X, Liu Y, Singh BP, Yang Q, Zhang Q, Wang H, et al. NosZ clade II rather than clade I determine in situ N2O emissions with different fertilizer types under simulated climate change and its legacy. Soil Biol Biochem. (2020) 150:107974. doi: 10.1016/j.soilbio.2020.107974
67. Ligi T, Truu M, Oopkaup K, Nõlvak H, Mander Ü, Mitsch WJ, et al. The genetic potential of N2 emission via denitrification and ANAMMOX from the soils and sediments of a created riverine treatment wetland complex. Ecol Eng. (2015) 80:181–90. doi: 10.1016/j.ecoleng.2014.09.072
68. Liu Y, Liu Y, Zhou H, Li L, Zheng J, Zhang X, et al. Abundance, composition and activity of denitrifier communities in metal polluted paddy soils. Sci Rep. (2016) 6:1–11. doi: 10.1038/srep19086
69. Nadeau SA, Roco CA, Debenport SJ, Anderson TR, Hofmeister KL, Walter MT, et al. Metagenomic analysis reveals distinct patterns of denitrification gene abundance across soil moisture, nitrate gradients. Environ Microbiol. (2019) 21:1255–66. doi: 10.1111/emi.2019.21.issue-4
70. Li Y, Tremblay J, Bainard LD, Cade-Menun B, Hamel C. Long-term effects of nitrogen and phosphorus fertilization on soil microbial community structure and function under continuous wheat production. Environ Microbiol. (2020) 22:1066–88. doi: 10.1111/1462-2920.14824
71. Lin J, Xu Z, Xue Y, Sun R, Yang R, Cao X, et al. N2O emissions from soils under short-term straw return in a wheat-corn rotation system are associated with changes in the abundance of functional microbes. Agric Ecosyst Environ. (2023) 341:108217. doi: 10.1016/j.agee.2022.108217
72. Wang W, Yang M, Shen P, Zhang R, Qin X, Han J, et al. Conservation tillage reduces nitrous oxide emissions by regulating functional genes for ammonia oxidation and denitrification in a winter wheat ecosystem. Soil Tillage Res. (2019) 194:104347. doi: 10.1016/j.still.2019.104347
73. Prosser JI, Nicol GW. Archaeal and bacterial ammonia-oxidisers in soil: The quest for niche specialisation and differentiation. Trends Microbiol. (2012) 20:523–31. doi: 10.1016/j.tim.2012.08.001
74. Siljanen HMP, Alves RJE, Ronkainen JG, Lamprecht RE, Bhattarai HR, Bagnoud A, et al. Archaeal nitrification is a key driver of high nitrous oxide emissions from arctic peatlands. Soil Biol Biochem. (2019) 137:107539. doi: 10.1016/j.soilbio.2019.107539
75. Zhao C, He X, Dan X, He M, Zhao J, Meng H, et al. Soil dissolved organic matters mediate bacterial taxa to enhance nitrification rates under wheat cultivation. Sci Total Environ. (2022) 828:154418. doi: 10.1016/j.scitotenv.2022.154418
76. Kraigher B, Stres B, Hacin J, Ausec L, Mahne I, Van Elsas JD, et al. Microbial activity and community structure in two drained fen soils in the Ljubljana Marsh. Soil Biol Biochem. (2006) 38:2762–71. doi: 10.1016/j.soilbio.2006.04.031
77. Stres B, Danevčič T, Pal L, Fuka MM, Resman L, Leskovec S, et al. Influence of temperature and soil water content on bacterial, archaeal and denitrifying microbial communities in drained fen grassland soil microcosms. FEMS Microbiol Ecol. (2008) 66:110–22. doi: 10.1111/j.1574-6941.2008.00555.x
78. Agnelli A, Ascher J, Corti G, Ceccherini MT, Nannipieri P, Pietramellara G. Distribution of microbial communities in a forest soil profile investigated by microbial biomass, soil respiration and DGGE of total and extracellular DNA. Soil Biol Biochem. (2004) 36:859–68. doi: 10.1016/j.soilbio.2004.02.004
79. Zhou J, Xia B, Treves DS, Wu LY, Marsh TL, O’Neill RV, et al. Spatial and resource factors influencing high microbial diversity in soil. Appl Environ Microbiol. (2002) 68:326–34. doi: 10.1128/AEM.68.1.326-334.2002
80. Otunola BO, Ololade OO. A review on the application of clay minerals as heavy metal adsorbents for remediation purposes. Environ Technol Innov. (2020) 18:100692. doi: 10.1016/j.eti.2020.100692
81. Corrochano-Monsalve M, Saiz H, Maestre FT. Influence of soil copper and zinc levels on the abundance of methanotrophic, nitrifying, and N2O-reducing microorganisms in drylands worldwide. Appl Soil Ecol. (2024) 196:105284. doi: 10.1016/j.apsoil.2024.105284
82. Yang YD, Hu YG, Wang ZM, Zeng ZH. Variations of the nirS-, nirK-, and nosZ-denitrifying bacterial communities in a northern Chinese soil as affected by different long-term irrigation regimes. Environ Sci Pollut Res. (2018) 25:14057–67. doi: 10.1007/s11356-018-1548-7
83. Li X, Li X, Shi Y, Zhao S, Liu J, Lin Y, et al. Effects of microtopography on soil microbial communities in alpine meadows on the Qinghai-Tibetan Plateau. Catena. (2024) 239:107945. doi: 10.1016/j.catena.2024.107945
84. Enwall K, Throbäck IN, Stenberg M, Söderström M, Hallin S. Soil resources influence spatial patterns of denitrifying communities at scales compatible with land management. Appl Environ Microbiol. (2010) 76:2243–50. doi: 10.1128/AEM.02197-09
85. Kong W, Su F, Zhang Q, Ishii S, Sadowsky MJ, Banerjee S, et al. Erosion and deposition divergently affect the structure of soil bacterial communities and functionality. Catena. (2022) 209:105805. doi: 10.1016/j.catena.2021.105805
86. Wang Z, Shi J, Peng Y, Wang X. Deposition of eroded soil significantly increases bacterial community diversity and soil multifunctionality in a Mollisol agricultural ecosystem. Ecol Indic. (2024) 159:111660. doi: 10.1016/j.ecolind.2024.111660
87. Li X, McCarty GW, Lang M, Ducey T, Hunt P, Miller J. Topographic and physicochemical controls on soil denitrification in prior converted croplands located on the Delmarva Peninsula, USA. Geoderma. (2018) 309:41–9. doi: 10.1016/j.geoderma.2017.09.003
88. Zhao S, Su X, Wang Y, Yang X, Bi M, He Q, et al. Copper oxide nanoparticles inhibited denitrifying enzymes and electron transport system activities to influence soil denitrification and N2O emission. Chemosphere. (2020) 245:125394. doi: 10.1016/j.chemosphere.2019.125394
89. Tom-Petersen A, Leser TD, Marsh TL, Nybroe O. Effects of copper amendment on the bacterial community in agricultural soil analyzed by the T-RFLP technique. FEMS Microbiol Ecol. (2003) 46:53–62. doi: 10.1016/S0168-6496(03)00192-2
90. Qin H, Xing X, Tang Y, Zhu B, Wei X, Chen X, et al. Soil moisture and activity of nitrite- and nitrous oxide-reducing microbes enhanced nitrous oxide emissions in fallow paddy soils. Biol Fertil Soils. (2020) 56:53–67. doi: 10.1007/s00374-019-01403-5
91. Wasai-Hara S, Itakura M, Fernandes Siqueira A, Takemoto D, Sugawara M, Mitsui H, et al. Bradyrhizobium ottawaense efficiently reduces nitrous oxide through high nosZ gene expression. Sci Rep. (2023) 13:1–12. doi: 10.1038/s41598-023-46019-w
92. Maheshwari A, Jones CM, Tiemann M, Hallin S. Carbon substrate selects for different lineages of N2O reducing communities in soils under anoxic conditions. Soil Biol Biochem. (2023) 177:108909. doi: 10.1016/j.soilbio.2022.108909
93. Juhanson J, Hallin S, Söderström M, Stenberg M, Jones CM. Spatial and phyloecological analyses of nosZ genes underscore niche differentiation amongst terrestrial N2O reducing communities. Soil Biol Biochem. (2017) 115:82–91. doi: 10.1016/j.soilbio.2017.08.013
Keywords: topographic depression, nitrous oxide emission, Cu amendments, qPCR, nosZ community
Citation: Liu Y, Siljanen HMP, Kemmann B, Ambus P, Paul D, Thiyagarasaiyar K, Elberling B, Wichern F, Thorup-Kristensen K, Mueller CW and Poultney DMN (2025) Higher soil nitrous oxide production in landscape depressions linked to soil and hydrological legacy effects. Front. Soil Sci. 5:1566135. doi: 10.3389/fsoil.2025.1566135
Received: 24 January 2025; Accepted: 15 April 2025;
Published: 09 May 2025.
Edited by:
Ingo Schöning, Max Planck Institute for Biogeochemistry, GermanyReviewed by:
Steffen Kolb, Leibniz Center for Agricultural Landscape Research (ZALF), GermanyJörg Luster, Swiss Federal Institute for Forest, Snow and Landscape Research (WSL), Switzerland
Copyright © 2025 Liu, Siljanen, Kemmann, Ambus, Paul, Thiyagarasaiyar, Elberling, Wichern, Thorup-Kristensen, Mueller and Poultney. This is an open-access article distributed under the terms of the Creative Commons Attribution License (CC BY). The use, distribution or reproduction in other forums is permitted, provided the original author(s) and the copyright owner(s) are credited and that the original publication in this journal is cited, in accordance with accepted academic practice. No use, distribution or reproduction is permitted which does not comply with these terms.
*Correspondence: Yujia Liu, eWxpdUBpZ24ua3UuZGs=