 Leticia Jiménez1*
 Pablo Ramón1,2Jhonattan Sarango3
 Juan Ignacio Burneo1Johana Gusmán3
 Elizabeth Gusmán-Montalván1,2
- 1Departamento de Ciencias Biológicas y Agropecuarias, Universidad Técnica Particular de Loja, Loja, Ecuador
- 2Laboratorio de Ecología Tropical y Servicios Ecosistémicos, Universidad Técnica Particular de Loja, Loja, Ecuador
- 3Alumni-Carrera de Ingeniería Agropecuaria, Universidad Técnica Particular de Loja, Loja, Ecuador
Anthropogenic activities, particularly agriculture and cattle ranching, transform forest ecosystems and alter soil properties in tropical dry forests. This study quantified changes in carbon (C) and nitrogen (N) stocks and soil nutrient composition across three land use types: excluded forest (EF - protected from grazing for 8 years), non-excluded pasture (NEP), and maize cropland (Cr) in southern Ecuador. We established three 1-ha plots per land use type and collected 225 soil samples (0–10 cm depth) for physicochemical analysis using standard methods including loss-on-ignition for C determination and Kjeldahl method for N analysis. Carbon stocks were significantly higher in excluded forest (18.09 Mg/ha) compared to cropland (17.67 Mg/ha, p<0.05), while nitrogen stocks were elevated in cropland (2.66 Mg/ha) versus excluded forest and pasture (2.04 Mg/ha). Soil texture, electrical conductivity, phosphorus, and potassium concentrations differed significantly among land use types (p<0.05). Excluded forests showed the highest calcium and magnesium concentrations, while croplands exhibited elevated phosphorus and potassium levels due to fertilization practices. These findings demonstrate that grazing exclusion enhances soil carbon sequestration in tropical dry forests and highlight the importance of forest conservation strategies for climate change mitigation.
1 Introduction
Deforestation, fragmentation, and overgrazing represent the main drivers of global change, affecting ecosystem functioning and biodiversity conservation (1). In drylands, grazing constitutes the predominant land use (2), with global livestock grazing pressures projected to increase by up to 70% by 2050 (3). This intensification poses significant challenges for ecosystem management and conservation, particularly in vulnerable dry forest ecosystems. This intensification poses significant challenges for ecosystem management and conservation, particularly in vulnerable dry forest ecosystems.
Intensive grazing significantly modifies ecosystem structure, composition, and functions in dry forests, with cascading effects on multiple components. At the vegetation level, grazing modifies plant cover, biomass, and species richness (4), while simultaneously altering multiple physical and chemical soil properties including bulk density, moisture, pH, and nutrient content (5). Recent studies have demonstrated that these modifications also disrupt microbial communities and soil enzyme activities crucial for nutrient cycling and carbon stabilization processes (6). Overgrazing creates particularly problematic nutrient imbalances through heterogeneous redistribution patterns. Animals consume vegetation containing essential nutrients and subsequently concentrate their droppings in specific areas, resulting in enriched zones and depleted ones (5). While moderate grazing can stimulate nitrogen mineralization through nitrogen-rich waste products (7), high-intensity and long-term grazing slows down nitrogen cycles by reducing nitrogen-rich species and increasing nitrogen-poor species (8).
The physical impacts of overgrazing extend to fundamental soil properties and ecosystem services. Overgrazing deteriorates topsoil structure, alters pore distribution, increases bulk density, and decreases soil aggregate stability and infiltration rate (9). Advanced imaging techniques have revealed that these modifications lead to significant alterations in soil pore networks and hydraulic conductivity, with cascading effects on water retention and plant-available water (10). These changes compromise soil carbon sequestration potential and ecosystem resilience to climate change (11). Establishing fenced areas to exclude domestic livestock grazing has emerged as an effective strategy to counteract forest degradation (12, 13). This approach promotes plant productivity, species richness, and soil fertility (14, 15). Recent long-term studies demonstrate that grazing exclusion can significantly enhance soil carbon sequestration, with accumulation rates between 0.35 and 0.72 Mg C ha-1 yr-1 depending on climatic conditions and initial degradation status (16, 17).
Despite growing evidence of grazing exclusion benefits, significant knowledge gaps remain regarding the comparative effects of different land management practices on soil properties and carbon dynamics in Neotropical dry forests. Most previous studies have focused on temperate or subtropical systems, with limited research quantifying soil physical and chemical responses to grazing exclusion in the specific climatic and edaphic conditions of South American dry forests. Furthermore, few studies have simultaneously compared excluded forests, grazed pastures, and croplands within the same landscape context, making it difficult to establish clear management recommendations for ecosystem restoration. The spatial heterogeneity of grazing effects, strongly modulated by topography, soil texture, and precipitation patterns (18), requires landscape-specific assessments to develop effective management strategies for dry forest conservation and restoration.
Despite growing evidence of grazing exclusion benefits, significant knowledge gaps remain regarding the comparative effects of different land management practices on soil properties and carbon dynamics in Neotropical dry forests. Most previous studies have focused on temperate or subtropical systems, with limited research quantifying soil physical and chemical responses to grazing exclusion in the specific climatic and edaphic conditions of South American dry forests. Furthermore, few studies have simultaneously compared excluded forests, grazed pastures, and croplands within the same landscape context, making it difficult to establish clear management recommendations for ecosystem restoration.
The spatial heterogeneity of grazing effects, strongly modulated by topography, soil texture, and precipitation patterns (18), require landscape-specific assessments to develop effective management strategies for dry forest conservation and restoration. Our study addresses these knowledge gaps by analyzing the effects of grazing exclusion on soil properties and ecosystem services in dry forests of southern Ecuador.
Specifically, we aimed to (1): quantify and compare soil physical and chemical properties (texture, bulk density, pH, electrical conductivity, and nutrient content) across three distinct land management types: excluded forest, non-excluded pastures, and croplands (2); determine how soil carbon and nitrogen stocks vary among these land use types; and (3) evaluate the soil’s carbon sequestration potential under different management regimes. This comparative approach provides essential information for understanding soil capacity to store carbon and nitrogen under different management practices, contributing to evidence-based restoration strategies and climate change mitigation efforts in Neotropical dry forests.
2 Materials and methods
2.1 Study site
This study was conducted in the Zapotillo county (cantón Zapotillo in Spanish), located in Loja province, in the southern of Ecuador. Specifically, we set our experimental plots in the Palo Santo valley (4◦ 19′ S, 80◦ 17′ W) which gets its name from the vernacular denomination of this tree species (15). The mean annual temperatures vary between 18°C and 26°C; and annual precipitation ranges from 660 to 1300 mm. Climate presents two distinct seasons, a dry one that goes from May to November and a rainy period from December to April (19). Many of the forest species of this dry forest suffer great anthropogenic pressure, for instance tree species such as Handroanthus chrysanthus, Terminalia valverdeae and Loxopterygium huasango are cut down for their valuable wood (20) whereas browsing of goats mainly affects species such as Bursera graveolens, Eriotheca ruiz, Cochospermun vitifolium, among others (21).
Within the Palo Santo valley, a representative fraction (35 ha) of dry forest was fenced off in 2010 by the (22). The fence, which excludes the presence of cattle, goats and white- tailed deer (Odocoileus virginianus), is made of 9 lines of barbed wire, with a distance between posts of around 75 cm, and it has an average height of 1.5 m. This fence was installed as an urgent measure trying to guarantee the conservation of this dry forest and reversing its regeneration collapse. In 2018, eight years after the installation of the fences, we established a 100 × 100 m plot (F1) in the more accessible zone of the exclusion area, and then we located another two (F2 and F3) in a way to avoid any plot being less than 300 m apart from each other (this is about the maximum distance that can be achieved between three 100 × 100 m plots within the fenced area: see Figure 1). We established another three plots (U1, U2, U3) outside of the fenced area, following the same 300 m rule but also avoiding that they were more than 250 m apart from the fence (see details in 15).
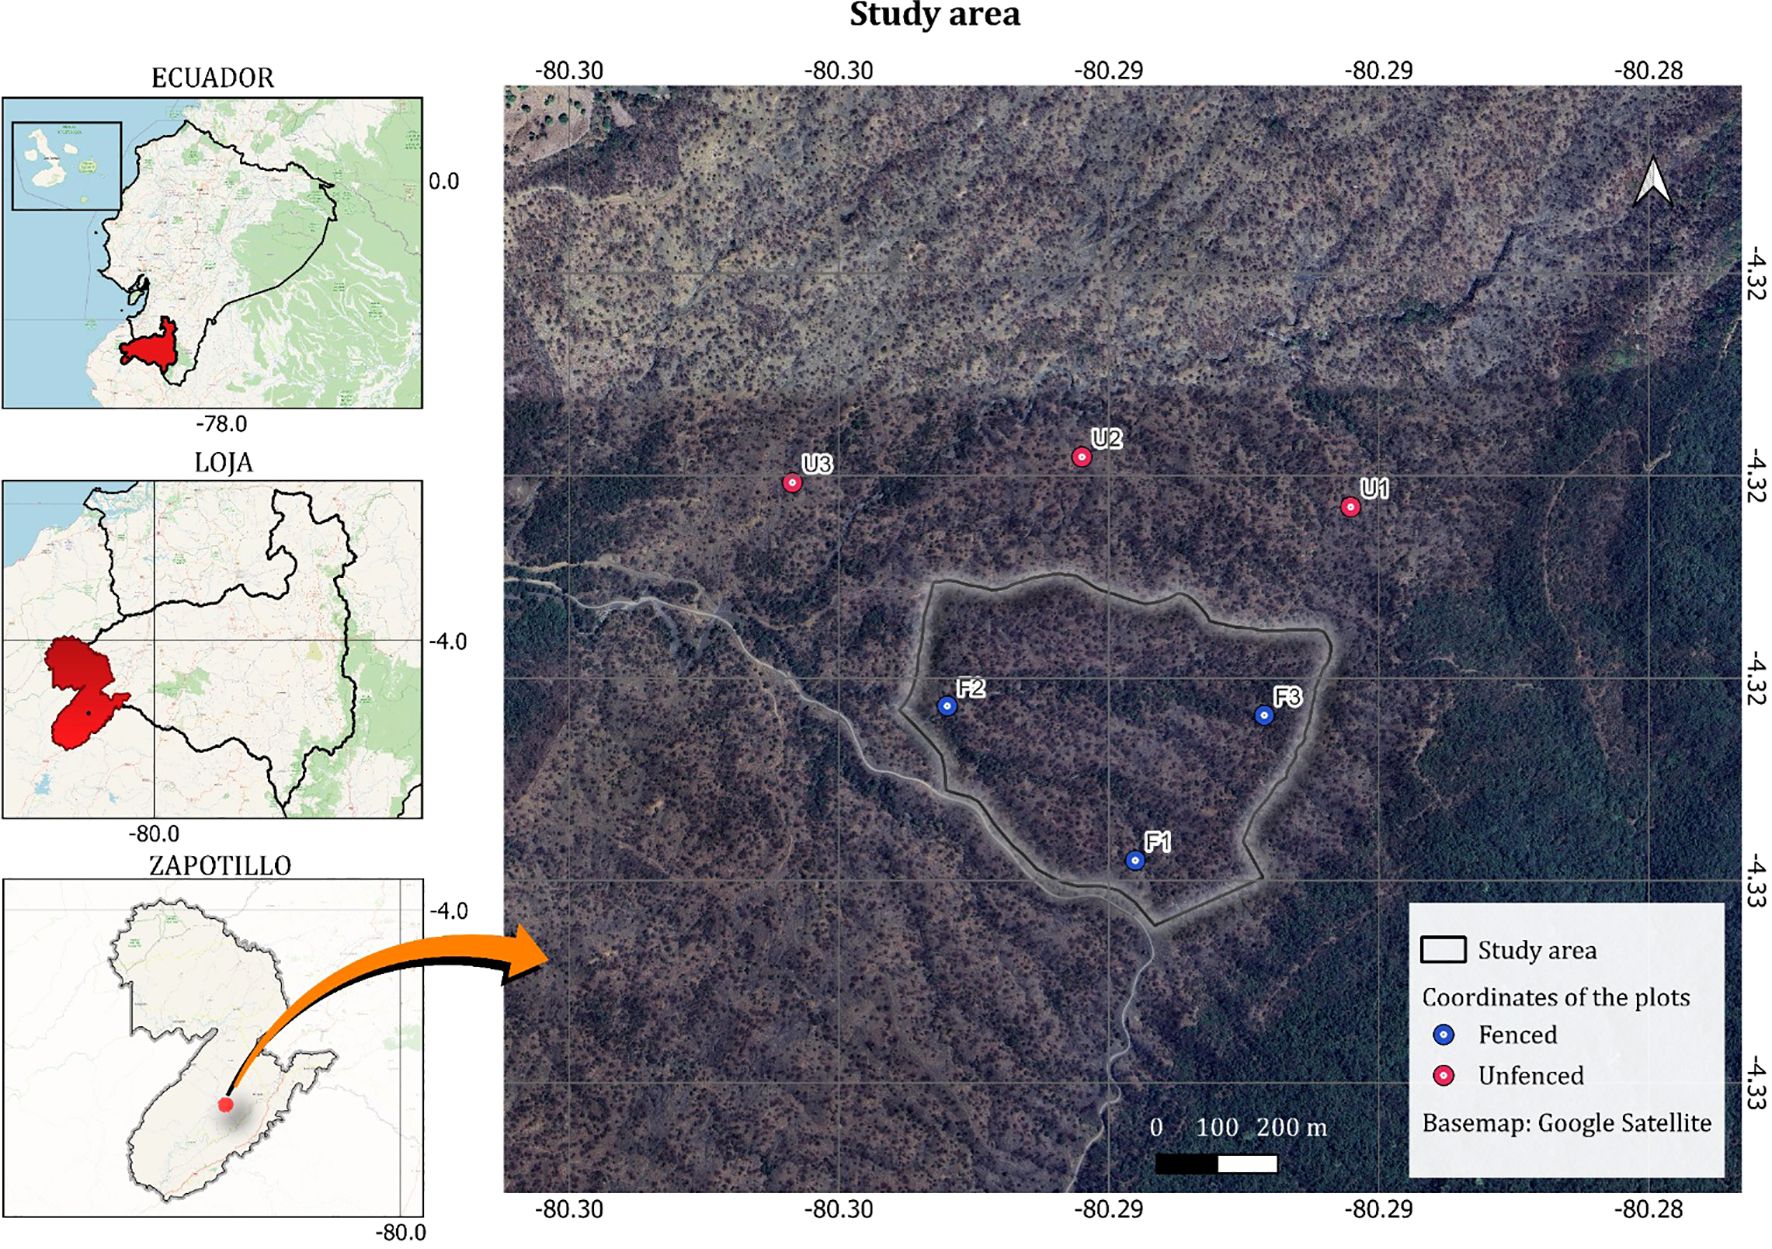
Figure 1. Plots location in the Zapotillo experimental field site (Valle de Palo Santo), in a dry Forest in southeastern Ecuador. Red and green points indicate unfenced (not excluded) and fenced (excluded) plots, respectively.
The excluded zone represents the area with the highest degree of conservation, characterized by restricted livestock access, which favors the natural regeneration of vegetation cover, the recovery of soil structure, and the restoration of soil biodiversity (21). In contrast, the non-excluded zone is subject to extensive grazing, mainly by goats, and has limited implementation of soil management and conservation practices, which increases the risk of degradation. In the surrounding agricultural areas, corn, rice, onions, beans, and grapes are mainly grown using conventional systems that include the use of synthetic fertilizers and pesticides, with limited adoption of sustainable strategies. According to (23), less than 40% of producers apply soil conservation practices, including fallowing and the incorporation of organic waste. According to local perception, the soils are considered fertile, although they are shallow and predominantly brown and black in color, indicating some accumulation of organic matter in the surface horizons.
2.2 Soil sampling and analysis
Additional to the forest zones, we also sampled in a crop zone (Zea mays L.), to compare the soil properties and establish differences with soil under grazing. Soil sampling was limited to 0–10 cm depth to focus on the most active soil layer where recent management impacts are most pronounced and where the majority of fine root biomass and organic matter inputs occur in tropical dry forest ecosystems (24). Also, we took 75 soil samples (total 225), for each study area, using a 10-cm-deep borehole. To determine the bulk density, a 5 cm diameter cylinder was used at a depth of 10 cm. Approximately 1 kg of soil was taken from each sample for physical-chemical analysis at 10 cm and an undisturbed sample for bulk density.
Samples obtained in the field were air-dried and passed through a 2-mm sieve. Once the samples were processed, C was analyzed using the calcination or ignition method (25). Nitrogen was determined by the Kjeldahl method modified by (26). To determine the reserves of C and N, the (27) equation was used, which considers the value of C or N, the depth, and the apparent density of each sample. Soil carbon and nitrogen stocks were calculated using the equation from (27):
Where:
C or N concentration = percentage of carbon or nitrogen content
Bulk density = soil bulk density at sampling depth
Depth = sampling depth (10 cm)
100 = conversion factor to express results in Mg/ha
Soil organic matter was determined using the loss-on-ignition method (25). Carbon content was estimated from organic matter using the conversion factor of 0.58 (organic carbon = organic matter × 0.58), based on the assumption that organic matter contains approximately 58% carbon (28).
The texture was also analyzed using the Bouyoucus method (29), bulk density (weight/volume) (30), pH soil: water ratio 1:2.5, The soil electrical conductivity (CE) was determined by the conductometer method, phosphorus by the method (31). Potassium, calcium, and magnesium were analyzed by Atomic Absorption (PEE/SFA/12) in the INIAP (National Institute for Agricultural Research) laboratory.
2.3 Statistical analysis
Statistical analyses were selected based on data distribution and research objectives. The correlation between the variables carbon stocks (C), nitrogen stocks (N), and the other elements was analyzed using the Pearson correlation coefficient, if normality was not verified, the Spearman coefficient was used. To test the effect of vegetation cover (excluded - forest, non-excluded – pasture, and crops) on C and N stocks, and soil nutrients, Generalized Mixed Linear Models (GLMM) were used with a Gaussian function for normal data and a gamma function for the distribution of error when the data were positively skewed. Generalized Linear Mixed Models (GLMM) were used to account for the hierarchical structure of the data (samples nested within plots) while handling non-normal distributions. The vegetation cover was used as a fixed factor and the plot code was used as a random factor. For this, the lme4 library (32), of the R program (R Core Team 2020) was used.
A non-metric multidimensional scaling analysis (NMDS) was also carried out, where the distances of the three land uses were determined based on the edaphic variables. Also was employed to visualize patterns in soil properties across land use types, as it is robust to non-linear relationships and does not assume normal distributions. Additionally, a principal component analysis (PCA) (33) was used to observe the grouping of the different nutrients between the study areas. For this, the “prcomp” function of the stats R library was used. Principal Component Analysis (PCA) was used to identify the land use of variation in soil nutrients and reduce dimensionality for interpretation of complex multivariate relationships.
3 Results
3.1 Physical and chemical properties of the soil
Our analysis revealed significant differences in most soil properties across the three land use types (excluded forest, non-excluded pastures, and crops). While bulk density (BD) and pH showed no significant differences across all three zones, BD did exhibit significant differences (p<0.05) when comparing only excluded forest with non-excluded pastures (Table 1, Supporting Information: Supplementary Figure S1). The soil pH was slightly acidic (6.41) across all zones.
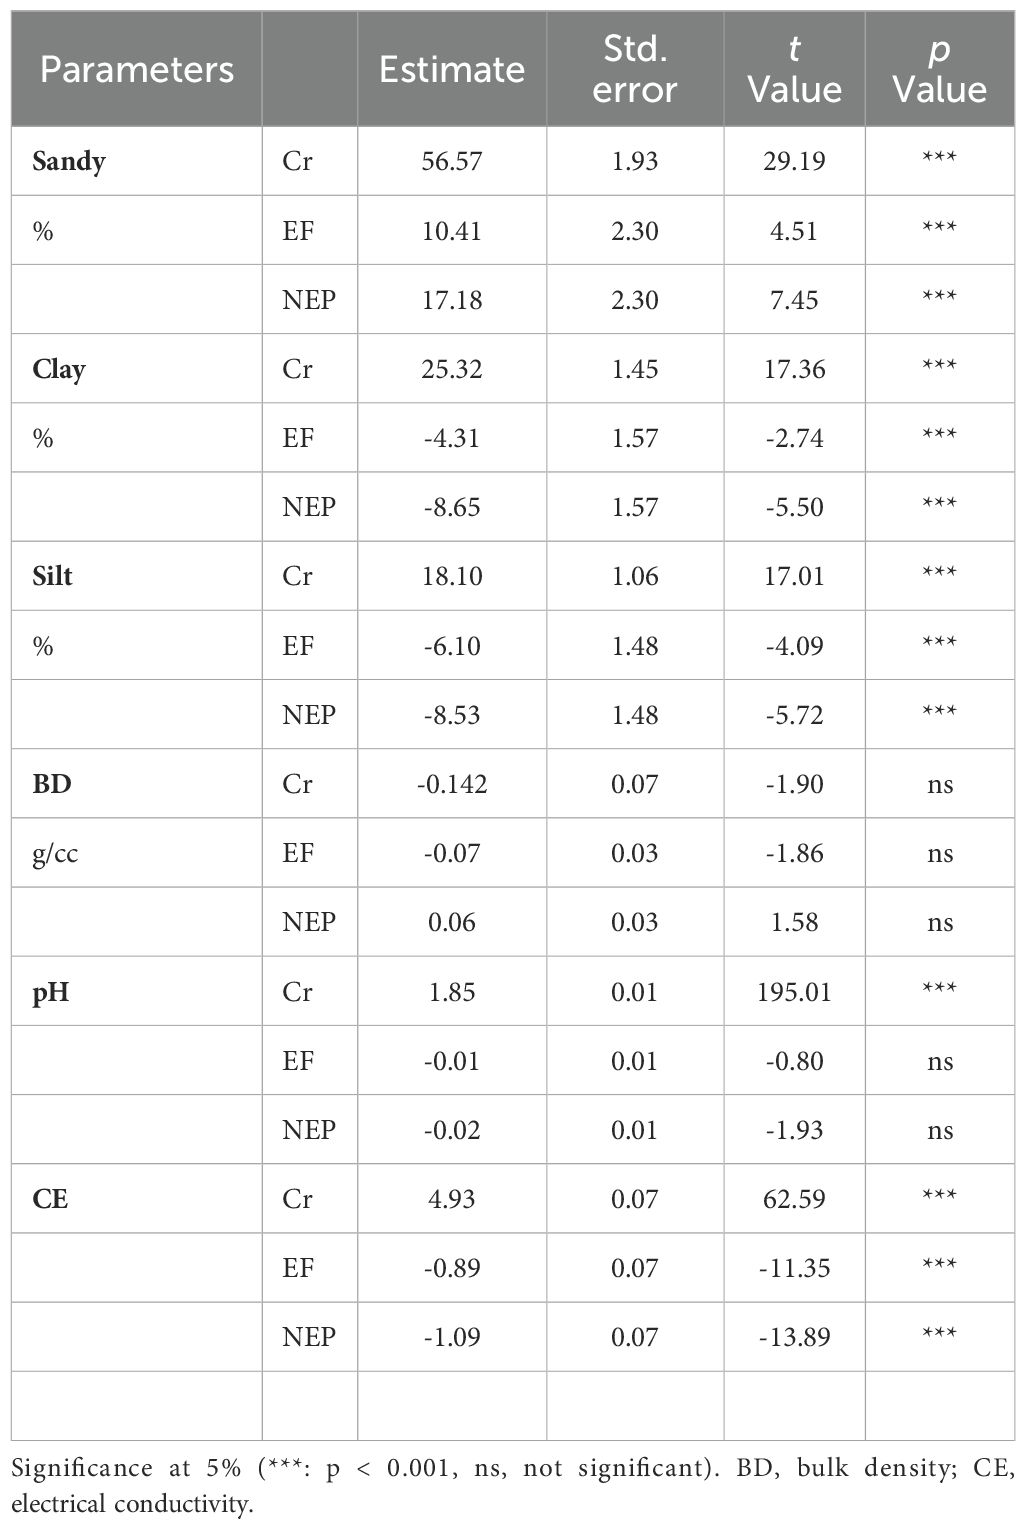
Table 1. Results of General Linear Mixed Model analyses explaining variation of the edaphic parameters in three zones (EF Excluded Forest, NEP Not excluded – pastures and Cr Crops).
Significant variations in soil texture and electrical conductivity were observed among the three study zones, with particularly notable differences between the excluded forest and non-excluded pasture areas (Table 1, Supporting Information: Supplementary Figure S1). A permutational Pearson’s Chi-square test confirmed a relationship between soil texture and zone (χ2 = 32.373, p = 0.000999), with sandy-clay loam soil occurring at higher-than-expected frequencies in the cultivation zone (Figure 2).
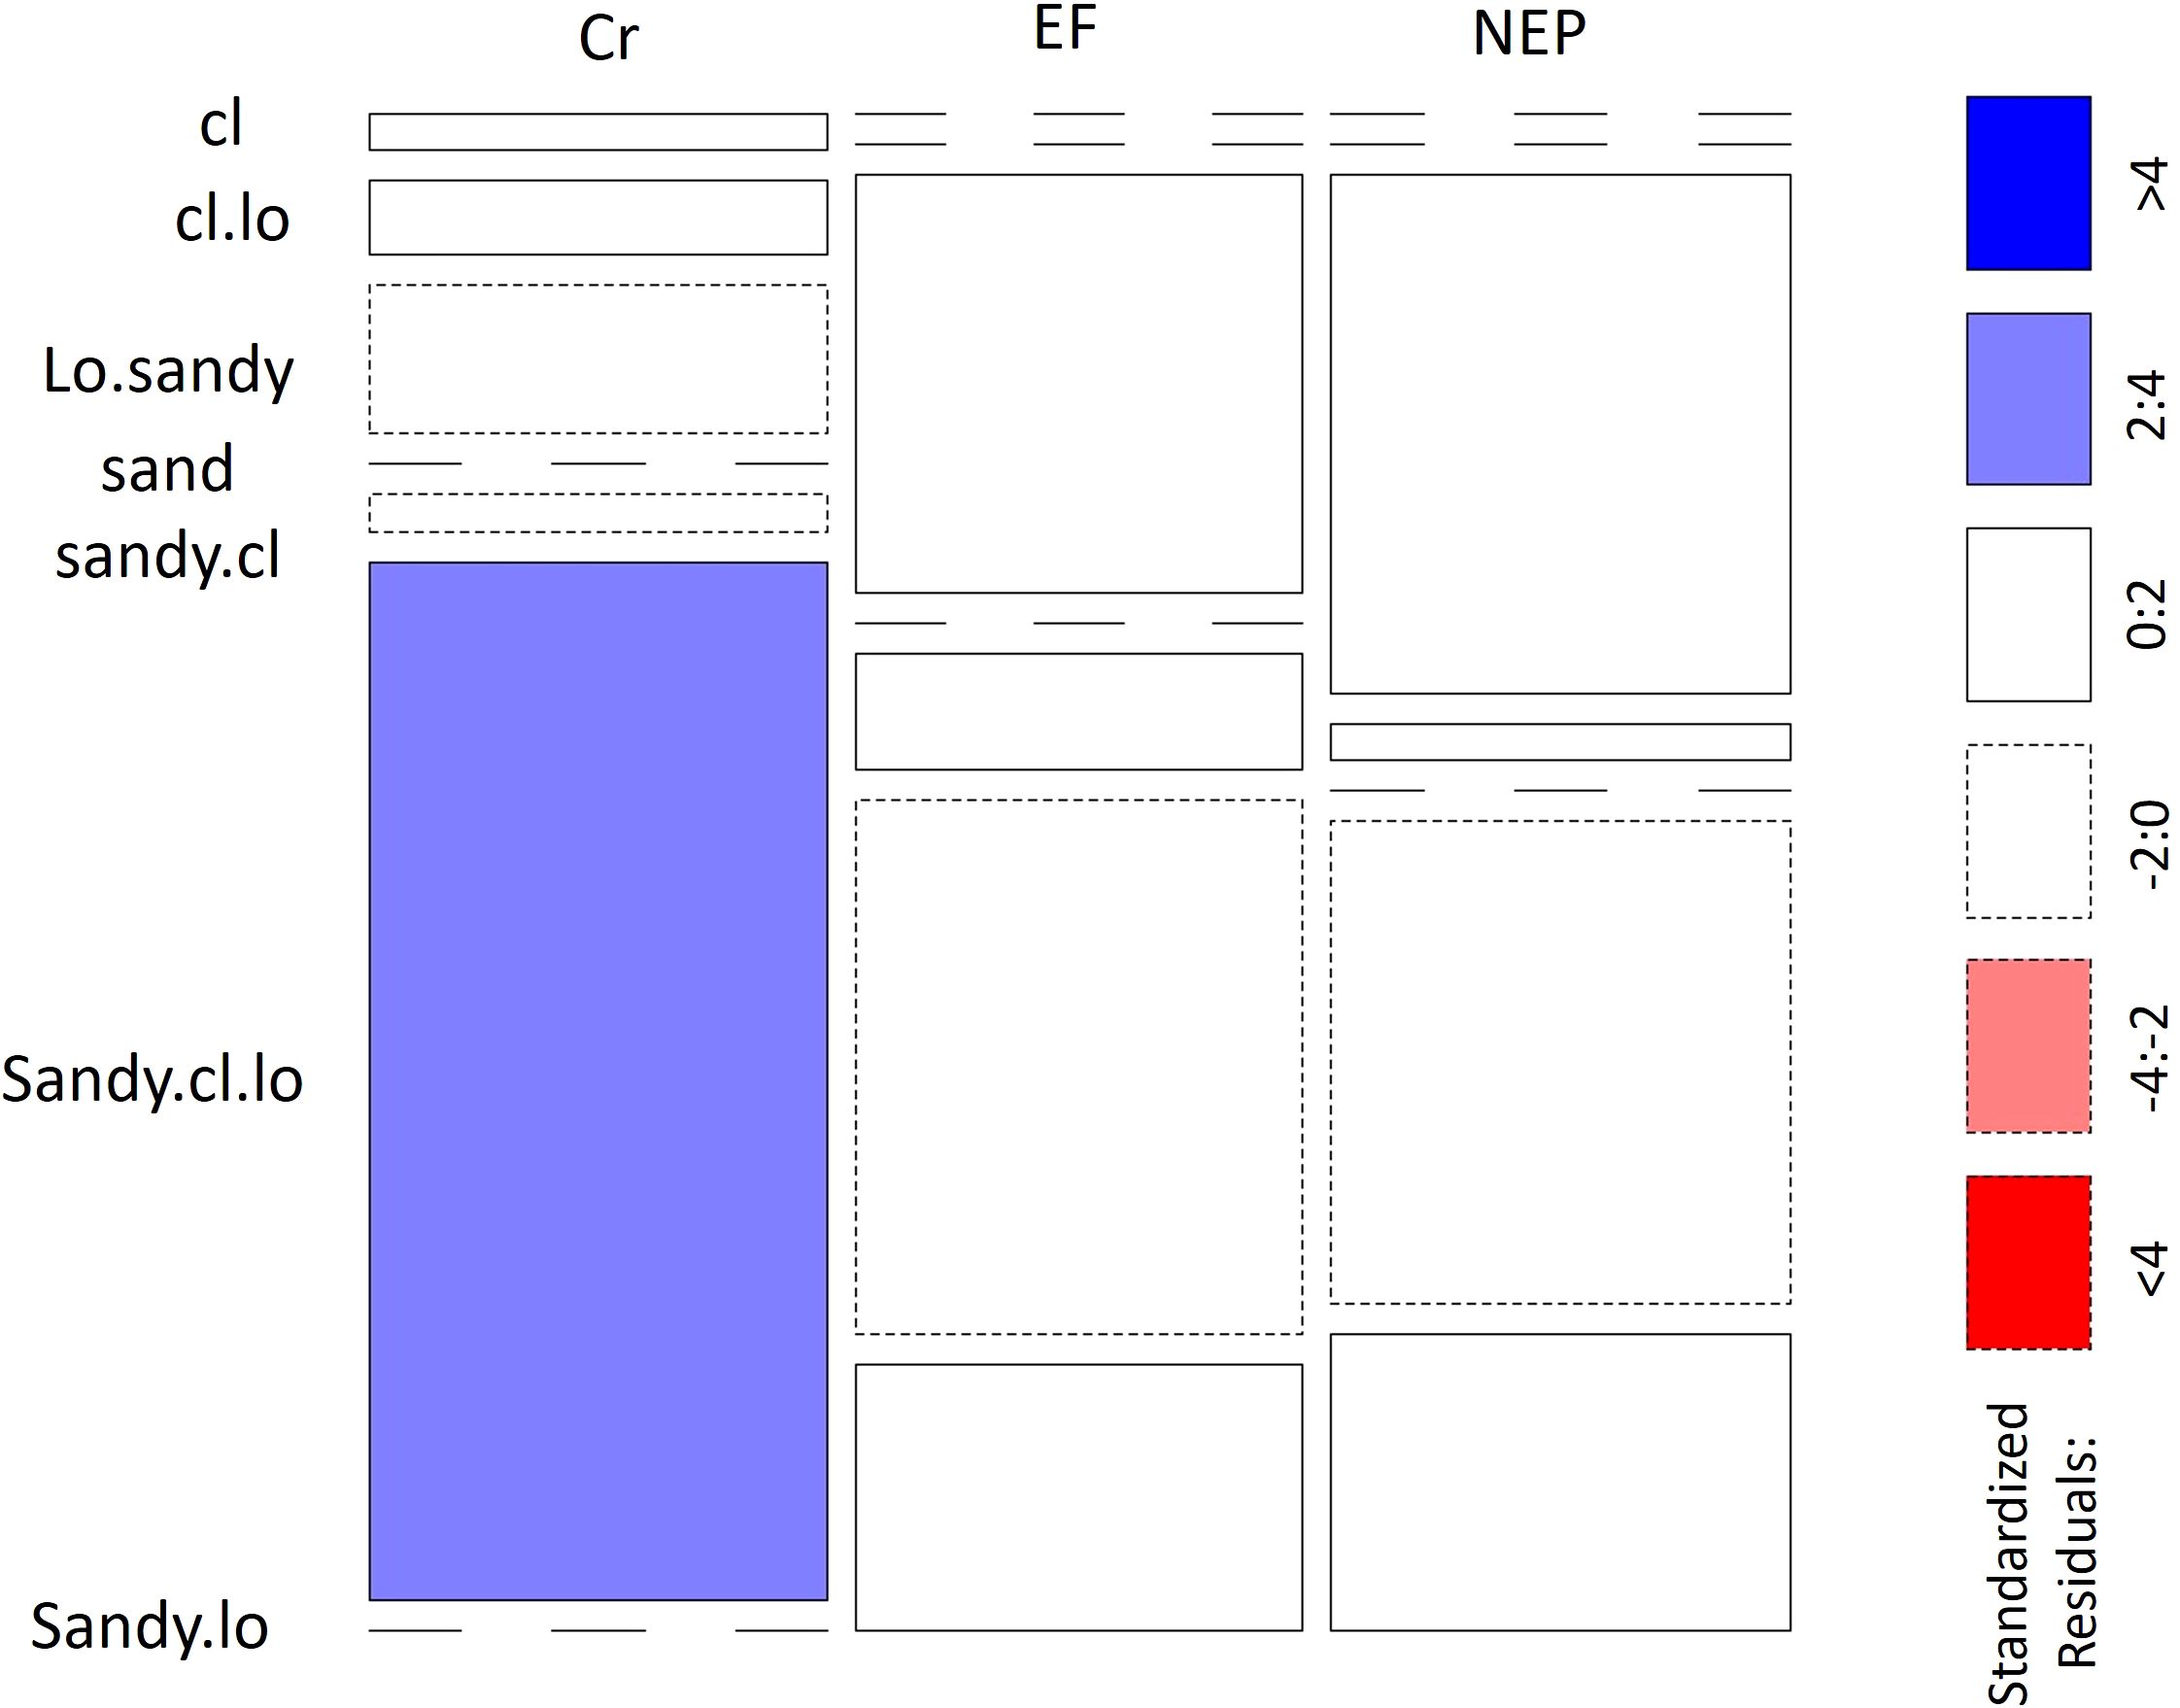
Figure 2. Relationship between zone (EF Excluded Forest, NEP Not excluded – pastures and Cr Crops) and soil texture. cl corresponds clay, lo refers loam.
While bulk density values remained similar across all three zones with no significant differences (Table 1), nutrient composition showed distinct patterns. Phosphorus and potassium content varied significantly across all three study zones, whereas calcium and magnesium concentrations were significantly elevated specifically in the cultivation zone (Table 2).
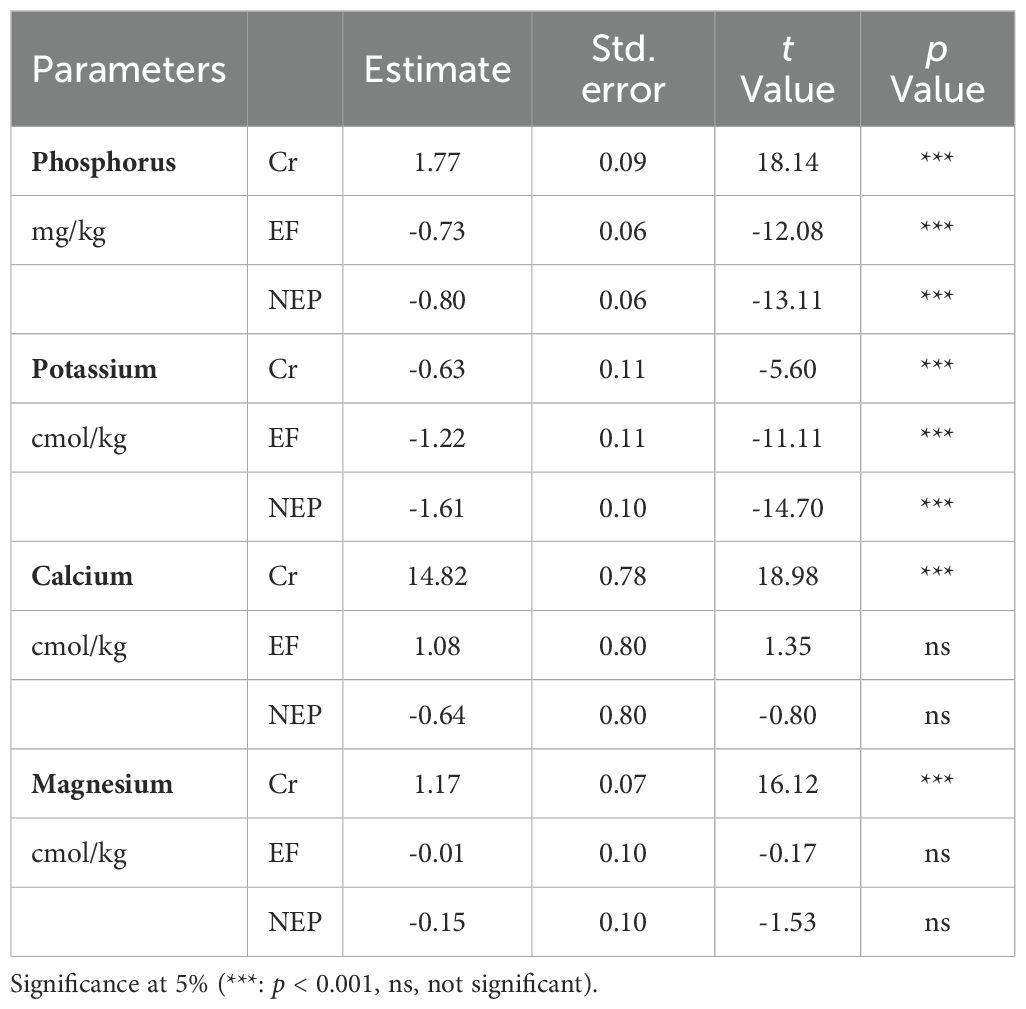
Table 2. Generalized linear mixed models for nutrients in three zones (EF Excluded forest, NEP Not excluded pastures and Cr Crops).
Correlation analysis revealed several significant relationships among soil properties. Negative correlations were observed between sand content and clay, silt, potassium, and bulk density, indicating that bulk density decreases with increasing mineral particle size. Positive correlations were found between calcium and magnesium, pH, clay, and silt, as well as between potassium and phosphorus, electrical conductivity, clay, and silt (Figure 3).
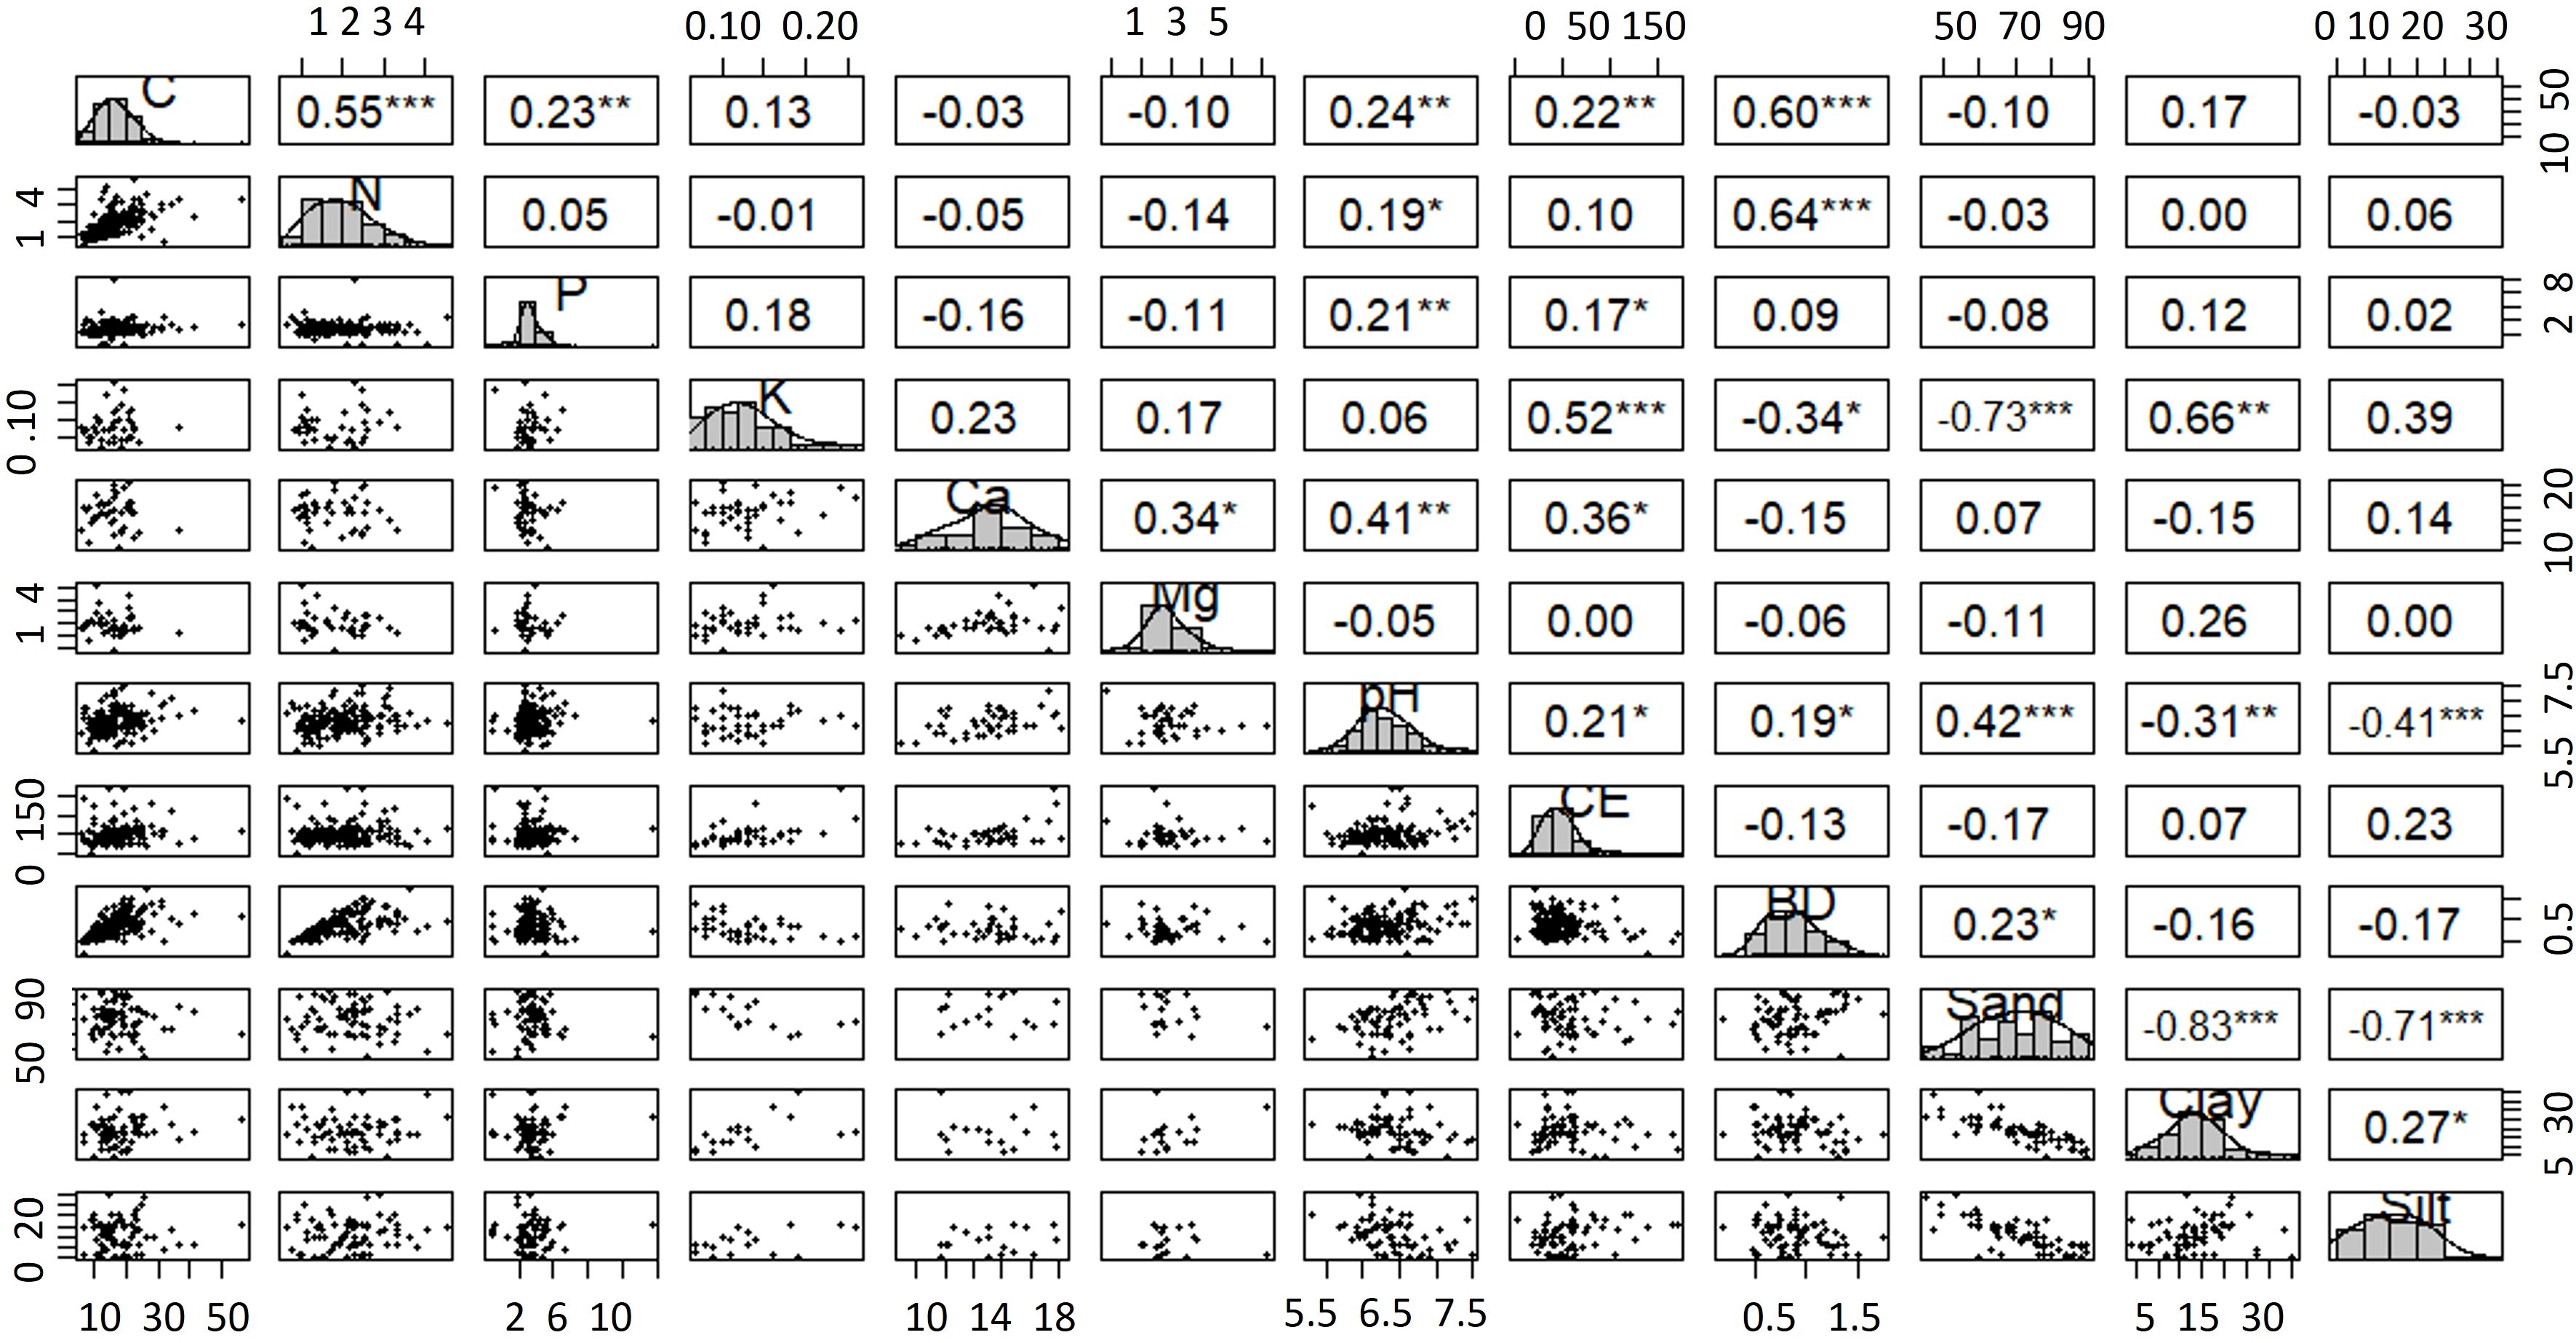
Figure 3. Significance matrix of soil nutrient correlations. P-values relative to Spearman’s rank correlation coefficient. Values p = 0, indicate significance < 0.0001. Carbon stock (C), nitrogen (N), Phosphorus (P), Potassium (K), Calcium (Ca), magnesium (Mg), pH, Electrical conductivity (CE), bulk density (BD), sand (sa), clay (cl), silt (si). *** p < 0.001 (highly significant), **p < 0.01 (very significant), *p < 0.05 (significant).
Principal component analysis identified three main components explaining soil property variations. The first component was primarily associated with carbon, phosphorus, potassium, and electrical conductivity. The second component was characterized by calcium, magnesium, and pH, while the third component was primarily associated with nitrogen, bulk density, and pH (Table 3).
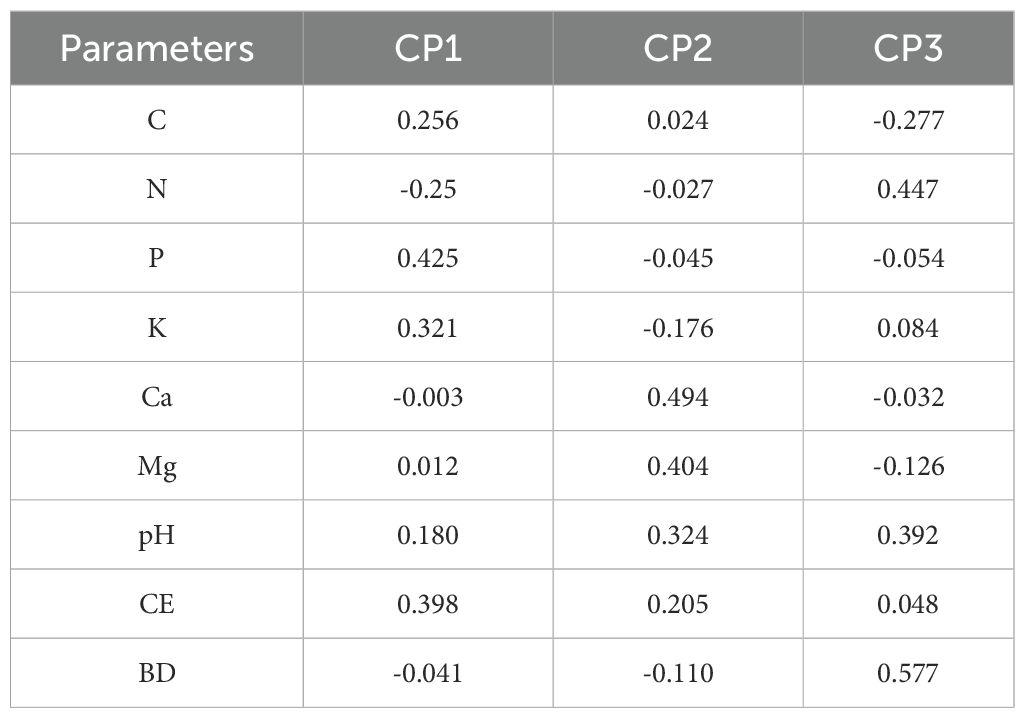
Table 3. Loadings of the physical–chemical soil properties in each principal component. Carbon stock (C), nitrogen (N), Phosphorus (P), Potassium (K), Calcium (Ca), magnesium (Mg), pH, Electrical conductivity (CE), bulk density (BD).
The NMDS ordination achieved a final stress value of 0.087, indicating good representation of the data in two dimensions. The first axis explained 48.2% of the variation and was primarily associated with fertilization-related variables (phosphorus, potassium, electrical conductivity), while the second axis (23.7% of variation) was related to soil organic matter and texture. Clear separation among land use types was observed, with cropland sites clustering separately from forest and pasture sites primarily along the first axis. Non-metric multidimensional scaling (NMDS) further supported the distinct separation of the three land use zones based on soil properties. The cultivated sites were clearly differentiated from the other zones, primarily defined by nitrogen, pH, phosphorus, and electrical conductivity (Figure 4). The excluded forest zone exhibited lower bulk density, while the cultivated zone was characterized by elevated levels of phosphorus, electrical conductivity, and nitrogen.
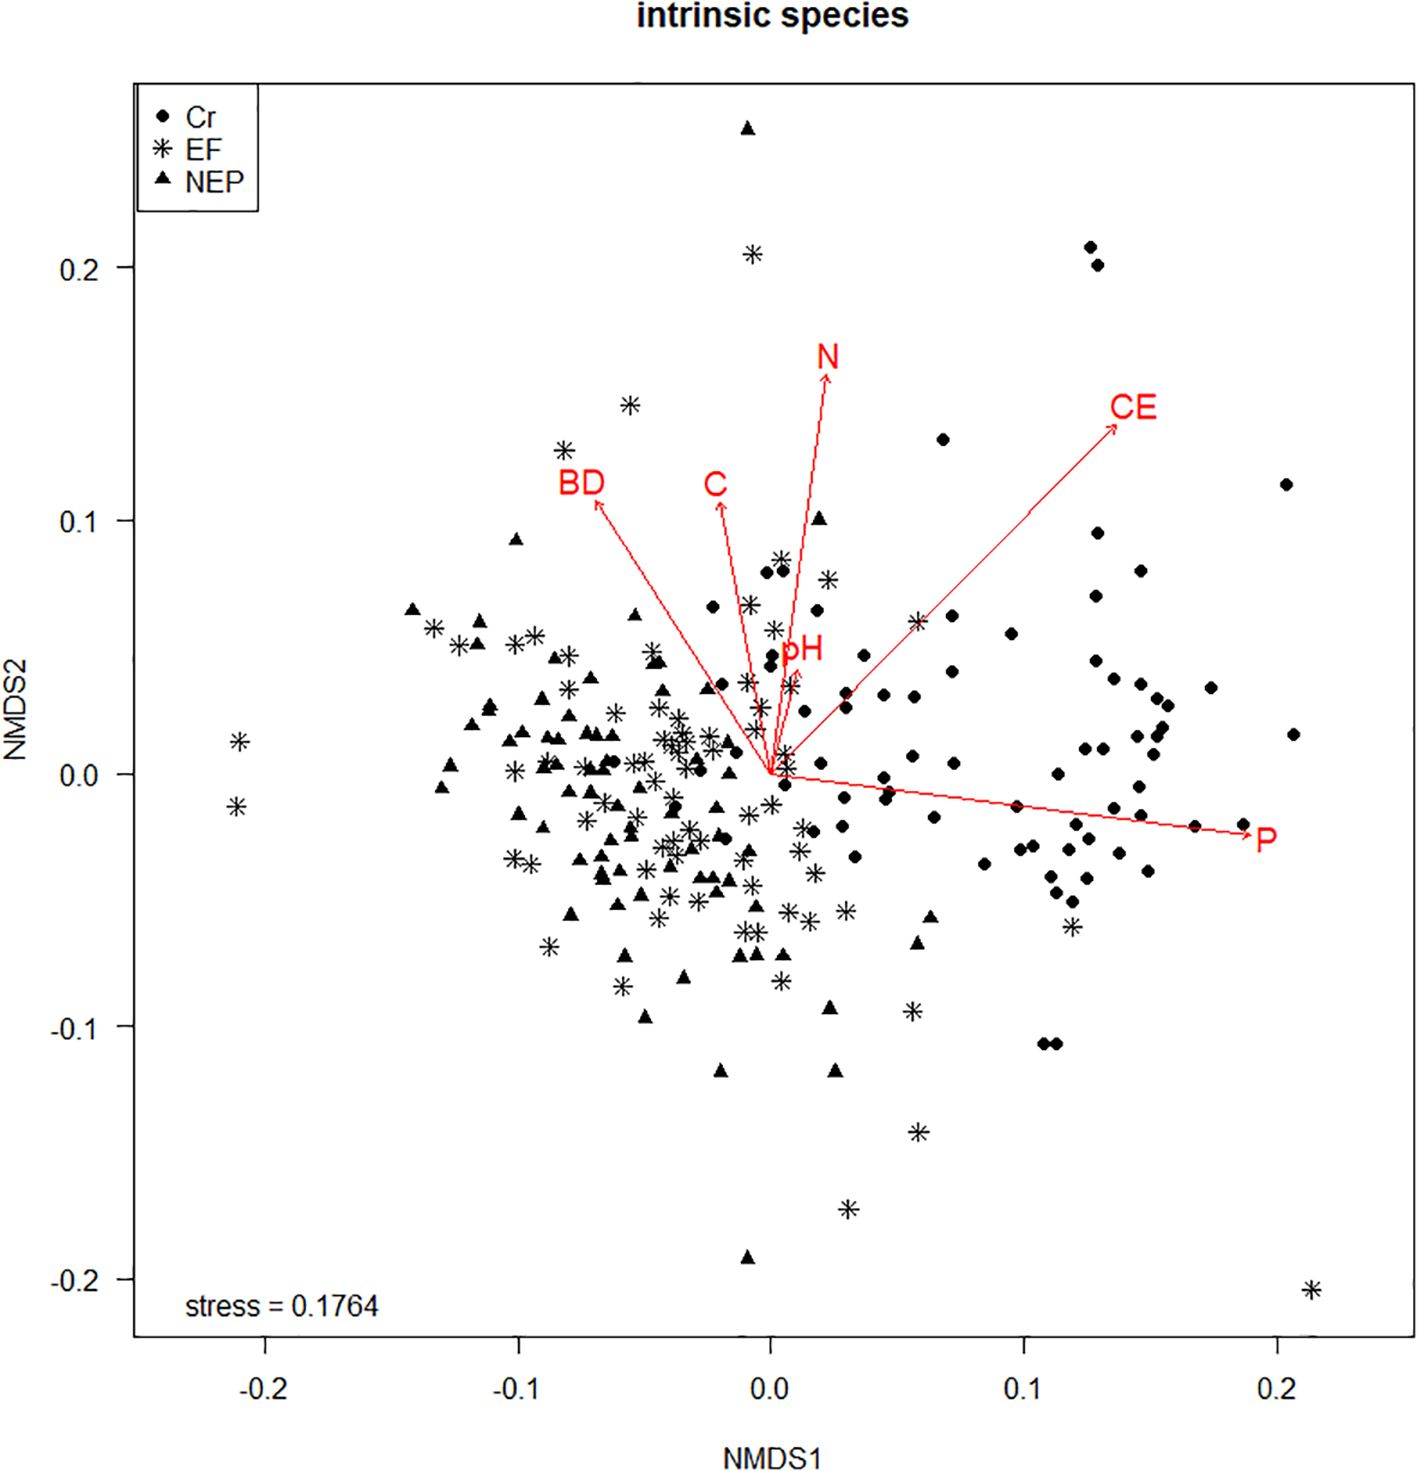
Figure 4. Non-metric multidimensional scaling (NMDS) using edaphic variables (bulk density, pH, carbon, nitrogen, phosphorus, electrical conductivity) in three land uses (EF Excluded forest, NEP Not excluded – pastures and Cr Crops).
The multivariate analyses collectively demonstrated that soil characteristics vary with vegetation cover. Agricultural practices such as fertilization in the cultivated zone and grazing by goats and cattle in the non-excluded zone appear to be important factors influencing the edaphic properties across the study area.
3.2 Soil carbon and nitrogen stocks
Soil carbon stocks were significantly higher in excluded forest (18.09 ± 2.3 Mg/ha) compared to both cropland (17.67 ± 1.8 Mg/ha; p = 0.032) and non-excluded pasture (16.61 ± 2.1 Mg/ha; p = 0.018), representing increases of 2.4% and 8.9%, respectively. (Table 4, Figure 5a, Supporting Information: Supplementary Figure S1).
Table 4. Model fit of the Generalized Linear Mixed Models of the soil carbon and nitrogen stocks in three study zones (Cr - crops, EF – excluded forest, NEP – non excluded pasture and crops).
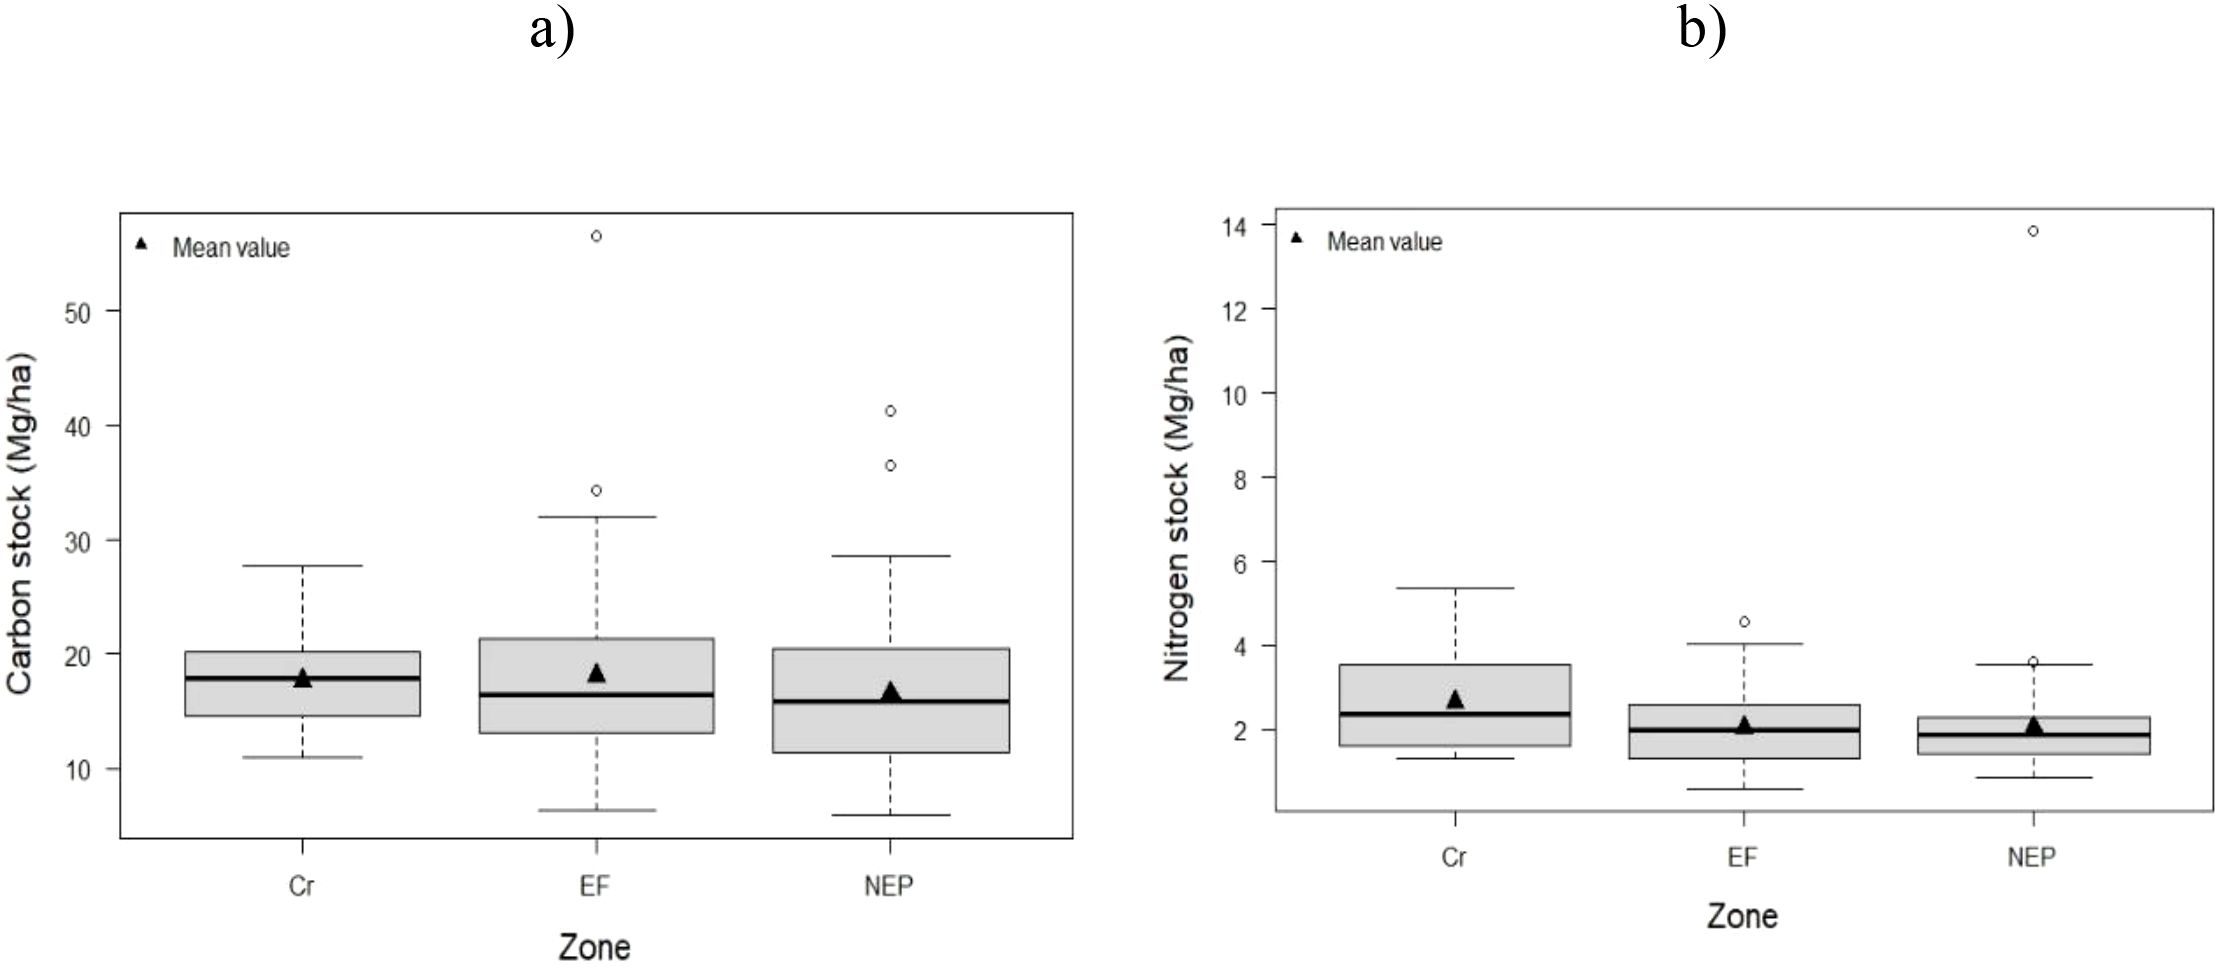
Figure 5. Distribution of soil C (a) and N (b) stocks in the study zones (EF Excluded forest, NEP Not excluded – pastures and Cr Crops).
In contrast, nitrogen stocks showed a different pattern, with the crop zone exhibiting relatively higher average values (2.66 Mg/ha) compared to both the excluded and non-excluded zones, which averaged 2.04 Mg/ha (Table 4, Figure 5b).
4 Discussion
4.1 Physical and chemical properties of the soil
Our investigation across three distinct land use zones revealed soil textural classes ranging from sandy loam to sandy clay loam, with sand as the predominant particle fraction. In the non-excluded zone, sand content exceeded 70%, this could be related to reduced moisture retention, lower fertility, and diminished water availability, consistent with findings in similar dryland ecosystems (34, 35). The excluded zone exhibited 66% sand content, while the cultivated zone showed a notable reduction to 57%. We attribute this decrease in the cultivated zone to soil preparation practices for maize cultivation that mix superficial soil layers, while intensive erosion processes in the non-excluded pasture areas likely accelerate sand fraction loss (36). The high sand percentage throughout our study area appears to result from extensive physical weathering of rocks and minerals, limiting clay formation (37) and aligning with characteristics of the region’s predominant soil orders Inceptisols, Entisols, Alfisols, and Aridisols (38) which typically exhibit coarse textures (39).
Although bulk density (BD) did not differ significantly between zones, we observed notably lower values in the excluded zone (0.81 g/cc) compared to both cultivated (0.86 g/cc) and non-excluded zones (0.93 g/cc). This pattern likely reflects greater carbon inputs from organic residues incorporated via plant biomass in the excluded zone, which increases pore space and consequently decreases BD. Conversely, in the non-excluded zone, trampling by goats and cattle typically creates bare soil surfaces with reduced root protection and organic matter incorporation, explaining the higher BD values observed.
Soil pH emerged as a critical driver of ecosystem multifunctionality in our study sites, consistent with findings from other dryland ecosystems (40). Despite the common occurrence of saline soils in regions with limited rainfall (37), our soil pH values across all zones (ranging from 6.27 to 6.41) were slightly acidic, providing optimal conditions for regionally important crops. This pH range facilitates nutrient availability for plants (39), representing an important edaphic factor for agricultural productivity in the region. We observed that extensive livestock grazing tended to acidify soil in dry areas, while forested areas decreased soil pH due to accumulated leaf litter. The cultivated zone exhibited higher pH values compared to other zones, likely influenced by specific agricultural management practices employed by local farmers.
Our analysis of soil nutrients revealed that phosphorus and potassium concentrations showed statistically significant differences among the study zones, with highest values recorded in the maize cultivation zone. Despite crop uptake typically reducing these nutrients, fertilizer applications partially replenish soil nutrient pools, leading to rapid increases following application (41). The application of nitrogen fertilizers can improve soil phosphorus availability by activating various biological mechanisms. Nitrogen stimulates microbial growth and the production of organic acids by roots, which favors the solubilization of fixed phosphorus, especially in dry soils (8, 42). Furthermore, increased plant biomass generates more root exudates, intensifying rhizosphere activity and the release of available phosphate (43, 44). Our results indicate that these soils are predominantly sandy, so the application of nitrogen and phosphate fertilizers is essential, complemented by organic amendments, to maintain fertility and optimize crop yields (37).
4.2 Soil carbon and nitrogen stocks
Soil carbon stocks were highest in the excluded zone, consistent with our hypothesis and supporting evidence that forests containing diverse species more effectively sequester soil carbon (45). These areas benefit from protection provided by root systems and accumulated leaf litter, creating favorable conditions for carbon accumulation. Both grazed and cultivated zones exhibited significantly lower carbon stocks compared to the conserved zone, which we attribute to persistent grazing pressure and the extended dry seasons characteristic of these forests limiting organic matter inputs to soil. Additionally, unregulated management practices and reduced vegetation cover contribute to diminished carbon content in these areas (46). Although greenhouse gas emissions were not measured directly, our findings contribute to the broader understanding that reductions in soil carbon stocks can lead to increased emissions, as suggested by the positive relationship between soil carbon content and CO2 fluxes reported in previous studies (47, 48).The relationship between land use change and carbon dynamics was further illustrated by our results, which align with (48), who demonstrated in Ghana that maize-cultivated soils stored less carbon and emitted 30-46% more CO2 compared to soils in forested areas. Our data provide additional evidence of how land use changes significantly influence carbon storage, particularly when comparing natural ecosystems to agricultural systems in tropical dry forests. This information could be complemented in the future with direct measurements of greenhouse gas emissions (49).
Our results extend previous research documenting negative impacts of agriculture on carbon stocks (4, 47) and demonstrate an important relationship between crop type and carbon sequestration. We found that perennial crops such as cocoa and coffee facilitate greater carbon storage than annual crops such as maize and rice, which sequester minimal CO2 due to their conventional seasonal management, as observed in our study area (50). Where agricultural activities cannot be discontinued due to socioeconomic constraints, our findings suggest that preserving soil fertility and promoting organic matter additions becomes critical to prevent carbon losses. This strategy aligns with (51), who observed that incorporating 1000 kg/ha of organic carbon into soil can increase rice yields by 10–50 t/ha and maize yields by 30–300 t/ha, demonstrating potential synergies between carbon sequestration and agricultural productivity.
Unlike the patterns observed for carbon, our results revealed that the highest soil nitrogen stocks were concentrated in the crop zone, surpassing the other areas evaluated. This finding, although unexpected, can be explained by the anthropogenic input of nitrogen derived from the frequent use of fertilizers in the agricultural systems of the study area. Farmers regularly apply nitrogen and compound fertilizers (Urea or NPK) to improve crop nutrition, which contributes to nitrogen enrichment in agricultural soils. Similar results have been reported by (52), who observed that fertilizer application significantly increased nitrogen content in semi-arid soils in China. Similarly, studies such as that of (53) also showed that omitting fertilization for four years reduced soil nitrogen accumulation to less than 60 kg/ha, highlighting the importance of agronomic management in soil nitrogen dynamics.
The sandy texture characterizing our study soils presents particular challenges for nitrogen retention. Under irrigated conditions, several studies have shown that nutrients from applied fertilizers can be easily lost through percolation and leaching (54). In this context, it has been suggested that split fertilizer application is a more efficient strategy compared to conventional practices, allowing for better synchronization between nutrient availability and crop demand, thereby reducing losses and improving nutrient use efficiency. Under irrigated conditions, several studies have shown that nutrients from applied fertilizers can be easily lost through percolation and leaching (54).
4.3 Management implications and sustainable development
In the semi-arid regions, we studied, resources particularly nitrogen and water are inherently limited (46, 55). This constraint characterizes our study areas, which experience extended dry seasons lasting approximately seven months annually. These lands support both livestock grazing and crop cultivation, creating significant differences in resource retention across the three land use zones we compared.
Our findings have important implications for management practices in this region, where cattle ranching and agriculture constitute the primary income sources for local residents. These activities, while economically essential, pose substantial threats to natural habitats as demonstrated by our comparative analysis of soil properties. Our results highlight the urgent need for implementing strategies that balance biodiversity conservation with agricultural productivity (56). Based on our findings, we recommend several approaches for the sustainable development of agricultural systems in dryland ecosystems: implementing more efficient fertilizer and agricultural input management, developing agroforestry systems, establishing live and dead hedgerows, transitioning to perennial crops, and incorporating organic residues (55).
Additionally, our study suggests potential for diversifying income sources through activities such as ecotourism including guided tours to appreciate Handroanthus sp. blooms and bicycle excursions which could promote a sustainable development model that integrates environmental conservation with community economic welfare (57). Based on the significant differences in soil properties we observed across land use zones, we emphasize that effective communication networks connecting farmers, academic institutions, and other organizations are fundamental to implementing successful soil conservation programs in similar dryland ecosystems.
5 Conclusion
Land use significantly influences critical soil properties including texture (proportions of sand, silt, and clay), pH, and electrical conductivity. These properties not only determine soil fertility and productivity but also regulate ecosystem functions and the capacity to support diverse vegetation communities and anthropogenic activities. Our findings indicate although the change of soil carbon stock is not significant (or only the difference between EF and Cr is significant), there is a significant difference in nitrogen stock between vegetation cover types.
We recommend promoting forest conservation initiatives and, for disturbed areas such as agricultural lands, implementing management practices that enhance soil carbon and nitrogen sequestration while maintaining fertility as strategies to mitigate global warming.
Despite the ecological significance of these relationships, data regarding carbon and nitrogen pools and soil nutrient dynamics across different land cover types remain limited. Additional research is needed to develop comprehensive models that can inform sustainable land management policies tailored to dry forest ecosystems in southern Ecuador and similar regions globally.
Data availability statement
The original contributions presented in the study are included in the article/Supplementary Material, Further inquiries can be directed to the corresponding author.
Author contributions
LJ: Supervision, Funding acquisition, Conceptualization, Methodology, Writing – review & editing, Writing – original draft, Investigation, Validation. PR: Writing – original draft, Formal analysis, Methodology, Data curation, Conceptualization, Writing – review & editing. JS: Methodology, Investigation, Data curation, Writing – original draft. JB: Validation, Writing – review & editing, Methodology, Investigation. JG: Investigation, Writing – review & editing, Methodology. EG: Conceptualization, Validation, Funding acquisition, Methodology, Supervision, Investigation, Writing – review & editing, Writing – original draft.
Funding
The author(s) declare financial support was received for the research and/or publication of this article. This research was funded by UTPL.
Conflict of interest
The authors declare that the research was conducted in the absence of any commercial or financial relationships that could be construed as a potential conflict of interest.
Generative AI statement
The author(s) declare that no Generative AI was used in the creation of this manuscript.
Any alternative text (alt text) provided alongside figures in this article has been generated by Frontiers with the support of artificial intelligence and reasonable efforts have been made to ensure accuracy, including review by the authors wherever possible. If you identify any issues, please contact us.
Publisher’s note
All claims expressed in this article are solely those of the authors and do not necessarily represent those of their affiliated organizations, or those of the publisher, the editors and the reviewers. Any product that may be evaluated in this article, or claim that may be made by its manufacturer, is not guaranteed or endorsed by the publisher.
Supplementary material
The Supplementary Material for this article can be found online at: https://www.frontiersin.org/articles/10.3389/fsoil.2025.1617798/full#supplementary-material
Supplementary Figure 1 | Soil property differences between grazing-excluded and non-excluded pastures in the study area.
References
1. Tapia-Armijos M, Homeier J, Espinosa C, Leuschner C, and de la Cruz M. Deforestation and forest fragmentation in South Ecuador since the 1970s – losing a hotspot of biodiversity. PloS One. (2015) 10:e0133701. doi: 10.1371/journal.pone.0133701
2. Maestre FT, Eldridge DJ, Soliveres S, Kéfi S, Delgado-Baquerizo M, Bowker MA, et al. Structure and functioning of dryland ecosystems in a changing world. Annu Rev Ecology Evolution Systematics. (2016) 47:215–37. doi: 10.1146/annurev-ecolsys-121415-032311
3. Food and Agriculture Organization. Livestock in the balance. FAO (2009). Available online at: https://openknowledge.fao.org/server/api/core/bitstreams/fd5a953a-1a36-4147-8062-e5e495e68e63/content/i0680e.htm.
4. Eldridge J, Poore G, Ruiz M, Letnic M, and Soli S. Ecosystem structure, function, and composition in rangelands are negatively affected by livestock grazing. Ecol Application. (2016) 26:1273–83. doi: 10.1890/15-1234
5. Zhang M, Li G, Liu B, Liu J, Wang L, and Wang D. Effects of herbivore assemblage on the spatial heterogeneity of soil nitrogen in eastern Eurasian steppe. J Appl Ecology. (2020) 57:1551–60. doi: 10.1111/1365-2664.13655
6. Li J, Zhao L, Song C, He C, Bian H, and Sheng L. Forest swamp succession alters organic carbon composition and survival strategies of soil microbial communities. Sci Total Environment. (2023) 904:166742. doi: 10.1016/j.scitotenv.2023.166742
7. Zarekia S, Jafari M, Arzani H, Javadi SA, and Jafari A. A. Grazing effects on some of the physical and chemical properties of soil. World Appl Sci J. (2012) 20:205–12. doi: 10.5829/idosi.wasj.2012.20.02.1624
8. Shan Y, Chen D, Guan X, Zheng S, Chen H, Wang M, et al. Seasonally dependent impacts of grazing on soil nitrogen mineralization and linkages to ecosystem functioning in Inner Mongolia grassland. Soil Biol Biochem. (2011) 43:1943–54. doi: 10.1016/j.soilbio.2011.06.002
9. Liu D, Chen M, Liu H, Qi J, Yang J, Lv M, et al. The conversion of tropical natural forests alters soil carbon fractions in aggregates and reduces aggregates stability. J Environ Management. (2025) 376:124455. doi: 10.1016/j.jenvman.2025.124455
10. Zeng Y, Verhoef A, Vereecken H, Ben-Dor E, Veldkamp T, Shaw L, et al. Monitoring and modeling the soil-plant system toward understanding soil health. Rev Geophysics. (2025) 63:e2024RG000836. doi: 10.1029/2024RG000836
11. Luo Q, Bai X, Zhao C, Luo G, Li C, Ran C, et al. Unexpected response of terrestrial carbon sink to rural depopulation in China. Sci Total Environment. (2024) 948:174595. doi: 10.1016/j.scitotenv.2024.174595
12. Adler P, Raff D, and Lauenroth W. The effect of grazing on the spatial heterogeneity of vegetation. Oecologia. (2001) 128:465–79. doi: 10.1007/s004420100737
13. Trigo CB, Villagra PE, Coles PC, Marás GA, Andrade-Díaz MS, Núñez-Regueiro MM, et al. Can livestock exclusion affect understory plant community structure? An experimental study in the dry Chaco Forest, Argentina. For Ecol Management. (2020) 463:118014. doi: 10.1016/j.foreco.2020.118014
14. Sun J, Liu M, Fu B, Kemp D, Zhao W, Liu G, et al. Reconsidering the efficiency of grazing exclusion using fences on the Tibetan Plateau. Sci Bulletin. (2020) 65:1405–14. doi: 10.1016/j.scib.2020.04.035
15. Patiño J, Ramón P, Gusmán-Montalván E, Escudero A, and de la Cruz M. Fencing promotes fast recovery of demographic processes after grazing-driven collapse in Bursera graveolens forests. For Ecol Management. (2021) 499:119592. doi: 10.1016/j.foreco.2021.119592
16. Delgado-Baquerizo M. Simplifying the complexity of the soil microbiome to guide the development of next-generation SynComs. J Sustain Agric Environment. (2022) 1:9–15. doi: 10.1002/sae2.12012
17. Chen C, Li SL, Chen QL, Delgado-Baquerizo M, Guo ZF, Wang F, et al. Fertilization regulates global thresholds in soil bacteria. Global Change Biol. (2024) 30:e17466. doi: 10.1111/gcb.17466
18. Wu Z, Wang W, Zhu W, Zhang P, Chang R, and Wang G. Shrub ecosystem structure in response to anthropogenic climate change: A global synthesis. Sci Total Environ. (2024) 953:176202. doi: 10.1016/j.scitotenv.2024.176202
19. Espinosa C, Camarero J, and Gusman A. Site-dependent growth responses to climate in two major tree species from. Dendrochronologia. (2018) 52:11–9. doi: 10.1016/j.dendro.2018.09.004
20. Aguirre MZ and Kvist LP. Floristic composition and conservation status of the dry forests in Ecuador. Lyonia. (2005) 8:41–67.
21. Cueva-Ortiz J, Espinosa CI, Aguirre-Mendoza Z, Gusmán-Montalván E, Weber M, and Hildebrandt P. Natural regeneration in the Tumbesian dry forest: identification of the drivers affecting abundance and diversity. Sci Rep. (2020) 10:9786. doi: 10.1038/s41598-020-66743-x
22. Nature and Culture International. Nature and Culture International: Protecting intact forests. Recuperado el 10 de febrero de 2025 . Available online at: http://www.natureandculture.org/ (Accessed February 10, 2025).
23. Jiménez L, Jiménez W, Felicito D, Fierro N, Quichimbo P, Sánchez D, et al. Rediscovering the edaphic knowledge of smallholder farmers in southern Ecuador. Geoderma. (2022) 406:115468. doi: 10.1016/j.geoderma.2021.115468
24. Eldridge D, Delgado-Baquerizo M, Travers S, Val J, and Oliver I. Do grazing intensity and herbivore type affect soil health? Insights from a semi-arid productivity gradient. J Appl Ecology. (2017) 54:976–85. doi: 10.1111/1365-2664.12834
25. Konen ME, Jacobs PM, Burras CL, Talaga BJ, and Mason JA. Equations for predicting soil organic carbon using loss-on-ignition, soil science of america journal for north central U.S. Soils. (2002) 66:1878–1881. doi: 10.2136/sssaj2002.1878
26. Ramírez FD and R Core Team. Análisis de laboratorio de suelos y aguas. In: , Colombia SAS, editor. R: A language and environment for statistica computing. R Foundation for Statistical Computing, Vienna, Austria (2013). Available online at: https://www.R-project.org/ (Accessed October 8, 2024).
27. Lemenih M and Itanna F. Soil carbon stocks and turnovers in various vegetation types and arable lands along an elevation gradient in southern Ethiopia. Geoderma. (2004) 123:177–88. doi: 10.1016/j.geoderma.2004.02.004
29. Fernández L, Rojas N, Roldán T, Ramirez M, Zegarra H, Uribe R, et al. Análisis físicos y químicos en suelo. Manual de técnicas de análisis de suelos aplicadas a la remediación de sitios contaminados. Instituto Nacional Ecología. México D.F. (2006) pp:18 –88.
30. Burt R. Soil Survey Laboratory Methods Manual. Washington, D.C. Estados Unidos: USDA (2020). p. 700.
31. Bray RH and Kurtz LT. Determination of total, organic, and available forms of phosphorus in soils. Soil Sci. (1945) 59:39–46. doi: 10.1097/00010694-194501000-00006
32. Bates D, Maechler M, Bolker B, and Walker S. Fitting linear mixed-effects models using lme4. J Stat Software. (2015) 67:1–48. doi: 10.18637/jss.v067.i01
34. Markesteijn L, Iraipi J, Bongers F, and Poorter L. Seasonal variation in soil and plant water potentials in a Bolivian tropical moist and dry forest. J Trop Ecology. (2010) 26:497–508. doi: 10.1017/S0266467410000271
35. Plaza C, Zaccone C, Sawicka K, Méndez A, Tarquis A, Gascó G, et al. Soil resources and element stocks in drylands to face global issues. Sci Rep. (2018) 8:13788. doi: 10.1038/s41598-018-32229-0
36. Tellen VA and Yerima BPK. Effects of land use change on soil physicochemical properties in selected areas in the North West region of Cameroon. Environ Syst Res. (2018) 7:3. doi: 10.1186/s40068-018-0106-0
37. Osman K. Dryland Soils. In: Management of Soil Problems. Springer, Cham (2018). doi: 10.1007/978-3-319-75527-4_2
38. Ministerio de Agricultura y Ganadería (MAG). Geopedological map of continental Ecuador 2009–2015. In: Version Edited by the Ministry of Agriculture and Livestock (2020). Available online at: http://geoportal.agricultura.gob.ec (Accessed February 12, 2025).
39. Srinivasarao C, Vittal KPR, Venkateswarlu B, Wani SP, Sahrawat KL, Marimuthu S, et al. Carbon stocks in different soil types under diverse rainfed production systems in tropical India. Commun Soil Sci Plant Anal. (2009) 40:2338–56. doi: 10.1080/00103620903111277
40. Eldridge D, Delgado-Baquerizo M, Quero J, Ochoa V, Gozalo B, García-Palacios P, et al. Surface indicators are correlated with soil multifunctionality in global dryland. J Appl Ecology. (2019) 57:424–35. doi: 10.1111/1365-2664.13540
41. Holford ICR. Soil phosphorus: its measurement and its uptake by plants. Aust J Soil Res. (1997) 35:227–39. doi: 10.1071/S96047
42. Cui H, Sun W, Delgado-Baquerizo M, Song W, Ma JY, Wang K, et al. Cascading effects of N fertilization activate biologically driven mechanisms promoting P availability in a semi-arid grassland ecosystem. Funct Ecology. (2021) 35:1001–11. doi: 10.1111/1365-2435.13773
43. Richardson AE and Simpson RJ. Soil microorganisms mediating phosphorus availability update on microbial phosphorus. Plant Physiol. (2011) 156:989–96. doi: 10.1104/pp.111.175448
44. Zhang F, Shen J, Zhang J, Zuo Y, Li L, and Chen X. Rhizosphere processes and management for improving nutrient use efficiency and crop productivity: implications for China. Adv Agronomy. (2010) 107:1–32. doi: 10.1016/S0065-2113(10)07001-X
45. Morris SJ, Bohm S, Haile-Mariam S, and Paul EA. Evaluation of carbon accrual in afforested agricultural soils. Global Change Biol. (2007) 13:1145–56. doi: 10.1111/j.1365-2486.2007.01359.x
46. Celaya M and Castellanos A. Mineralización de nitrógeno en el suelo de zonas áridas y semiáridas. Terra Latinoamericana. (2011) 29:343–56.
47. Toru T and Kibret K. Carbon stock under major land use/land cover types of Hades sub-watershed, eastern Ethiopia. Carbon Balance Management. (2019) 14:7. doi: 10.1186/s13021-019-0122-z
48. Anokye J, Logah V, and Opoku A. Soil carbon stock and emission: estimates from three land-use systems in Ghana. Ecol Processes. (2021) 10:1–13. doi: 10.1186/s13717-020-00279-w
49. Lefèvre C, Rekik F, and Wise L. Soil organic carbon: the hidden potential. (2017). Rome, Italy: Food and Agriculture Organization of the United Nations (FAO).
50. Lapeyre T, Alegre J, and Arévalo L. Determinación de las Reservas de Carbono de la Biomasa Aérea en diferentes sistemas de uso de tierra en San Martín, Perú. Ecología Aplicada. (2004) 3:35–44.
51. Laban P, Metternicht G, and Davies J. Soil Biodiversity and Soil Organic Carbon: keeping drylands alive. Gland, Switzerland: IUCN (2018).
52. Liu Q, Xu H, and Yi H. Impact of fertilizer on crop yield and C: N: P stoichiometry in arid and semi-arid soil. Int J Environ Res Public Health. (2021) 18:4341. doi: 10.3390/ijerph18084341
53. Lei S, Raza S, Irshad A, Jiang Y, Elrys AS, Chen Z, et al. Long-term legacy impacts of nitrogen fertilization on crop yield, nitrate accumulation, and nitrogen recovery efficiency. Eur J Agronomy. (2025) . 164:127513.
54. Barzegari M, Sepaskhah AR, and Ahmadi SH. Irrigation and nitrogen managements affect nitrogen leaching and root yield of sugar beet. Nutrient Cycling Agroecosystems. (2017) 108:211–30.
55. Lal R. Managing soils and ecosystems for mitigating anthropogenic carbon emissions and advancing global food security. BioScience. (2010) 60:708–21. doi: 10.1525/bio.2010.60.9.8
56. Harvey CA, Komar O, Chazdon R, Ferguson BG, Finegan B, Griffith DM, et al. Integrating agricultural landscapes with biodiversity conservation in the Mesoamerican Hotspot. Conserv Biol. (2008) 22:8–15. doi: 10.1111/j.1523-1739.2007.00863.x
Keywords: soil fertility, nutrients, soil forest, soil carbon, grazing
Citation: Jiménez L, Ramón P, Sarango J, Burneo JI, Gusmán J and Gusmán-Montalván E (2025) Long-term grazing exclusion enhances soil carbon and nitrogen stocks in tropical dry forests of southern Ecuador. Front. Soil Sci. 5:1617798. doi: 10.3389/fsoil.2025.1617798
Received: 25 April 2025; Accepted: 18 August 2025;
Published: 03 September 2025.
Edited by:
Emmanuel Arthur, Aarhus University, DenmarkReviewed by:
Peter N. Eze, Botswana International University of Science and Technology, BotswanaYingWu Shi, Institute of Microbiology, China
Copyright © 2025 Jiménez, Ramón, Sarango, Burneo, Gusmán and Gusmán-Montalván. This is an open-access article distributed under the terms of the Creative Commons Attribution License (CC BY). The use, distribution or reproduction in other forums is permitted, provided the original author(s) and the copyright owner(s) are credited and that the original publication in this journal is cited, in accordance with accepted academic practice. No use, distribution or reproduction is permitted which does not comply with these terms.
*Correspondence: Leticia Jiménez, bHNqaW1lbmV6QHV0cGwuZWR1LmVj