 Patience Ponyane
 Ferdinand J. Dina Ebouel
 Peter N. Eze
- 1Department of Sustainable Natural Resources, Botswana International University of Science and Technology, Palapye, Botswana
- 2Division of Soil Science and Geoecology, Institute of Environmental Science and Geography, University of Potsdam, Potsdam, Germany
Land use impacts on soil aggregate stability and carbon sequestration, which are critical biogeochemical indicators of soil health, are largely understudied in semi-arid Vertisols. This study aims to bridge the gap. Here, the impacts of different land use regimes (arable land, grassland exclosures, natural exclosures, and pastures) on aggregate stability and soil organic carbon contents were investigated in the semi-arid Vertisols of the Pandamatenga Plains – an important regional agricultural hotspot in Botswana. Soil samples were collected at three depths (0-15, 15-30, and 30–45 cm) and fractionated into macroaggregates (> 0.25 mm) and microaggregates (< 0.25 mm) using the wet sieving method. Soil aggregate stability was assessed using indices including water-stable aggregates (WSA), mean weight diameter (MWD), geometric mean diameter (GMD), and the content of > 0.25 mm aggregates (R0.25). Routine laboratory procedures were used to analyze the pH, Electrical conductivity, calcium carbonate, exchangeable cations, soil organic carbon, bulk density, particle size distribution, and clay mineralogy. Findings indicate that land use had a substantial impact on soil structural stability and soil organic carbon dynamics. Natural exclosures recorded the highest MWD (2.95 mm) and GMD (1.5 mm), reflecting a well-developed soil structure. Grassland exclosures and pastures showed intermediate stability, while arable land had the lowest aggregate stability (MWD = 0.5 mm), reflecting degradation. Water-stable aggregates (WSA) varied with land use types and aggregate sizes, with arable land having higher WSA (71.91%) in smaller fractions, which are more prone to erosion and natural exclosures higher WSA (72.07%) in larger sizes, supporting greater cohesion. Pastures had the most meso aggregates. R0.25 exhibited uniformity across various land use types due to high clay contents. Soil organic carbon stocks were highest in natural exclosures (250 kg C m-2) and lowest in pastures (80 kg C m-2), with macroaggregates (>0.25 mm) contributing most significantly to carbon storage, underscoring their role in carbon storage. A positive correlation (r = 0.7) was observed between MWD and aggregate-associated carbon. These findings highlight the importance of long-term exclosures that minimize disturbance and promote vegetation cover to improve soil structure and carbon storage.
1 Introduction
The interconnectedness between land use and soil health is a key concern in modern agricultural sustainability and environmental conservation. As the global demands for food, fuel, and fiber heighten, land use and management practices are increasingly being recognized not just for their contribution to economic development and food security, but also for their profound impact on the long-term viability of ecosystem services (1). Among the ecosystem services, the ability of the soil to regulate floods, cycle nutrients, support plant growth, and capture carbon is especially important in the face of climate change and land degradation. These biogeochemical processes, which support terrestrial ecosystem resilience, are inextricably linked to the physical, chemical, and biological integrity of soils collectively known as soil health (2). Soil health is commonly referred to as the capacity of soil to function as a living ecosystem within the limits of land use and environmental conditions (3). It is critical for supporting food production, preserving biodiversity, mitigating climate change through carbon sequestration, and protecting water quality. Soil health indicators include biological activity, nutrient availability, structural stability, and ability to hold and transfer water and air (4). Among these indicators, soil structure, particularly the development and stability of aggregates, is an essential factor that controls several important soil processes (5).
One of the primary factors influencing soil structure and aggregate stability is soil organic carbon (SOC). Soil organic carbon plays a central role in maintaining and enhancing soil physical properties, particularly through its interaction with soil aggregates (6). It functions as both a cementing agent and a nucleus for aggregate formation, enhancing particle binding forces and decreasing aggregate wettability, making them more resistant to slaking and disintegration (7). Soil organic carbon enhances cohesion through microbial activity, fungal hyphae, and polysaccharides, and simultaneously improves resistance to disintegration by decreasing aggregate wettability, which is the tendency of aggregates to absorb water (8). Thus, SOC and aggregate stability are mutually reinforcing; SOC promotes stable aggregate formation, while stable aggregates, in turn, protect SOC from microbial mineralization by physically occluding it within their interior (9). Because of these dynamics, soil structure is not just a result of soil health but also a means for long-term carbon storage, a technique for mitigating climate change that is becoming increasingly significant on a global scale.
However, land use change disrupts organic matter inputs, increases erosion and mineralization, and modifies microbial dynamics, resulting in an overall decline in aggregate stability and soil quality (10). Earlier studies have found that intensive land use reduces the proportion of water-stable macroaggregates while increasing the dominance of microaggregates, which are more susceptible to compaction and erosion (11). While much of the existing research is based in temperate and humid regions, semi-arid environments, particularly in Sub-Saharan Africa, remain largely understudied. These regions face distinct challenges, including erratic rainfall, high evapotranspiration, and limited organic matter input (12). Even small-scale land use changes in such fragile ecosystems can significantly impact soil stability and carbon storage. Globally, arid and semi-arid soils are home to an estimated two billion people and occupy about 66.7 million km2 of land (13), and drylands are projected to increase in size due to climate change (14).
In the Pandamatenga agricultural Plains, Botswana, land use management has changed dramatically over recent decades. Much of the natural vegetation has been turned into large-scale agricultural land in response to national food security goals and agricultural development projects. This land use change, while economically significant, is expected to have an impact on the physical integrity and organic carbon storage capability of the soils, especially in the Vertisols that dominate the region. Although some studies have looked into particular issues like irrigation practices, tillage systems, and soil water management (15, 16), there is no integrative research that assesses the cumulative effects of land use types on aggregate stability and SOC on the Plains. To address this knowledge gap, this study aims to investigate the differential effects of various land use practices on soil aggregate stability and SOC stocks in the Pandamatenga alluvial Plains. The specific objectives are to: (i) characterize the physical, chemical, and mineralogical properties of soils, (ii) assess the distribution and stability of water-stable aggregates across different size classes under varying land use type, (iii) quantify organic carbon associated with each aggregate class and determine their contributions to bulk SOC, and (iv) evaluate bulk soil SOC stocks and their variations across land use types and aggregate fractions. This study will improve our understanding of soil organic carbon in semi-arid Vertisols. Importantly, it will provide the data needed to establish site-specific, evidence-based management strategies that improve soil health, increase sustainable agricultural output, and contribute to climate change mitigation.
2 Materials and methods
2.1 Environmental setting of the study area
The study area is in the Pandamatenga Plains, which is located in the northeast fringe of Botswana between latitudes 18.30° S and 18.69° S and longitudes 25.45° E to 25.61° E at elevations between 1066 m and 1088 m (Supplementary Figure S1). The Pandamatenga region experiences a semi-arid climate characterized by hot, humid summers and mild, dry winters. Annual rainfall averages approximately 600 mm, primarily from convective processes, and varies significantly even over short distances. Most precipitation occurs from October to April, with the peak months being December, January, and February. This rainfall often results in short, intense storms that cause rapid flooding on some farms due to high run-off. The maximum temperatures range from 26°C to 34°C between October and March, whereas the minimum temperatures range from 11°C to 20°C from November to July. The soil climate of Pandamatenga is characterized by an ustic moisture regime and an iso-hyperthermic temperature regime, with an aqueous moisture regime present in the poorly drained parts of the alluvial plain. The soils that predominate in these alluvial Plains consist of Eutric Vertisols characterized by sandy clay loam to clay texture, comprising an average clay content of more than 30% in all land use types. The vegetation in the study area is characterized by extensive grassland savanna interspersed with mopane (Colophospermum mopane spp) and various acacia species. The dominant land use types include agriculture, particularly pastoral and arable farming, which are integral to the livelihoods of the local population. In addition to agricultural activities, the landscape features natural exclosures and extensive grasslands, which contribute to the region's biodiversity.
2.2 Land use types and soil sampling
Four specific land use types were selected for this study: arable land (AL), pasture (PA), natural exclosures (NE), and grassland exclosures (GE) (Supplementary Figure S2). Natural exclosures refer to areas where both human activity and livestock grazing have been excluded for extended periods, allowing natural vegetation regeneration, while grassland exclosures (GE) are formerly grazed grasslands that have been protected from grazing to allow recovery of grass cover and soil structure (Table 1).
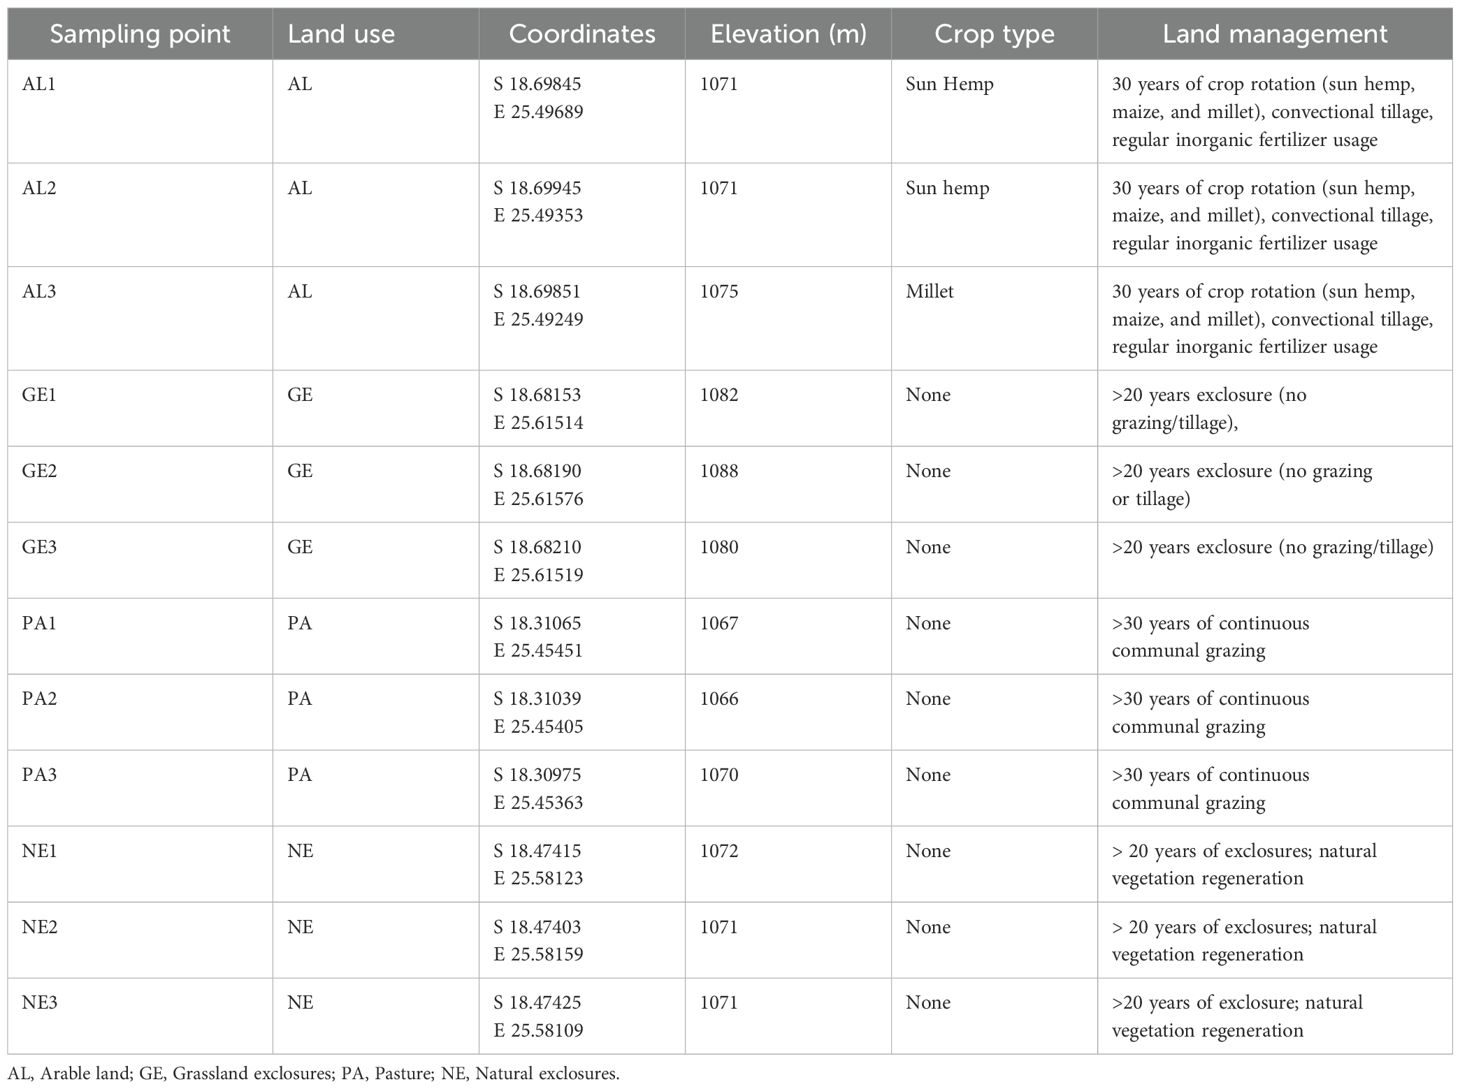
Table 1. Key characteristics of the selected land use types.
Soil samples were collected from each of the plots at three depths (0–15, 15–30, and 30–45 cm) with a bucket auger. These depth intervals were selected to capture vertical variations in soil properties, particularly those influenced by land use management, as they represent typical topsoil and subsoil layers in Vertisols. For each land use type, the first sampling point was randomly selected, and the subsequent two points were systematically placed 1 meter apart. At each depth, the soil samples were collected three times and mixed to create composite samples. This resulted in nine soil samples per land use type and a total of 36 samples for all land use types among the disturbed bulk soil samples. Core samples were also collected at each land use type for the determination of bulk density. For these measurements, three core samples were collected at each sampling point, giving a total of 27 core samples per land use type and a total of 108 core samples across all land use types.
2.3 Laboratory methods
Before conducting the soil physical and chemical analysis, the soil samples were ground and passed through a 2 mm mesh. The particle size distribution was determined via the hydrometer method (17). The bulk density of the soil was determined via the core sampling method (18). Soil pH and EC were measured in a soil-water dispersion of 1:2.5 (19). The exchangeable base cations (sodium, calcium, magnesium, and potassium) were determined using the ammonium acetate extraction method buffered at a pH of 7 (20). The base cation concentration was then determined using the inductively coupled plasma optical emission spectrometry (ICP-OES). The content of soil organic carbon was determined by using the Walkley-Black wet digestion method. Calcium carbonate content was determined gasometrically using a Royal Eijkelkamp© calcimeter.
The size distribution of water-stable aggregates (WSA) was determined via the wet sieving method (21, 22). For every soil sample, a 100 g soil sample was passed through a set of sieves with mesh sizes of 4.75 mm, 2.0 mm, 1.0 mm, 0.5 mm, and 0.25 mm. The sieves were stacked with a pre-saturated soil sample in the top sieve and were shaken in water for 10 minutes at a rate of 30 vertical oscillations per minute. The soil retained on each sieve was then corrected for sand content and dried at 105°C for 36 hours, and the proportion of aggregates in each size class was calculated as a percentage. The WSA method was preferred over the dry stable aggregates (DSA) technique because it better reflects the natural conditions of Vertisols in the Pandamatenga alluvial Plains, where surface water flow is a greater threat to water than wind erosion.
The weights of the different sizes of water-stable aggregates (Equation 1) were used to compute parameters such as the mean weight diameter (MWD), Equation 2; proportion of aggregates larger than 0.25 mm (R0.25), Equation 3; and geometric mean diameter (GMD), Equation 4.
where WSA is the water-stable aggregate for each size class, Wa is the weight of the material on the sieve after wet sieving, Wc is the weight of the coarse material in size, and Wo is the weight of the aggregates placed on the sieve before wet sieving, as shown in Equation 2.
where Xi is the mean diameter of the ith sieve size and Wi is the proportion of the total aggregates in the ith fraction. If the value of the MWD is high, the proportions of macroaggregate and microaggregate fractions are greater in the soil.
where ma>0.25 is the mass of aggregates with particle sizes greater than 0.25 mm and where M is the total weight of the sample used for the analysis.
where Wi is the weight of the aggregates present in a diameter class, Xi and ∑n i-1, and Wi is the total weight of the experimental soil sample.
Clay mineralogy analysis was conducted via X-ray diffraction (XRD) with a Bruker-AXS D8 Advance Powder X-ray diffractometer after extracting the clays through repeated cycles of sedimentation and centrifugation.
2.4 Estimation of soil organic carbon stocks
Equations 5–7 were used to compute SOC stocks of bulk soil samples, the amount of soil in aggregate size fractions, and organic carbon stocks in aggregate size fractions respectively (23).
SOC stocks in bulk soils:
Stocks of organic carbon in aggregate size fractions:
Where D is the depth (cm); BD is the bulk density (g cm-3); Mi is the amount of soil in the ith size fraction (g); OCi is the organic carbon (OC) content of the ith size fraction (%); Wi is the proportion of the total soil in the ith size fraction (%).
2.5 Estimation of the contribution rate of different sizes
The contributions of different factors to total SOC under different land use types were evaluated using Equation 8:
Where Wai is the mass weight of aggregate i (g); SOCai is the organic carbon in aggregate i (%); Wb is the mass weight of the bulk soil(g); SOCb is the soil organic carbon in bulk soil (%); Cai is the contribution of aggregate i to soil organic carbon.
2.6 Statistical analysis
Microsoft Excel was used to organize the data. Descriptive statistics, including means and standard deviations for the soil physicochemical properties, were performed and visualized via R Studio version 4.4.1 (24). The distributions of soil aggregates of different sizes; distributions of organic carbon within different aggregate sizes; MWD, GMD, and R0.25; soil organic carbon stocks in both bulk soil samples and aggregate sizes; and contribution rates of different aggregate sizes to soil organic carbon across various land use types and soil depths were compared through two-way variance analysis (ANOVA). When ANOVA indicated a significant effect, Tukey's post hoc test at the P < 0.05 significance level was applied for pairwise comparisons. Simple linear regression was used to explore the relationships between organic carbon stocks within different aggregate size classes and total (bulk) soil organic carbon stocks. Both ANOVA and regression analyses were conducted and plotted via R Studio version 4.4.1. Multivariate statistical analyses and factor analyses were performed with OriginPro 2024 software (25).
3 Results
3.1 Soil properties
The soil particle size distribution at three depths (0–15 cm, 15–30 cm, and 30–45 cm) is shown in Supplementary Table S1. The soils generally have clay contents above 30%. Based on soil textural classification, AL soils are sandy clay loam, whereas PA, GE, and NE as clay. The soil bulk density (BD) in pastures revealed a non-uniform trend, with some land use types (such as NE and GE) increasing with depth and AL declining with depth. The highest BD value (1.3 g cm-3) was found at the 0–15 cm depth in AL, whereas the lowest value (0.8 g cm-3) was found in GE (Supplementary Table S1).
The electrical conductivity (EC) varied from 30 to 350 µS cm-1. Across all land use types, EC increases with soil depth, except for NE, where it decreases. The GE presented the greatest EC value of 350 µS cm-1 at the 30–45 cm depth, whereas NE presented the lowest EC values, ranging from 30 to 70 µS cm-1 across all depths (Supplementary Table S2). The pH varied greatly with land use types and soil depth (Supplementary Table S2). The pH of AL ranged from 7.2 to 7.8, with little variation among depths. The GE soils were slightly acidic, with pH values ranging from 6.8 to 7.5 and increasing with depth. Pastures (PA) consistently had the highest pH values, ranging from 7.5 to 8.3, with the pH gradually increasing as depth increased. In contrast, the NE soils had the lowest pH levels, ranging from 5.6 to 6.2, with the greatest variation found in the topsoil layer (0–15 cm).
The calcium carbonate (CaCO₃) levels varied between land use types and soil depths, ranging from not detected in NE to 40 g kg-1 in AL. In AL, CaCO₃ concentrations increased with soil depth, from 20 g kg-1 at 0–15 cm to 40 g kg-1 at 30–45 cm. The GE soils presented consistently low CaCO₃ values at all depths. The CaCO₃ levels in PA increased gradually with depth, from 0 to 4 g kg-1. The NE soils presented no detectable CaCO₃ at any depth (Supplementary Table S2). The soil organic carbon content varies depending on land use type and soil depth. The soil organic carbon (OC)concentration in arable land decreased with increasing depth, from 0.9% to 0.6% (Supplementary Table S2). However, GE maintained a steady organic carbon concentration of 0.9% throughout all the soil depths. The SOC levels in pastures ranged between 0.7% and 0.9%. The NE presented the highest OC concentrations, ranging from 1.00% at 30–45 cm to 1.7% at 0–15 cm.
The soil depth and land use type strongly affected the nutrients, exchangeable calcium (Ca²+), magnesium (Mg²+), potassium (K+), and sodium (Na+) levels. The trends for exchangeable calcium differ in response to land use types (Supplementary Table S2). Calcium content in GE slightly decreased with depth, whereas in AL soils, it generally increased with soil depth. Conversely, NE showed a fluctuating trend across the soil profile. The highest concentration of exchangeable calcium (35.0 cmol kg−1) was observed in GE, whereas the lowest concentration (20.0 cmol kg−1) was recorded in NE. The exchangeable magnesium concentrations across the land use types ranged from 2.5 cmol kg−1 to 10.2 cmol kg−1 at the 0–15 cm depth, 2.3 cmol kg−1 to 10.3 cmol kg−1 at the 15–30 cm depth, and 2.7 cmol kg−1 to 10.3 cmol kg−1 at the 30–45 cm depth. At all depths, the lowest concentrations of exchangeable magnesium were found in AL, whereas the highest values were consistently observed in GE (Supplementary Table S2). All land use types presented decreased concentrations of exchangeable potassium (K+) and sodium (Na+), ranging from 0.2 cmol kg−1 to 1.3 cmol kg−1 and 0.05 cmol kg−1 to 0.9 cmol kg−1, respectively. Potassium showed a decreasing trend with soil depth across all land use types (Supplementary Table S2). Sodium presented the highest concentration (1.3 cmol kg−1) in PA at the 30–45 cm depth, whereas the lowest concentration (0.05 cmol kg−1) was recorded in AL at the 15–30 cm depth.
The XRD analysis showed that montmorillonite was the dominant mineral in the soils, with identical diffraction patterns observed in each sample, confirming uniformity in mineral composition. Montmorillonite showed a characteristic diffraction peak at 5.9°.
3.2 Water-stable aggregates
Land use type had a significant (P<0.05) effect on the distribution of water-stable aggregate (WSA) sizes. Among all land use types, AL soils had a greater proportion of mesoaggregates (0.5–0.25 mm) than macroaggregates (>4.75–0.5 mm), whereas NE soils had a greater proportion of macroaggregates. Depth-wise, the distributions of microaggregates, mesoaggregates, and macroaggregates varied significantly across land use types. At 0–15 cm, the proportion of > 4.75 mm WSAs was highest in NE (46.62%), followed by GE (12.36%), whereas PA and AL soils had the lowest proportions of aggregates ≥4.75 mm, with values of 5.82% and 0%, respectively (Table 2). Conversely, the proportion of mesoaggregates (0.5–0.25 mm) increased significantly in PA and AL soils, while the highest percentage of microaggregate water-stable aggregates (47.36%) was found in AL soils. There was no significant (P > 0.05) difference in the 4.75-2.0 mm WSA between land use types (NE, GE and PA). Similarly, no significant (P > 0.05) differences were detected in the distribution of <0.25 mm WSA across depths. Notably, microaggregates (<0.25 mm) accounted for the lowest percentage of WSA across all land use types.
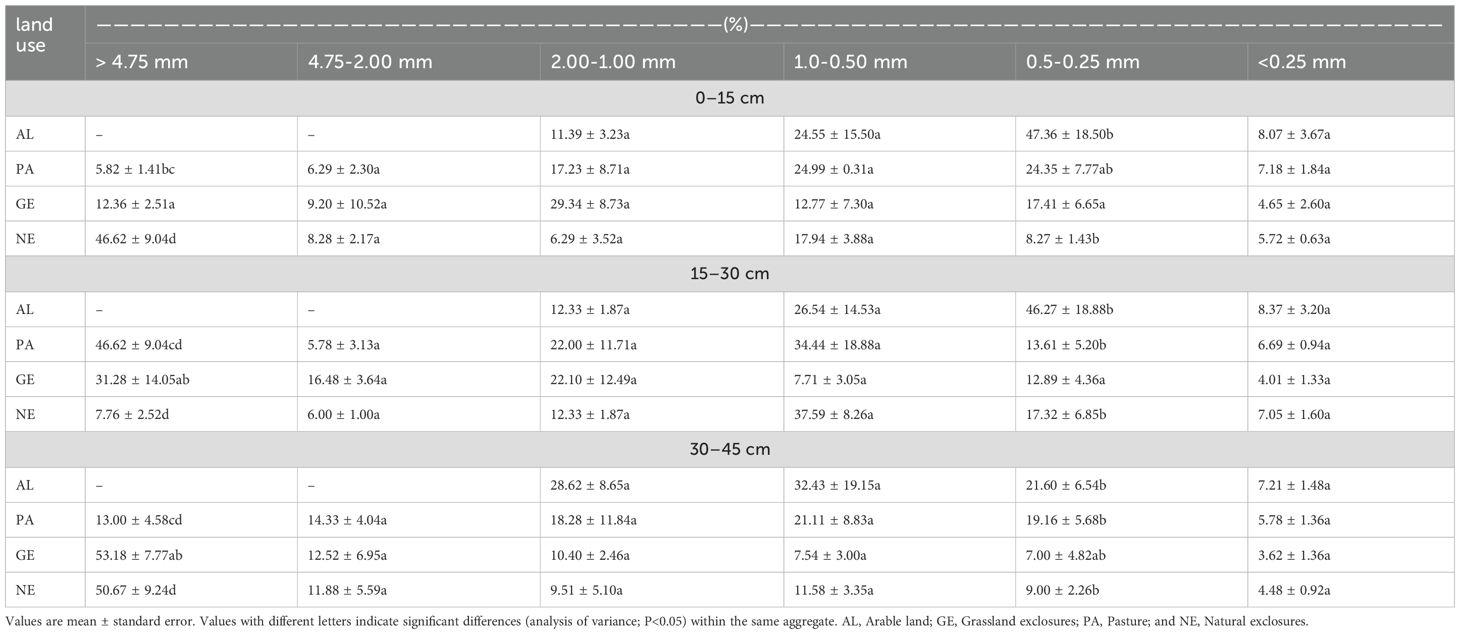
Table 2. Distributions of water-stable aggregates across different land use.
The percentages of water-stable macroaggregates decreased dramatically at the 15–30 cm depth, ranging from PA (46.62%) > GE (31.28%) > NE (7.76%) > AL (0%). PA and GE had much greater proportions of macroaggregates and mesoaggregates, with the largest percentages observed in the 2.00–1.00 mm and 1.00–0.50 mm size classes. In contrast to those at the 0–15 cm depth, the proportions of macroaggregates in the NE decreased. In AL, there was a significant increase in the 2.00–1.00 mm and 1.00–0.50 mm aggregates, accompanied by a slight decrease in the 0.50–0.25 mm size class (Table 2).
At the 30–45 cm depth, GE and NE presented the highest proportions of > 4.75 mm at 53.18% and 50.67%, respectively. Arable land (AL), on the other hand, presented an increase in intermediate-sized aggregates (2.00–1.00 mm and 1.00–0.5 mm) but a decrease in smaller aggregate fractions (0.50–0.25 mm).
To further assess the aggregate stability characteristics, three different indicators were used (Figure 1). Greater agglomeration and stability of soil aggregates are indicated by higher R0.25, MWD, and GMD values. The soil aggregate MWD and GMD varied significantly depending on land use type and soil depth (P<0.05). A trend was observed for the MWD and GMD across the three soil depths (0–15 cm, 15–30 cm and 30–45 cm). The recorded MWD and GMD values followed a similar pattern and were strongly correlated (r = 1.0) (Figure 2). Among the three soil layers, the average MWD and GMD values under AL were significantly lower than those under NE, GE, and PA.
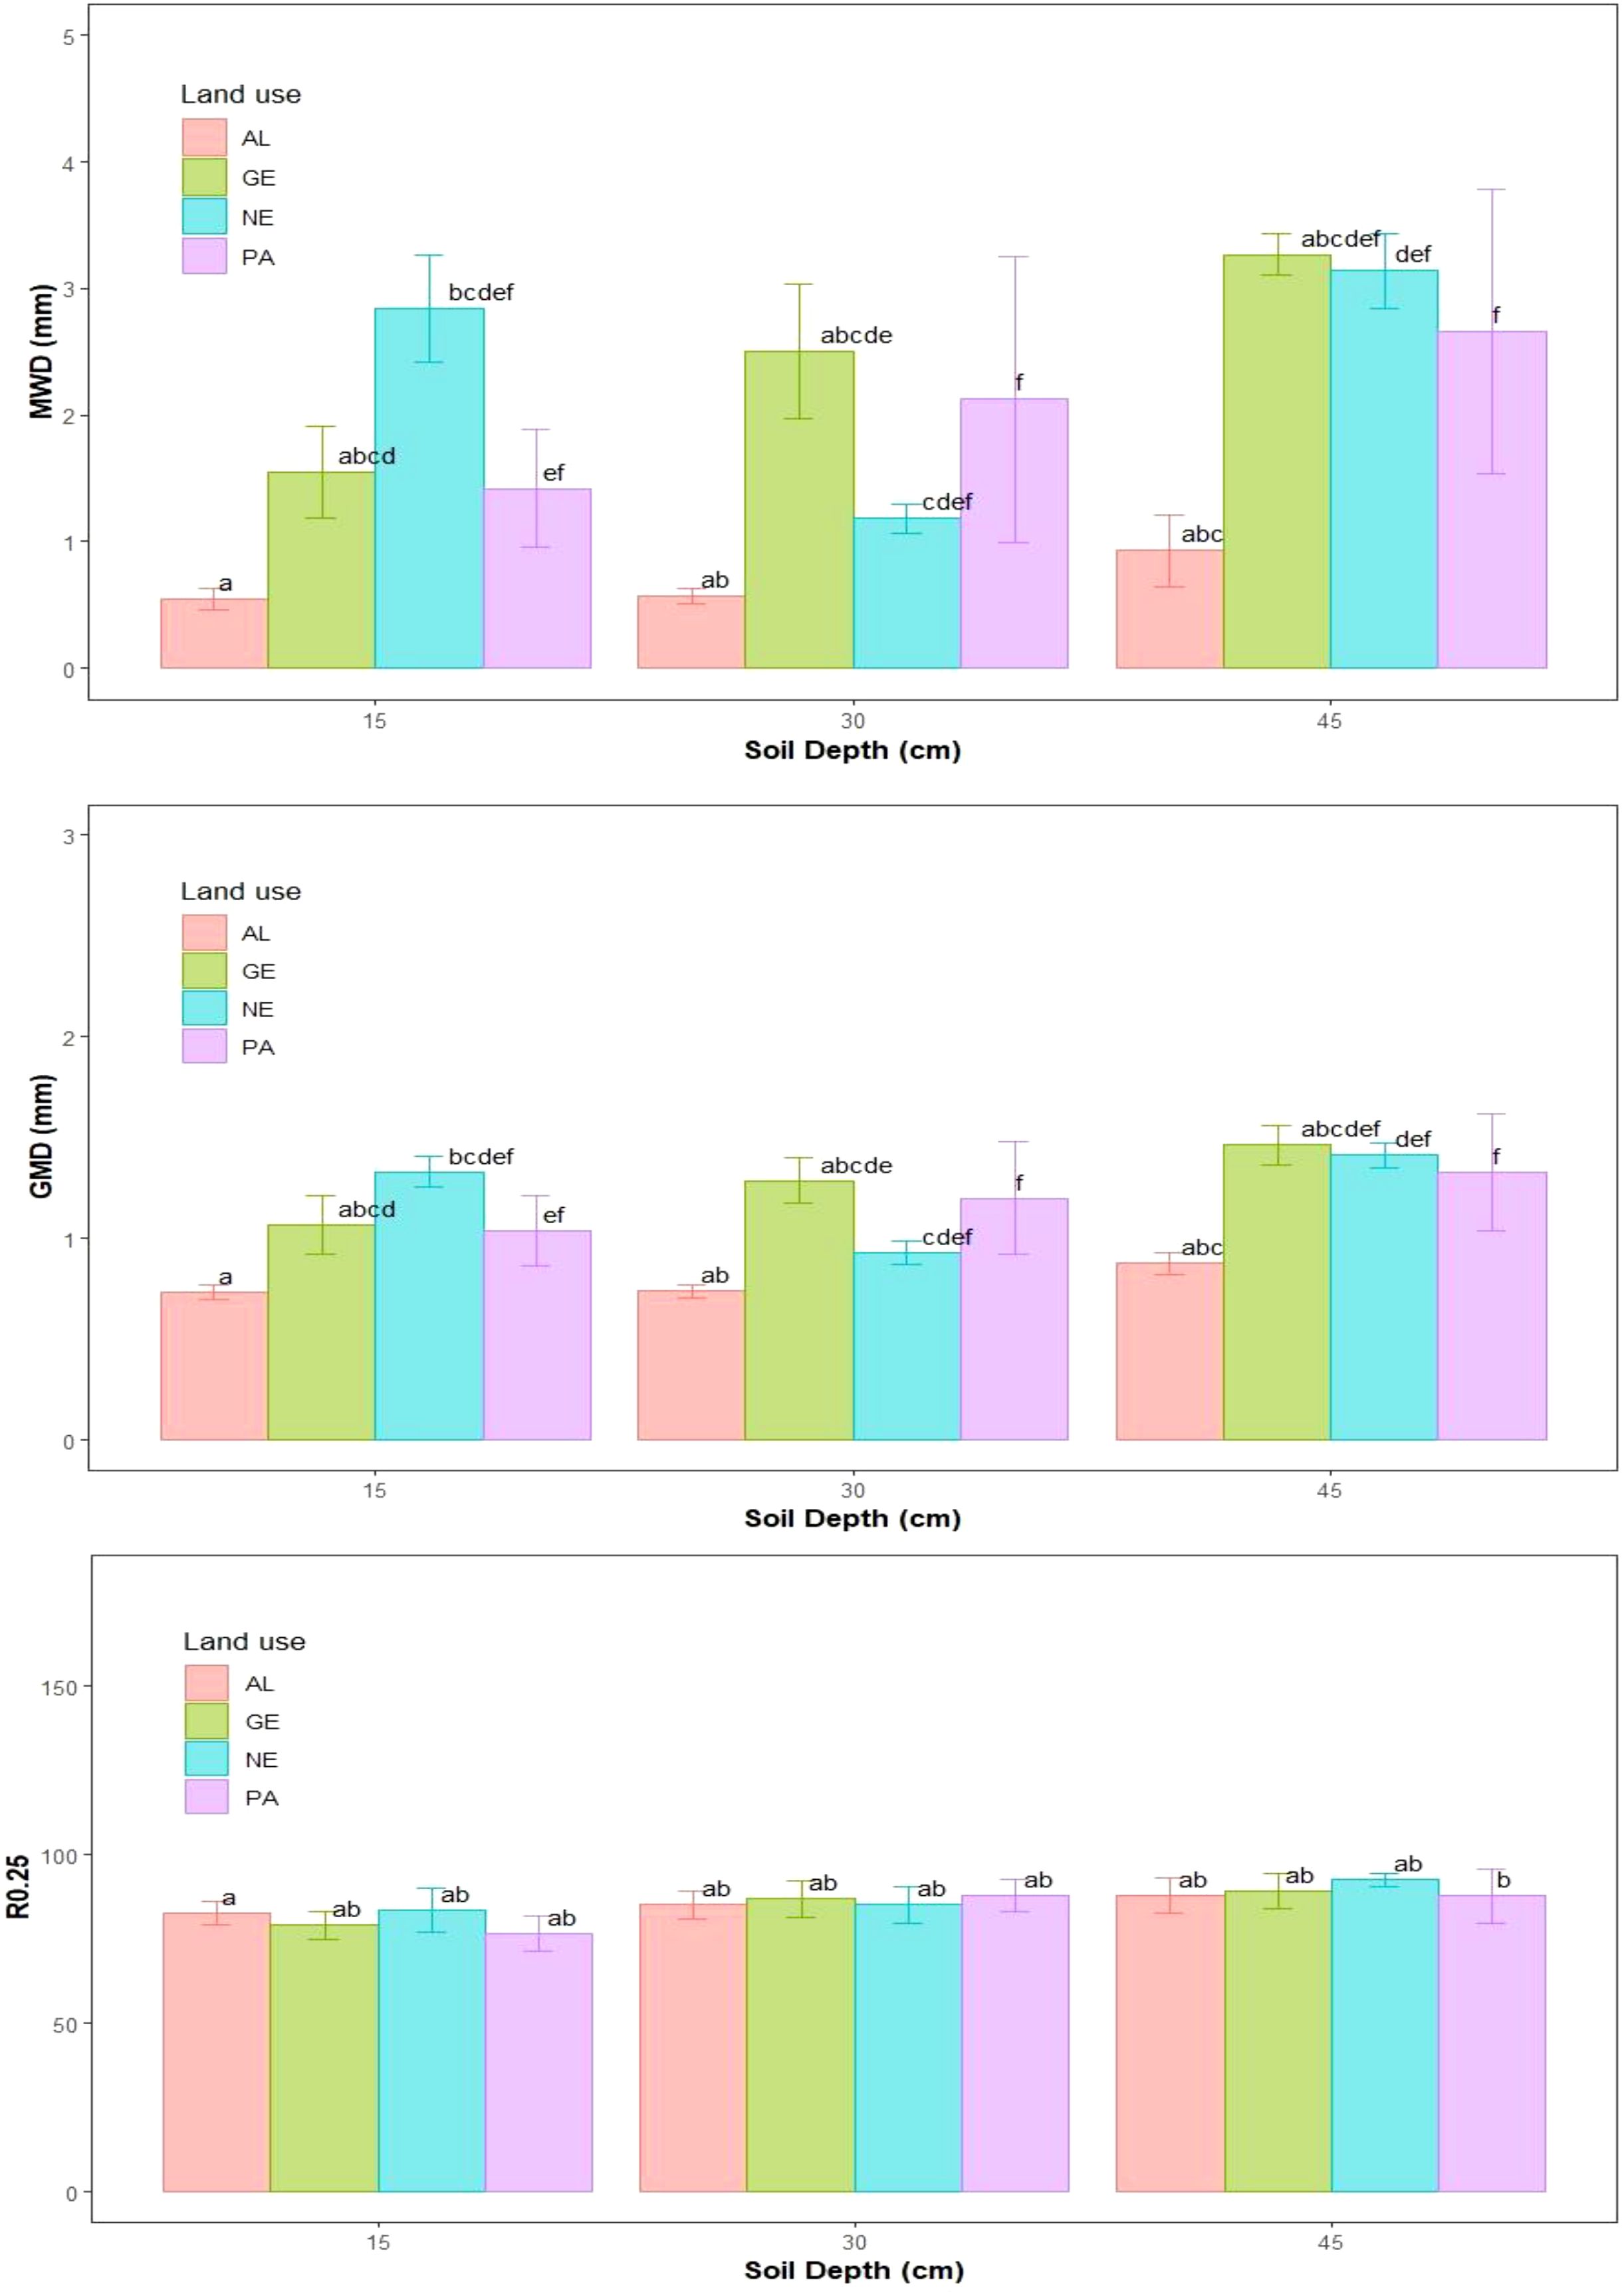
Figure 1. Aggregate stability parameters. Mean weight diameter (MWD), GMD (Geometric mean diameter), R0.25; aggregates >0.25 mm. Different letters indicate significant differences between land use types and soil depths (analysis of variance; P<0.05). AL, Arable land; GE, Grassland exclosures; PA, Pasture; NE, Natural exclosures.
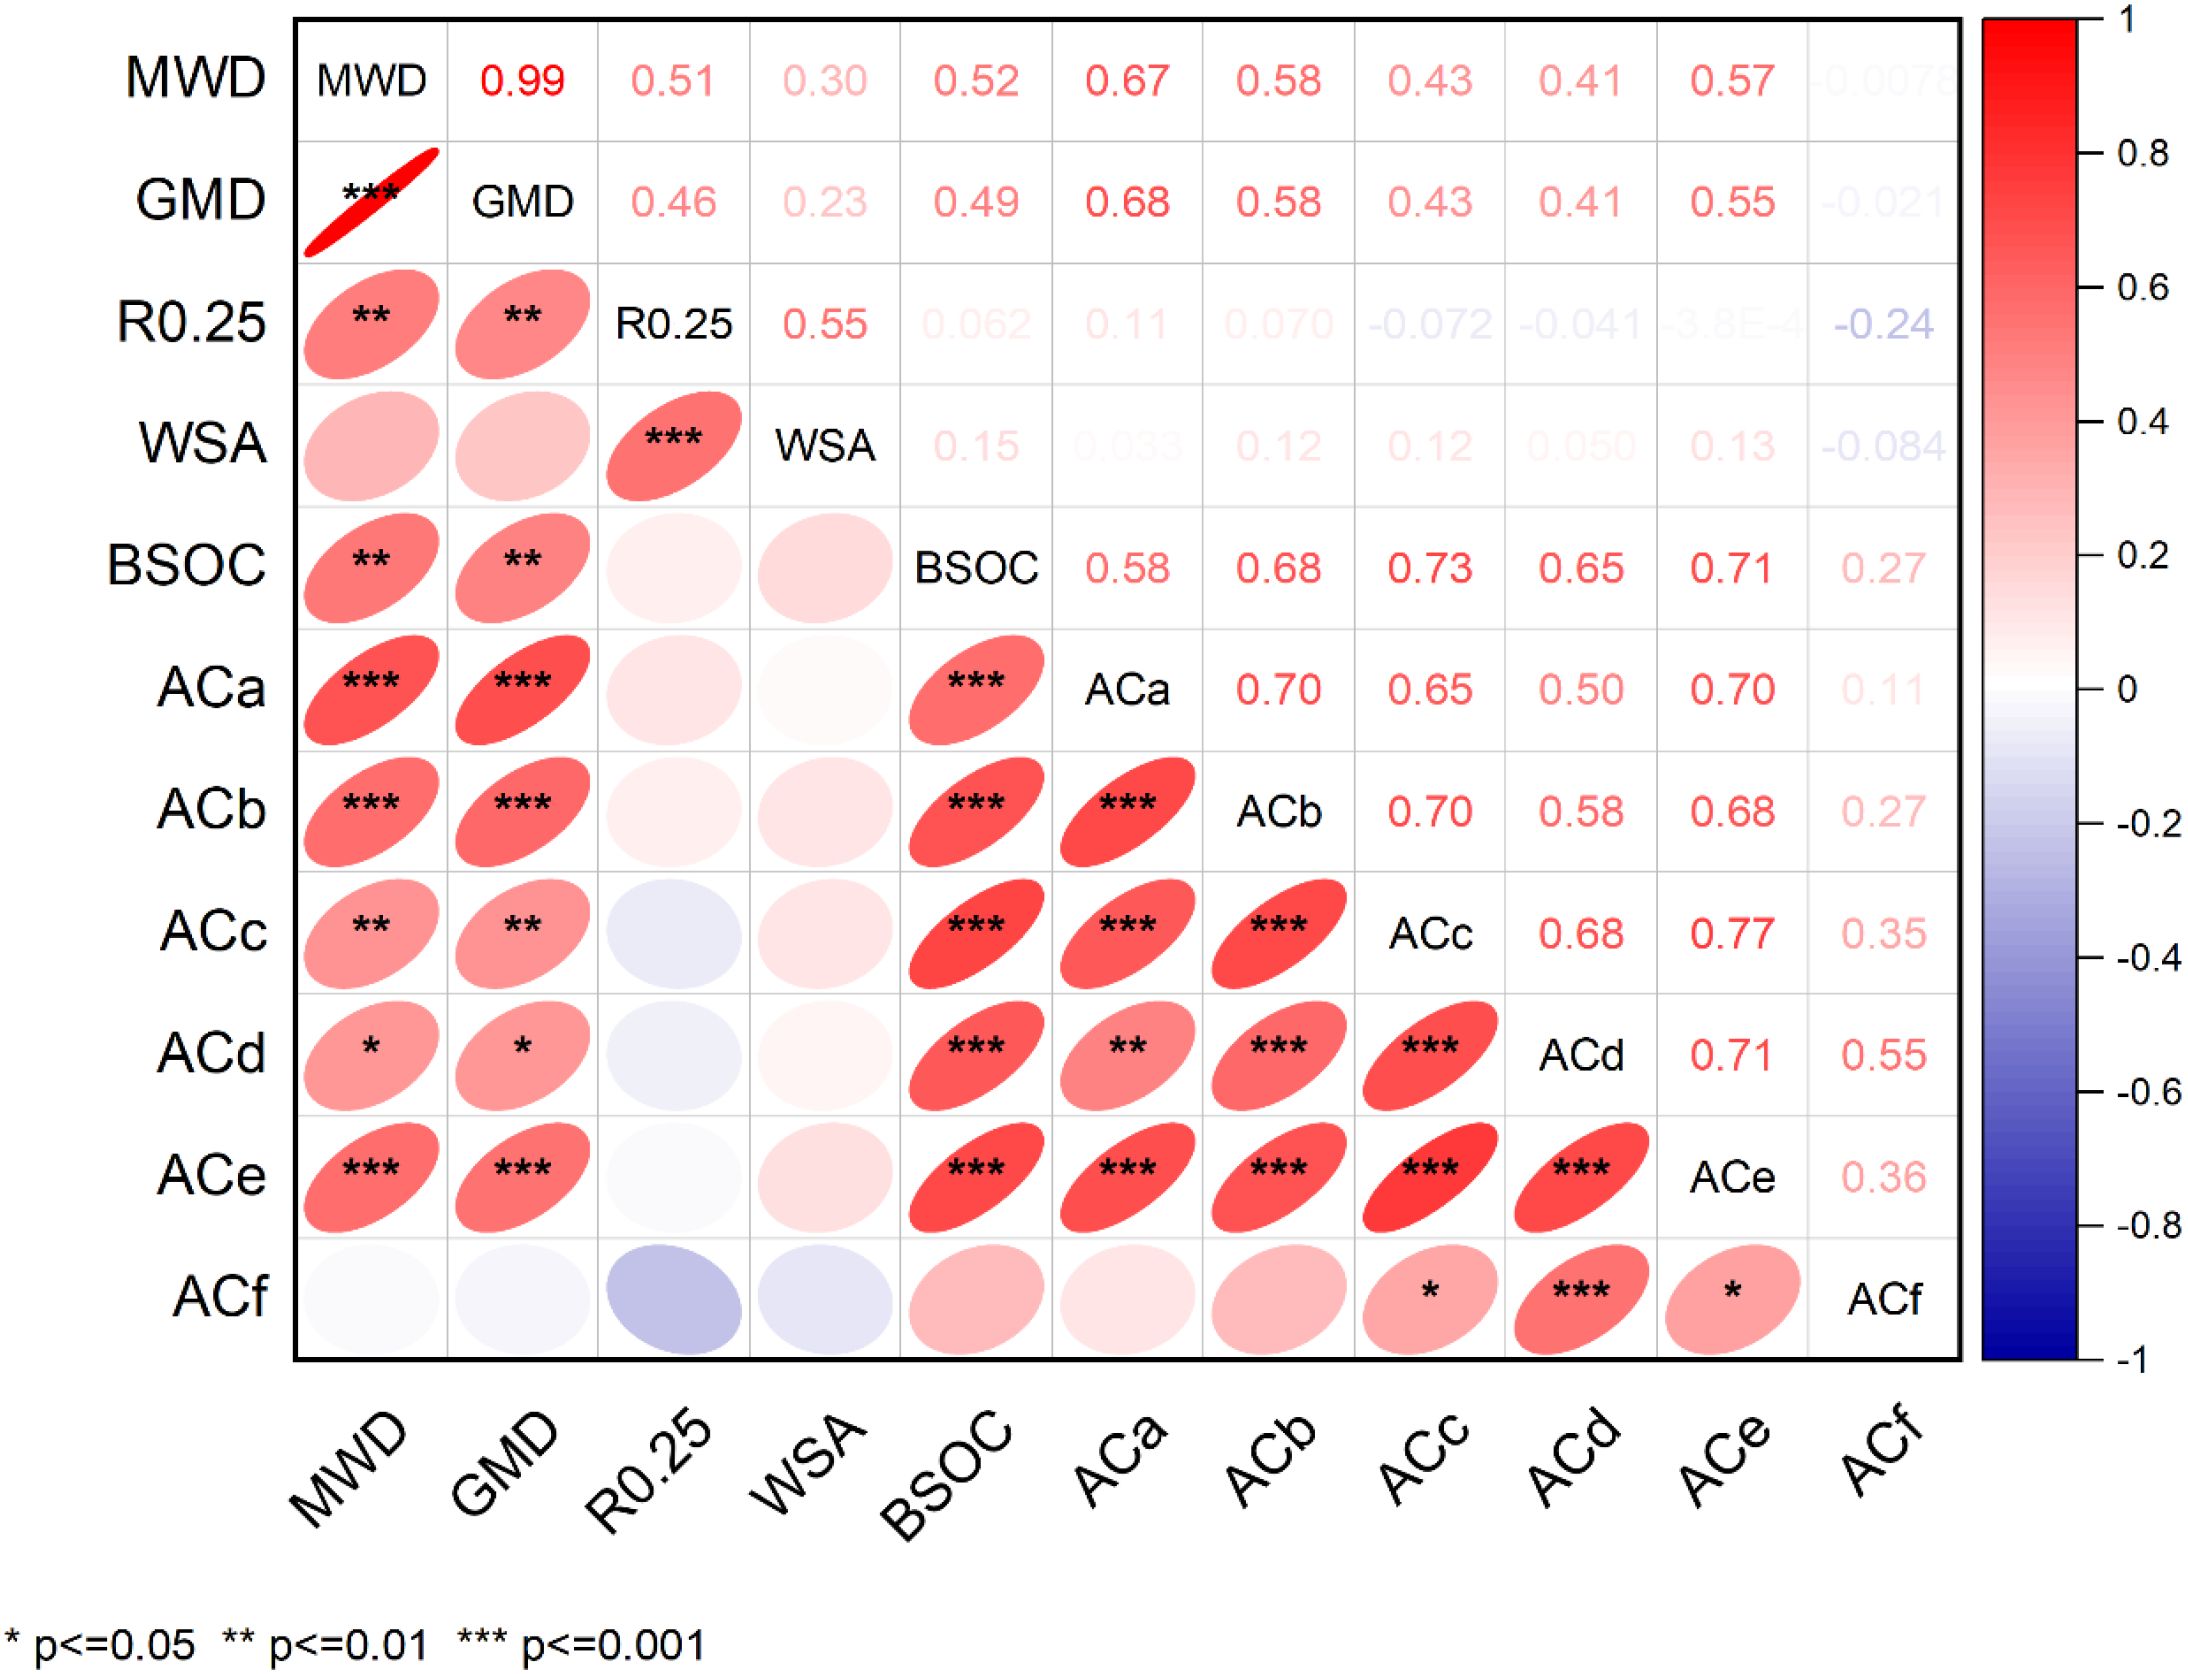
Figure 2. Pearson correlation between the stability parameters of aggregates, aggregate-associated C, and bulk SOC. MWD, Mean weight diameter; GMD, geometric mean weight diameter; WSA, water stable aggregates; BSOC, Bulk soil organic carbon; MWD, Mean weight diameter; GMD, geometric mean weight diameter; WSA, water stable aggregate; BSOC, bulk soil organic carbon; aggregate-associated OC (>4.75 mm(ACa), aggregate-associated OC (4.745-2.00 mm (ACb), aggregate-associated OC (2.00-1.00 mm (ACc), aggregate-associated OC (1.00-0.50 mm (ACd), aggregate-associated OC [0.50-0.25 mm (ACe), aggregate-associated OC <0.25 mm (ACf)].
The MWD and GMD values at the 0–15 cm depth were in the following order: NE> GE> PA> AL. Similarly, the MWD and GMD values at this depth were much greater under NE and GE than under AL. At the 15–30 cm depth, the MWD and GMD decreased in the following order: GE > PA > NE > AL. At the 30–45 cm depth, the MWD and GMD followed the trend of GE > NE> PA > AL. Notably, at all the soil depths, the MWD and GMD values in the 30–45 cm soil layer were significantly (P< 0.05) greater than those recorded in the upper layers. The R0.25 values did not differ significantly (P < 0.05) across land use types (P > 0.05) but did vary significantly across soil depths. The R0.25 content was unaffected by land use types, since the values remained consistent across the various management approaches. While the R0.25 content increased with soil depth, the differences were quite small. The R0.25 content was significantly (P < 0.05) greater in deeper soil layers (15–45 cm) than in topsoil layers (0–15 cm). Although the R0.25 content significantly (P < 0.05) differed across the soil depths), the actual numerical changes were relatively small.
3.3 Aggregate-associated organic carbon under the land use types
Variations were observed in the various soil aggregate size fractions associated with SOC concentrations across land use types and depths. The land use type had a significant (P < 0.05) effect on the SOC concentrations recorded in various aggregate size classes. The SOC concentration of the macroaggregates (> 0.25 mm) was greater than that of the microaggregates (< 0.25 mm) in all the land use types, except for the AL, where the SOC was concentrated in the microaggregates. However, no significant variation (P>0.05) was detected in macroaggregate organic carbon storage with depth (Table 3).
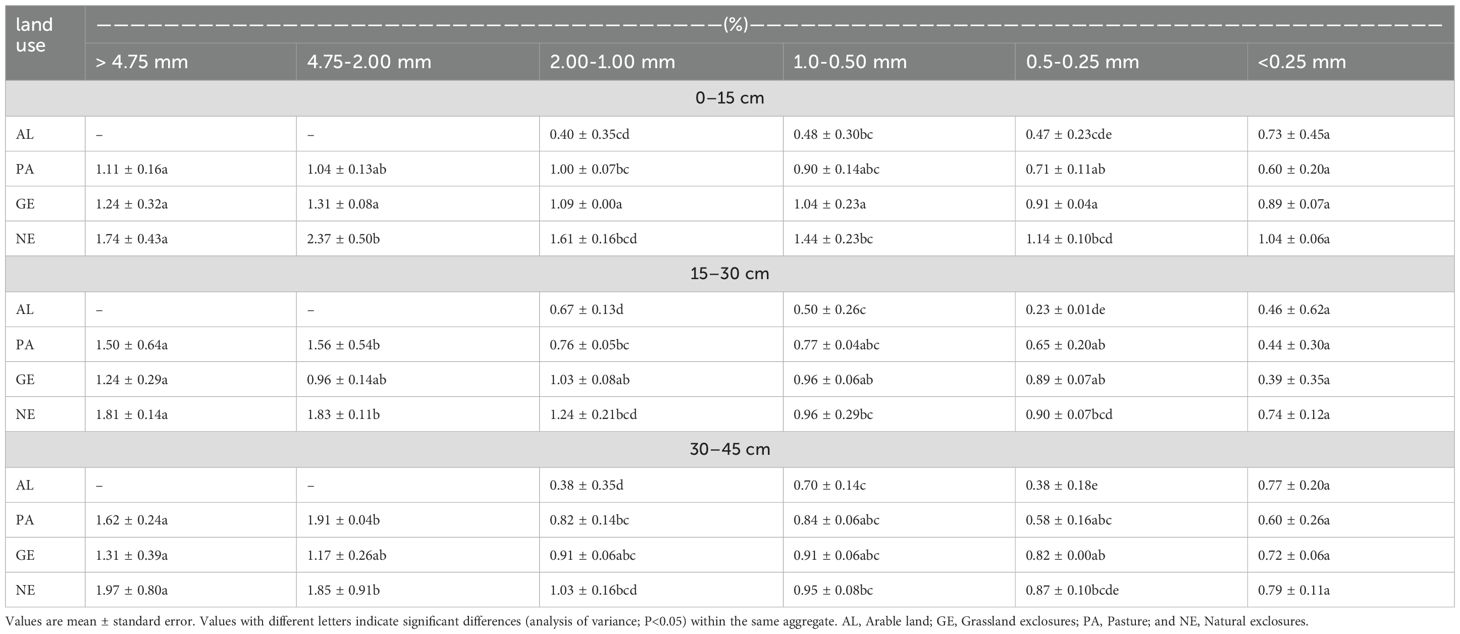
Table 3. The distribution of aggregate-associated organic carbon at a soil depth of 0–45 cm across various land use.
For the 4.75 mm aggregates, the SOC did not significantly (P>0.05) differ among the land use types (NE, GE, and PA). At 4.75–2.00 mm, SOC was significantly greater in NE, whereas GE and PA presented inconsistent trends with fluctuating SOC concentrations with depth. For 2.00–1.00 mm, both land use types and soil depth significantly affected the SOC (P<0.05). Among all the soil layers, the SOC content was highest in the NE soil, and the lowest was recorded in the AL soil. The SOC content was relatively high in the upper layers (0–15 cm) for NE, GE and PA, but the highest concentrations were observed at 30–45 cm. In contrast, the lowest concentrations were observed in AL (Table 3).
Significant differences (P<0.05) were detected among the land use types in the 1.00-0.5 mm water-stable aggregates. The highest SOC percentage and the lowest SOC percentage were recorded in the AL, ranging from 0.95-1.44% and 0.48-0.70%, respectively. No significant differences (P>0.05) were detected in the soil depths from 1.00–0.5 mm. Similar observations were made at 0.5–0.25 mm, where the highest contents were also reported under NE and the lowest under AL. Microaggregates (<0.25) did not significantly(P>0.05) differ with land use. The differential contributions of different aggregate sizes to the bulk soil organic carbon under the land use types are shown in Figure 3, while the correlation between soil properties, aggregate-associated organic matter, and total SOC is presented in Figures 2 and 4.
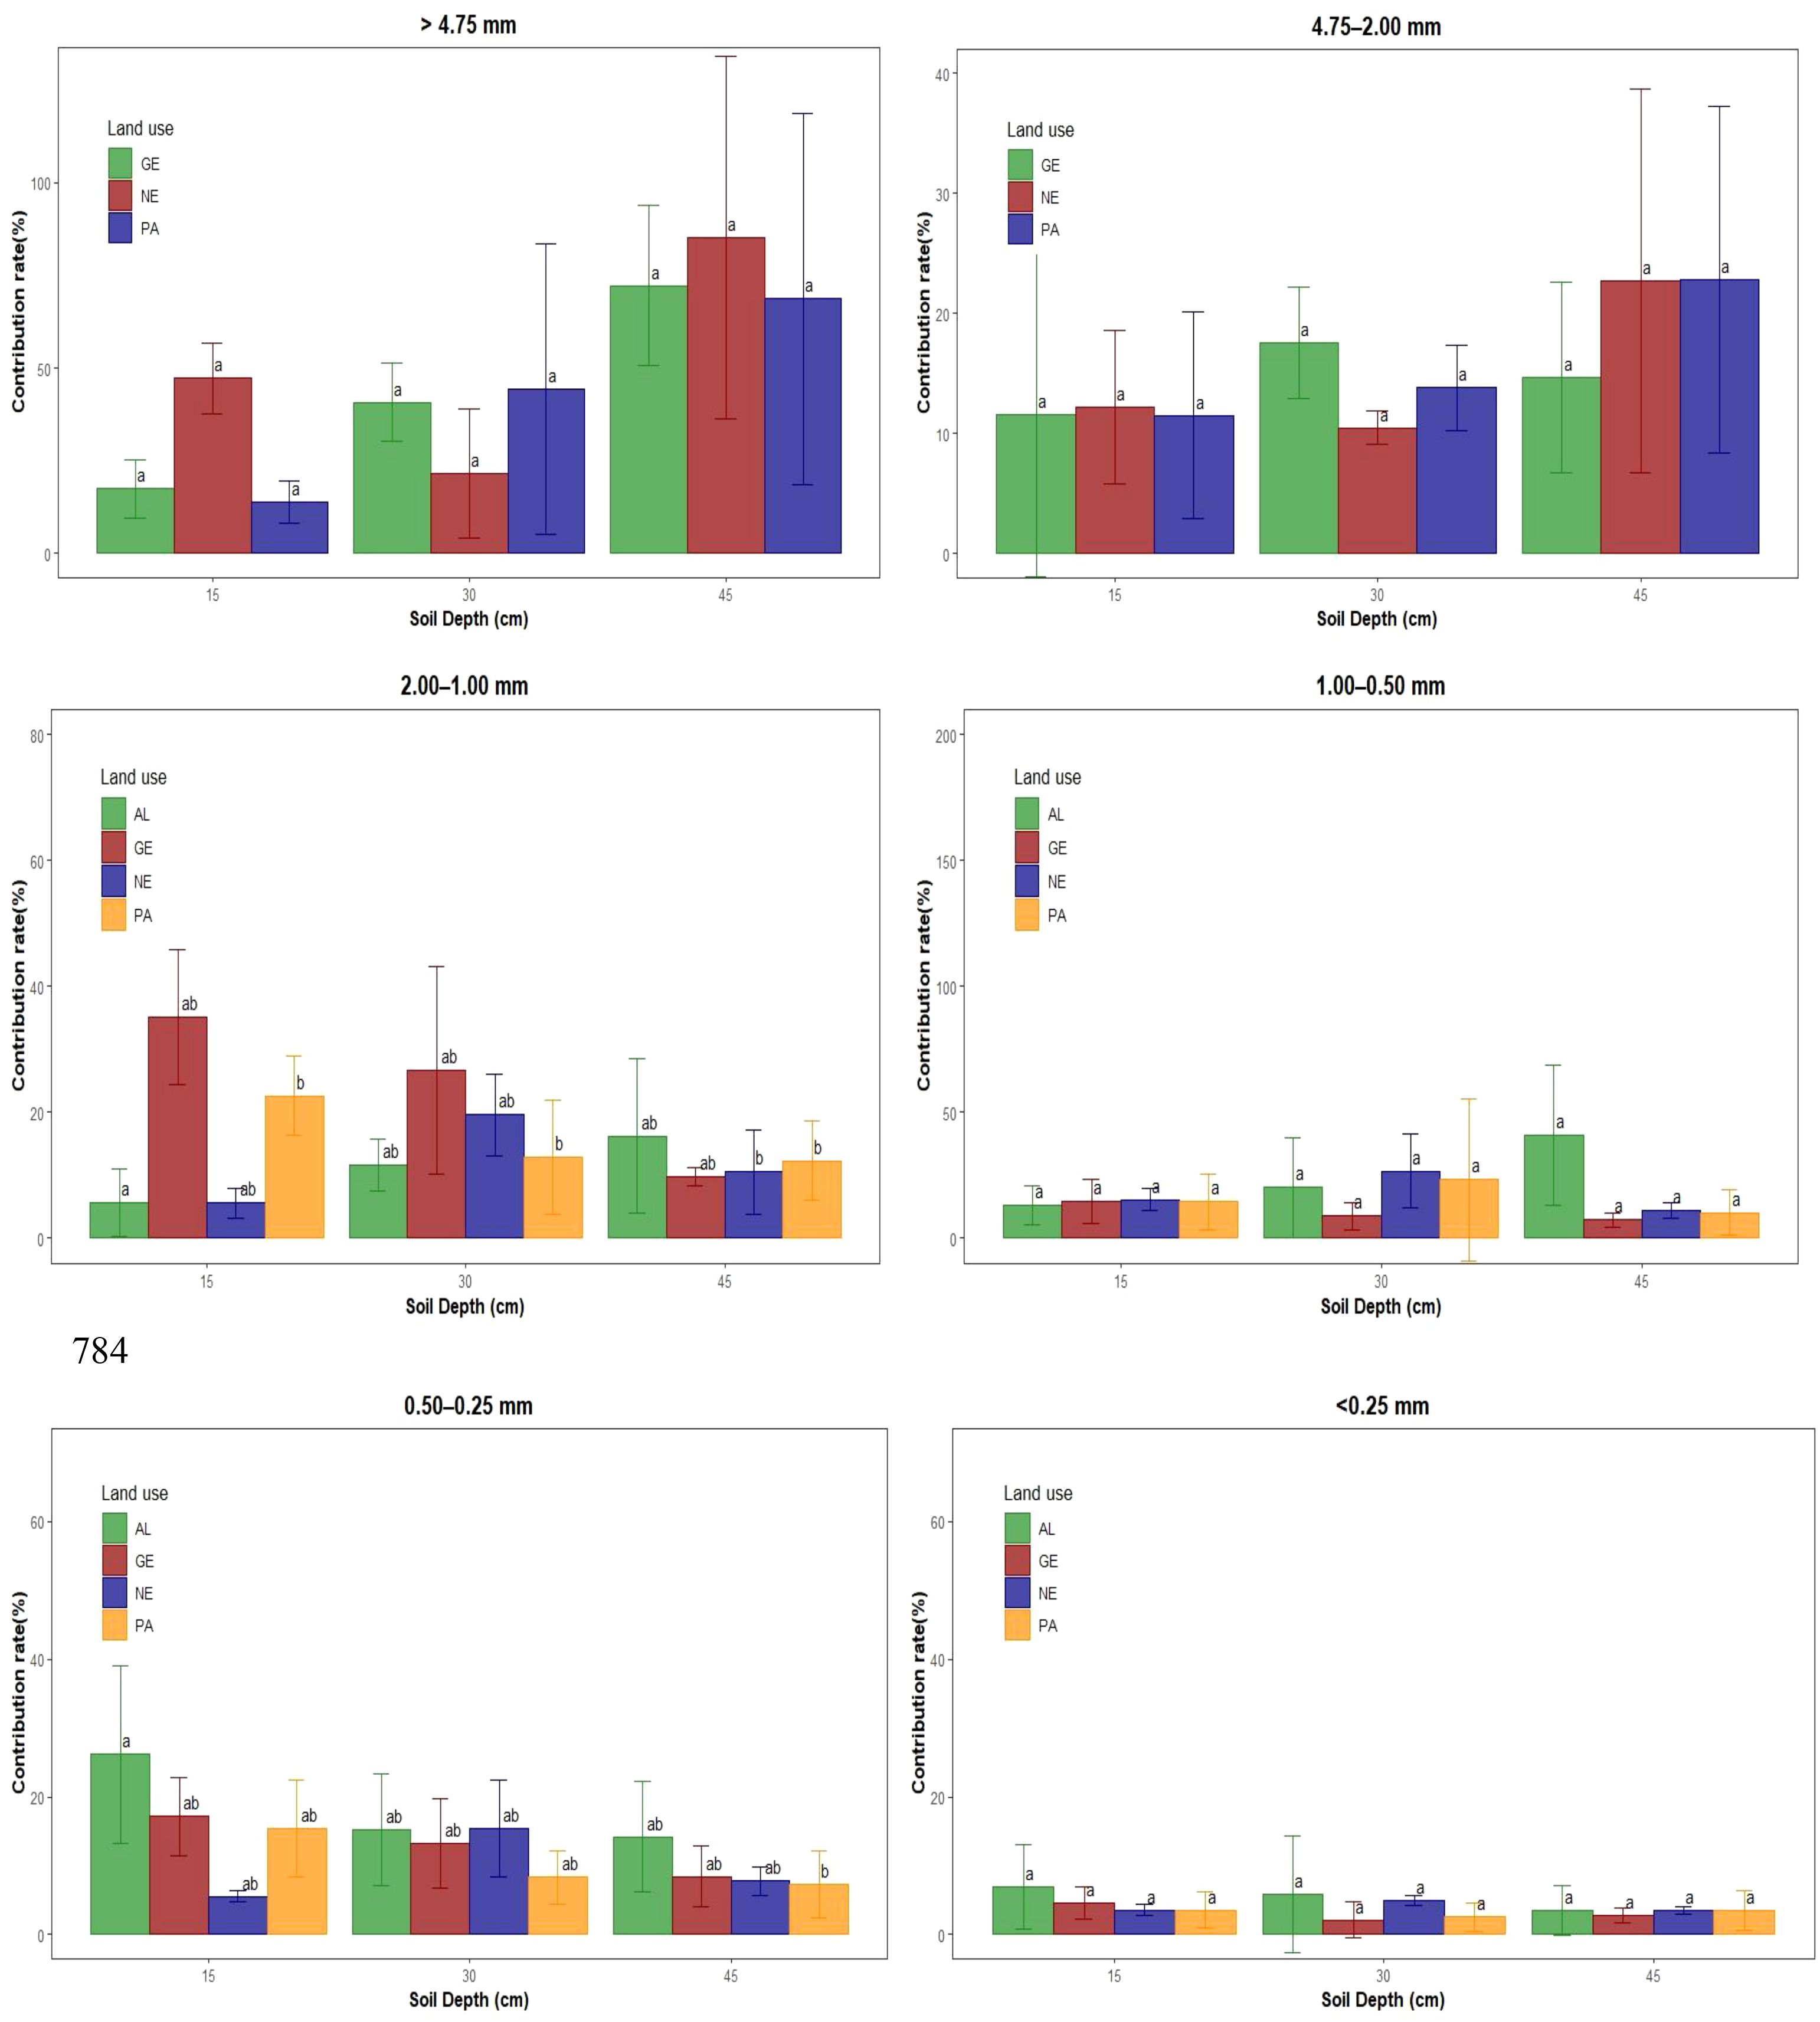
Figure 3. Contribution rates of aggregate classes to bulk soil organic carbon. Different letters indicate significant differences between land use types and soil depths (analysis of variance; P<0.05) within each aggregate size. AL, Arable land; GE, Grassland exclosures; PA, Pasture; and NE, Natural exclosures.
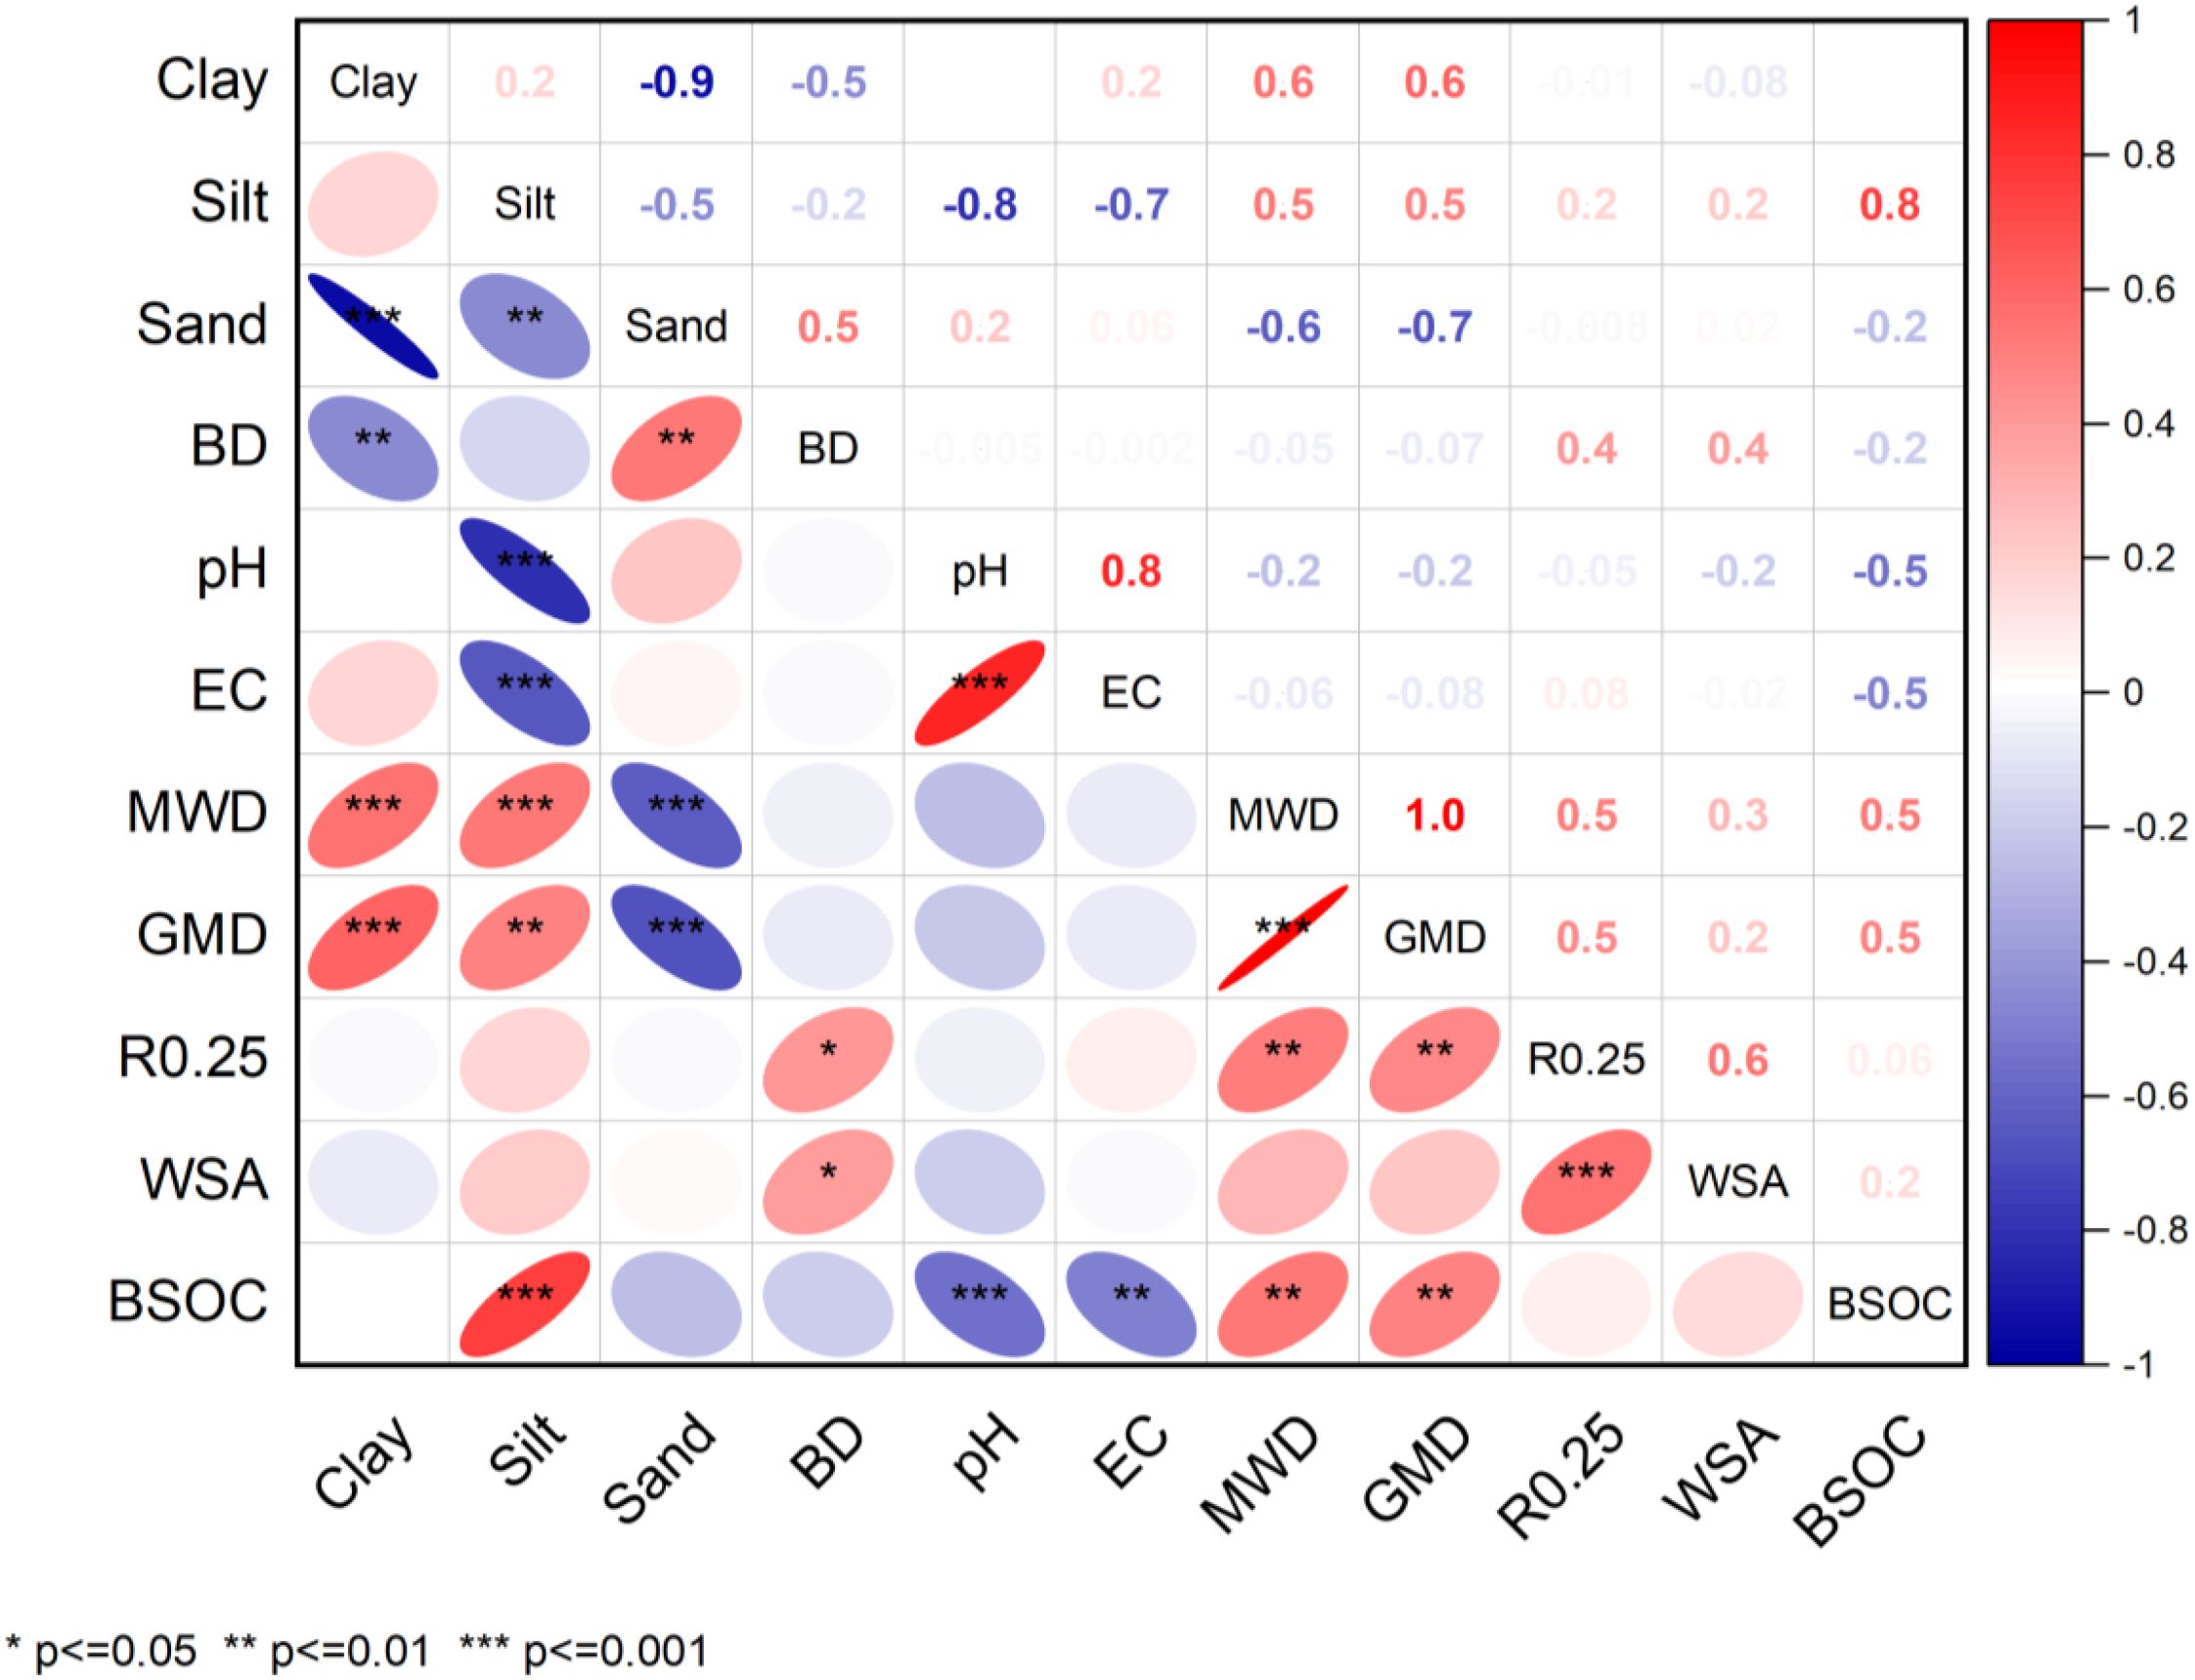
Figure 4. Pearson correlation between soil properties. BD, Bulk density; EC, Electrical conductivity; MWD, mean weight diameter; GMD, Geometric mean diameter; WSA, Water stable aggregates; R0.25, aggregates 0.25; BSOC, Bulk soil organic carbon.
3.4 Soil organic carbon stocks
The SOC stocks among the aggregate size fractions were significantly (P < 0.05) impacted by both soil depth and land use types. In comparison with the other land use types, NE resulted in greater SOC stocks in macro and mesoaggregates (>4.75 mm and 4.75–2.00 mm) at the 0–15 cm and 30–45 cm soil depths (Figure 5). Compared with the other land use types, GE resulted in the highest SOC stocks in the 2.00–1.00 mm aggregate size fraction at 0–15 cm, with the SOC stocks decreasing with depth, and the lowest value (1965 kg C m⁻²) was recorded at 30–45 cm. The SOC stocks in the 1.00–0.50 mm aggregate size class did not differ significantly (P > 0.05) among the soil depths and land use types. However, in the 0.50–0.25 mm aggregate fraction, land use type had a substantial effect on SOC levels, with AL resulting in greater SOC stocks. Nevertheless, no significant differences (P>0.05) were detected among the soil depths. The SOC stocks in the <0.25 mm fraction was the lowest among all aggregate size classes, and neither soil depth nor land use types had a significant (P > 0.05) effect on their concentrations.
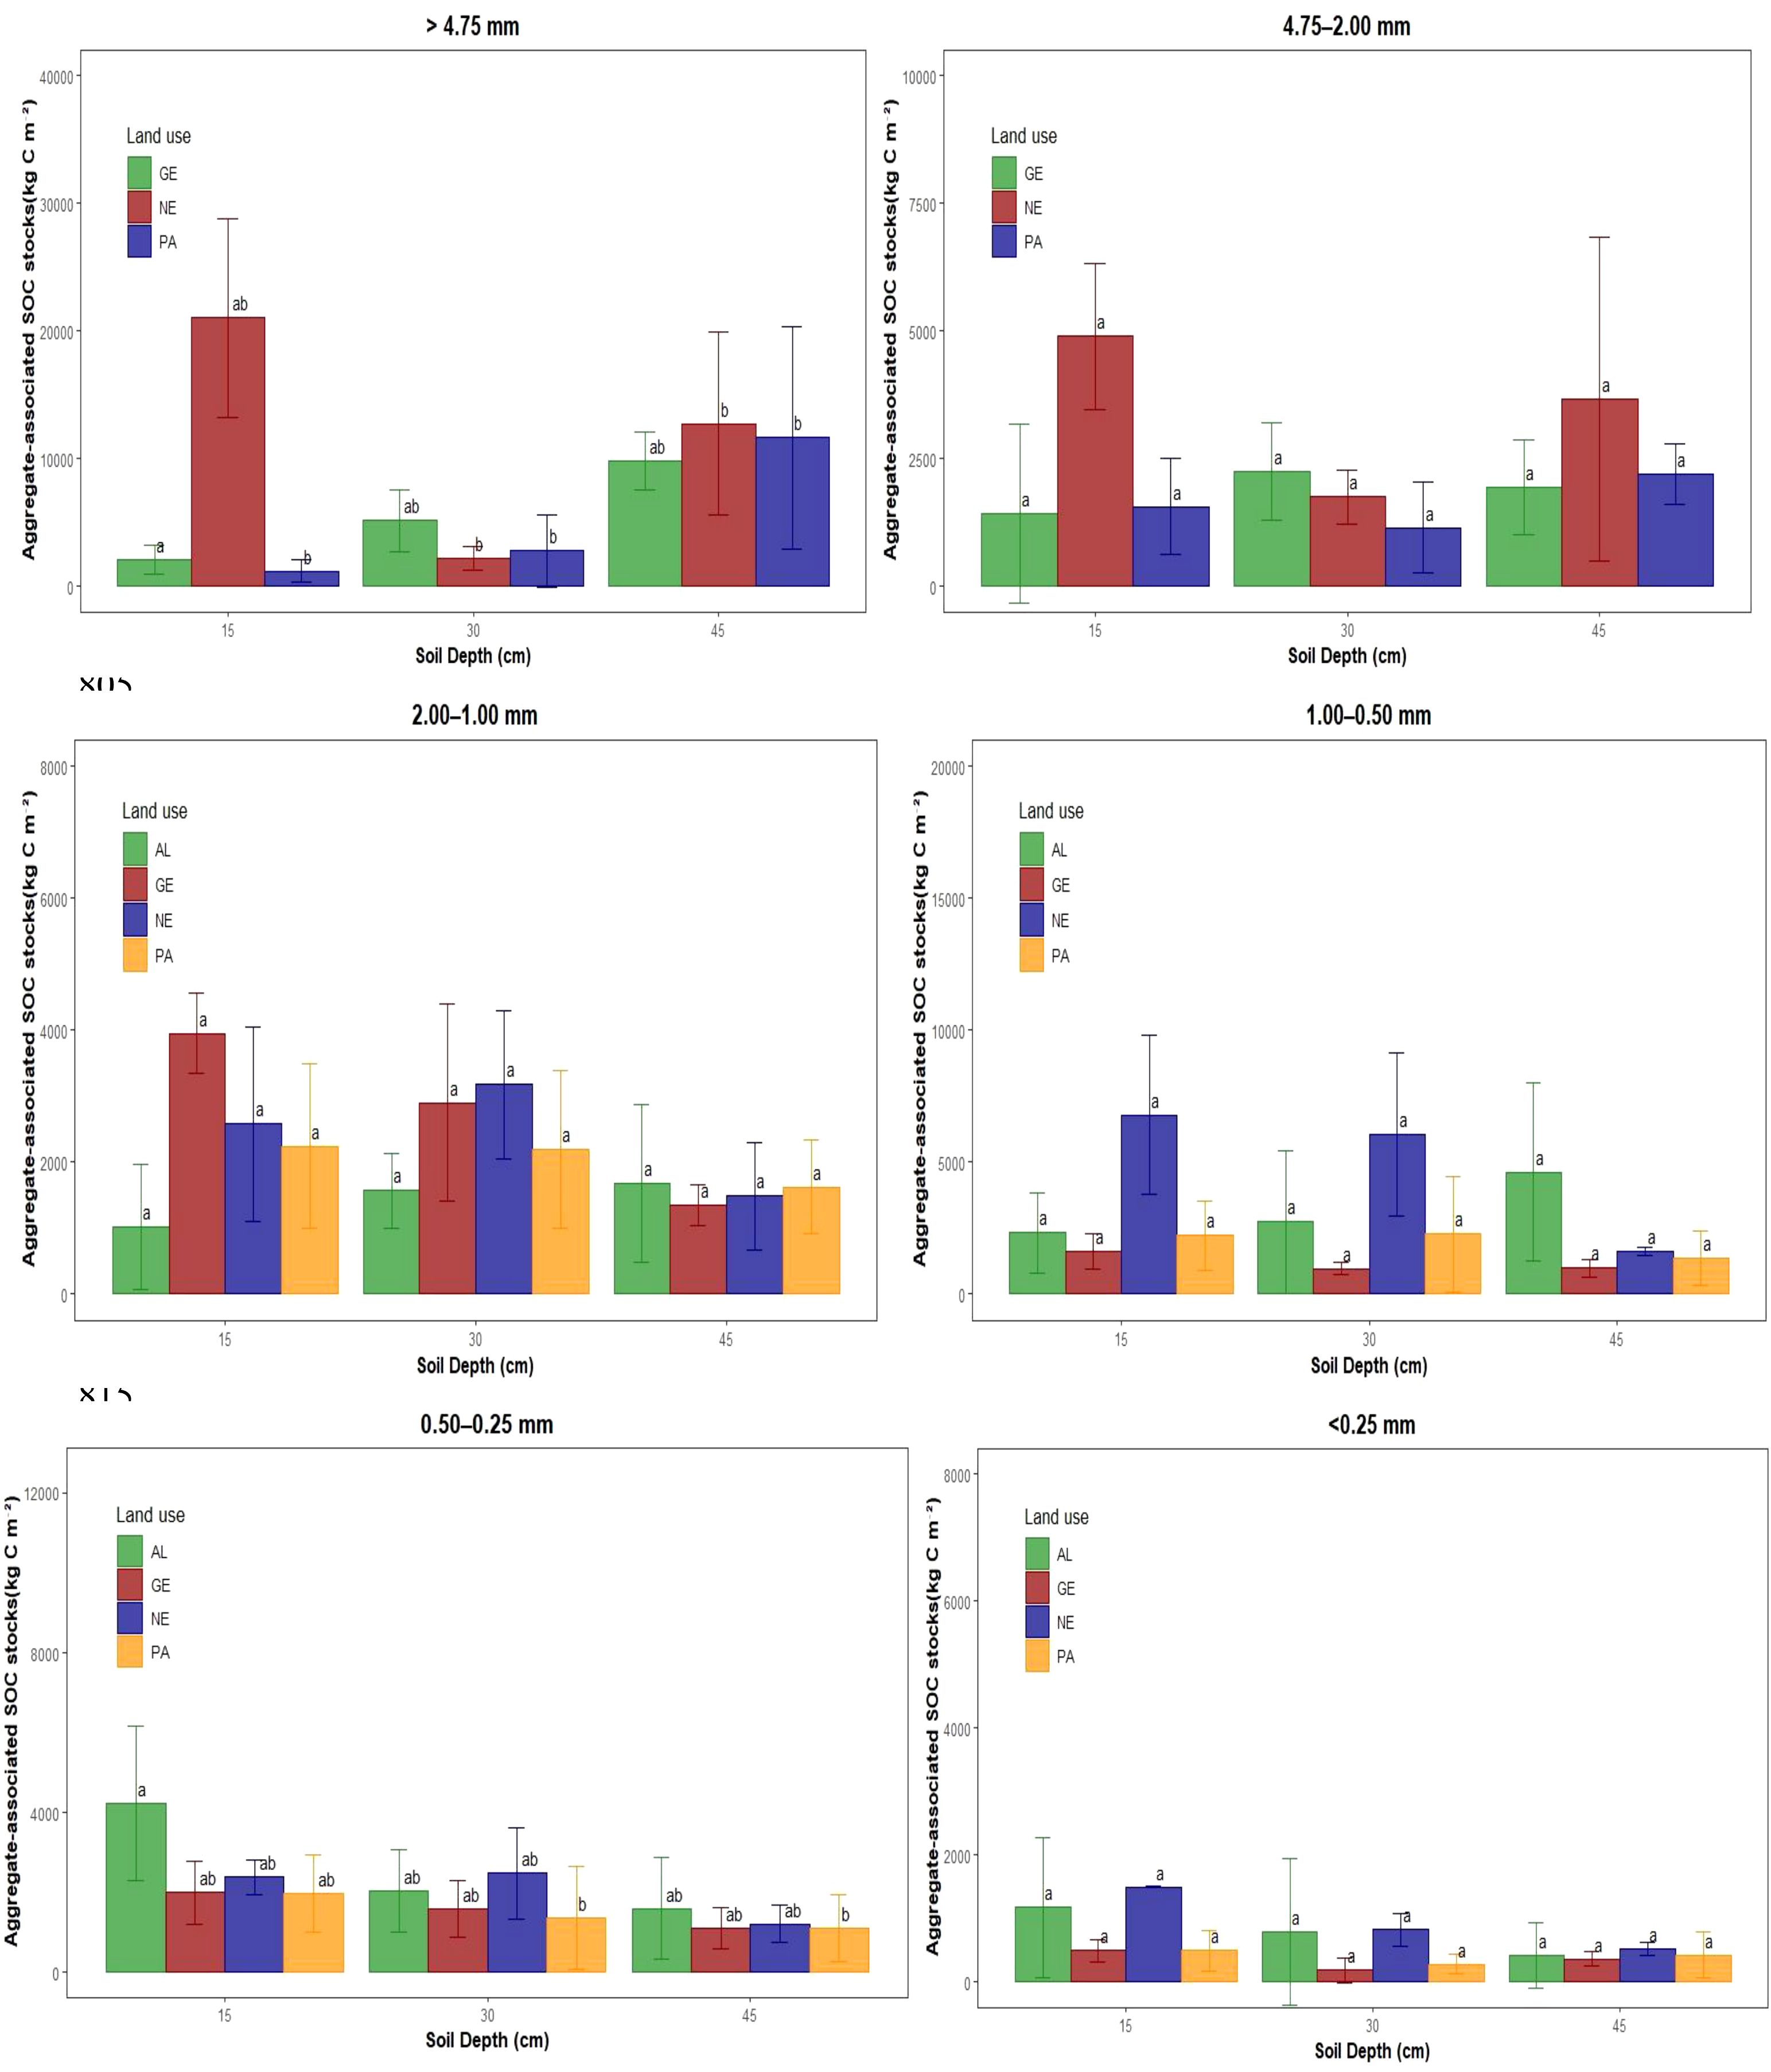
Figure 5. Aggregate associated organic carbon stocks per land use. Different letters indicate significant differences between land use types and soil depths (analysis of variance; P<0.05) within each aggregate size (mm). SOC stocks expressed in kg C m⁻²). AL, Arable land; GE, Grassland exclosure; PA, Pasture; and NE, Natural exclosure.
Land use types had a significant (P < 0.001) effect on the SOC stocks in the bulk soil, according to the two-way ANOVA result. Across all depths, NE had the highest SOC stores overall (Figure 6). The SOC stocks at 0–15 cm was greatest in NE (250 kg C m⁻²), followed by AL (80 kg C m⁻²). On the other hand, the SOC stocks in AL tended to decrease with depth. The impact of land use types on SOC stocks varied with depth. At 0–15 cm, the SOC stocks followed the order NE > AL > PA > GE, whereas the following decreasing pattern of SOC stocks was observed (NE > GE > AL > PA) at 15–30 cm. At 30–45 cm, the SOC stocks followed the sequence NE > GE > PA > AL.
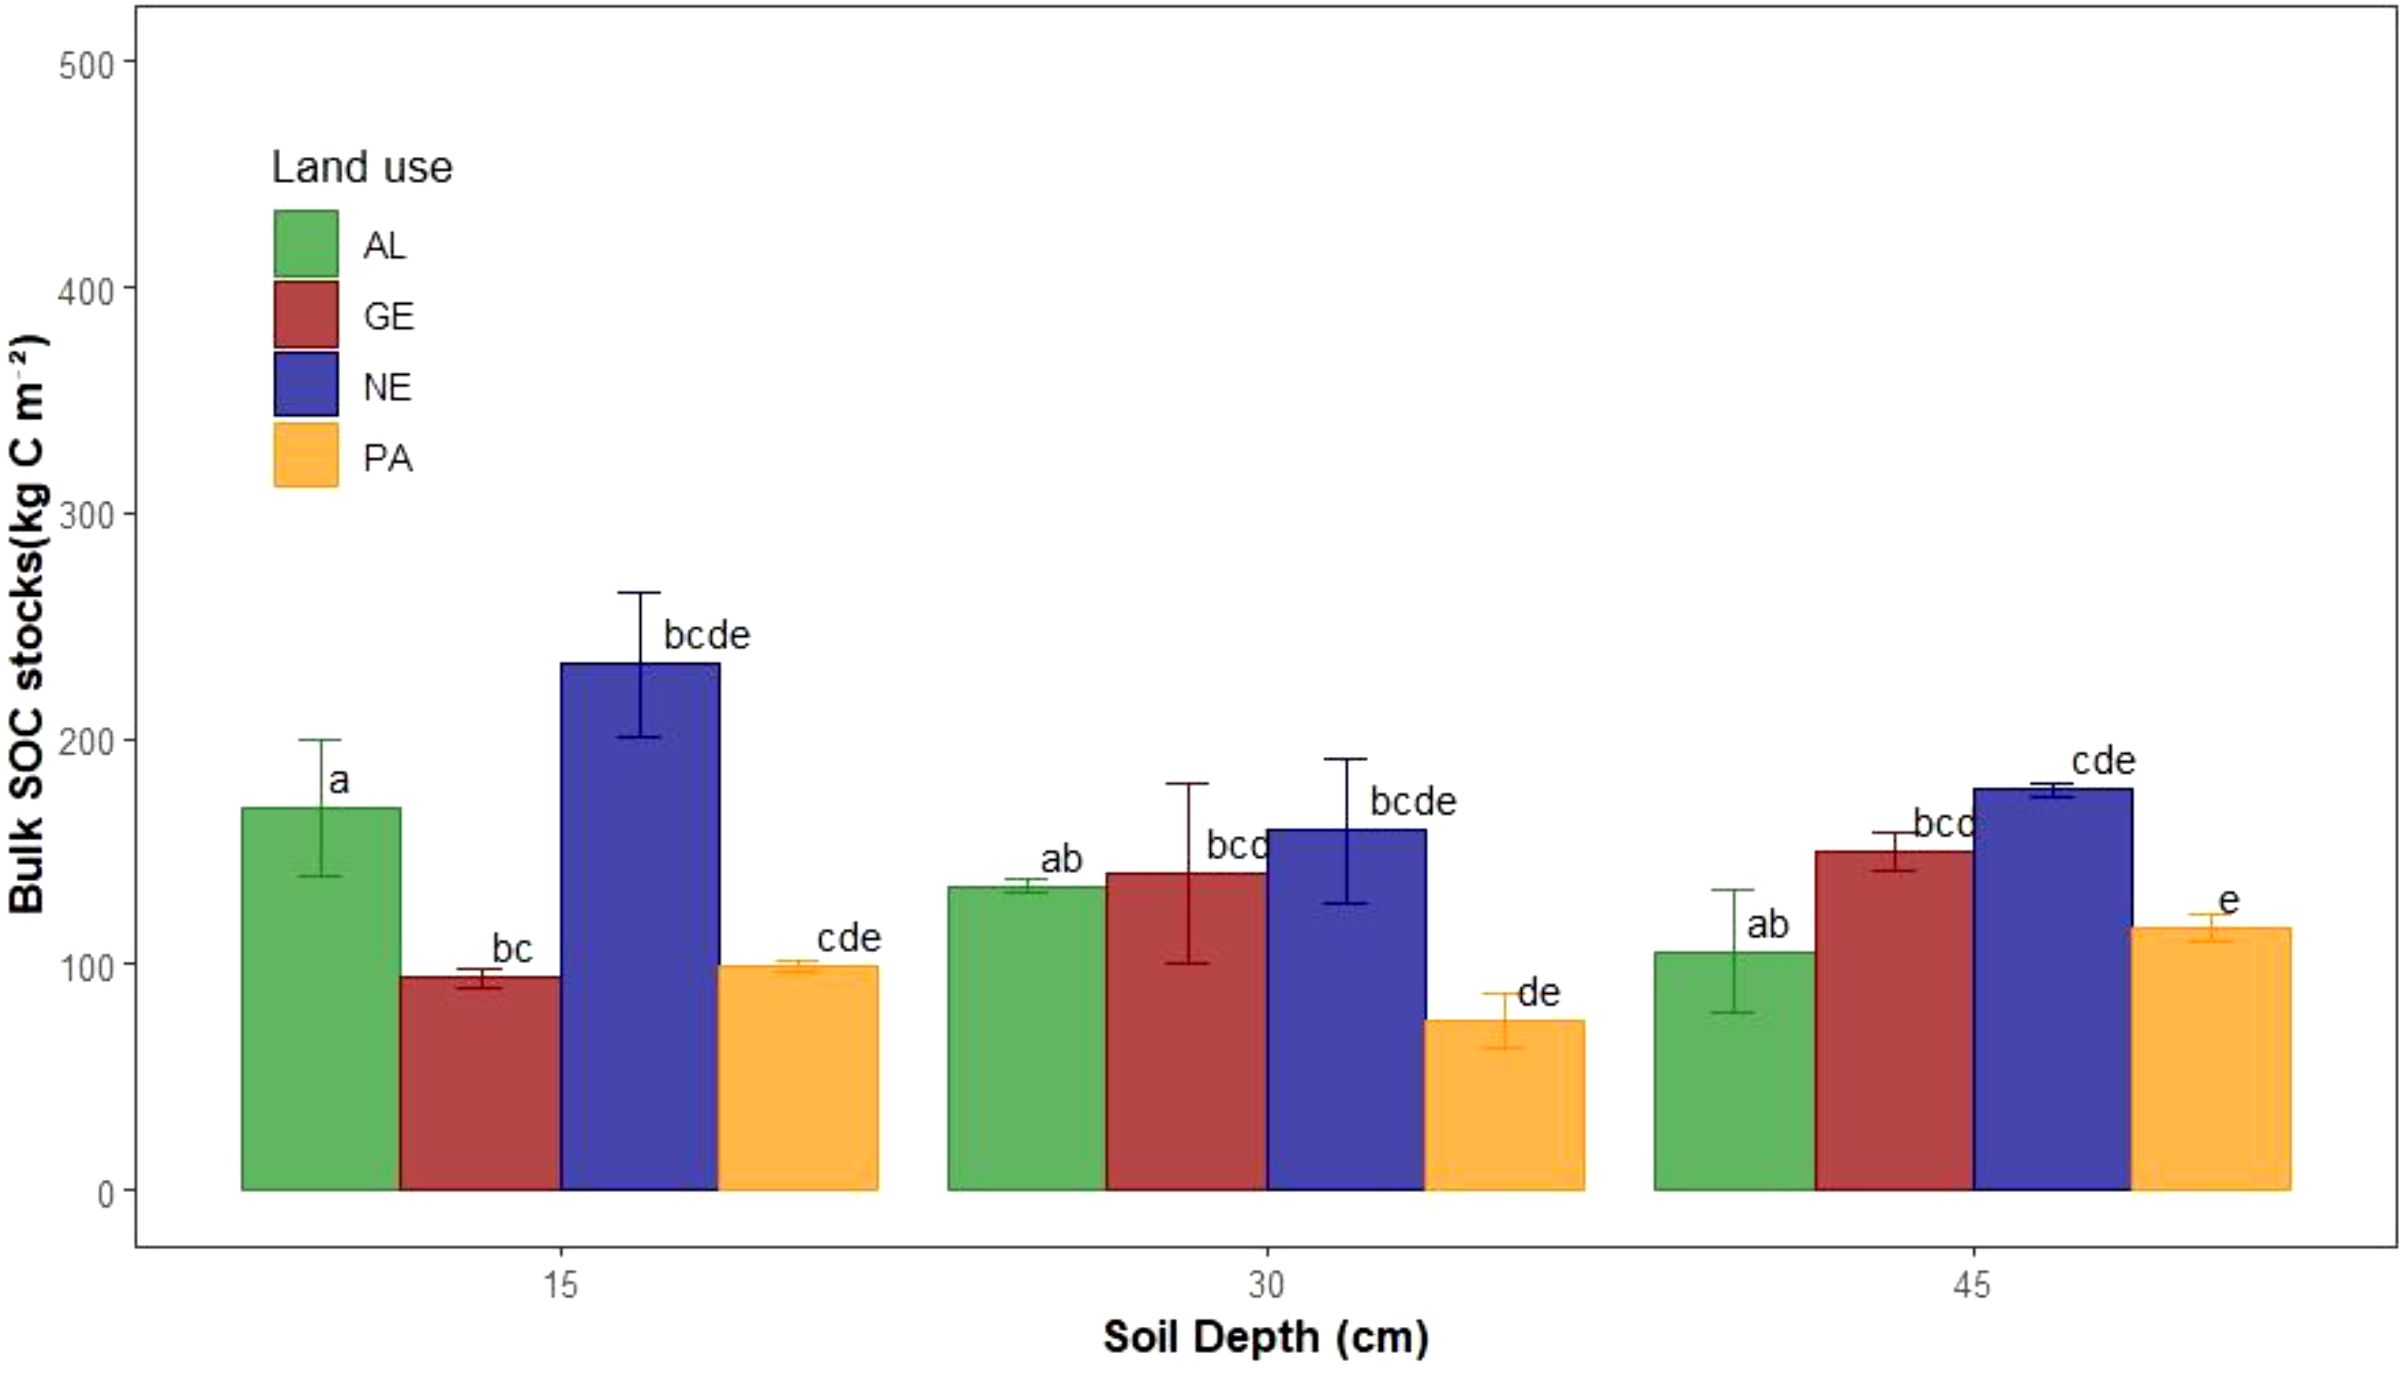
Figure 6. Bulk soil organic carbon stocks per land use. Different letters indicate significant differences between land use types and soil depths (analysis of variance; P<0.05). AL, Arable land; GE, Grassland exclosure; PA, Pasture; and NE, Natural exclosure.
To assess the relationship between aggregate-associated and bulk soil organic carbon stocks, a simple linear regression analysis was conducted (Figure 7). The linear model was statistically significant. However, in some cases, there were weak to no correlation scenarios between the SOC in the aggregates and bulk soils. The bulk soil organic carbon stocks were more significantly related to the macroaggregates (>4.75 mm and 4.75–2.00 mm), with coefficients of determination (R) of 0.34 and 0.2, respectively, than to the mesoaggregates (0.5–0.25 mm and <0.25 mm). This finding indicates that only a small proportion of the variation in large aggregate-associated SOC can be explained by bulk SOC.
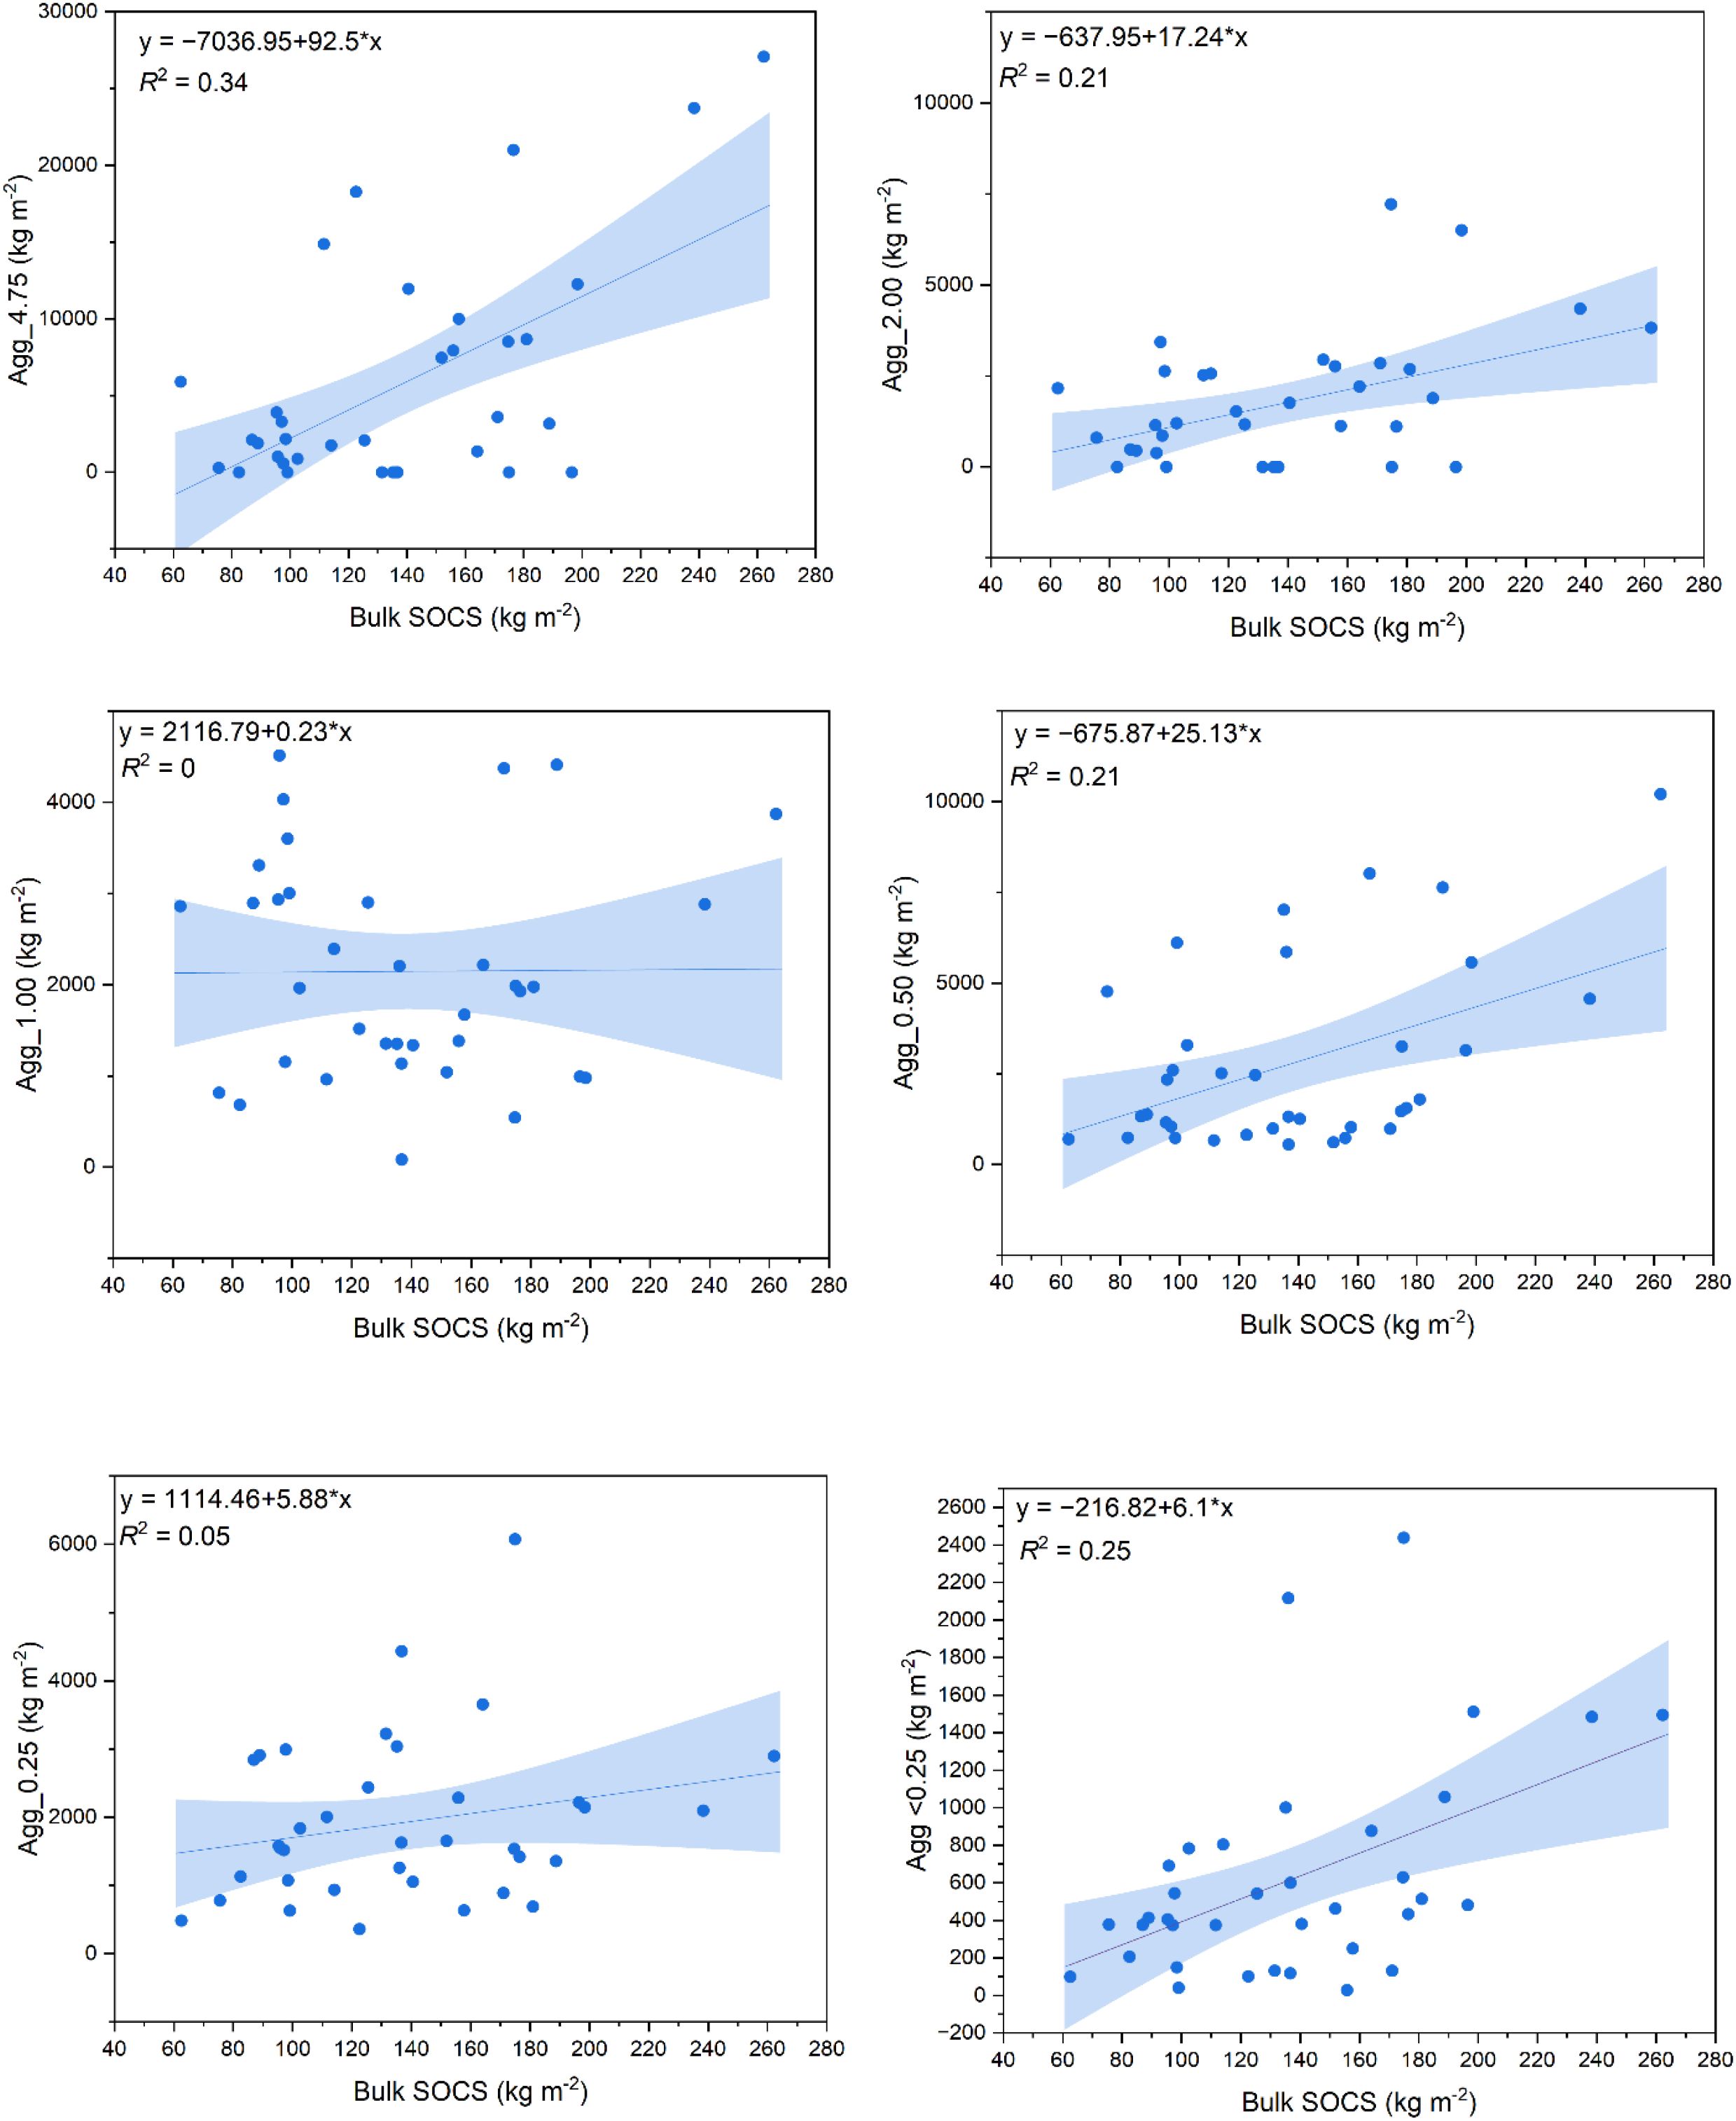
Figure 7. Linear relationships between organic carbon stocks within different aggregate size classes and total (bulk) soil organic carbon stocks.
4 Discussion
4.1 Soil properties
The particle size distribution analysis result shows that all the soils at the three depths consistently had clay contents above 30%. This is in agreement with the soil map of the region (26), which classified the soils of Pandamantenga as Vertisols, given that they contain vertic layers (clayey subsurface horizons with polished and grooved ped surfaces known as slickensides) and wedge-shaped parallelepiped structural aggregates. The high clay content of the soils can be attributed to the nature of the parent material, basalt. Parent material has been proven to be an active factor in soil formation. In Botswana, Vertisols are quite limited and, where available, are extensively used for agriculture because of their ability to retain moisture (27).
The soil bulk density pattern in pastures was non-uniform. In NE and GE, it increased with depth, and declined with depth in AL. The highest bulk density (1.3 g cm-3) was recorded at the 0–15 cm depth of AL, whereas the lowest value (0.8 g cm-3) was found in GE (Supplementary Table S1). The pattern seen in the bulk density results could be attributed to the influence of land use, such as tillage in the arable land, texture, organic matter, and moisture content. Due to their high clay contents, the physical properties of Vertisols are generally affected by moisture content due to their characteristic shrinking and swelling (28). The relatively high bulk density of the soils is also attributed to the low content of organic matter. High organic matter content has been reported to lower soil bulk density (29).
For the most part, the pH of the soils exceeded 7, indicating they are alkaline. It is very common to find alkaline soils in Botswana and semi-arid soils in general due to low rainfall, which promotes the accumulation of basic cations at and near surface soils (30, 31). Based on the soil salinity classes, the soils are non-saline, given that the values were below 2000 µS cm-1. The non-salinity of the soils could be attributed to the location of the study area on alluvial Plains, which from time to time is subjected to an influx of water. With regards to the nutrients (basic cations), the parent material could have played an important role. Ultrabasic rocks like basalt are known to have high calcium content, and this is quite evident from the high contents of Ca2+ in the soils. The calcium is actively involved in the formation of pedogenic carbonates in soils. In semi-arid environments, soil inorganic carbonates play key roles in terrestrial carbon cycling (32). Parent materials and anthropogenic sources account for basic cations in soils. Therefore, given the uniformity of parent materials in the Plains, variations in the content of nutrients could be attributed to human influence and land use.
4.2 Soil aggregate parameters and land use
The factor analyses (Supplementary Figure S3) show that arable land was mostly associated with meso and microaggregate fractions, suggesting a shift toward microaggregate dominance under this land use regime. This pattern aligns with the findings of (33), who reported that agricultural land tends to have a higher proportion of microaggregates, which may result from the physical disruption of macroaggregates due to conventional management practices.
In contrast, macroaggregates (mostly >4.75 mm and 4.75—2.00 mm) were observed in both NE and GE. These land use types also recorded higher MWD, GMD, and R0.25 as compared to AL. This can be associated with the fact that soil aggregate stability is primarily regulated by binding agents between soil particles, with organic materials being the most prominent in these soils (34). Factor analyses showed that BSOC was mostly linked to NE and GE (Supplementary Figure S3), where leaf litter and root exudates from plant biomass contributed to the soil organic matter. Organic matter increases soil aggregation through enhancing microbial activity, resulting in cementing agents that bind soil particles together to form large and stable aggregates (35). Lower SOC levels in AL soils, in comparison, could reflect reduced organic matter inputs and increased rates of SOC mineralization. This is consistent with reports by (36) who found that forest soils had higher MWD and GMD and more resilient macroaggregates than cultivated soils. Similarly, previous studies (37–39) show that long-term conservation tillage (as obtained in arable land) can promote WSA macroaggregates, improve MWD, and enhance SOC content and storage. These insights support the broader understanding that land use management significantly influences soil structure and carbon dynamics. Furthermore, higher MWD and GWD can be attributed to the recurring wetting and drying (WD) of the soils and higher clay contents. Large aggregates are therefore formed as a result of WD being encouraged by the high clay concentration in the soils under natural and grassland exclosures. The findings highlight the effects of land use change and management approaches on soil structure and aggregate size distribution, highlighting the necessity of sustainable land management in preserving soil stability and function.
For aggregate-associated SOC in the land use regimes, our findings align with earlier research, indicating that aggregate-associated SOC varies for aggregate size and land use regimes (40–42). All aggregate fractions in NE showed increases in OC concentrations (Supplementary Figure S4). In addition, fast turnover aggregate fractions, such as the macroaggregates (> 4.75 mm, 4.75-2.00 mm, and 2.00—1.00 mm), showed greater increases in OC concentrations in natural and grassland exclosures (Table 3). The greater SOC content in macroaggregates observed in this study can be explained by the hierarchical soil aggregation theory (43). According to this theory, organic cementing agents such as root exudates, fungal hyphae, and polysaccharides bond together smaller soil particles (e.g., silt and clay) to produce macroaggregates. As the binding agent concentration increases, the SOC becomes more stable within larger aggregates, reducing degradation by soil microorganisms. These results are consistent with the results of (44) study, which found that the majority of SOC was deposited in macroaggregates, indicating that organic materials were the primary binding agent for aggregates in their soils.
Interestingly, our factor analysis (Supplementary Figure S4) also showed that AL lacked a significant amount of aggregate-associated organic carbon. This pattern indicated the loss of protective aggregate structures and reduced organic matter inputs. The breakdown of macroaggregates in AL likely increased the exposure of SOC to microbial decomposition, contributing to carbon loss. These findings support earlier studies such as (45), which reported that land conversion to agriculture leads to macroaggregate disintegration and SOC redistribution or depletion.
Due to the addition of significant amounts of plant debris to the soil, the no-tilled ecosystems (such as NE and GE) caused fine soil particles to aggregate or increased root exudates, which is why the outcomes were anticipated. The less soil disturbance in NE aided in shielding SOM from microbial degradation in various aggregate-size classes, which in turn promoted the formation of physically stable soil macroaggregates (46). In addition (47), reported that in the forests of Desa'a and Hugumburda, Ethiopia, macroaggregates had higher organic carbon levels than microaggregates, particularly in the surface layer, which suggested that macroaggregates play a crucial role in the retention of organic carbon in their study. These findings imply that macroaggregate dynamics may have a bigger impact on the long-term carbon sequestration potential in these soils than direct land use effects on microaggregates, since microaggregates are known to shield SOC from microbial decomposition over longer timescales (48).
4.3 Soil organic carbon stocks and management implications
Soil depth had a substantial impact on SOC stocks across the land use types. Overall, greater SOC stocks were found in the topsoil (0–15 cm), with a significant decrease in deeper layers (Figure 5). This pattern is compatible with the accumulation of new organic matter on the soil surface, which is mostly sourced from plant biomass, litter, and root residues, supported by dense fine root networks. However, there was one exception in NE, where SOC stocks were larger in the 30–45 cm layer than in the 15–30 cm layer. This anomaly could be due to the downward migration of dissolved organic carbon (49), deep-rooting vegetation, or enhanced microbiological contributions (50). This tendency is consistent with (51), who observed a similar SOC increase in deeper layers following an initial fall, and it could be attributed to mechanisms such as bioturbation, mixing by soil fauna, or leaching and illuviation. Earthworm activity, particularly by anecic species, can transfer considerable amounts of surface organic matter into subsoil strata via burrows and middens (52), hence increasing SOC accumulation at lower depths. In a related study (53), reported higher SOC stocks in the upper soil layers in forest soils. The tree's deeper root systems accumulate more biomass, which is shielded from decomposition due to slower oxygen diffusion and substrate restriction (54). In contrast, grassland exclosures showed rising SOC stocks with depth, possibly due to periodic veldfires, which might have depleted carbon while promoting carbon stabilization in subsoil layers via resistant root biomass. Additionally (55), found similar findings, with grasslands having more SOC adsorption capacity than cultivated fields.
Our findings further show that arable land held more organic carbon stocks in the surface soils than in the subsoils. However, since SOC stocks were calculated using BD as a multiplying factor, the elevated values in arable soils may be more indicative of increased soil compaction resulting from repeated tillage and heavy machinery use than of higher organic carbon concentrations. Likewise, arable land exhibited higher SOC stocks in the upper surface (0–15 cm) in the 0.5-0.25 mm fraction. This may be attributed to frequent tillage, which might have promoted aggregate turnover by fragmenting larger aggregates into smaller aggregates and transferring carbon into this finer aggregate size (56). These findings highlight the importance of focused soil conservation methods, such as minimal soil disturbance and vegetative cover, to increase SOC sequestration, improve soil fertility, and promote long-term crop production.
The results of this study emphasize the necessity of preserving stable macroaggregates in order to maximize soil quality and SOC sequestration. In semiarid alluvial ecosystems like Pandamatenga Plains, land management techniques that promote the development of macroaggregates and soil moisture conservation, such as reduced tillage, organic supplements, and vegetation restoration, may be crucial in reducing carbon losses and enhancing soil health. These practices not only promote aggregate stability but also help to ensure the long-term resilience and sustainability of agricultural systems in dryland environments.
5 Conclusion
This study assessed the differential impacts of land use regimes on soil aggregate stability and soil organic carbon (SOC) storage in the semi-arid Vertisols of the Pandamatenga Plains, northern Botswana. The findings suggest that land use significantly affects soil structural characteristics and organic carbon dynamics. Exclosures supported higher macroaggregate formation and greater aggregate stability, as indicated by increased mean weight diameter and geometric mean diameter. These land use regimes also showed higher aggregate-associated SOC, particularly within macroaggregate fractions. In contrast, arable land recorded reduced macro aggregation, lower stability indices, and a dominance of smaller aggregates. Although higher surface SOC stocks were observed in arable land, the overall structure was more vulnerable to degradation, suggesting possible limited carbon protection. The study further revealed that finer soil particles (clay and silt) positively influenced aggregate stability, while sand content had a negative effect. Strong positive relationships between aggregate stability indices and SOC content reinforce the central role of organic matter in soil structural stability and functioning. This study emphasizes the importance of sustainable land use management, such as reduced soil disturbance, organic matter inputs, and vegetation restoration, to promote macroaggregate formation and enhance SOC sequestration. Such practices are essential for improving soil health, reducing erosion, and building climate resilience in dryland agricultural systems. Future research should include long-term monitoring across seasons and explore biological drivers of aggregation to better inform land use strategies that enhance carbon retention and soil sustainability.
Data availability statement
The original contributions presented in the study are included in the article/Supplementary Material. Further inquiries can be directed to the corresponding author.
Author contributions
PP: Formal Analysis, Investigation, Methodology, Writing – original draft, Writing – review & editing. FD: Data curation, Investigation, Methodology, Writing – review & editing. PE: Conceptualization, Investigation, Resources, Supervision, Validation, Writing – review & editing, Methodology.
Funding
The author(s) declare that no financial support was received for the research and/or publication of this article.
Conflict of interest
The authors declare that the research was conducted in the absence of any commercial or financial relationships that could be construed as a potential conflict of interest.
The reviewer CCO declared a past collaboration with the authors PE to the handling editor.
Generative AI statement
The author(s) declare that no Generative AI was used in the creation of this manuscript.
Publisher’s note
All claims expressed in this article are solely those of the authors and do not necessarily represent those of their affiliated organizations, or those of the publisher, the editors and the reviewers. Any product that may be evaluated in this article, or claim that may be made by its manufacturer, is not guaranteed or endorsed by the publisher.
Supplementary material
The Supplementary Material for this article can be found online at: https://www.frontiersin.org/articles/10.3389/fsoil.2025.1629431/full#supplementary-material
References
1. Peng X, Huang Y, Duan X, Yang H, and Liu J. Particulate and mineral-associated organic carbon fractions reveal the roles of soil aggregates under different land-use types in a karst faulted basin of China. Catena. (2023) 220:106721. doi: 10.1016/j.catena.2022.106721
2. Lehmann J, Bossio DA, Kögel-Knabner I, and Rillig MC. The concept and future prospects of soil health. Nat Rev Earth Environ. (2020) 1:544–53. doi: 10.1038/s43017-020-0080-8
3. Liu X, Liu J, Huang J, Chen Y, Zhang L, Qi Y, et al. Response of soil aggregate stability to phosphorus, nitrogen, and organic fertilizer addition: A meta-analysis. Sustainability. (2023) 15:10601. doi: 10.3390/su151310601
4. Zhang X, Zhang W, Sai X, Chun F, Li X, Lu X, et al. Grazing altered soil aggregates, nutrients and enzyme activities in a Stipa kirschnii steppe of Inner Mongolia. Soil Tillage Res. (2022) 219:105327. doi: 10.1016/j.still.2022.105327
5. Shrestha BM, Singh BR, Sitaula BK, Lal R, and Bajracharya RM. Soil aggregate- and particle-associated organic carbon under different land uses in Nepal. Soil Sci Soc America J. (2007) 71:1194–203. doi: 10.2136/sssaj2006.0405
6. Feng H, Wang S, Gao Z, Pan H, Zhuge Y, Ren X, et al. Aggregate stability and organic carbon stock under different land uses are integrally regulated by binding agents and chemical properties in saline-sodic soils. Land Degradation Dev. (2021) 32:4151–61. doi: 10.1002/ldr.4019
7. Xiao H, Liu G, Zhang Q, Fenli Z, Zhang X, Liu P, et al. Quantifying contributions of slaking and mechanical breakdown of soil aggregates to splash erosion for different soils from the Loess plateau of China. Soil Tillage Res. (2018) 178:150–8. doi: 10.1016/j.still.2017.12.026
8. Bossio DA, Cook-Patton SC, Ellis PW, Fargione J, Sanderman J, Smith P, et al. The role of soil carbon in natural climate solutions. Nat Sustainability. (2020) 3:391–8. doi: 10.1038/s41893-020-0491-z
9. Rabbi SMF, Wilson BR, Lockwood PV, Daniel H, and Young IM. Aggregate hierarchy and carbon mineralization in two Oxisols of New South Wales, Australia. Soil Tillage Res. (2015) 146:193–203. doi: 10.1016/j.still.2014.10.008
10. Zajícová K and Chuman T. Effect of land use on soil chemical properties after 190 years of forest to agricultural land conversion. Soil Water Res. (2019) 14:121–31. doi: 10.17221/5/2018-SWR
11. Bandyopadhyay KK and Lal R. Effect of land use management on greenhouse gas emissions from water-stable aggregates. Geoderma. (2014) 232:363–72. doi: 10.1016/j.geoderma.2014.05.025
12. Plaza C, Zaccone C, Sawicka K, Méndez AM, Tarquis A, Gascó G, et al. Soil resources and element stocks in drylands to face global issues. Sci Rep. (2018) 8:1–8. doi: 10.1038/s41598-018-32229-0
13. Junior CRP, Pereira MG, José de Souza Filho O, and Beutler SJ. Can topography affect the restoration of soil properties after deforestation in a semiarid ecosystem? J Arid Environments. (2019) 162:45–52.
14. León-Sobrino C, Ramond JB, Maggs-Kölling G, and Cowan DA. Nutrient acquisition, rather than stress response over diel cycles, drives microbial transcription in a hyper-arid Namib Desert soil. Front Microbiol. (2019) 10:1054. doi: 10.3389/fmicb.2019.01054
15. Kakooza SP. Assessment of water quality in a drainage channel at pandamatenga commercial arable farms for possible agricultural reuse. Gaborone, Botswana: Botswana University of Agriculture & Natural Resources. (2023) p. 0–18.
16. Astatke A, Jabbar M, Mohamed Saleem MA, and Erkossa T. Agricultural mechanization in asia, africa and latin america. AGRIS - International System for Agricultural Science and Technology. (2007) 38:42–7.
17. Gee GW and Bauder JW. Particle-size analysis. In: Methods of soil analysis: Part 1 Physical and mineralogical methods, Madison, Wisconsin, USA. vol. 5. (1986). p. 383–411.
18. Blake GR and Hartge KH. Bulk density. In: Methods of soil analysis: Part 1 Physical and mineralogical methods, Madison, Wisconsin, USA. vol. 5. (1986). p. 363–75.
19. FAO. Standard operating procedure for soil electrical conductivity, soil/water Vol. 1. Rome: FAO (2021). p. 5.
20. FAO. Standard operating procedure for cation exchange capacity and exchangeable bases 1N ammonium acetate, pH 7.0 method. (2022) Rome, Italy.
21. Kemper WD and Rosenau RC. Aggregate stability and size distribution. In: Methods of soil analysis: Part 1 Physical and mineralogical methods, Madison, Wisconsin, USA. vol. 5. (1986). p. 425–42.
22. Du ZL, Ren TS, Hu CS, Zhang QZ, and Blanco-Canqui H. Soil aggregate stability and aggregate-associated carbon under different tillage systems in the North China Plain. J Integr Agric. (2013) 12:2114–23. doi: 10.1016/S2095-3119(13)60428-1
23. Food and Agriculture Organization (FAO). (2006). Global Forest Resources Assessment 2005: progress towards sustainable forest management. FAO Forestry Paper. 147, Rome, Italy: FAO. Available online at: http://www.fao.org/forestry/site/1191/en/
24. R Core Team. R: A language and environment for statistical computing. Vienna, Austria: R Foundation for Statistical Computing (2021). Available online at: https://www.R-project.org/.
26. De Wit PV and Nachtergaele FO. Explanatory note on the soil map of the Republic of Botswana. In: Annex 1: Typifying pedons and soil analytical data. Republic of Botswana: FAO (1990).
27. Eze PN, Ebouel FJD, Nkonga I, Musiol A, Schleicher AM, Günter C, et al. Weathering intensity and trace elements (Ni, Sr, Zn, and Cr) distribution in Vertisols developed on basalt in a semiarid environment: agronomic implications. Front Soil Science. (2025) 5:1530962. doi: 10.3389/fsoil.2025.1530962
28. Wilson MG, Sasal MC, and Caviglia OP. Critical bulk density for a Mollisol and a Vertisol using the least limiting water range: Effect on early wheat growth. Geoderma. (2013) 192:354–61. doi: 10.1016/j.geoderma.2012.05.021
29. Mindari W, Chakim MG, Sasongko PE, Aditya HF, Karam DS, and Masri IN. The role of microclimate, vegetation variety and land use in the formation of humic substances. Malaysian J Soil Sci. (2024) 28:212–29.
30. Dierickx WR. The salinity and alkalinity status of arid and semi-arid lands. In: Encyclopedia of land use, land cover and soil sciences, Oxford, United Kingdom vol. 5. (2009). p. 163–89.
31. Matshameko Y, Okolo CC, and Eze PN. Near-surface pedosediments of Takatokwane saline pan, southern Botswana: Properties, pedogenic processes, and inferences of environmental change. Geoderma Regional. (2023) 34:e00696. doi: 10.1016/j.geodrs.2023.e00696
32. Ebouel FJD, Betsi TB, and Eze PN. Soil inorganic carbon: a review of global research trends, analytical techniques, ecosystem functions and critical knowledge gaps. Catena. (2024) 242:108112. doi: 10.1016/j.catena.2024.108112
33. Devine S, Markewitz D, Hendrix P, and Coleman D. Soil aggregates and associated organic matter under conventional tillage, no-tillage, and forest succession after three decades. PloS One. (2014) 9:e84988. doi: 10.1371/journal.pone.0084988
34. Jat HS, Datta A, Choudhary M, Yadav AK, Choudhary V, Sharma PC, et al. Effects of tillage, crop establishment and diversification on soil organic carbon, aggregation, aggregate associated carbon and productivity in cereal systems of semi-arid Northwest India. Soil Tillage Res. (2019) 190:128–38. doi: 10.1016/j.still.2019.03.005
35. Guimarães DV, Gonzaga MIS, da Silva TO, da Silva TL, da Silva Dias N, and Matias MIS. Soil organic matter pools and carbon fractions in soil under different land uses. Soil Tillage Res. (2013) 126:177–82. doi: 10.1016/j.still.2012.07.010
36. Nciizah AD and Wakindiki IIC. Aggregate breakdown mechanisms as affected by soil texture and organic matter in soils dominated by primary minerals. South Afr J Plant Soil. (2014) 31:213–8. doi: 10.1080/02571862.2014.944594
37. Aziz I, Mahmood T, and Islam KR. Effect of long term no-till and conventional tillage practices on soil quality. Soil Tillage Res. (2013) 131:28–35. doi: 10.1016/j.still.2013.03.002
38. Naresh R, Timsina J, Bhaskar S, Gupta R, Singh A, Dhaliwal S, et al. Effects of tillage, residue and nutrient management on soil organic carbon dynamics and its fractions, soil aggregate stability and soil carbon sequestration: A review. EC Nutr. (2017) 2:53–80.
39. Norton LD, Mamedov AI, Levy GJ, and Huang C. Soil aggregate stability as affected by long-term tillage and clay mineralogy. Adv Geoecology. (2006) 38:422–9.
40. Bashir K, Ali S, Ijaz SS, and Ahmad I. Effect of organic amendments on distribution, stability and carbon concentration of soil aggregates. Pakistan J Agric Sci. (2016) 53:955–61.
41. Pinheiro EFM, Pereira MG, and Anjos LHC. Aggregate distribution and soil organic matter under different tillage systems for vegetable crops in a Red Latosol from Brazil. Soil Tillage Res. (2004) 77:79–84. doi: 10.1016/j.still.2003.11.005
42. Sheng M, Han X, Zhang Y, Long J, and Li N. 31-year contrasting agricultural managements affect the distribution of organic carbon in aggregate-sized fractions of a Mollisol. Sci Rep. (2020) 10:9041. doi: 10.1038/s41598-020-66038-1
43. Oades JM. Soil organic matter and structural stability: mechanisms and implications for management. Plant Soil. (1984) 76:319–37.
44. Sekaran U, Sagar KL, and Kumar S. Soil aggregates, aggregate-associated carbon and nitrogen, and water retention as influenced by short and long-term no-till systems. Soil Tillage Res. (2021) 208:104885. doi: 10.1016/j.still.2020.104885
45. Zheng H, Liu W, Zheng J, Luo Y, Li R, Wang H, et al. Effect of long-term tillage on soil aggregates and aggregate-associated carbon in black soil of northeast China. PloS One. (2018) 13:e0199523. doi: 10.1371/journal.pone.0199523
46. Mikha MM, Jin VL, Johnson JMF, Lehman RM, Karlen DL, and Jabro JD. Land management effects wet aggregate stability and carbon content. Soil Sci Soc America J. (2021) 85:2149–68. doi: 10.1002/saj2.20333
47. Okolo CC, Gebresamuel G, Zenebe A, Haile M, and Eze PN. Accumulation of organic carbon in various soil aggregate sizes under different land use systems in a semi-arid environment. Agriculture Ecosyst Environ. (2020) 297:106924. doi: 10.1016/j.agee.2020.106924
48. Qiu L, Wei X, Gao J, and Zhang X. Dynamics of soil aggregate-associated organic carbon along an afforestation chronosequence. Plant Soil. (2015) 391:237–51. doi: 10.1007/s11104-015-2415-7
49. Jayaraman S, Sahu M, Sinha NK, Mohanty M, Chaudhary RS, Yadav B, et al. Conservation agricultural practices impact on soil organic carbon, soil aggregation and greenhouse gas emission in a vertisol. Agric (Switzerland). (2022) 12:1004. doi: 10.3390/agriculture12071004
50. Cai C, Huang F, Yang Y, Yu S, Wang S, Fan Y, et al. Effects of glomalin-related soil protein driven by root on forest soil aggregate stability and carbon sequestration during urbanization in Nanchang, China. Plants. (2023) 12:1847. doi: 10.3390/plants12091847
51. Saha D, Kukal SS, and Sharma S. Landuse impacts on SOC fractions and aggregate stability in typic ustochrepts of Northwest India. Plant Soil. (2011) 339:457–70. doi: 10.1007/s11104-010-0602-0
52. Dominy CS and Haynes RJ. Influence of agricultural land management on organic matter content, microbial activity and aggregate stability in the profiles of two Oxisols. Biol Fertility Soils. (2002) 36:298–305. doi: 10.1007/s00374-002-0542-9
53. Ameer I, Kubar KA, Ali Q, Ali S, Khan T, Shahzad K, et al. Land degradation resistance potential of a dry, semiarid region in relation to soil organic carbon stocks, carbon management index, and soil aggregate stability. Land Degradation Dev. (2023) 34:624–36. doi: 10.1002/ldr.4480
54. Liu Y, Sui X, Hua H, Liu X, Chang Q, Xu R, et al. Soil aggregate stability and organic carbon content among different forest types in temperate ecosystems in northeastern China. Forests. (2024) 15:279. doi: 10.3390/f15020279
55. Reinhart KO and Vermeire LT. Soil aggregate stability and grassland productivity associations in a northern mixed-grass prairie. PloS One. (2016) 11:e0160262. doi: 10.1371/journal.pone.0160262
Keywords: exclosures, Pandamantenga Plains, soil health, water stable aggregates, Vertisols
Citation: Ponyane P, Dina Ebouel FJ and Eze PN (2025) Differential impacts of land use regimes on soil aggregate stability and aggregate-associated organic carbon sequestration in semi-arid Vertisols. Front. Soil Sci. 5:1629431. doi: 10.3389/fsoil.2025.1629431
Received: 15 May 2025; Accepted: 07 July 2025;
Published: 28 July 2025.
Edited by:
Rajeev Padbhushan, Bihar Agricultural University, IndiaReviewed by:
Hanuman Singh Jatav, Sri Karan Narendra Agriculture University, IndiaChukwuebuka Christopher Okolo, Jimma University, Ethiopia
Abhas Kumar Sinha, Uttar Banga Krishi Viswavidyalaya, India
Copyright © 2025 Ponyane, Dina Ebouel and Eze. This is an open-access article distributed under the terms of the Creative Commons Attribution License (CC BY). The use, distribution or reproduction in other forums is permitted, provided the original author(s) and the copyright owner(s) are credited and that the original publication in this journal is cited, in accordance with accepted academic practice. No use, distribution or reproduction is permitted which does not comply with these terms.
*Correspondence: Peter N. Eze, ZXplcEBiaXVzdC5hYy5idw==; cGV0ZXIuZXplQHVuaS1wb3RzZGFtLmRl