 Victória Santos Souza1*
 Mariana Teixeira Borges2Bruna Emanuele Schiebelbein1
 Lucas Pecci Canisares1
 Jorge Luiz Locatelli3
 Larissa de Souza Bortolo4
 Darliane de Castro Santos2Leandro Pereira Pacheco5
 Carlos Eduardo P. Cerri1,6
 Maurício Roberto Cherubin1,6
- 1Department of Soil Science, “Luiz de Queiroz” College of Agriculture - University of São Paulo, Piracicaba, Brazil
- 2Laboratory of Agricultural Chemistry, Federal Institute of Education, Science and Technology Goiano, Rio Verde, Goiás, Brazil
- 3Natural Resource Ecology Laboratory, Colorado State University, Fort Collins, CO, United States
- 4Fundação Mato Grosso, Rondonópolis, Mato Grosso, Brazil
- 5Department of Agricultural and Environmental Engineering, Federal University of Rondonópolis, Institute of Agrarian and Technological Sciences, Rondonópolis, Mato Grosso, Brazil
- 6Center for Carbon Research in Tropical Agriculture (CCARBON), USP, Piracicaba, São Paulo, Brazil
Introduction: In tropical agriculture, cover crops are increasingly adopted to improve soil health and system resilience. However, their influence on greenhouse gas (GHG) emissions, particularly nitrous oxide (N2O), remains underexplored in field conditions.
Methods: We evaluated how cover crop biomass affects N2O emissions and emission intensity (kg CO2 eq t−¹ grain) in tropical soybean systems across two field experiments (6 and 10 years) in the Brazilian savannah (Cerrado biome). GHG emissions were measured using static chambers on a weekly basis throughout the cropping seasons from 2022 to 2024.
Results: Soybeans followed by cover crops such as MixCC [ruzigrass (Urochloa ruziziensis), millet (Pennisetum glaucum), and showy rattlebox (Crotalaria spectabilis)] and ruzigrass contributed up to 202% more nitrogen and 51% more carbon inputs than soybeans followed by fallow and maize. The cover crop mix emitted ~6,000 kg C ha−¹ as biogenic CO2 in 2 years and 2,655 g N ha−¹ as N2O, ~50%-fold more than the bare fallow. Nevertheless, although high-biomass systems increased N2O emissions during the offseason, they also enhanced soybean yield, leading to lower emission intensity.
Discussion: The structural equation model revealed that cover crop biomass not only had a direct positive effect on soybean yield (standardized coefficient = 0.67) and N2O emissions (standardized coefficient = 0.33) but also an indirect negative effect on emission intensity through yield compensation. These findings suggest that adopting cover cropping systems in tropical regions can efficiently contribute to increasing crop yields while improving nitrogen use efficiency, which is important for food security in these regions.
Highlights
● Soil GHG emissions were monitored for 2 years in sustainable soybean systems under cover cropping in the Brazilian savannah.
● Soybean–ruzigrass and soybean–mix of cover crops accumulated more carbon (~50%) and nitrogen (~89%) in aboveground biomass than the average of the other treatments.
● Fallow weeds showed the highest N2O emission intensity, ~40% greater than cover crop systems.
● N2O emissions and crop responses are regionally influenced by management systems.
1 Introduction
Since the Industrial Revolution, atmospheric greenhouse gas (GHG) concentrations have risen dramatically, with CO2 now exceeding 420 ppm, CH4 1,934 ppb, and N2O 337 ppb (1, 2). These values constitute, respectively, increases of 151%, 265%, and 125% relative to pre-industrial (before 1750) levels (1). Globally, approximately 75% of GHG emissions stem from the energy sector, primarily driven by the burning of fossil fuels. As a consequence, the globe has experienced regional and global impacts characterized by an increased frequency and intensity of extreme weather events such as severe droughts, rising temperatures, and floods (3). The intensification of such events threatens the stability of natural ecosystems and agriculture, affecting the provision of critical services to human existence (4). In Brazil, 46% (1,061.6 Mt CO2 eq) of GHG emissions in 2023 were related to land-use change, 27% (631.2 Mt CO2 eq) originated from agriculture, and 22% (511.3 Mt CO2 eq) came from the combined energy and industrial sectors (5). Agricultural expansion rates have greatly increased in these regions, which contributes to increasing GHG emissions through different mechanisms. Native forest removal usually results in high emission intensities due to biomass removal and burning activities. Furthermore, the lack of best management practices in these new agricultural fields also contributes to reducing soil organic carbon (SOC) pools (5). This loss is exacerbated by soil physical disturbances such as tillage practices, erosion, and other practices that may reduce the soil’s capacity to promote SOC stabilization (6, 7).
One promising strategy to address climate change is the adoption of regenerative agricultural practices that promote SOC sequestration (8) and enhance system resilience (9). In this context, croplands play a critical role, as improved land management can transform agricultural soils into effective carbon sinks (10). Recent global estimates show that reforestation and better management practices have already offset over 60% of emissions from land-use change, significantly reducing the net climate impact of the land-use sector (11). Practices such as pasture restoration, no-tillage, and integrated crop–livestock systems are widely recognized as effective approaches to increase SOC inputs. In croplands, especially the use of cover crops has been shown to enhance SOC when combined with such practices (7, 12). Cover crops enhance biomass production, support microbial activity, and increase carbon use efficiency, which are key processes that contribute to the stabilization of organic matter in the form of mineral-associated carbon (13). However, these same biological processes may also intensify microbial nitrogen cycling, potentially increasing N2O emissions under certain management conditions (14). Among cover crops, legume species play a distinctive role by providing low-molecular-weight compounds that fuel microbial transformation and reduce the need for synthetic nitrogen (N) fertilizers through biological N fixation (15). This not only supports yield but also mitigates GHG emissions, with reductions in N2O emissions of up to 42% compared to conventional fertilization practices (16).
In the Brazilian savannah, the soybean–maize double crop (crop sequence) represents a well-established system, occupying ~16.9 million hectares (during the 2023/2024 season) (17). Approximately 50% of the area cultivated with soybeans has maize as a second crop (17). However, in regions with shorter rainy seasons, maize becomes a risky option due to low water availability for proper establishment and growth. In these areas, the probability of crop failure increases significantly, making continuous maize cultivation a riskier option for the second season (18). In such conditions, cover crops can be an important option to increase biomass input, maintain soil carbon, and improve soil health (9, 19, 20). They tolerate drought conditions and provide multiple benefits, including enhanced microbial activity (21), carbon sequestration (8, 22), improved biodiversity, and increased crop yield (9). Although some studies have explored the potential of cover crops to mitigate GHG emissions, research on their effects in tropical ecosystems, such as the Brazilian savannah, remains limited, as recently reported by Locatelli et al. (23), Figueiredo et al. (14)Bieluczyk et al. (24) Santos et al. (25), and Oliveira et al. (26).
Despite CO2 and CH4 being part of the soil–atmosphere gas exchange, this study focuses on N2O due to a strong link to agricultural N management. N2O is also the most relevant GHG in non-irrigated croplands, such as those found in the Brazilian savannah. While increased CO2 emissions in diverse systems primarily reflect microbial respiration from fresh biomass inputs and not necessarily SOC loss (27), N2O emissions are directly associated with N availability, microbial nitrification and denitrification, and the intensification of fertilizer use. In tropical soils under aerobic conditions, CH4 emissions are typically low, with soils often acting as methane sinks. Thus, N2O represents the most sensitive and policy-relevant indicator of how cropping systems influence GHG dynamics in agroecosystems. In this context, the relationship between cover crop biomass, soybean yield, and N2O emissions becomes central, as higher biomass enhances nutrient cycling and microbial activity, which can increase both yields and N2O emissions through intensified N transformations. A critical challenge lies in understanding whether the potential increase in N2O emissions from high-biomass or diverse cover crop systems is offset by gains in yield. In this context, the concept of emission intensity, defined as N2O emissions per unit of crop yield (e.g., kg CO2 eq per t of grain) (28), offers a more integrative indicator of environmental efficiency. We investigate how the biomass quantity and diversity of cover crops influence N2O emissions and emission intensity in tropical soybean systems. Specifically, we aimed to assess whether increased biomass inputs affect N2O emissions during both the cover crop and soybean growing seasons and whether higher soybean yields can offset these emissions by improving N use efficiency. The hypotheses are as follows: 1) greater cover crop biomass decreases N2O emissions during the offseason due to enhanced N uptake; 2) higher soybean yields reduce N2O emissions during the cropping season by improving N use efficiency and limiting the substrate available for microbial nitrification and denitrification; and 3) high-biomass, diverse cover crop systems reduce emission intensity (kg CO2 eq t-1 of grain) through reduced N2O emissions and yield gains, resulting in more efficient and climate-resilient production systems.
2 Materials and methods
Two field trials located in the Brazilian savannah region were assessed. The first site is located in the municipality of Rio Verde, Goiás State (17°47′53″S latitude and 50°55′41″W longitude, altitude 715 m), and was implemented in 2018. The second site is located in the municipality of Rondonópolis, Mato Grosso State (16°27′41.75″S latitude and 54°34′52.55″W longitude, altitude 292 m), and was established in 2014 (Figure 1). The region’s climate is classified as tropical savannah with dry winters and rainy summers (Aw) (29), with 80%–90% being concentrated between October and April. In Rio Verde, the average accumulated annual rainfall ranged from 1,200 to 1,600 mm. During the years 2022, 2023, and 2024, when GHG was measured, the annual precipitation was on average ~1,000 mm. The minimum temperatures varied between 18°C and 20°C, and the maximum temperatures were recorded between 27°C and 31°C, with the highest temperatures concentrated in the years 2022–2024. The soil temperature showed low variability, remaining close to 28°C. In Rondonópolis, historical accumulated precipitation ranged from approximately 1,200 to 1,400 mm, with data from 2022 to 2024 showing lower precipitation values, ~900 mm. Minimum temperatures ranged between 20°C and 22°C, while maximum temperatures varied between 30°C and 33°C, with the highest averages observed in 2022–2024. The soil temperature ranged between 32°C and 34°C (Supplementary Figure S2).
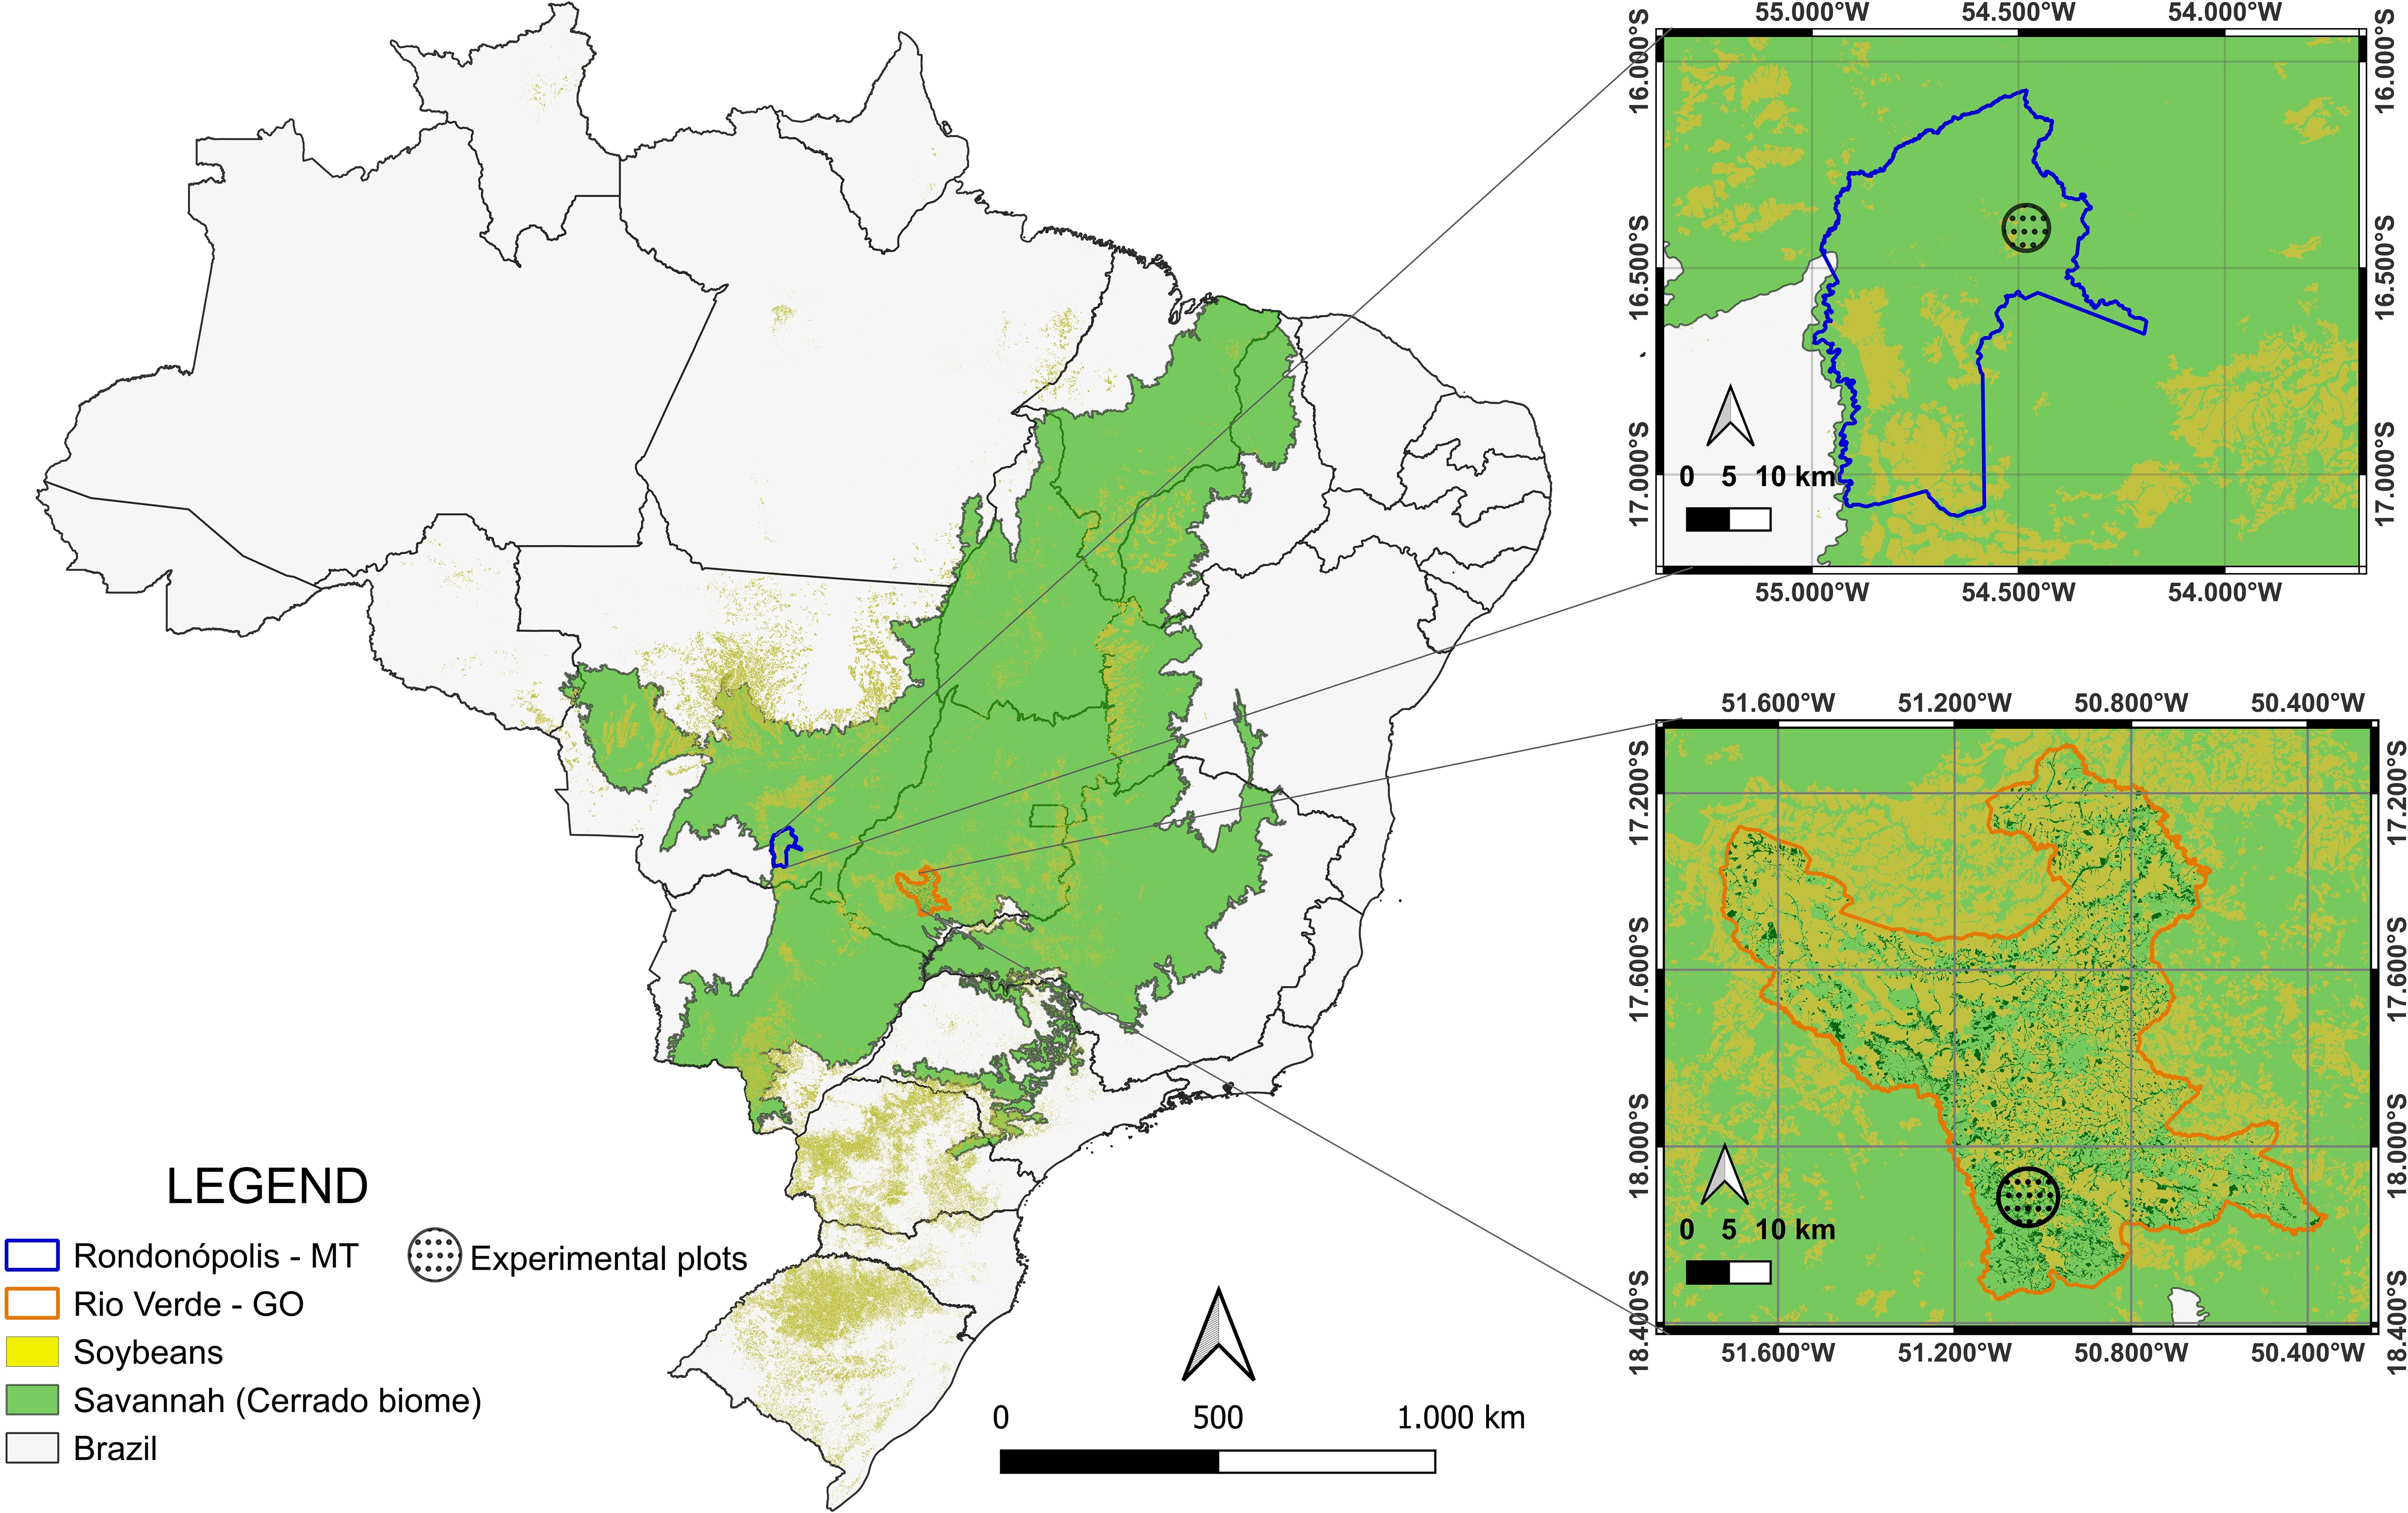
Figure 1. Location of the experimental site in Rio Verde, Goiás (orange map), and Rondonópolis, Mato Grosso (blue map), corresponding to a highly agricultural region within the Brazilian savannah (Cerrado biome).
The soil in the experimental area was classified as Latossolo Vermelho in the Brazilian Soil Classification System (30), corresponding to a Rhodic Hapludox in the Soil Taxonomy (31). The topsoil (0–20 cm) was sampled before the first cover crop planting in 2014 in Rondonópolis and 2018 in Rio Verde, and the samples were composed of eight subsamples in each experimental site collected for soil characterization (Table 1). In both sites, liming was performed prior to the establishment of the experiment using 4,000 kg ha-1 of limestone filler (PRNT: 99.02%), applied with a leveling disc harrow. After that, the cropping systems were conducted under no-tillage management.

Table 1. Initial soil characterization of the two experimental sites.
2.1 Study design
In Rio Verde, the field trial was designed using a randomized strip design measuring 12 m × 80 m, covering an area of 960 m². Each treatment consisted of a 10-m-long and 12-m-wide area with four replicates. Measurements (plants and GHG samples) were performed in the central two rows of soybeans within the strips. Details of the experimental design and methodology were published by Souza et al. (32). The field trial, conducted under no-tillage, consisted of soybean crop followed by five different winter crop (second season) treatments: 1) bare fallow, 2) maize (Zea mays), 3) maize–ruzigrass (Z. mays–Urochloa ruziziensis), 4) ruzigrass, and 5) mix of cover crops (MixCC): millet, showy rattlebox, and ruzigrass (Pennisetum glaucum, Crotalaria spectabilis, and U. ruziziensis) (Figure 2). Prior to the establishment of the experiment in 2018, the site had been used as pasture (i.e., extensive grazing) for 10 years.
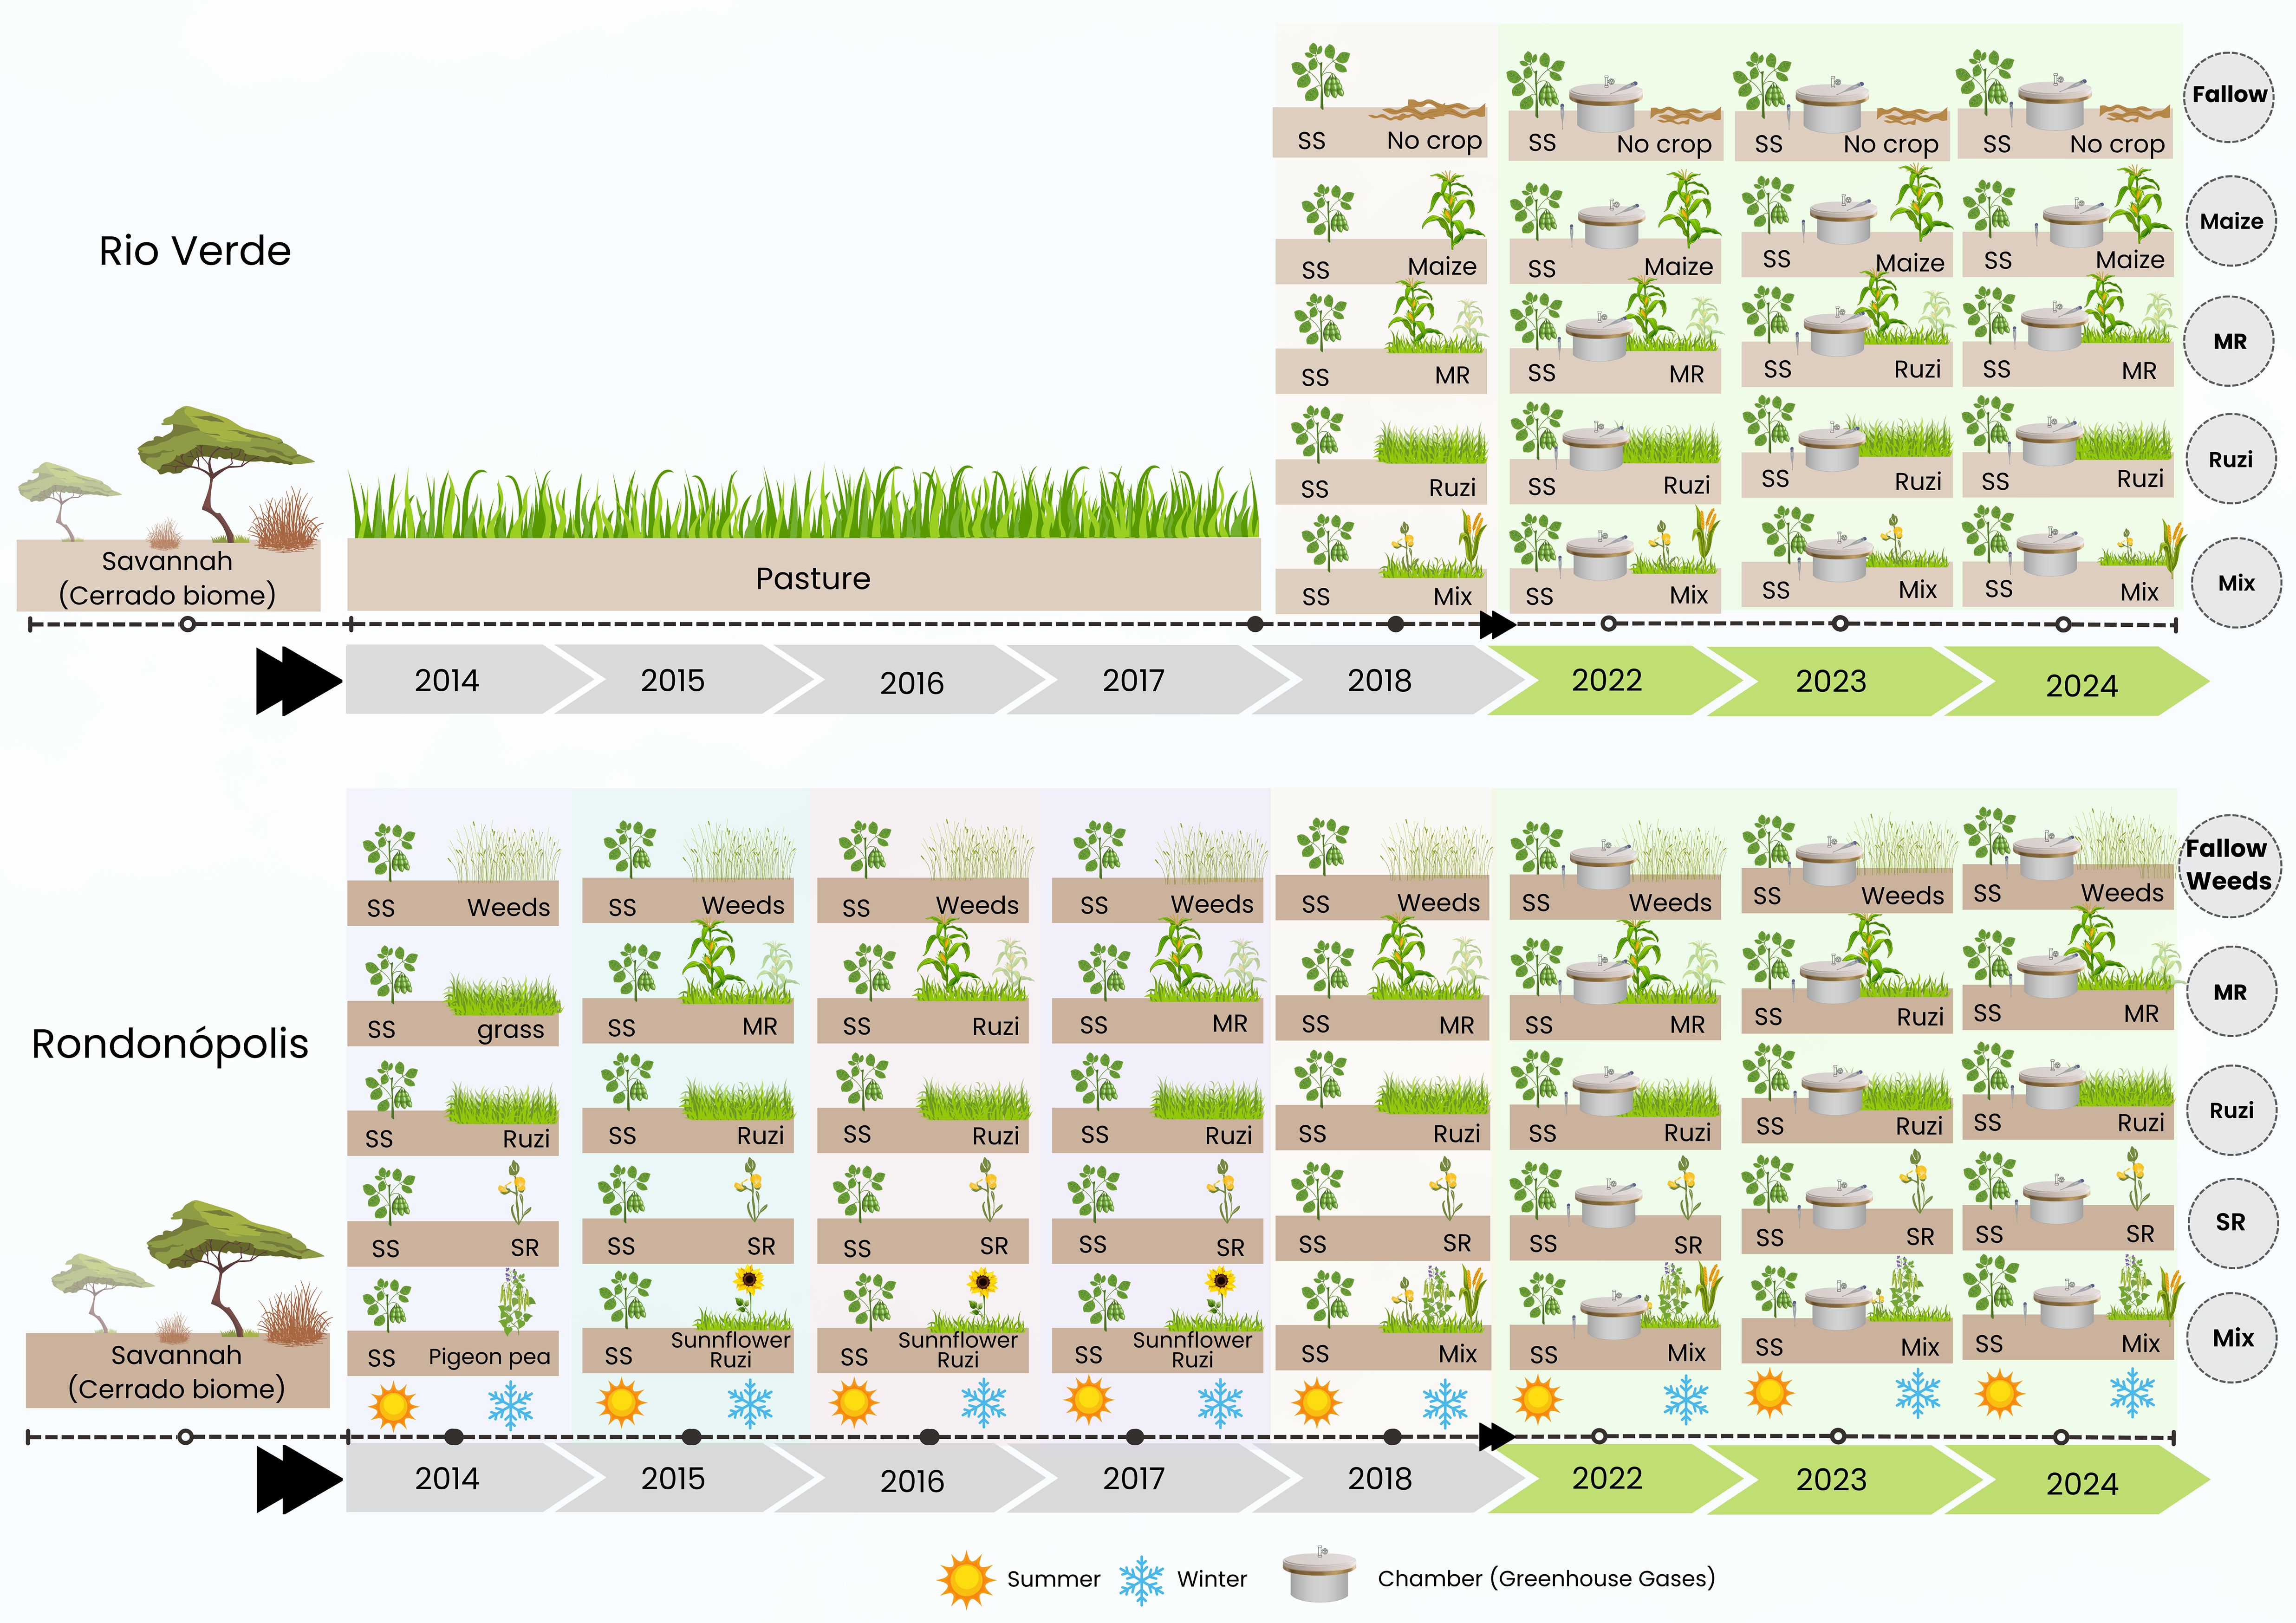
Figure 2. Timeline of cropping systems at the two different sites. The experimental plots started in 2018 (6 years) in Rio Verde and in 2014 in Rondonópolis (10 years). SS, soybeans; MR, maize–ruzigrass; Ruzi, ruzigrass; Mix, mix of cover crops in Rio Verde (millet, showy rattlebox, and ruzigrass) and mix of cover crops in Rondonópolis (showy rattlebox, millet, ruzigrass, and pigeon pea).
In Rondonópolis, a randomized complete block experimental design with four replicates was carried out, and similar to the field trial from Rio Verde, the treatments consisted of soybean crop followed by five different winter crops: 1) fallow weeds, 2) palisade grass (Urochloa brizantha) (during 1 year) and maize–ruzigrass (9 years), 3) ruzigrass, 4) showy rattlebox, and 5) pigeon pea (Cajanus cajan) (during 1 year), followed by sunflower–ruzigrass (during 3 years) and mix of cover crops (MixCC) (showy rattlebox, millet, ruzigrass, and pigeon pea) (6 years) (Figure 2). The site had Cerrado sensu stricto (Brazilian savannah) (native vegetation). Prior to conducting the experiment, the experimental area was deforested in 2013, and a soybean crop was planted followed by the different cover crop treatments (2014) (Figure 2).
2.2 Crop management
The cover crops were sown by hand, broadcasting seeds in the experimental plots (Supplementary Table S2). The maize was sown at a density of 50,000 plants ha−1. In treatments involving a mix of cover crops, the seeds were uniformly mixed and equally dispersed across the entire area. The Urochloa species cultivated as single crops were sown at a density of 8 kg ha−1. The intercropped grasses were sown with 5 kg ha−1 of viable seeds. The mix of cover crops was sown with 50% of the seeding rate used in single cultivations, corresponding to 4, 10, and 10 kg ha−1 of pure viable seeds of ruzigrass, millet, and showy rattlebox, respectively, as recommended for the region (9, 33). Forage plants were mowed in July 2018 and 2019, and a roller crimper was used to terminate the cover crops in July 2020, 2021, and 2022.
In Rio Verde, soybean was planted on 10/19/2018, 11/04/2019, 10/17/2020, 10/14/2021, and 2022 and harvested on 02/07/2019, 03/12/2020, 02/19/2021, 02/20/2022, and 02/18/2023. Winter crops were planted yearly in the fall–winter season before the soybean harvest season, on 03/13/2018, 03/09/2019, 03/17/2020, 03/11/2021, and 03/26/2022. Winter crops were terminated on 09/29/2018, 09/05/2019, 08/14/2020, 09/21/2021, and 09/06/2022, using 2.5 L ha−1 of glyphosate (360 g a.i. L−1).
In Rondonópolis, soybean crops were planted in October 2014 and 2015; September 2016; and October 2017, 2018, 2019, 2020, and 2021 and were harvested on 03/02/2015, 02/16/2016, 02/09/2017, 02/28/2018, 02/13/2019, 02/18/2020, and 02/24/2022. Winter crops were planted yearly in the fall–winter season before the soybean harvest season, on 02/20/2014, 03/04/2015, 02/18/2016, 02/15/2017, 03/06/2018, 02/23/2019, 02/24/2020, 02/26/2021, and 03/02/2022. Winter crops were terminated on 08/25/2014, 07/01/2015, 07/01/2016, 10/07/2017, 10/09/2018, 10/03/2019, 10/23/2020, 10/21/2021, and 06/25/2022. All production systems were desiccated using glyphosate (1,920 g a.i. ha−1). Management of pests, diseases, and weeds was performed according to technical recommendations for soybean cultivation in the region.
Fertilizer and crop management practices, including the rates and application dates of N, phosphorus (P2O5), and potassium (K2O) for all treatments, are detailed in the supplementary material (Supplementary Table S3). In Rio Verde, soybean received up to 8 kg N ha−1, 80 kg P2O5 ha−1, and 80 kg K2O ha−1. The maize and maize–ruzigrass treatments received 45 kg N ha−1, 45 kg P2O5 ha−1, and 45 kg K2O ha−1. All treatments in the second season received 96 kg N ha−1, 40 kg P2O5 ha−1, and 40 kg K2O ha−1. In Rondonópolis, soybean crops received 13.3 kg N ha−¹, 60 kg P2O5 ha−¹, and 60 kg K2O ha−¹, while only the maize–ruzigrass treatment was fertilized with 40 kg N ha−¹ and no phosphorus or potassium.
2.3 Crop parameters: aboveground biomass sampling and soybean grain yield
The cover crop biomass was measured before flowering on 13/08/2018, 20/07/2019, 30/07/2020, 10/08/2021, 22/07/2022, and 03/08/2023 in Rio Verde and on 25/08/2014, 24/09/2015, 22/09/2016, 07/10/2017, 09/10/2018, 03/10/2019, 23/10/2020, 22/10/2021, 25/06/2022, and 09/06/2023 in Rondonópolis. Cover crop aboveground biomass was cut 3 cm from the ground with a mechanical mower in a 1-m2 area, with 12 replications per treatment. Biomass was weighed to obtain fresh weight. Later, a subsample was removed and placed in a paper bag, weighed, and taken to a forced air circulation oven (55°C) for 72 h. The dried material was weighed to obtain the proportion of dry matter and calculate the amount of biomass in kg of dry mass ha−1. Samples from each crop plant were mixed and homogenized. Two subsamples were taken and analyzed for carbon, N, cellulose, hemicellulose, and lignin (34).
The impact of cover crops on soybean performance was assessed by measuring grain yield and the plant stand. The plant stand was estimated by counting the number of plants in a 3-m-long area of the two central rows from the four replicates of each treatment. The grain yield of soybean was determined by hand-harvesting the same area where the stand count was performed. A sample of grains was air-dried and yield data were adjusted to a moisture content of 13%. Aboveground biomass for soybean was calculated using the harvest index (HI) approach, where the grain yield was divided by an HI of 0.4 (35) (Equation 1).
The amount of C and N added through plant biomass was calculated by multiplying the aboveground biomass by C and N concentrations measured in the laboratory.
2.4 Greenhouse gas flux measurements (N2O, CH4, and CO2)
The fluxes of CO2, N2O, and CH4 gases were measured to determine the global warming potential of the different systems evaluated. Air samples were collected using manual static chambers consisting of a metal collar and a top, following the procedures described by Zanatta et al. (36). GHG fluxes were monitored and adjusted according to environmental conditions (e.g., wet and dry seasons) and management events (e.g., sowing, fertilizing, and harvesting). Sampling was intensified around management events (every other day for 15 days) and less frequent between these periods, with weekly sampling during the wet season and biweekly sampling during the dry season. Monitoring took place over 2 years: in Rondonópolis, from November 2022 to July 2024, and in Rio Verde, from October 2022 to May 2024, using four replications for each treatment (Figure 2). Air sampling was always performed between 8 a.m. and noon, assuming that this interval is equivalent to average daily flux, as described by Jantalia et al. (37). During the measurement process, samples were collected in 20 mL syringes at regular intervals of 0, 15, and 30 min. Immediately after collection in the field, the air samples were brought to the laboratory and transferred from the syringes to vials under vacuum provided by an 80-kPa suction pump system.
The CO2, N2O, and CH4 fluxes were calculated taking into account the a) linear increase of the internal gas concentration, b) area covered by the chamber, c) volume, d) temperature, and e) pressure (assumed as 1 atm) inside the chamber (38). Gas daily flux was calculated by linear interpolation of the concentrations during the sampling as follows (Equations 2):
where F is the GHG efflux, is the variation (mol h−1) of gas concentration while the chamber is closed, V is the volume of the chamber headspace (m3), A is the soil area covered by the chamber (m2), m is the molar mass (g mol−1) of the gas, and Vm is the molar volume of the chamber (m3 mol−1).
The cumulative annual fluxes of CO2, N2O, and CH4 from the soil in the sample areas were obtained by integrating the area under the daily flux curve by the trapezoidal method with SigmaPlot 14.5 software.
Before calculating the emission intensity (EI), the N2O and CH4 emissions were converted to CO2 eq emissions. For that, the global warming potential and the molecular weight of the gases were used, following Equations 3 and 4.
where CEQ (N2O) is the equivalent C of (N2O) accumulated in the analyzed treatment in Mg ha−1, N N2O is the N2O flux in the period in Mg ha−1, (44/28) is the ratio between the molecular weight of N2O gas and the element N, (12/44) is the ratio between the molecular weight of C and that of CO2, and 273 is the global warming potential of N2O (3).
where is the equivalent C of accumulated in the analyzed treatment in Mg ha−1, is the CH4 flux in the period in Mg ha−1, (16/12) is the ratio between the molecular weight of CH4 gas and element C, (12/44) is the ratio between the molecular weight of C and that of , and 27 is the global warming potential of .
The emission intensity of soybean grain yield was calculated according to Equation 5. We used only the soybean season because soybean is the main crop in the system, and our goal was to evaluate the environmental efficiency of each treatment in producing soybean while minimizing emissions.
where soybean C - CO2 is the cumulative emission during soybean season from and CEQ (N2O) (kg C - CO2 eq ha−1) and soybean yield is the soybean grain yield (t ha−1), in kg C - CO2 eq t−¹ of soybean grain.
2.5 Data analysis
All statistical analyses were performed using R version 4.4.1 (39). Treatment effects on biomass production, GHG emissions, soybean yield, and emission intensity were assessed using analysis of variance (ANOVA) followed by Tukey’s honestly significant difference (HSD) test at a significance level of α = 0.05. Modeling of structural relationships among variables (e.g., cover crop biomass, yield, N2O emissions, and emission intensity) was conducted using structural equation modeling (SEM) with the lavaan package. Visualization of SEM pathways was performed using the lavaanPlot and semPlot packages. Long-term climate data (1940–2023) were obtained from ERA5-Land monthly averaged reanalysis, provided by the Copernicus Climate Change Service (40).
3 Results
3.1 Carbon and nitrogen contents in aboveground biomass
The C and N contents in the aboveground biomass of cover crops are presented in Table 2. In Rio Verde, differences in aboveground biomass accumulation of soybean were observed only in 2024, where the treatment ruzigrass led to the highest C (3,755 kg ha−1) and N inputs (202 kg ha−1) by the soybean crop. During the cover crop seasons, the ruzigrass and MixCC produced the highest amounts of biomass (p < 0.05) across the three years evaluated, with both C and N accumulation in aboveground biomass being ~50% of C and 89% of N higher than the average of the other treatments (average of 2,371 and 24.3 for C and N, respectively; Table 2). Over the 6-year average, MixCC and ruzigrass contributed with approximately 14% more C and N addition in soybean aboveground biomass compared to conventional systems such as bare fallow and maize. During the cover crop seasons, ruzigrass and MixCC provided on average 51% more C and 89% more N than maize and up to 202% more N than the bare fallow treatment.
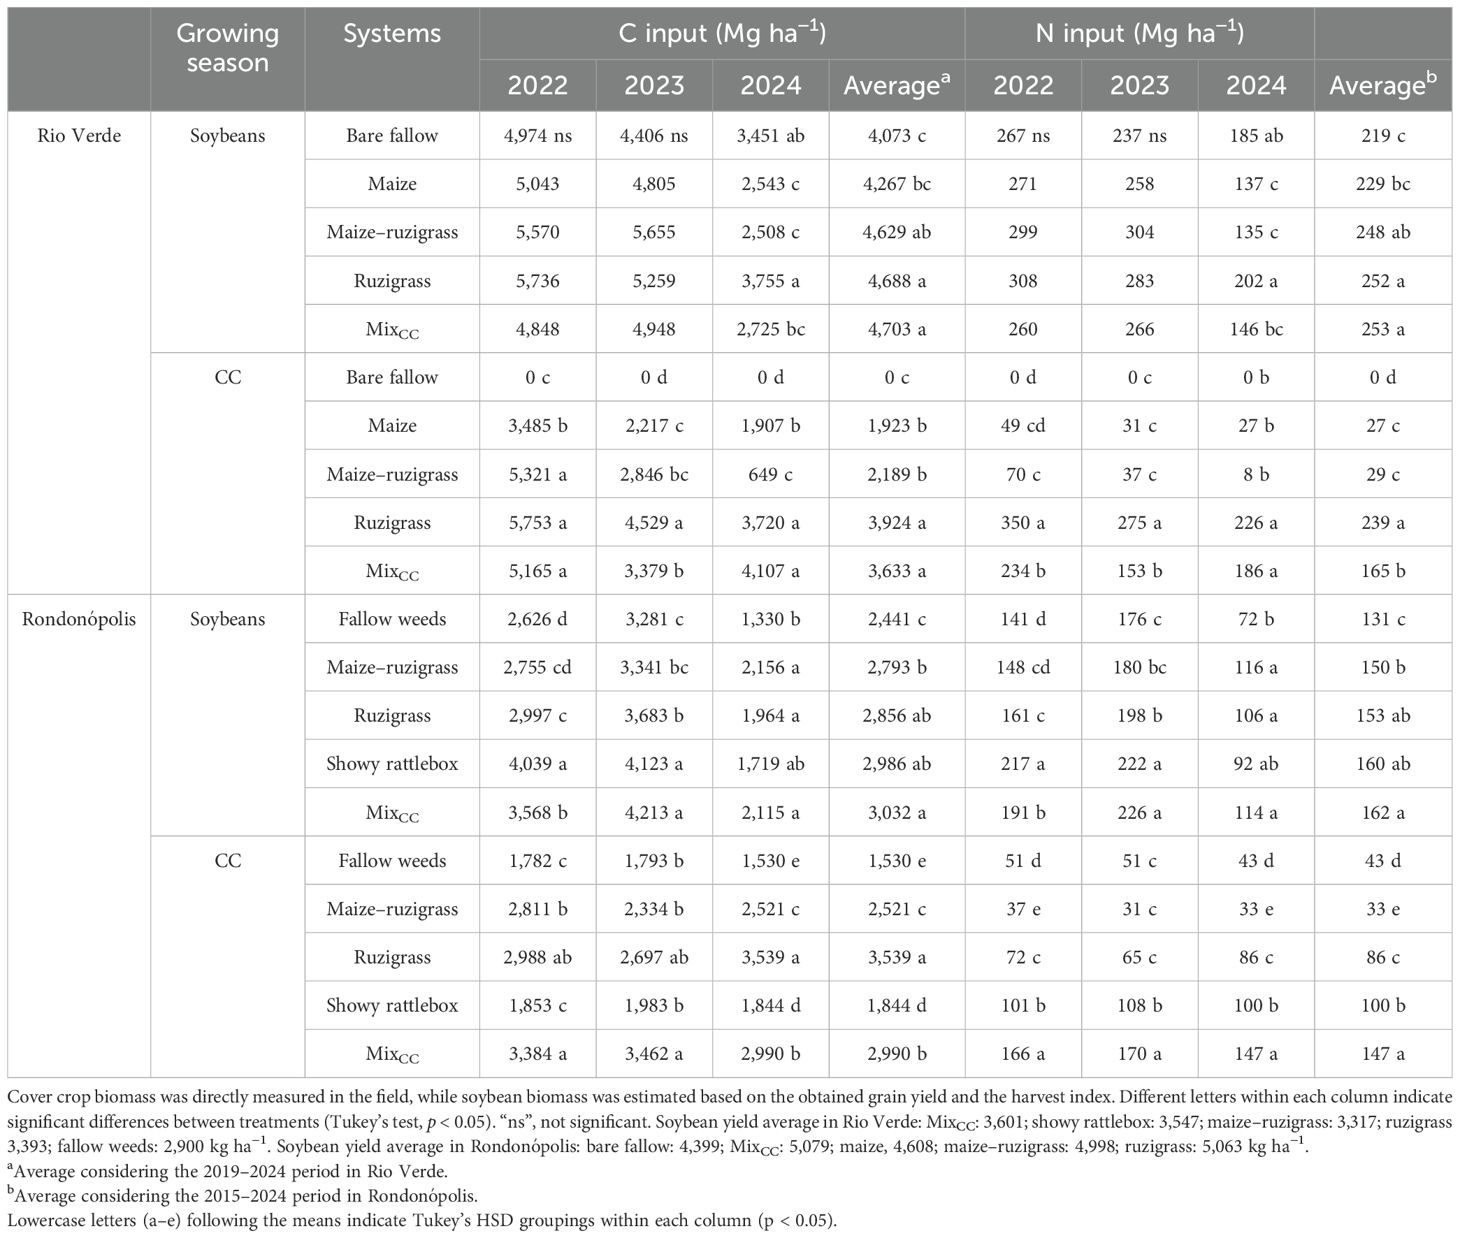
Table 2. Carbon and nitrogen inputs (Mg ha−¹) in aboveground biomass across growing seasons in Rio Verde and Rondonópolis.
In Rondonópolis, treatments with maize–ruzigrass, ruzigrass, and MixCC showed the highest carbon accumulation in aboveground biomass (p < 0.05) across the evaluated seasons. In the soybean growing seasons of 2023 and 2024, the fallow weed treatment had the lowest N content in biomass, approximately 23% and 38% lower than the other treatments. Over the 10-year average, the soybeans added 20% more C and N inputs in the MixCC treatment than the fallow weeds. During the cover crop seasons, ruzigrass had the highest C input, with approximately 57% more than the fallow weed treatment. For N, the MixCC treatment provided the highest input (p < 0.05), contributing to 71% more N than fallow weeds.
3.2 Cumulative GHG emissions
Cumulative GHG emissions differed significantly among cover crop treatments across the two growing seasons (p < 0.05; Figures 3, 4). In Rio Verde (Figure 3), treatments that added the highest biomass levels (i.e., maize–ruzigrass, ruzigrass, and MixCC) showed the greatest cumulative CO2 and N2O emissions, while bare fallow consistently presented the lowest values for both gases (p < 0.05). Emissions peaked following rainfall events and N fertilizer application. Over the 2-year period, the MixCC treatment emitted about 6,000 kg C ha−¹ as CO2 and 2,655 g N ha−¹ as N2O. The bare fallow treatment showed the lowest cumulative CO2 emissions (<3,000 kg C ha−¹). For N2O, the MixCC and ruzigrass treatments showed the highest emissions, with cumulative values greater than 2,000 g N ha−1.
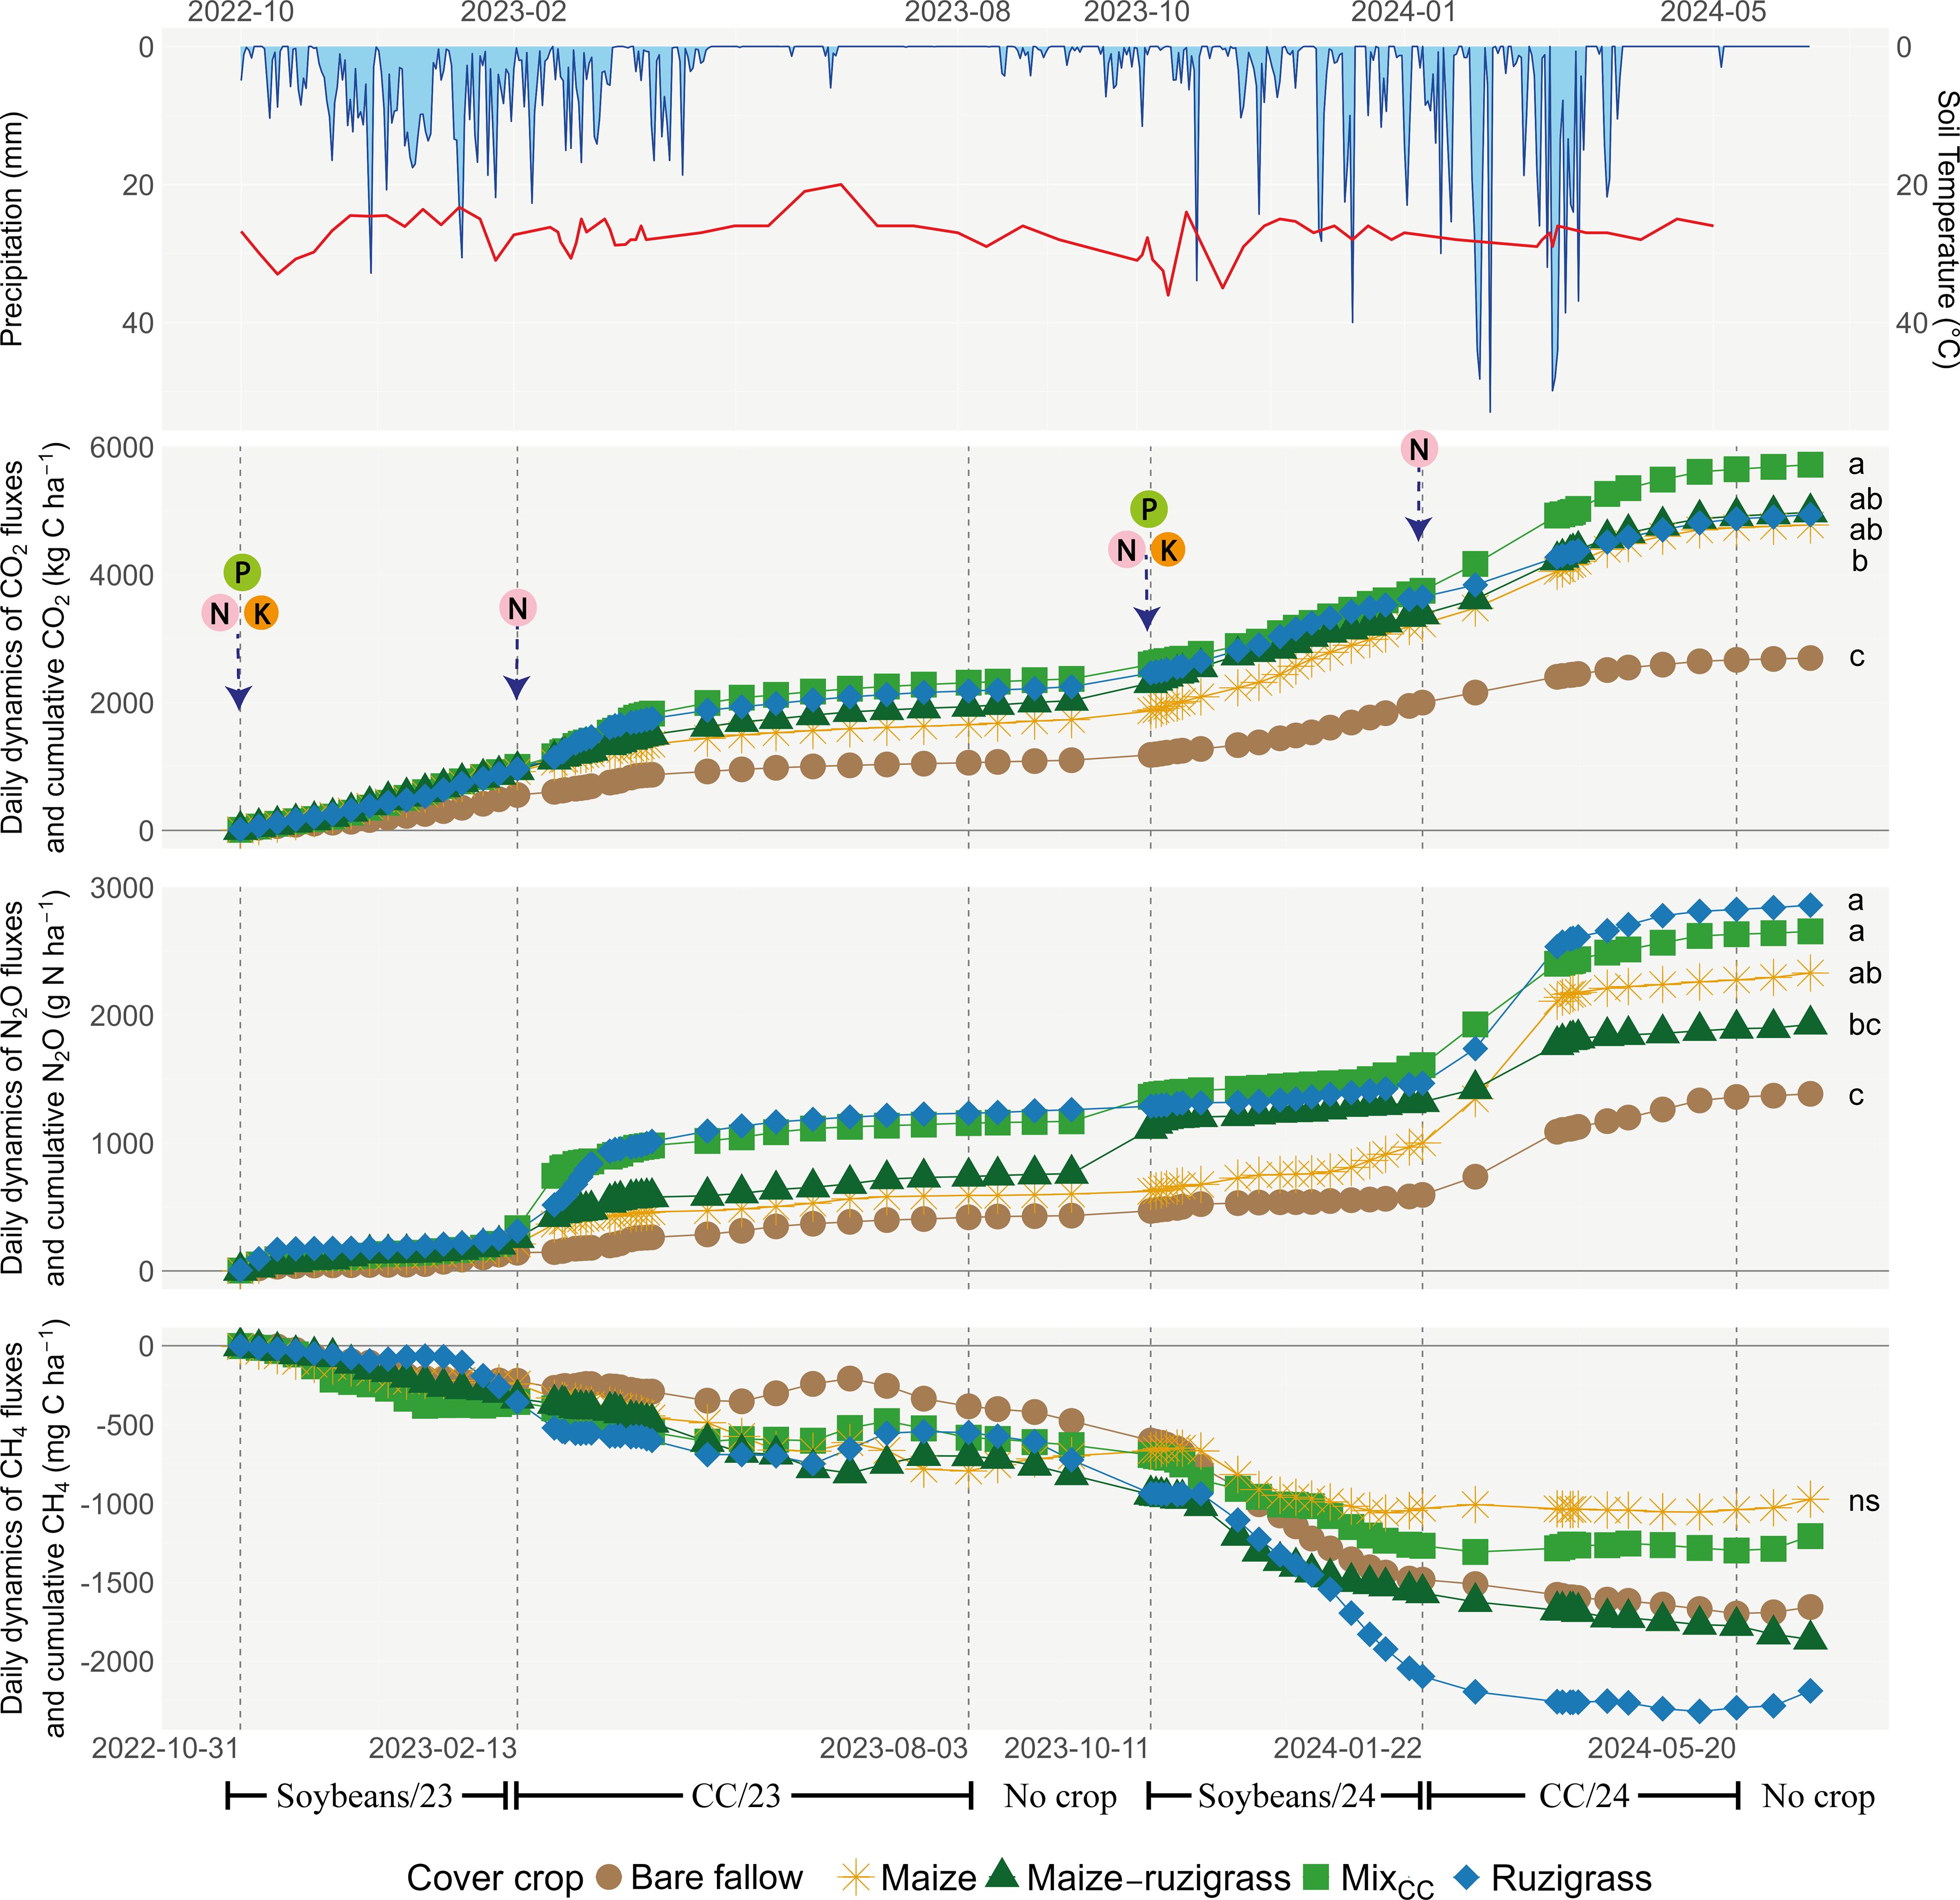
Figure 3. Seasonal dynamics of precipitation, soil temperature, and greenhouse gas fluxes in Rio Verde. Mix of cover crops (millet, showy rattlebox, and ruzigrass).
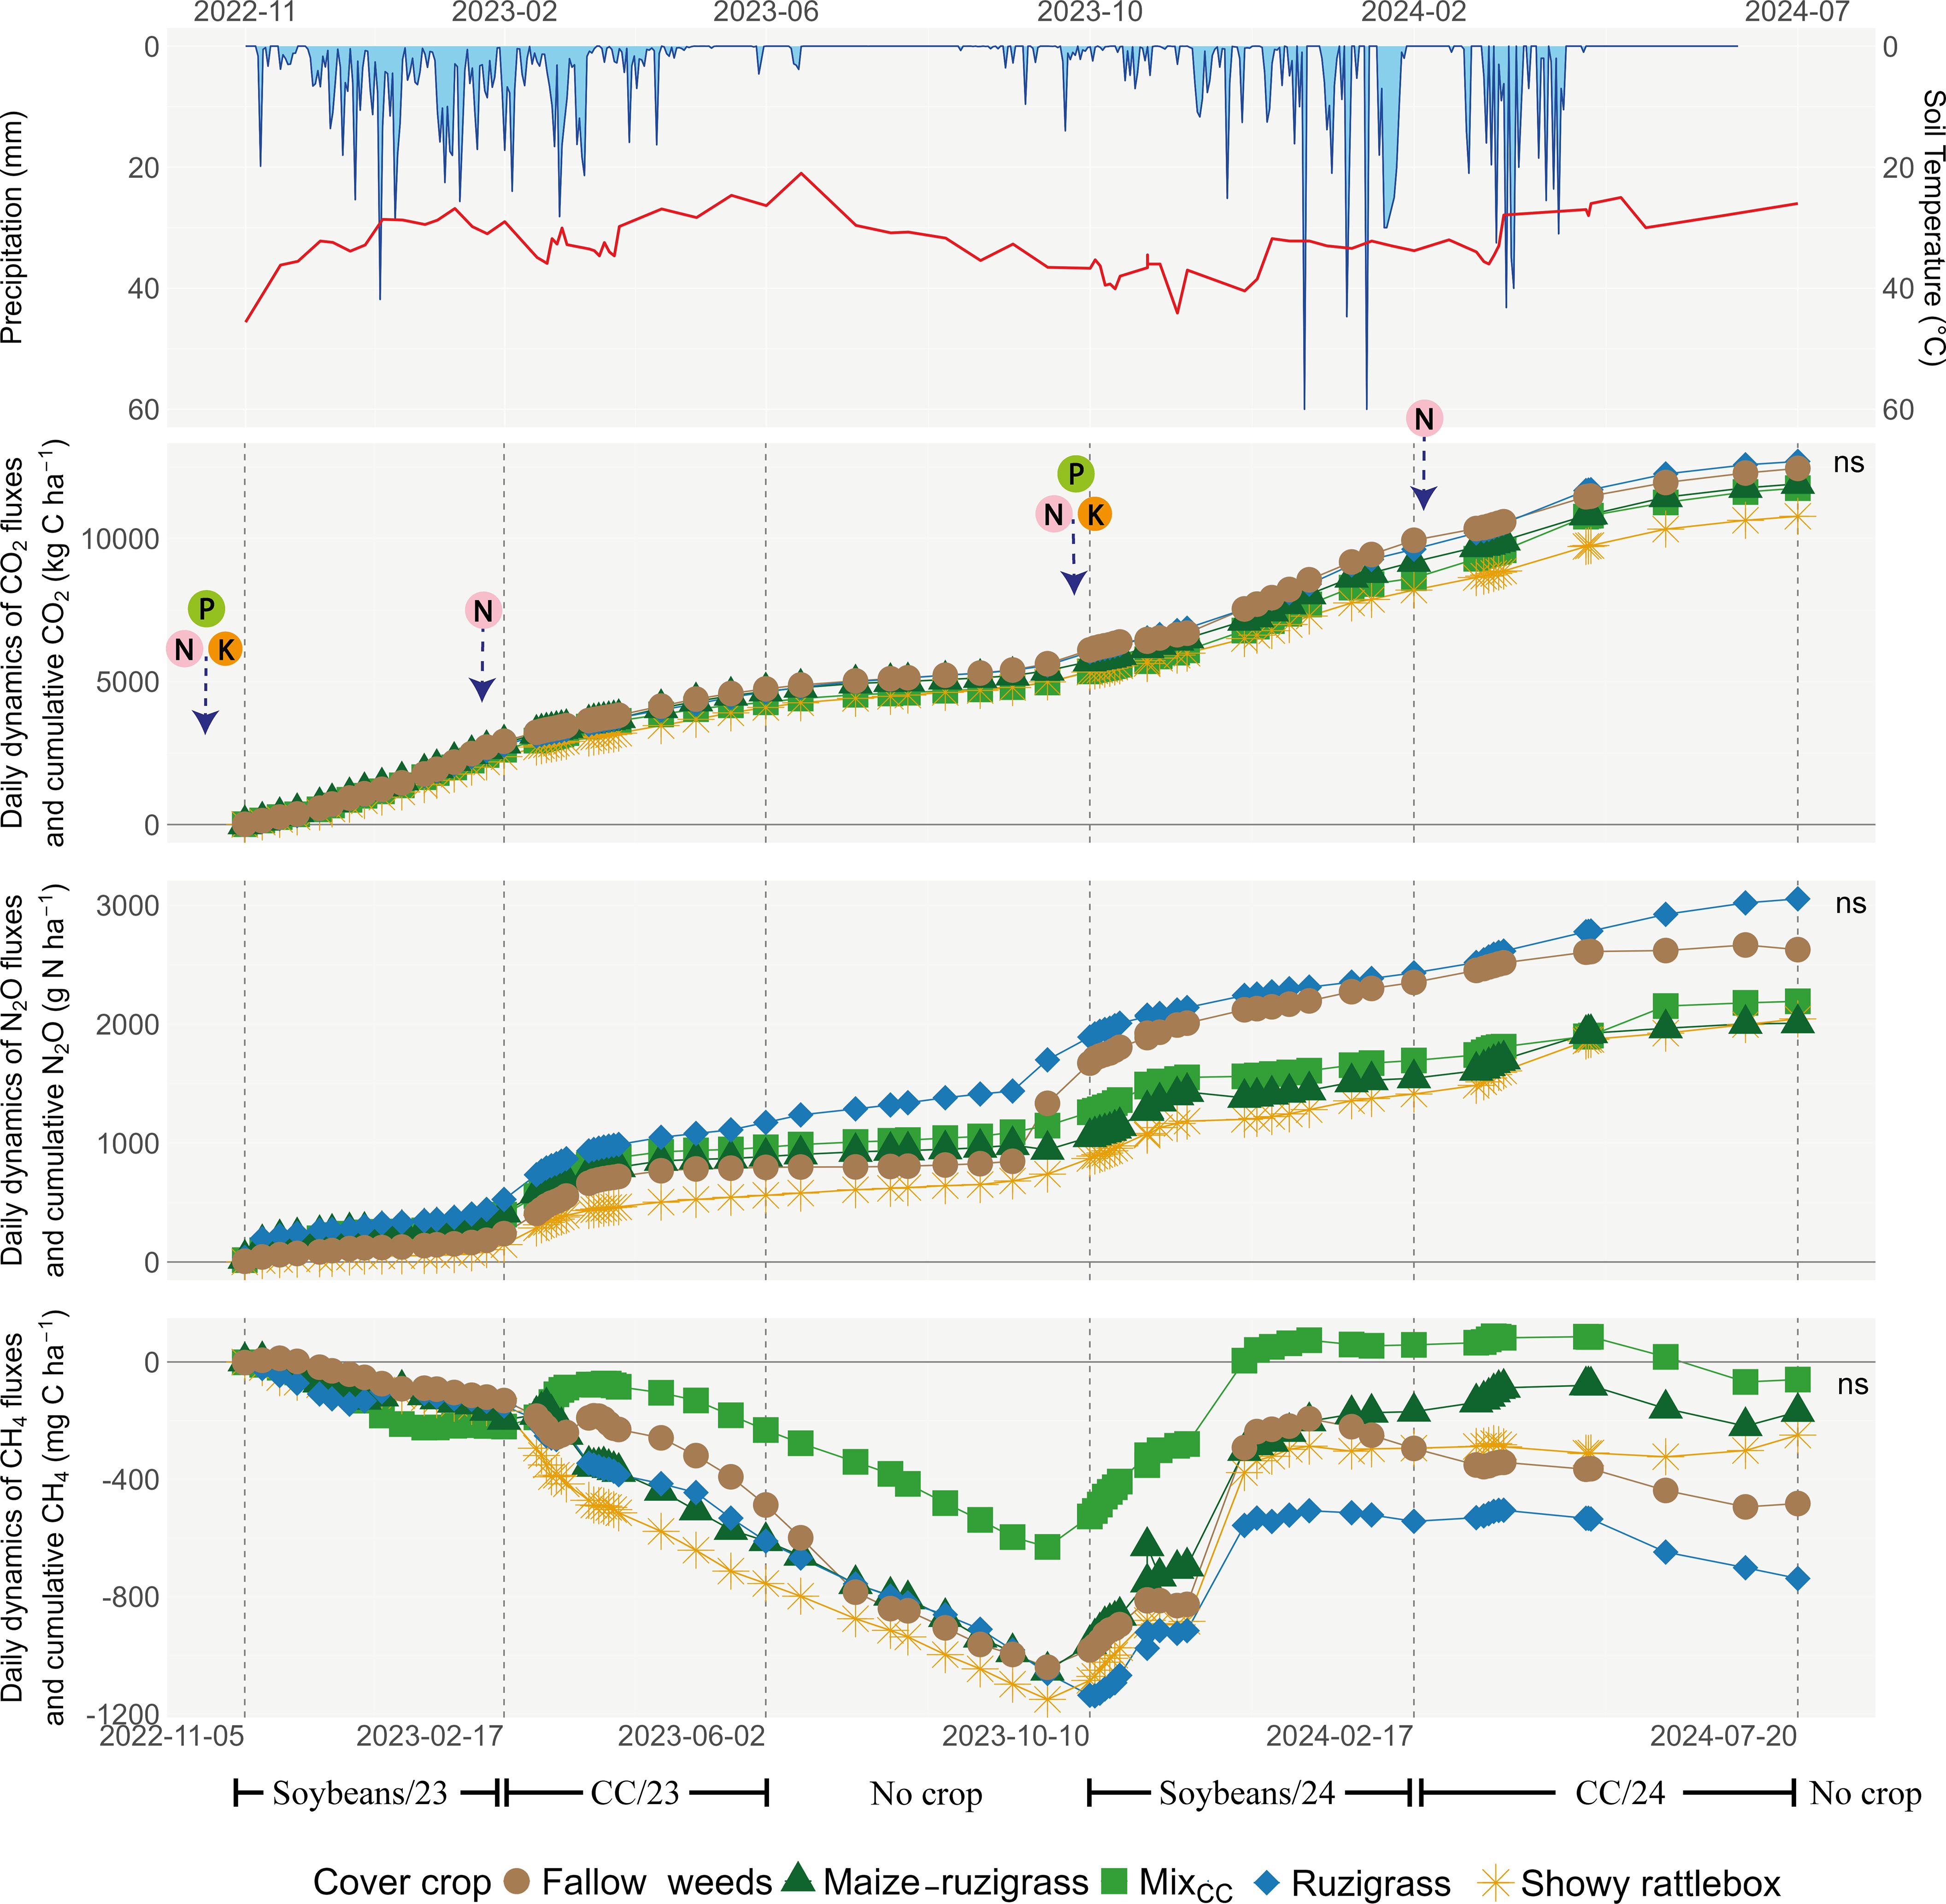
Figure 4. Seasonal dynamics of precipitation, soil temperature, and greenhouse gas fluxes in Rondonópolis. Mix in Rondonópolis (showy rattlebox, millet, ruzigrass, and pigeon pea).
In Rondonópolis (Figure 4), the cumulative CO2 emissions increased steadily over the 2-year period, reaching up to ~10,000 kg C ha−1 across treatments (Figure 3). For N2O, the treatments with ruzigrass (3,000 g N ha−1) and fallow weeds (2,627 g N ha−¹) showed the highest accumulated (p < 0.05) emissions over time. The CH4 fluxes indicated net uptake (negative values) throughout the experimental period, with most treatments acting as atmospheric CH4 sinks. However, no significant differences were observed among treatments for the three monitored GHG (p > 0.05).
In Rio Verde, during the 2024 soybean season, the maize treatment showed the highest N2O emissions (379 g ha−1), representing nearly 50% more than the average between the other treatments (p < 0.05; Table 3). In the cover crop season, the highest emissions were observed under ruzigrass (539 g ha−1) (Table 3). In Rondonópolis, the showy rattlebox treatment had the lowest N2O emissions during the soybean season (146 g ha−1 in 2023). In 2024, the mix treatment emitted 36.6% less N2O than the fallow weed system. In the cover crop growing season, the highest emission was found in maize–ruzigrass (420 g N2O - N ha−1).
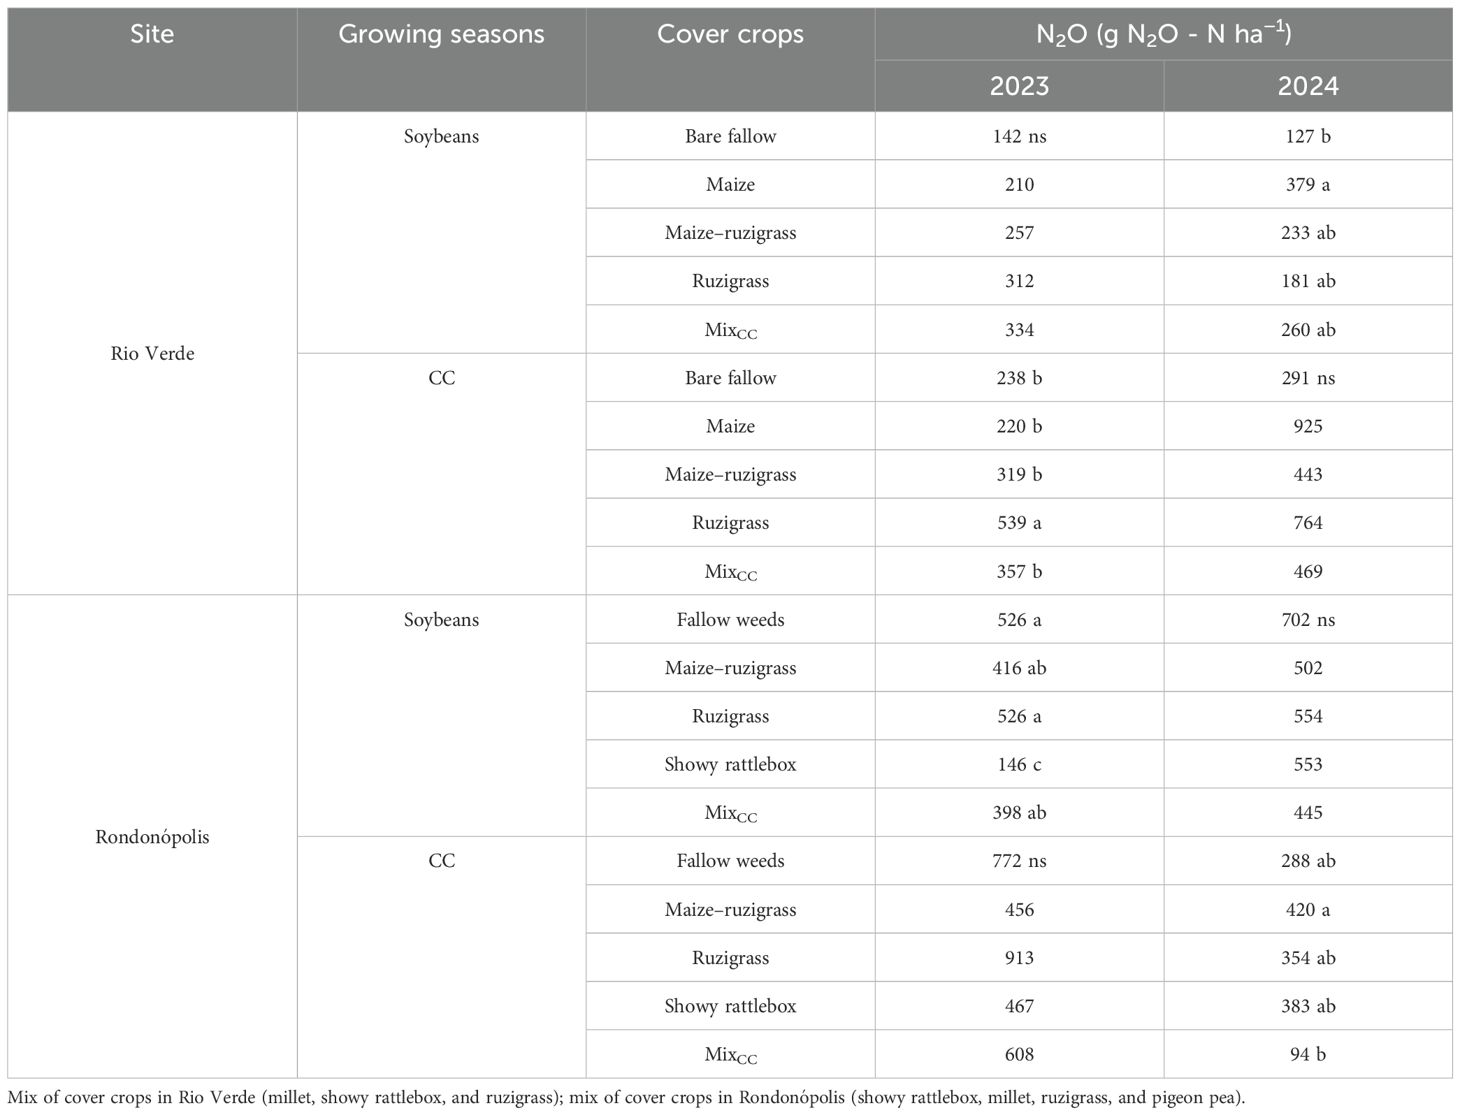
Table 3. Cumulative N2O emissions (g N2O - N ha−1) in each year and season.
3.3 Emission intensity and structural equation modeling
Carbon emission intensity (kg C - CO2 eq t−¹ of soybean grain) was significantly influenced by cover crop treatments in Rio Verde and Rondonópolis (p < 0.05; Table 4). In Rio Verde, the maize treatment had the highest emission intensity (7.47 kg C - CO2 eq t−1 grain), indicating that it emitted more N2O per unit of soybean yield compared to other cover crop systems. In contrast, the bare fallow treatment had the lowest emission intensity, with 3.61 kg C - CO2 eq t−1. In Rondonópolis, the fallow weed treatment exhibited the highest emission intensity (24.8 kg C - CO2 eq t−¹), ~40% higher than the ruzigrass and MixCC systems.
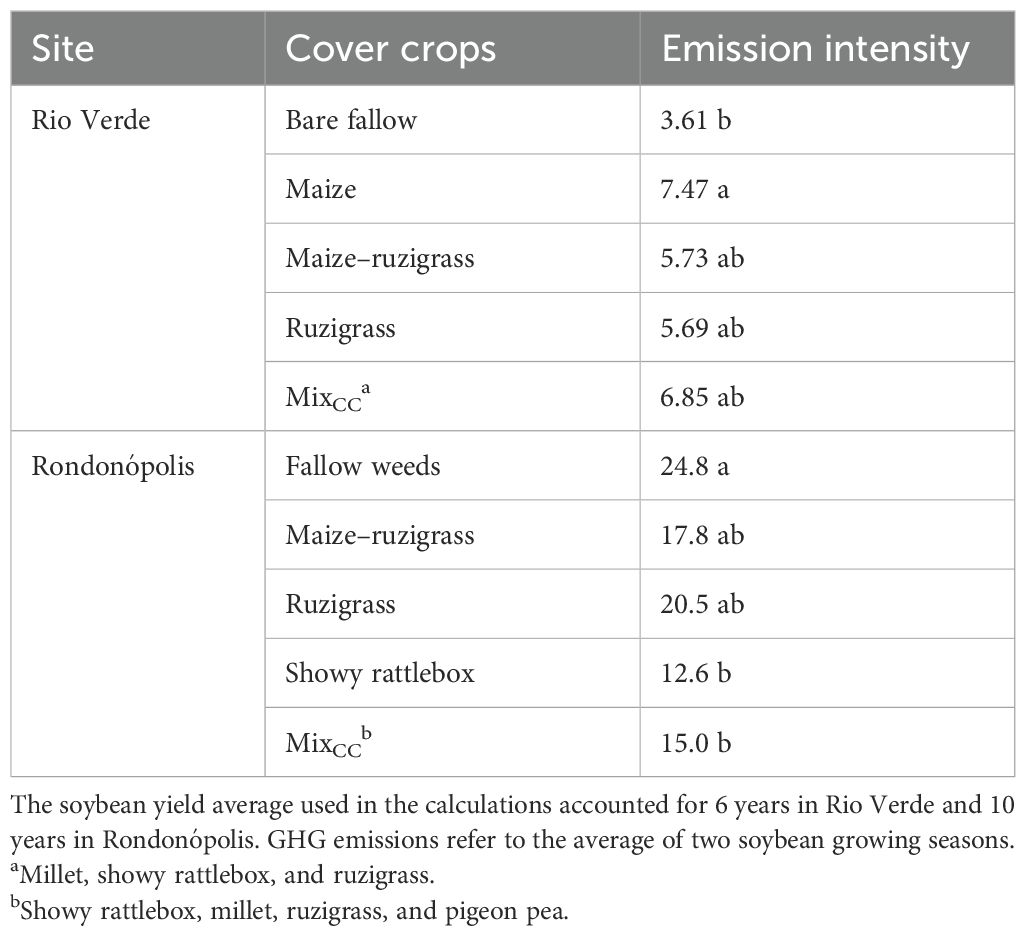
Table 4. Emission intensity (kg C - CO2 eq t−1 of soybean grain yield) calculated from CH4 and N2O equivalent emissions and soybean yield.
The pathways that explain the dynamics of N2O emission in the system were explored by SEM. While the RMSEA was 0.195, other measures such as the comparative fit index (CFI = 0.948) and the significant standardized path coefficients suggest that the model reliably captured the underlying relationships. The model explained 87% of the variance in carbon emission intensity (R² = 0.866) and 35% of the variance in N2O emissions during the soybean season (R² = 0.353), indicating predictive ability of the model. Despite the emission intensity being calculated from both N2O emission and soybean yield, the SEM framework considered their individual variability and distinct pathways, thus reducing the redundancy of the factors within the model. Specifically, cover crop biomass drives both N2O emission and soybean yield through different causal pathways, which allowed the model to consider multiple decoupled functions within their contributions to emission intensity. Thus, despite the mathematical link, the relationship remains biologically and statistically informative because it captures independent and interactive effects within the complex system.
Cover crop biomass had a significant positive effect on both soybean yield (standardized coefficient = 0.67, p < 0.01) and N2O emissions during the cover crop season (0.33, p < 0.05). A significant negative relationship was observed between soybean yield and N2O emissions during the soybean season (−0.42, p < 0.001), while the N2O emissions during the soybean season had a strong positive effect on emission intensity (0.60, p < 0.001). Cover crop biomass indirectly influenced emission intensity via its effects on both yield and N2O emissions, with an indirect negative pathway through soybean yield and a direct negative effect on emission intensity (−0.41, p < 0.001).
4 Discussion
4.1 Cover crop effects on GHG emissions (CO2, N2O, and CH4) in tropical soils
We sought to assess how cover crops affect the daily and accumulated emissions of CO2, N2O, and CH4 under tropical conditions. Gas fluxes varied significantly between sites, with Rio Verde showing greater sensitivity to management, particularly for CO2 and N2O. Emission patterns revealed that ruzigrass and a mix of cover crops promoted higher GHG emissions compared to bare fallow and maize treatments. The initial hypothesis predicting that increased biomass from cover crops would reduce N2O emissions during the offseason due to N uptake was not supported by the results. This showed that the nitrification inhibition potential of cover crops may be outweighed by their effects on soil moisture, N recycling, and the soil microbiome, which together determine soil N2O fluxes, as noted by Canisares et al. (28). This means that the higher emissions reflect the increased biological activity and improved soil health promoted by cover crops (9), as observed in the same experiment in Rio Verde, and do not compromise their overall contribution to system sustainability. This finding is consistent with Santos et al. (25), who observed 1.3 times higher emissions from a no-tillage system with soybean–sorghum compared to conventional tillage soybean–fallow. The increased N2O emissions in no-till systems, such as ruzigrass (C/N ratio of 16.4) and a mix of cover crops (C/N ratio of 22.5), can be explained by the high N content and low C/N ratio of the residues, coupled with a greater proportion of readily mineralizable carbon (see Supplementary Table S1). These traits accelerate microbial activity and organic matter turnover, increasing the rates of nitrification and denitrification (28). Unlike maize residues, which decompose more slowly due to their lower N and lignocellulosic content, ruzigrass and a mix of cover crops enhance decomposition dynamics. This pattern has been documented in previous studies demonstrating that residues with high soluble fractions promote intense microbial respiration in early decomposition phases (32, 41, 42). These findings suggest that their emissions can be offset by increased N availability and favorable conditions for microbial activity. This appears to be the case in Rio Verde, where systems with a high input of biomass from cover crops showed higher emissions. Meanwhile, the bare fallow treatment had notably lower emissions (see Figure 3). Thus, in such systems, emissions are likely driven more by enhanced mineralization than by inhibition of nitrification (28).
These responses are strongly dependent on the soil structure, nutrient cycling, and microbial processes. Meurer et al. (43) showed that the annual N2O emission from soils in Brazil varied between almost 0 and 4.26 kg N ha−1 year–1, emitting a median value of 0.80 kg N ha−1 year−1. Our results were in the range of the observed emissions reported by Meurer et al. (43), but the response of N2O emissions to different managements was site-dependent and reinforced the need for frequent and spatially distributed measurements to refine the GHG budget. Introducing forage grasses from different genera of Urochloa as cover crops has been widely adopted and reported as a management practice that sequesters soil C but increases N2O emission. Although the inclusion of tropical grasses contributes to sequestering approximately 600 kg C ha−1 year−1 into the SOC, it resulted in a net GHG mitigation of 360 kg CO2 eq ha−1 year−1 due to increased N2O emission (44).
In this study, we found increased soil CO2 emissions from cover crops. However, higher soil CO2 emissions should not necessarily be considered negative. Rather, they can indicate enhanced productivity and robust soil multifunctional performance (45, 46). This is because the measured CO2 represents total soil respiration, which encompasses microbial respiration, root respiration, and the decomposition of recently added plant residues (47). In treatments such as ruzigrass, a mix of cover crops, and maize–ruzigrass, elevated CO2 emissions are largely driven by the mineralization of fresh biomass. Additionally, temporal variability in CO2 fluxes is influenced by soil heterogeneity, including moisture availability, porosity, tortuosity, and biological activity from macro and mesofauna. Therefore, higher CO2 emissions in systems with high biomass input should be interpreted as a reflection of intensified microbial activity and active SOM turnover, rather than carbon loss. As reported by Siqueira-Neto et al. (27), up to 65%–75% of the carbon stored in cropland topsoil can be exchanged with the atmosphere annually, illustrating that elevated CO2 fluxes may coexist with stable or even increasing soil carbon stocks under dynamic, biologically active systems.
All treatments promoted soil CH4 oxidation (influx) (Figures 3, 4), although occasional emission peaks were observed under conditions of high soil moisture. The most pronounced peak occurred in Rondonópolis (Figure 4) during the rainy season and was likely associated with increased methanogenesis due to greater soil water saturation. These temporary increases are consistent with previous studies (27, 48).
4.2 Seasonal N2O emissions regulated by cover crop biomass and nitrogen uptake
Soybean yield responded positively to the biomass production from cover crops (Figure 5). Cover crops with vigorous root systems like ruzigrass improve soil structure, by forming biopores that alleviate soil compaction and creating a preferential path (i.e., low mechanical stress) to root growth (49, 50). When different species with varying biomass production, composition, and root types (architecture, morphology, physiology, and biotic interactions) are combined in a mix of cover crops, they interact to enhance soil health, by positively influencing the soil’s physical, chemical, and biological properties (9, 32). The improvements in soil health promoted by cover crops contribute to greater resilience under drought conditions and lead to more stable yields in tropical agroecosystems (9). This is consistent with long-term evidence showing that cover crops enhance productivity, buffer the impacts of climatic variability, and strengthen the adaptive capacity of agricultural systems (9, 51–55).
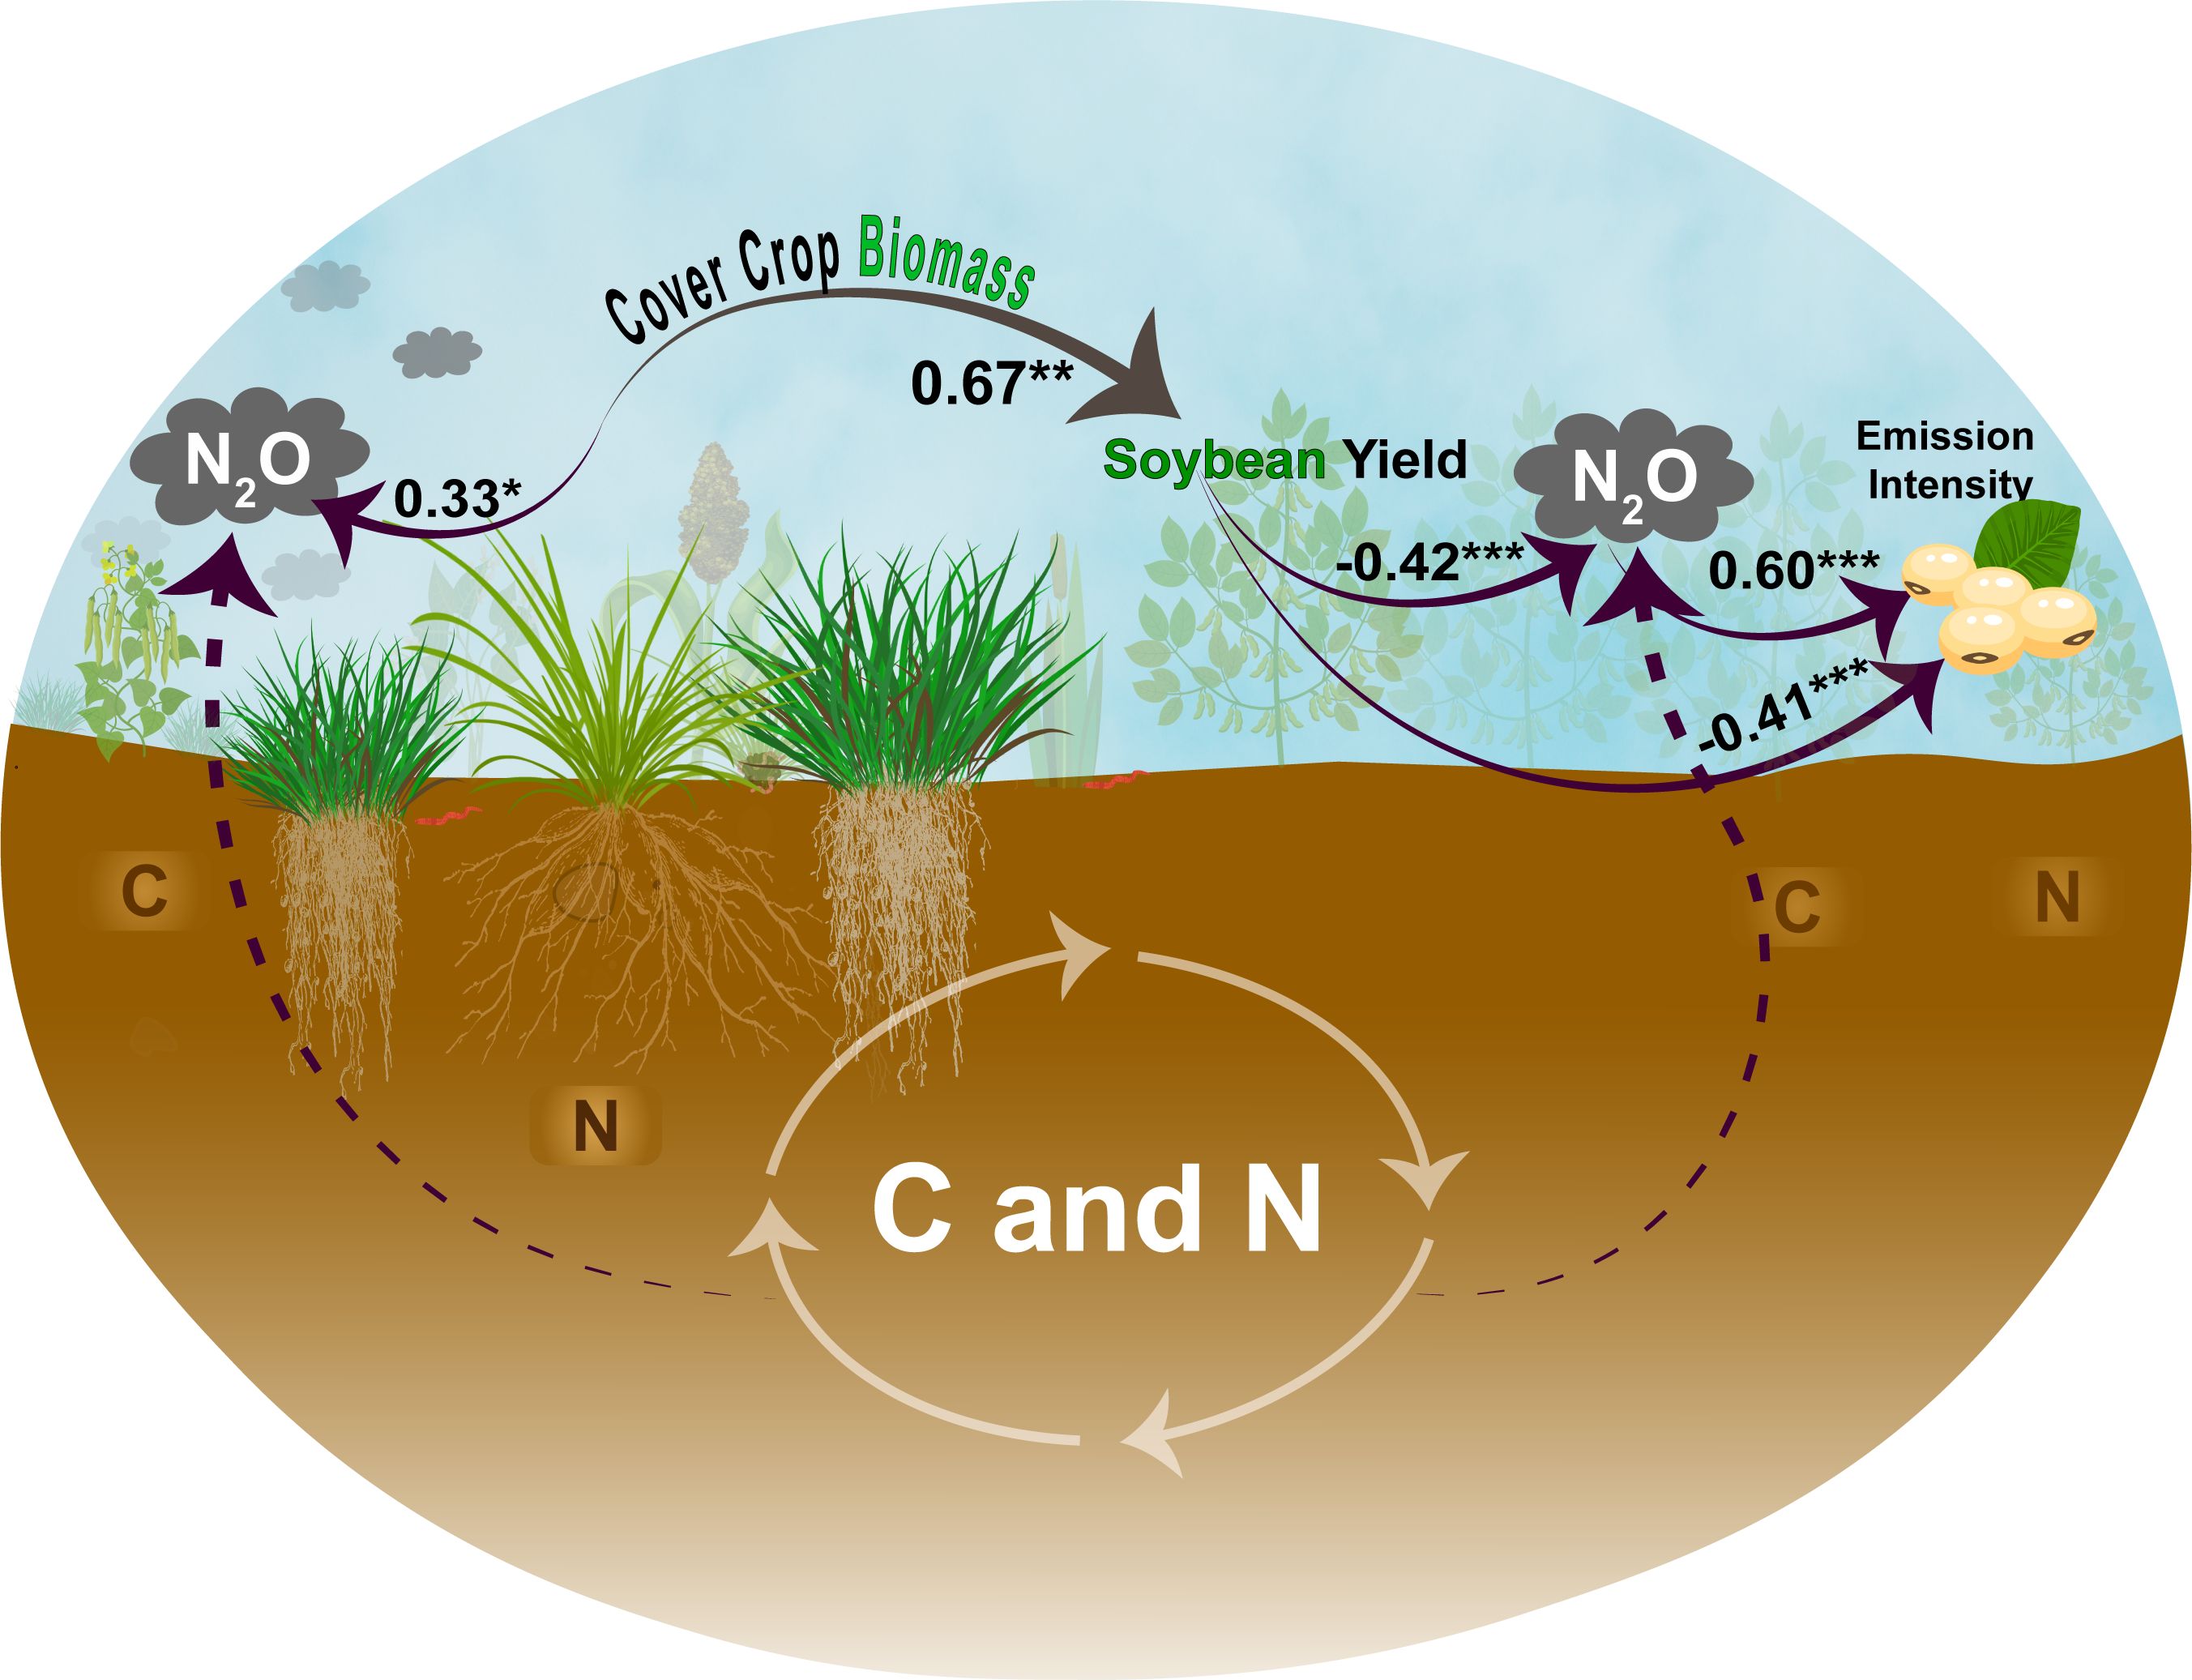
Figure 5. The relationships between cover crop biomass, soybean yield, N2O emissions, and emission intensity (kg CO2 eq t−1 of grain). Path coefficients are standardized. Significance levels are indicated as follows: *p < 0.05, **p < 0.01**, and ***p < 0.001.
The higher N2O emissions observed during the cover crop season are likely linked to the greater N inputs provided by treatments with higher biomass input (28). Ruzigrass and MixCC systems contributed, on average, 50% more carbon and up to 89% more N than conventional systems such as maize or fallow. The bare fallow treatment provides no carbon and N inputs during the cover crop growing season, resulting in reduced microbial and root activity. This biological condition reflects a degraded soil environment, where microbial communities are suppressed due to limited substrate availability (56). In addition to N, the carbon contribution from cover crop systems plays a central role in supporting microbial activity and building soil organic matter (57). In contrast, the fallow and maize systems produced the fewest carbon residue inputs, which likely limited microbial activity and reduced the provision of supporting ecosystem services (58). Similar results have been found under tropical conditions, showing declines in SOC with soybean monocultures compared to systems with cover crops (59).
Soil health improvements induced by cover crops also influence N dynamics during the soybean season. Higher soybean yields were associated with lower N2O emissions during the soybean growing season (standardized coefficient = −0.42, ***p < 0.001). This supports our second hypothesis that improved N use efficiency in high-yielding systems reduces the availability of substrates for microbial nitrification and denitrification. Enhanced N use efficiency by cover crops increased N uptake by plants and improved the efficiency of N fertilizer (60). This effect was particularly evident in systems with cover crops such as ruzigrass and MixCC, which produced biomass with low C/N ratios. These residues provide sufficient N for microbial communities, accelerating carbon mineralization and improving N uptake by the crop. The consistent supply of mineralizable N from these biomass enables the soybean to meet its N demand more efficiently (32), thereby reducing N losses to the atmosphere. This negative relationship between soybean yield and N2O emissions during the soybean growing season may reflect several interconnected biogeochemical and physiological mechanisms. As noted by Charnobay et al. (57), ruzigrass not only increased soil nitrate (N-NO3-) concentrations and total inorganic N but also enhanced microbial biomass N (MB-N). This suggests a close link between microbial immobilization and mineral N availability. Ruzigrass is also known to stimulate the abundance of soil N-fixing microorganisms (61, 62), which may have supported biological N fixation in soybeans and further contributed to N supply from plant residue.
4.3 Practical implications
This study highlights the trade-offs between GHG emissions and yield, demonstrating that evaluating emissions in a single season or without a system-level perspective may overlook key interactions between management practices, biological processes, and long-term sustainability. Although the cover crop treatments increase the emissions during the cover crop growing season, they also enhance soil health (9), carbon input, and soybean yield factors that, when combined, reduce emission intensity and improve the overall climate efficiency of the system. The results emphasize that N use efficiency in the soybean season is a key point for reducing N2O emissions. Systems that produced residues with low C/N ratios, such as showy rattlebox and MixCC, synchronized N mineralization with crop demand, thereby limiting N losses and promoting higher yields in Rondonópolis (Table 4).
Not all low-emission systems are efficient, as evidenced by the EI results (Table 4). This highlights the importance of interpreting EI in the context of the local baseline treatment. In Rio Verde, the control treatment (bare fallow) showed very low emissions and no biomass input, resulting in lower EI values compared to cover crop treatments. In contrast, in Rondonópolis, the control (fallow weeds) included spontaneous vegetation that contributed to higher emissions without a proportional increase in yield, leading to higher EI.
These findings support our third hypothesis that high-biomass, diverse cover crop systems can reduce emission intensity (kg CO2 eq t−¹ of soybean) by boosting yield, particularly under tropical conditions. While some cover crop treatments may show higher absolute GHG emissions, their productive capacity offsets this by delivering greater yields, thereby improving environmental efficiency. For example, systems with low C/N ratio residues, such as showy rattlebox and cover crop mix, demonstrated lower EI and higher productivity in Rondonópolis.
In contrast, systems like maize or fallow weeds emitted more per unit of soybean produced, reflecting lower resource-use efficiency. Treatments with very low emissions but also low productivity, such as bare fallow, may undermine long-term soil functioning, resilience, and sustainability (9). Therefore, EI provides a more integrative metric to evaluate the trade-offs between emissions and productivity. These results support the use of cover crops in tropical agriculture, not necessarily to reduce absolute total N2O emissions but to improve the environmental efficiency of soybean production.
5 Conclusions
The first hypothesis—the greatest cover crop biomass addition reduces N2O emissions during the offseason—was rejected as the highest biomass addition from cover crops increased N2O fluxes, likely due to greater N input and stimulation of microbial activity. However, these emissions were temporally limited and must be interpreted alongside crop performance metrics.
The highest soybean yields during the growing season were associated with reduced N2O emissions, confirming the second and third hypotheses. Improved N use efficiency and reduced substrate availability for nitrification and denitrification are likely the reasons that led to the observed results. In Rio Verde, the cover crop systems reduced emission intensity by up to 24% compared to the maize system (7.47 kg CO2 eq t−¹). In Rondonópolis, the showy rattlebox and mix of cover crops achieved lower emission intensities (12.6 and 15.0 kg CO2 eq t−¹) compared to fallow weeds (24.8 kg CO2 eq t−¹), representing reductions of up to 49%. Despite higher absolute N2O emissions during the offseason, these systems delivered greater yield, thereby diluting emissions per unit of production and enhancing system efficiency.
Data availability statement
The raw data supporting the conclusions of this article will be made available by the authors, without undue reservation.
Author contributions
VS: Writing – review & editing, Writing – original draft, Formal analysis, Investigation, Software, Data curation, Validation, Conceptualization, Methodology, Visualization. MT: Writing – review & editing, Data curation, Methodology. BS: Visualization, Writing – review & editing, Formal analysis, Conceptualization. LPC: Formal analysis, Writing – review & editing, Methodology, Conceptualization, Data curation, Investigation. JL: Writing – review & editing, Conceptualization, Methodology, Investigation. LD: Writing – review & editing. DS: Resources, Writing – review & editing, Funding acquisition, Conceptualization, Methodology, Project administration. LPP: Resources, Project administration, Formal analysis, Writing – review & editing, Investigation, Methodology, Conceptualization. CC: Methodology, Writing – review & editing, Conceptualization, Resources, Visualization, Funding acquisition. MC: Formal analysis, Funding acquisition, Writing – original draft, Project administration, Resources, Visualization, Methodology, Supervision, Data curation, Investigation, Validation, Writing – review & editing, Conceptualization.
Funding
The author(s) declare that financial support was received for the research and/or publication of this article. We thank the Center for Carbon Research in Tropical Agriculture/University of São Paulo (CCARBON/USP), supported by the São Paulo Research Foundation (FAPESP - process # 2021/10573-4) and Bayer S/A (project - “Balanço de carbono em sistemas agrícolas: revelando o impacto da adoção de práticas de manejo sustentáveis nos estoques de carbono do solo e nas emissões de gases de efeito estufa”). VS, BS, and LPC were funded by FAPESP (processes 2022/16368–6 and 2024/06095-8; 2023/10897–0 and 2024/08419-5; 2023/08814–9 and 2024/15775-2). We also extend our thanks to the Coordination for the Improvement of Higher Education Personnel (CAPES) for the scholarships and to the National Council for Scientific and Technological Development (CNPq) for supporting the research. MC thanks the CNPq for his Research Productivity Fellowship (302249/2025-7). We acknowledge the support of the Center for Carbon Research in Tropical Agriculture (CCARBON,USP) – São Paulo Research Foundation (FAPESP process 21/10573-4) and the RCGI - Research Centre for Greenhouse Gas Innovation/USP (FAPESP processes 2014/50279-4 and 2020/15230-5) and Shell Brazil.
Conflict of interest
The authors declare that the research was conducted in the absence of any commercial or financial relationships that could be construed as a potential conflict of interest.
Generative AI statement
The author(s) declare that no Generative AI was used in the creation of this manuscript.
Publisher’s note
All claims expressed in this article are solely those of the authors and do not necessarily represent those of their affiliated organizations, or those of the publisher, the editors and the reviewers. Any product that may be evaluated in this article, or claim that may be made by its manufacturer, is not guaranteed or endorsed by the publisher.
Supplementary material
The Supplementary Material for this article can be found online at: https://www.frontiersin.org/articles/10.3389/fsoil.2025.1630385/full#supplementary-material
References
1. WMO. WMO Greenhouse Gas Bulletin No. 20: The state of greenhouse gases in the atmosphere based on global observations through 2023 (2024). Available online at: https://library.wmo.int/idurl/4/69057 (Accessed February 10, 2025).
2. WRI. Climate watch historical GHG emissions, (1990-2020). Washington, DC: WRI (2020). Available at: https://www.climatewatchdata.org/ghg-emissions (Accessed January 12, 2025).
3. IPCC. Climate change 2021: the physical science basis. Contribution of working group I to the sixth assessment report of the intergovernmental panel on climate change. In: Masson-Delmotte V, Zhai P, Pirani A, Connors SL, Péan C, Berger S, Caud N, Chen Y, Goldfarb L, Gomis MI, Huang M, Leitzell K, Lonnoy E, Matthews JBR, Maycock TK, Waterfield T, Yelekçi O, Yu R, and Zhou B, editors. Cambridge: Cambridge University Press (2021). doi: 10.1017/9781009157896
4. Scholes RJ. Climate change and ecosystem services. WIREs Clim Change. (2016) 7:537–50. doi: 10.1002/wcc.404
5. SEEG. nalysis of greenhouse gas emissions and their implications for Brazil’s climate goals: 1970-2023. São Paulo, Brazil: Climate Observatory (2024). Available at: https://seeg.eco.br/en/home/.
6. Lal R. Soil carbon sequestration impacts on global climate change and food security. Science. (2004) 304:1623–7. doi: 10.1126/science.1097396
7. Cerri CEP, Cherubin MR, Villela JM, Locatelli JL, Carvalho ML, Villarreal F, et al. Carbon farming in the living soils of the Americas. Front Sustain Food Syst. (2024) 8:1481005. doi: 10.3389/fsufs.2024.1481005
8. Prairie AM, King AE, and Cotrufo MF. Restoring particulate and mineral-associated organic carbon through regenerative agriculture. Proc Natl Acad Sci USA. (2023) 120:e2217481120. doi: 10.1073/pnas.2217481120
9. Souza VS, Canisares LP, Schiebelbein BE, de Castro Santos D, Menillo RB, Pinheiro Júnior CR, et al. Cover crops enhance soil health, crop yield and resilience of tropical agroecosystem. Field Crops Res. (2025) 322:109755. doi: 10.1016/j.fcr.2025.109755
10. Bossio DA, Cook-Patton SC, Ellis PW, Fargione J, Sanderman J, Smith P, et al. The role of soil carbon in natural climate solutions. Nat Sustain. (2020) 3:391–8. doi: 10.1038/s41893-020-0491-z
11. Friedlingstein P, O’Sullivan M, Jones MW, Andrew RM, Hauck J, Landschützer P, et al. Global carbon budget. Earth Syst Sci Data. (2025) 17(3):965–1039. doi: 10.5194/essd-17-965-2025
12. Rigon JPG and Calonego JC. Soil carbon fluxes and balances of crop rotations under long-term no-till. Carbon Balance Manage. (2020) 15:1–11. doi: 10.1186/s13021-020-00154-3
13. Zhang ZL, Kaye JP, Bradley BA, Amsili JP, and Suseela V. Cover crop functional types differentially alter the content and composition of soil organic carbon in particulate and mineral-associated fractions. Glob Change Biol. (2022) 28:5831–48. doi: 10.1111/gcb.16296
14. Figueiredo CC, Oliveira AD, Santos IL, Ferreira EAB, Malaquias JV, Carolino de Sá MA, et al. Relationships between soil organic matter pools and nitrous oxide emissions of agroecosystems in the Brazilian Cerrado. Sci Total Environ. (2018) 618:1572–82. doi: 10.1016/j.scitotenv.2017.09.333
15. Kaye J, Finney D, White C, Bradley B, Schipanski M, Alonso-ayuso, et al. Managing nitrogen through cover crop species selection in the U.S. mid-Atlantic. PloS One. (2019) 4:e0215448. doi: 10.1371/journal.pone.0215448
16. Camargo GGT, Ryan MR, and Richard TL. Energy use and greenhouse gas emissions from crop production using the Farm Energy Analysis Tool. BioScience. (2013) 63:263–73. doi: 10.1525/bio.2013.63.4.6
17. CONAB. Acompanhamento da safra brasileira: grãos, safra 2024/25 - 2° levantamento. Brasília: Conab (2024). Available at: https://www.gov.br/conab.
18. Spera SA, Winter JM, and Partridge TF. Brazilian Maize yields negatively affected by climate after land clearing. Nat Sustain. (2020) 3:845–52. doi: 10.1038/s41893-020-0560-3
19. Sá JCM, Séguy L, Tivet F, Lal R, Bouzinac S, Borszowskei PR, et al. Carbon depletion by plowing and its restoration by no-till systems. Land Degrad Dev. (2015) 26:531–43. doi:10.1002/ldr.2218
20. Wood SA and Bowman M. Large-scale farmer-led experiment demonstrates positive impact of cover crops on multiple soil health indicators. Nat Food. (2021) 2:97–103. doi: 10.1038/s43016-021-00222-y
21. Kim N, Zabaloy MC, Guan K, and Villamil MB. Do cover crops benefit soil microbiome? A meta-analysis of current research. Soil Biol Biochem. (2020) 142:107701. doi: 10.1016/j.soilbio.2019.107701
22. Jian J, Du X, Reiter MS, and Stewart RD. A meta-analysis of global cropland soil carbon changes due to cover cropping. Soil Biol Biochem. (2020) 143:107735. doi: 10.1016/j.soilbio.2020.107735
23. Locatelli JL, Popin GV, Santos RS, Bieluczyk W, Cipriani LT, Cherubin MR, et al. A comprehensive assessment of greenhouse gas emissions research in the Cerrado region, Brazil. Catena. (2024) 247:108538. doi:10.1016/j.catena.2024.108538
24. Bieluczyk W, Cherubin MR, Cerri CEP, Siqueira-Neto M, Abdalla-Filho AL, Castro JIA, et al. Greenhouse gas fluxes in Brazilian climate-smart agricultural and livestock systems: A systematic and critical overview. J Clean Prod. (2024) 464:142782. doi: 10.1016/j.jclepro.2024.142782
25. Santos IL, Oliveira AD, Figueiredo CC, Malaquias JV, Santos Júnior JDG, Ferreira EAB, et al. Soil N2O emissions from long-term agroecosystems: Interactive effects of rainfall seasonality and crop rotation in the Brazilian Cerrado. Agric Ecosyst Environ. (2016) 233:111–20. doi: 10.1016/j.agee.2016.08.027
26. Oliveira AD, Ribeiro FP, Figueiredo CC, Muller AG, Malaquias JV, Santos IL, et al. Effects of soil management, rotation and sequence of crops on soil nitrous oxide emissions in the Cerrado: A multi-factor assessment. J Environ Manage. (2023) 348:119295. doi: 10.1016/j.jenvman.2023.119295
27. Siqueira-Neto M, Popin GV, Piccolo MC, Corbeels M, Scopel E, Camargo PB, et al. Impacts of land use and cropland management on soil organic matter and greenhouse gas emissions in the Brazilian Cerrado. Eur J Soil Sci. (2020) 72:1431–46. doi: 10.1111/ejss.13059
28. Canisares LP, Rosolem CA, Momesso L, Crusciol CAC, Villegas DM, Arango J, et al. Maize-Brachiaria intercropping: A strategy to supply recycled N to Maize and reduce soil N2O emissions? Agric Ecosyst Environ. (2021) 319:107491. doi: 10.1016/j.agee.2021.107491
29. Alvarez CA, Stape JL, Sentelhas PC, and Moraes Goncalves Sparovek G. Köppen's climate classification map for Brazil. Meteorol Z. (2013) 22:711–28. doi:10.1127/0941-2948/2013/0507
30. Santos HGDos, Jacomine PKT, Anjos LHCDos, Oliveira VADe, Lumbreras JF, Coelho MR, et al. Sistema Brasileiro de Classificação de Solos. 5 ed. rev. e ampl.. Brasília, DF: Embrapa. (2018). http://ainfo.cnptia.embrapa.br/digital/bitstream/item/181677/1/SIBCS-2018-ISBN-9788570358172.epub
31. Soil Survey Staff. Keys to soil taxonomy. 13th ed. Washington, DC: USDA-Natural Resources Conservation Service (2022).
32. Souza VS, de Castro Santos D, Ferreira JG, de Souza SO, Gonçalo TP, de Sousa JVA, et al. Cover crop diversity for sustainable agriculture: Insights from the Cerrado Biome. Soil Use Manag. (2024) 30 (1), 1–15. doi: 10.1111/sum.13014
33. Pacheco LP, Monteiro MMS, Petter FA, Nóbrega JCA, and Santos AS. Biomass and nutrient cycling by cover crops in Brazilian Cerrado in the state of Piaui. Rev Caatinga. (2017) 30:13–23. doi: 10.1590/1983-21252017v30n102rc
34. Silva DJ and Queiroz AC. Food Analysis: Chemical and Biological Methods = Análise de Alimentos: Métodos Químicos e Biológicos. 3rd ed. Viçosa, MG: UFV (2002).
35. Krisnawati A and Adie MM. Variability of biomass and harvest index from several soybean genotypes as renewable energy source. Energy Procedia. (2015) 65:14–21. doi: 10.1016/j.egypro.2015.01.023
36. Zanatta JA, Alves BJR, Bayer C, Tomazi M, Marozzi-Fernandes AHB, Costa FS, et al. Protocolo para medição de fluxos de gases de efeito estufa do solo Vol. 265. . Colombo: Embrapa Florestas (2014), 265. Available at: http://www.infoteca.cnptia.embrapa.br/handle/item/221 (Accessed May 28, 2025).
37. Jantalia CP, dos Santos HP, Urquiaga S, Boddey RM, and Alves BJR. Fluxes of nitrous oxide from soil under different crop rotations and tillage systems in the south of Brazil. Nutr Cycl Agroecosyst. (2008) 82:161–73. doi: 10.1007/s10705-008-9178-y
38. Parkin TB and Venterea RT. Sampling protocols. Ch 3: Chamber-based trace gas flux measurements. In: Follett RF, editor. GRACEnet sampling protocols United States Department of Agriculture, Agricultural Research Service, Fort Collins (2010). p. 1–39. Available online at: http://www.ars.usda.gov/SP2UserFiles/Program/212/Chapter%203.%20GRACEnet%20Trace%20Gas%20Sampling%20Protocols.pdf.
39. R Core Team. R: A Language and Environment for Statistical Computing. R Foundation for Statistical Computing. (2024). https://www.R-project.org/
40. Muñoz Sabater J. ERA5-Land monthly averaged data from 1981 to present. Copernicus Climate Data Store (CDS) (2019). doi: 10.24381/cds.68d2bb30
41. Cobo JG, Barrios E, Kass DCL, and Thomas RJ. Decomposition and nutrient release by green manures in tropical hillside agroecosystem. Plant Soil. (2002) 240:331–342. doi:10.1023/A:1015720324392
42. Redin M, Recous S, Aita C, Dietrich G, Skolaude AC, Ludke WH, et al. How the chemical composition and heterogeneity of crop residue mixtures decomposing at the soil surface affects C and N mineralization. Soil Biol Biochem. (2014) 78:65–75. doi: 10.1016/j.soilbio.2014.07.014
43. Meurer KHE, Franko U, Stange CF, Dalla Rosa J, Madari BE, and Jungkunst HF. Direct nitrous oxide (N2O) fluxes from soils under different land use in Brazil - a critical review. Environ Res Lett. (2016) 11:23001. doi: 10.1088/1748-9326/11/2/023001
44. Carvalho JLN, Raucci GS, Frazão LA, Cerri CEP, Bernoux M, and Cerri CC. Crop-pasture rotation: A strategy to reduce soil greenhouse gas emissions in the Brazilian Cerrado. Agric Ecosyst Environ. (2014) 183:167–75. doi: 10.1016/j.agee.2013.11.014
45. Salimon CI, Davidson EA, Victoria RL, and Melo AWF. CO2 flux from soil in pastures and forests in southwestern Amazonia. Glob Change Biol. (2004) 10:833–43. doi: 10.1111/j.1529-8817.2003.00776.x
46. Bieluczyk W, Asselta FO, Navroski D, Gontijo JB, Venturini AM, Mendes LW, et al. Linking above and belowground carbon sequestration, soil organic matter properties, and soil health in Brazilian Atlantic Forest restoration. J Environ Manage. (2023) 344:118573. doi: 10.1016/j.jenvman.2023.118573
47. Carvalho AM, Bustamante MMC, Coser TR, Marchão RL, and Malaquias JV. Nitrogen oxides and CO2 from an Oxisol cultivated with corn in succession to cover crops. Pesqui Agropecu Bras. (2016) 51:1213–22. doi: 10.1590/s0100-204x2016000900021
48. Salehin SMU, Rajan N, Mowrer J, Casey KD, Tomlinson P, Somenahally A, et al. Cover crops in organic cotton influence greenhouse gas emissions and soil microclimate. Agron J. (2025) 117:1–22. doi: 10.1002/agj2.21735
49. Paschoal MCG, Cagna CP, Filho OG, and Mazzini-Guedes RB. Visual evaluation of soil structure in Maize and forage grasses intercropping under no-tillage. Braz Arch Biol Technol. (2020) 63:1–8. doi: 10.1590/1678-4324-solo-2020190498
50. Bertollo AM, de Moraes MT, Franchini JC, Soltangheisi A, Balbinot Junior AA, Levien R, et al. Pre-crops alleviate soil physical limitations for soybean root growth in an Oxisol from southern Brazil. Soil Tillage Res. (2021) 206:104820. doi: 10.1016/j.still.2020.104820
51. Gaudin ACM, Tolhurst TN, Ker AP, Janovicek K, Tortora C, Martin RC, et al. Increasing crop diversity mitigates weather variations and improves yield stability. PLoS One. (2015) 10:e0113261. doi:10.1371/journal.pone.0113261
52. Bowles TM, Mooshammer M, Socolar Y, Calderón F, Cavigelli MA, Culman SW, et al. Long-term evidence shows that crop-rotation diversification increases agricultural resilience to adverse growing conditions in North America. One Earth. (2020) 2:284–93.
53. Nouri A, Yoder DC, Raji M, Ceylan S, Jagadamma S, Lee J, et al. Conservation agriculture increases the soil resilience and cotton yield stability in climate extremes of the southeast US. Commun Earth Environ. (2021) 2. doi:10.1038/s43247-021-00223-6
54. Jat ML, Gathala MK, Choudhary M, Sharma S, Jat HS, Gupta N, et al. Chapter Three - Conservation agriculture for regenerating soil health and climate change mitigation in smallholder systems of South Asia. Adv Agron. (2023) 181:183–277. doi:10.1016/bs.agron.2023.05.003
55. Li J, Huang L, Zhang J, Coulter JA, Li L, and Gan Y. Diversifying crop rotation improves system robustness. Agron Sustain Dev. (2019) 39:0–13. doi:10.1007/s13593-019-0584-0
56. Schmatz R, Recous S, Weiler DA, Pilecco GE, Schu AL, Giovelli RL, et al. How the mass and quality of wheat and vetch mulches affect drivers of soil N2O emissions. Geoderma. (2020) 372:114395. doi: 10.1016/j.geoderma.2020.114395
57. Charnobay ACR, Rondina ABL, Balbinot Junior AA, Hungria M, and Nogueira MA. Soil microbial attributes and soybean yield response to off-season crop diversification in an Oxisol in Southern Brazil. Appl Soil Ecol. (2025) 195:105361. doi: 10.1016/j.apsoil.2025.1060407
58. Schipanski ME, Barbercheck M, Douglas MR, Finney DM, Haider K, Kaye JP, et al. A framework for evaluating ecosystem services provided by cover crops in agroecosystems. Agric Syst. (2014) 125:12–22. doi: 10.1016/j.agsy.2013.11.004
59. Rosolem CA, Li Y, and Garcia RA. Soil carbon as affected by cover crops under no‐till under tropical climate. Soil Use Manag. (2016) 32:495–503. doi:10.1111/sum.12309
60. Costa NR, Andreotti M, Crusciol CAC, Pariz CM, Bossolani JW, Pascoaloto IM, et al. Soybean yield and nutrition after tropical forage grasses. Nutr Cycl Agroecosyst. (2021) 121:31–49. doi: 10.1007/s10705-021-10157-2
61. Merloti LF, Bossolani JW, Mendes LW, Rocha GS, Rodrigues M, Asselta FO, et al. Investigating the effects of Brachiaria (Syn. Urochloa) varieties on soil properties and microbiome. Plant Soil. (2023). doi: 10.21203/rs.3.rs-2731770/v1
Keywords: GHG emissions, emissions intensity, Cerrado, structural equation modeling, soil health
Citation: Souza VS, Borges MT, Schiebelbein BE, Canisares LP, Locatelli JL, Bortolo LdS, Santos DdC, Pacheco LP, Cerri CEP and Cherubin MR (2025) Trade-offs of tropical cover crops: enhanced carbon inputs and soybean yield offset higher N2O emissions. Front. Soil Sci. 5:1630385. doi: 10.3389/fsoil.2025.1630385
Received: 17 May 2025; Accepted: 07 July 2025;
Published: 04 August 2025.
Edited by:
Isabeli Pereira Bruno, Instituto de Desenvolvimento Rural do Paraná (IDR), BrazilReviewed by:
Sebastian Vangeli, University of Buenos Aires, ArgentinaArminda Carvalho, Brazilian Agricultural Research Corporation (EMBRAPA), Brazil
Copyright © 2025 Souza, Borges, Schiebelbein, Canisares, Locatelli, Bortolo, Santos, Pacheco, Cerri and Cherubin. This is an open-access article distributed under the terms of the Creative Commons Attribution License (CC BY). The use, distribution or reproduction in other forums is permitted, provided the original author(s) and the copyright owner(s) are credited and that the original publication in this journal is cited, in accordance with accepted academic practice. No use, distribution or reproduction is permitted which does not comply with these terms.
*Correspondence: Victória Santos Souza, dmljdG9yaWEuc3NvdXphQHVzcC5icg==