 Shreyashi Deb Roy
 Ganesh Khekare
 Sejal Chhajed
 Adrine Sharon Victor
- School of Computer Science and Engineering, Vellore Institute of Technology, Vellore, Tamil Nadu, India
Biochar, which is a high-carbon biomass pyrolysis byproduct, has considerable potential in environmental remediation, serving as a soil conditioner, a carbon sequestration substrate, and a wastewater treatment agent. Nevertheless, for its effective and safe application, thorough assessment techniques must be employed to analyze and measure the presence of potential risks like organic pollutants, metallic toxicants, and volatile organic compounds (VOCs). This research presents an automated framework based on artificial intelligence (AI), designed to evaluate the quality of biochar in real-time and enhance its environmental sustainability. The proposed system leverages data from the publicly available database to create biochar safety models for prediction. The system consists of three separate models: a classification model to evaluate the safety of biochar according to its chemical makeup, a regression model to estimate quantified levels of heavy metals, and a time series model to predict VOC emissions under different environmental conditions, facilitating evaluation of potential air quality effects. Performance results show that the Random Forest Regression model achieved a low Mean Squared Error (MSE) of 0.0046 and a strong R2 score of 0.9549, indicating high reliability in predicting heavy metal content, while the Random Forest Classifier achieved an external validation accuracy of 96.7%. The efficacy of the LSTM-based time series model in real-time environmental monitoring was demonstrated by the Mean Absolute Percentage Error (MAPE) accuracy of 87.14% in predicting VOC emissions. The multi-model system permits ongoing, precise monitoring while drastically minimizing human interaction and related errors. The AI models developed show great efficacy in classifying biochar safety, estimating the content of heavy metals, and estimating VOC emissions at future times. The system improves evaluation accuracy, operational efficiency, and production optimization while reducing disposal expenses and environmental hazards. This study provides a new contribution by integrating classification, regression, and time series analysis in one automated quality assessment system for biochar. It presents a scalable and smart solution that can be applied across environmental and industrial applications, enabling the wider integration of AI technologies into sustainable material management and environmental monitoring.
1 Introduction
Biochar is a byproduct with high carbon content resulting from the pyrolysis of biomass in conditions of limited oxygen. It has emerged as a significant material in environmental and agricultural sectors because of its remarkable physicochemical characteristics, including high surface area, porosity, and various functional groups. These qualities facilitate a range of applications such as enhancing soil quality, sequestering carbon, purifying water, and adsorbing pollutants. Therefore, there is a growing worldwide focus on utilizing biochar as a sustainable solution to tackle environmental issues. Nonetheless, despite its benefits, the safety and long-term environmental effects of biochar are not always guaranteed. Its properties can vary widely, largely determined by variables including the feedstock type, pyrolysis parameters, and any post-treatment processes. This variability can change biochar’s chemical makeup, leading to the potential presence of harmful constituents like heavy metals and polycyclic aromatic hydrocarbons (PAHs). Moreover, under specific environmental conditions, biochar can release volatile organic compounds (VOCs), which may harm air quality both indoors and outdoors. Thus, it is crucial to conduct a thorough evaluation of biochar’s safety and effectiveness before practical implementation.
Historically, assessing biochar has involved labour-intensive and time-consuming laboratory analyses that often lack scalability. These traditional methods may not accurately capture the intricate and nonlinear relationships between biochar’s composition and its environmental effects. Additionally, the absence of solid predictive frameworks limits the ability to generalize findings across various biochar types and application scenarios.
In response to these challenges, this study puts forward a multi-model machine learning (ML) strategy to enhance the predictive assessment of biochar’s safety and functional performance.
Specifically, the research develops:
1. A supervised classification model aimed at evaluating the safety of biochar based on its chemical composition, serving as an initial screening tool to identify potentially hazardous materials.
2. A Random Forest regression model to predict the adsorption efficiency for specific pollutants, such as heavy metals and synthetic dyes, aiding in the customization of biochar for specific applications.
3. A time series model to forecast VOC emissions under variable environmental conditions, offering insights into the long-term air quality consequences of biochar usage.
This comprehensive framework takes advantage of machine learning’s capability to extract meaningful insights from complex datasets and identify underlying patterns, enabling a fast, scalable, and reliable assessment of biochar properties. The study ultimately seeks to assist manufacturers, environmental regulators, and agricultural practitioners in making informed decisions regarding the production and use of biochar. This research contributes to the sustainable and responsible use of biochar by aligning its technological capabilities with environmental safety and compliance with regulatory standards.
2 Literature review
Biochar has become a sustainable and adaptable material with a wide range of uses in environmental management in recent years. Biochar, which is made by pyrolyzing biomass in low-oxygen environments, is prized for its high carbon content, porous structure, and capacity to improve soil fertility, sequester carbon, and adsorb contaminants. Because of its many uses, more research is being done in fields like water treatment, agriculture, and climate change mitigation. However, the physicochemical characteristics of biochar, which are impacted by variables like feedstock type, pyrolysis conditions, and environmental interactions, are crucial to its efficacy and safety. The need to thoroughly evaluate biochar’s performance and environmental impact has grown as interest in it has spread throughout the world. There have been many research studies designed to systematically characterize biochar through its structural, chemical, and functional qualities in different environmental applications. The following review examines some significant contributions that have helped develop aspects of biochar’s capability and its limitations, as well as the developing use of machine learning methods for predictive modeling and field applications of biochar.
As stated in (1), biochar is becoming highly popular sustainably for crop output boosting, soil health improvement, and lessening the effects of climate change. It has been demonstrated that a carbon-rich substance made by pyrolysis of biomass, also called biochar, enhances soil physical properties, including bulk density, porosity, water retention, as well as its chemical properties such as pH, cation exchange capacity (CEC), nutrient availability, etc. These promote microbial activity, which helps to boost plant growth and output. Studies have shown that the incorporation of biochar has the potential to enhance crop productivity by up to 20%, particularly in acidic and nutrient-poor soils. Biochar further reduces greenhouse gas emissions and contributes to long-term carbon sequestration by acting as a carbon sink. There exist issues such as the requirement for larger field research to comprehend its long-term effects and regional variances, especially in tropical areas where very little research has been carried out. Overall, biochar promises to be a tool for sustainable agriculture. However, an in-depth study is required to increase its use to the maximum potential in various agricultural settings.
According to (2), biochar has captured popularity because of its high surface area, porosity, and functional groups that make it capable of absorbing both organic and inorganic contaminants. Pyrolysis is considered the most effective approach for biochar synthesis. Other processes include hydrothermal carbonization, gasification, torrefaction, and pyrolysis. Factors such as feedstock type, pyrolysis temperature, and activation procedures affect how well biochar can remove pollutants. Biochar has been effectively used as a catalyst in the synthesis of biofuels and energy, as well as in the treatment of wastewater and soil remediation. Moreover, biochar aids in carbon sequestration by improving soil carbon storage and lowering greenhouse gas emissions. But there are still unresolved issues, like the requirement for larger field research to comprehend long-term consequences, the optimization of biochar’s characteristics for specific use cases, and handling any flaws, such as the emission of hazardous substances. Future studies should focus on crafting novel activation techniques, comprehending how microbes interact with biochar, and enhancing the characteristics of biochar to maximize its effectiveness in diverse environmental applications.
Reference (3) explores the use of machine learning algorithms like Random Forest, k-Nearest Neighbors, and Support Vector Regression to forecast how heavy metals will interact with biochar surfaces, with a focus on sorption efficiency across various feedstocks and pyrolysis parameters. Although the models show good performance in estimating adsorption behavior, the study’s scope is still constrained because it focuses on sorption potential rather than offering accurate predictions of heavy metal concentrations embedded in biochar. Furthermore, the model’s applicability to field-scale or industrial applications is limited by its dependence on static, laboratory-scale datasets. Environmental variables that could affect the stability and emission properties of biochar, like temperature swings or humidity levels, are not taken into account. Furthermore, insights into post-application impacts, such as possible emissions over time, are limited by the lack of temporal analysis. The interpretability of machine learning models is further limited by their black-box nature, which raises questions regarding their transparency and regulatory framework acceptability. Incorporating quantitative predictions of hazardous components, investigating environment-dependent behaviors, and using time-aware models that enable the evaluation of changing environmental risks related to biochar applications would be beneficial for future research.
Reference (4) suggests that ML is a promising tool for advancing biochar production by addressing the drawbacks of conventional experimental and computational modelling techniques. ML enables efficient prediction of biochar yield, properties, and pyrolysis conditions, optimising production processes while reducing time and labour, unlike other traditional processes. Numerous ML algorithms have been devised to model biochar synthesis, pollutant removal, and thermochemical processes, although most studies rely on lab-scale data rather than industrial-scale implementations. The black-box nature of ML remains a challenge, which highlights the need for hybrid models that integrate mechanism-based analysis to improve reliability and interpretability. Future studies should focus on enhancing model generalisation, expanding datasets, and validating ML predictions with experimental data to support large-scale biochar applications.
Adding further insight (5), emphasizes both the potential benefits and drawbacks of biochar application in environmental systems. Concerns regarding its environmental impact have risen. Research shows that biochar may release harmful components such as heavy metals, PAHs, and free radicals based on feedstock selection and pyrolysis conditions. In addition to this, biochar aging can change its properties by affecting soil microbial activity, increasing pollutant migration in water, and contributing to particulate emissions in the atmosphere. While earlier reviews have mainly focused on the benefits and improving strategies for biochar, recent research throws light on the need for comprehensive risk assessment and mitigation strategies across soil, water, and air to ensure sustainable biochar application within the environmental system.
The findings in (6) shed light on the ML model application for predicting the content and types of persistent free radicals (PFRs) in biochar, a critical factor influencing its environmental applications. This employs ML algorithms, such as XGBoost. RF, SVM, which analyzes a dataset compiled from peer-reviewed literature. XGBoost proved to be the most effective model by achieving high accuracy in both regression and classification tasks (R² = 0.95, AUROC = 0.92). Key factors such as metal/non-metal doping, pyrolysis temperature, carbon content, and specific surface area, etc., were identified as influencers of PFR content and type. This study emphasizes the dual nature of PFRs, which can have both advantageous and disadvantageous effects depending on their application, and introduces a GUI to facilitate PFR prediction. This research gives valuable insights into optimising biochar while minimising adverse effects for environmental applications.
Biochar, produced through the pyrolysis of biomass, is frequently employed for enhancing soil health and addressing environmental challenges. However, it is crucial to examine its heavy metal content and potential environmental risks before large-scale application. Different types of biochar may contain heavy metals such as cadmium (Cd), lead (Pb), and arsenic (As), which have the potential to leach into soil and water, resulting in ecological hazards. A detailed analysis was performed in study (7) on the concentrations of heavy metals in biochar obtained from different sources, including plant biomass, municipal solid waste (MSW), compost, and coal refuse. To assess contamination levels and the mobility of these metals, pollution indices such as the geo-accumulation index (GAI), ecological risk index (Eri_i), and potential ecological risk index (PERI) were applied. The findings reported that the concentrations of heavy metals differed depending on the feedstock used. Biochar produced from coal refuse showed the greatest pollution potential, especially regarding cadmium contamination. This research highlights the vital need to examine metal mobility to assess the appropriateness of biochar for environmental and agricultural uses.
The study (8) sheds light on the properties of Biochar. Biochar is recognized for its ability to improve soil quality and reduce heavy metal contamination, but its effectiveness depends on production methods and feedstock composition. Understanding its physicochemical properties and interactions with soil is crucial for effective environmental management. Production methods like slow pyrolysis, fast pyrolysis, and gasification impact characteristics such as surface area, porosity, and cation exchange capacity (CEC). Higher pyrolysis temperatures generally enhance surface area and stability, while lower temperatures promote functional groups that improve nutrient retention and metal immobilization. Feedstock composition also influences biochar’s chemical properties and adsorption capacity. By enhancing nutrient availability and improving soil structure, biochar offers significant potential for sustainable agriculture and environmental restoration. Optimizing its production is essential for maximizing benefits in carbon sequestration and pollutant stabilization. Heavy metal contamination in agricultural soils constitutes a significant threat to plant growth and food safety. Biochar has been identified as a potential soil amendment for mitigating heavy metal accumulation, though its efficiency varies depending on soil properties, biochar type, and plant species.
In the study (9), a meta-analysis of 74 peer-reviewed studies, encompassing 1,298 independent observations, was conducted to assess the impact of different soil conditions, biochar types, and contamination levels on plant uptake of cadmium (Cd), lead (Pb), copper (Cu), and zinc (Zn). The results demonstrated that biochar application substantially decreased the uptake of heavy metals by plants, with cadmium decreasing by 38%, lead by 39%, copper by 25%, and zinc by 17%. The effect was more pronounced in coarse-textured soils and those with high organic matter content. Among the different biochar types, manure-derived biochar exhibited the greatest ability to reduce heavy metal bioavailability. While the meta-analysis provides strong evidence that biochar has the potential to decrease the uptake of heavy metals in plants, the results cannot be generalized because of the heterogeneity of experimental designs (e.g., differences in soil attributes, feedstocks, and production conditions of biochar, contamination level, and plant species) among the 74 peer-reviewed studies analyzed.
Study (10) demonstrates that the use of traditional adsorption models to predict metal sorption onto biochar is often hindered by inaccuracies stemming from the complex mechanisms involved in adsorption. In contrast, machine learning (ML) techniques present a more dependable option by incorporating various factors, such as the characteristics of biochar, environmental conditions, and properties of heavy metals. In the study, Artificial Neural Network (ANN) and Random Forest (RF) models were trained on a dataset that included 353 adsorption experiments with six heavy metals: Pb, Cd, Ni, As, Cu, and Zn, along with 44 different biochar samples. The input parameters for the models were critical biochar properties, including pH, cation exchange capacity (CEC), surface area, and the concentration ratio of metals to biochar. The analysis revealed that the RF model (R² = 0.973) was superior to the ANN model (R² = 0.948) in predicting adsorption efficiency. CEC and pH emerged as the most significant factors, whereas surface area played a relatively minor role. Overall, these findings suggest that machine learning models hold the potential to greatly minimize the reliance on experimental adsorption tests by providing precise predictions.
Study (11) concluded that the ability of biochar to remove heavy metals is influenced by its physicochemical properties, which can differ based on the methods of production. Conventional trial-and-error techniques for optimizing biochar can be lengthy and ineffective. To improve this process, a hybrid machine learning model was created to forecast the adsorption capacity of biochar. The model combines factors such as biomass composition, pyrolysis conditions, and the characteristics of biochar to enhance the efficiency of metal removal. In laboratory experiments, nine types of biomass feedstocks were tested to confirm the model’s forecasts. The model achieved a high accuracy rate for predicting adsorption efficiency, with an R² value of 0.996. The experimental findings corroborated the model’s predictions, showing similar adsorption capacities. This study demonstrated the potential of machine learning in improving biochar production processes for environmental uses. Implementing improvements specific to biochar production, but used on one heavy metal only, would improve efficiency and accuracy.
In study (12), Machine learning has been utilized to predict the adsorption capabilities of biochar; however, many current models lack clarity, which complicates the understanding of how individual factors influence outcomes. This research involved training four machine learning models—Random Forest, XGBoost, Artificial Neural Network (ANN), and Support Vector Machine (SVM)—on a dataset that included 1,183 biochar samples and 1,518 cases of heavy metal adsorption. To enhance the interpretability of the models, an analysis of feature importance was conducted using SHAP (SHapley Additive exPlanation) values and partial dependence plots. XGBoost proved to be the most effective model, achieving an accuracy rate of 99%. The analysis revealed that key variables influencing adsorption included specific surface area, pH, and adsorption time. Overall, this study increases the transparency of machine learning applications, facilitating the optimization of biochar characteristics for heavy metal removal. Although high predictive accuracy was achieved, the complex nature of advanced machine learning algorithms remains a considerable barrier to wider adoption, as the mechanistic rationale connecting specific biochar properties to heavy metal adsorption may be hidden.
Heavy metal contamination in agricultural soils, specifically involving lead (Pb), cadmium (Cd), and chromium (Cr), presents significant risks to the environment and food safety. A laboratory study (13) assessed the impact of biochar, applied at various rates (ranging from 0% to 10%), on loamy sand soil that was artificially contaminated. After 30 days of incubation, maize (Zea mays) was planted and allowed to grow for an additional 30 days. The results showed that biochar enhanced soil conditions by increasing pH, organic matter, and nutrient availability. There were notable declines in the availability of Pb (28.68%) and Cd (85.14%), indicating effective immobilization. However, the availability of Cr increased, likely due to pH alterations that facilitated its conversion to a more toxic form (Cr (VI)). Maize biomass significantly improved in soils treated with 5% and 10% biochar, indicating better plant growth and reduced stress from heavy metals. While this study underscores the potential of biochar for stabilizing Pb and Cd, it cautions against its use in soils contaminated with Cr without appropriate pH management. Overall, the research reinforces biochar’s effectiveness in improving soil health and enhancing crop productivity.
The study (14) found that current machine learning (ML) models aimed at predicting heavy metal adsorption by biochar often face challenges with generalizability due to suboptimal feature selection. To enhance the accuracy of these models, the properties of biochar were converted into molar-based ratios. Therefore, a new feature, (H-O-2N)/C, was introduced to more effectively represent the efficiency of adsorption. The Gradient Boosting Regression (GBR) model achieved an impressive R² value of 0.997, surpassing other models in performance. This innovative approach to feature engineering not only boosted prediction accuracy but also improved interpretability. The model’s generalizability to different environmental conditions and biochar types was not explored, limiting the generalizability of the results.
The study (15) discussed how Cadmium (Cd) contamination in agricultural soils is a major threat to the environment and public health, disrupts plant growth, and accumulates in edible parts, resulting in human exposure through food consumption. Conventional remediation techniques are often expensive and not very effective, while biochar has emerged as a viable and sustainable alternative for lowering Cd mobility in soil and its uptake by plants. Research has investigated how biochar enhances soil characteristics and reduces Cd bioavailability by affecting soil pH, microbial communities, and nutrient dynamics. Important mechanisms identified include ion exchange, electrostatic interactions, and microbial activation. Additionally, the research looked at how biochar manages Cd transport within plants, focusing on its uptake by roots and movement through the xylem. The results indicated that biochar successfully immobilized Cd by raising soil pH and boosting cation exchange capacity. This significantly curtailed Cd absorption by plant roots, thereby reducing its movement to edible plant parts. These findings highlight biochar’s potential to mitigate Cd exposure through the food chain, reinforcing its importance in sustainable agriculture for producing safer crops. In conclusion, the reviewed studies highlight the potential of biochar for soil remediation and stabilization of heavy metals. Employing machine learning significantly enhances prediction accuracy, lessens experimental requirements, and improves the optimization of biochar properties for environmental applications. Although mechanisms were fully articulated, it remains necessary to comprehensively validate real-world evidence under multiple field conditions of use to demonstrate the efficacy of biochar-based remediation strategies and their further scalability.
This paper (16) involves a machine learning approach to predict and improve the adsorption capacity of biochar for heavy metal removal. Datasets from 476 instances were collected, and seven classical ensemble models were created to predict adsorption efficiency. Ensemble models include Random Forests, where the final prediction is obtained by taking the average of all decision trees, Gradient Boosting Machines correct errors made by previous predictions to optimize performance, and AdaBoost, which improves accuracy. The final stack model combines the inputs from seven ensemble models to make final predictions. The results showed increased predictive accuracy through ensemble learning, but model stacking required a lot of computation, which could limit its applicability to large data sets or real-time applications.
Study (17) analysed 1012 adsorption experiments and used six machine learning models to predict the adsorption efficiency of lead on biochar. Several input parameters are considered, such as biochar type, pyrolysis temperature, production conditions, and adsorption properties. Six machine learning models used include Random Forest Regression, Gradient Boosting Regression (strong predictive performance), Support Vector Regression for kernel-based learning and to identify non-linear relationships, Kernel Ridge Regression to handle multicollinearity and manage between bias and variance, Extreme Gradient Boosting for prediction accuracy, and Light Gradient Boosting Machine for faster training of models. Performance was calculated using Mean Squared Error, Root Mean Squared Error, Mean Absolute Error, and R2 score. Extreme Gradient Boosting and Light Gradient Boosting Machine models performed best. For lead (Pb2+) adsorption, it was concluded that pyrolysis temperature and surface area were crucial factors. Fluidized bed biochar shows more adsorption capacity. Thus, this study helps to design better biochar materials. In conclusion, while the models performed well with respect to predicting lead adsorption, their application to other heavy metals was not assessed, reducing the extent to which the findings can be generalized across other contamination situations.
According to a study (18), biochar production reached almost 3,50,000 metric tons in 2023. Biochar is produced by pyrolysis (a thermochemical process that decomposes biomass under high temperatures and limited oxygen to generate biochar along with other products). This paper analyses the amount of NOx emissions produced to optimize the process and comply with environmental regulations. The results would help in climate change control and maintaining a sustainable environment. The study uses a Random Forest Regressor to predict the target value (NOx emissions) using input parameters: mass flow, moisture content, temperature, valve positions, ventilator adjustments, and oxygen flow control. The input data is collected from sensors, and then the data is normalized, and the model is trained. A five-fold cross-validation (CV) was executed to identify the optimal set of hyperparameters. The hyperparameter tuning focused on the mean squared error, exploring combinations of several estimators and minimum sample splits. The final model was then stored for subsequent deployment to the IoT device. The Random Forest Regressor was optimized under the constraint that predicted O2 concentrations remained within the range 0-10% and CO2 concentrations within 0-20%. All constraints can be set by the user to obtain an optimization based on their needs. The transferability of the model to other biochar systems remains uncertain, as differences in the setup and input conditions may lead to a change in prediction accuracy. Additional validation is required for larger-scale use. Immobilization means reducing the impact of heavy metals. Biochar can help bind heavy metals and make them less toxic. In study (19), machine learning models are built to find what biochar amendments could be added for soil remediation. Various input parameters like surface area, pH, organic matter content, and concentration of heavy metals are taken into consideration. The output is the immobilization efficiency, which is the percentage reduction in HM bioavailability after biochar application. Random Forest algorithms, Support Vector Regression, and Artificial Neural Networks have been used. SHAP (SHapley Additive exPlanation), Pearson Correlation Coefficient (PCC), and Hierarchical Clustering were used for feature selection. In conclusion, higher N content biochar enhances adsorption due to functional groups that interact with heavy metals. Higher biochar application rates lead to better HM immobilization through pH increase, ion exchange, and formation of stable precipitates. Functional groups in biochar, like carboxyl, hydroxyl, and phenolic, play a key role in immobilization. In conclusion, although the results were encouraging, there was a lack of long-term field data to validate model performance and the accuracy of immobilization predictions in real field conditions.
Biochar is widely recognised for its effective sorption properties and is used as a catalyst in the production of biodiesel and syngas cleaning. Biochar has a high surface area, pore size/volume, and surface chemistry, and is cost-effective. In study (20), single and multicomponent sorption experiments on two types of biochar: bagasse and wheat straw, were performed. Physical and chemical properties of the samples were examined using elemental analysis, Fourier-transform infrared spectroscopy (FTIR), scanning electron microscopy (SEM), and Brunauer-Emmett-Teller (BET) surface area analysis. The lab facility investigated the kinetics of both pure and mixed gas adsorption on biochar. Biochar samples were collected and processed at various pyrolysis temperatures, washed with deionized water, oven-dried, and ready for the adsorption kinetics test. Sorption mechanisms are influenced by elemental composition, morphology, surface area, pore volume, and functional groups. The paper uses environmental chemistry and adsorption kinetics to analyze biochar efficiency. Sorption Isotherms like Langmuir Isotherm, Freundlich Isotherms, adsorption kinetics, pore structure, surface area analysis, and Fourier Transform for functional group analysis are used. Though machine learning algorithms were not used much, mathematics and chemistry were used to get valuable insights. The Bagasse biochar had the greatest ability to adsorb both single and mixed gases, as it had a larger specific surface area and pore volume. Biochar had the highest tendency to adsorb acetone.
This paper (21) uses supervised machine learning techniques to predict fuel properties of biochar. Data from 64 published articles have been used to train the model. Support Vector Regression scored better than Random Forest models by achieving higher R2 values. Interpretative tools like Kernel SHAP (SHapley Additive exPlanation) have been used to predict biochar properties using input parameters. The analysis found that both the process temperature and carbon composition of the feedstock were important features that influenced the fuel properties of hydrochar and pyrochar. Nitrogen and hydrogen contents were necessary for hydrochar and pyrochar, respectively. This study helps in understanding properties like heavy metal adsorption by biochar. However, this research is limited by the smaller size of the dataset, potentially compromising the generalizability and robustness of the machine learning predictions.
This study (22) focuses on predicting ammonia nitrogen adsorption capacity using Machine learning. It uses 12 models for evaluation, which include kernel-based methods, tree-based models, deep learning models, Bayesian optimization, cross-validation for model tuning, gradient boosting algorithms, and achieved an R2 score of 0.9329 and an RMSE score of 0.5378. The study found that biochar’s adsorption capacity depends on experimental conditions and its chemical properties. Optimal removal of ammonia was achieved in an initial concentration of above 50 mg/L and pH between 6 and 9. A Python GUI incorporating the CatBoost model, a gradient boosting algorithm, was developed to enable users to predict efficiency in removing ammonia based on properties of biochar and environmental conditions. The stability and dependability of model predictions, however, could be impacted by environmental variability, particularly in situations that are not reflected in the training data.
Machine learning optimization to enhance biochar production has been used in a study (23). Data collected includes biomass feedback, pyrolysis conditions, and biochar properties. Machine learning models like Random Forest, Multiple Linear Regression, Decision Tree, Adaboost Regressor, and Bagging Regressor were trained on pyrolysis tests and used to predict biochar yield. Training features include feedstock type, temperature, heating rate, and residence time. The output is to understand relationships between production conditions and the characteristics of biochar, identifying parameters needed for sustainable production and usage of biochar. Although the study improved knowledge of the relationships between processes and properties, it lacked external validation to verify model performance across different production settings or independent datasets.
The author in study (24) reviews how various ML algorithms like SVM, decision trees, and ANNs can be used to predict adsorption capacities, properties of biochar, and their impact on the environment. It can also be used to optimize production parameters and estimate CO2 capture potential. ANNs can predict biochar surface area, adsorption capacities. SVMs help to categorize biochar by feedstock and performance. Decision trees assist in finding feature importance. KNNs can be used for small datasets and predict using previous data. The input parameters include feedstock type, chemical composition, and pyrolysis conditions (25). The authors also discuss the challenges in finding proper datasets, cross-domain integration. The author also highlights the need for Graphical User Interfaces to make machine learning models accessible to users without much technical knowledge. The research concludes, highlighting the importance of machine learning in optimizing the use of biochar in a sustainable manner without harming the environment.
A growing interest in using biochar for environmental remediation is evident in the body of literature, especially in the fields of pollutant adsorption, heavy metal immobilization, and soil enhancement. The effectiveness of biochar in a variety of applications has been demonstrated by numerous studies; however, issues with performance variability resulting from feedstock types, pyrolysis conditions, and changing physicochemical properties still exist. Moreover, experimental methods are frequently time-consuming, have limited scalability, and are susceptible to operational and regional variability, even though they provide insights into adsorption behavior and environmental impact. A related trend is the use of machine learning (ML) to improve prediction accuracy, lessen the need for experimental trials, and model the properties of biochar under various circumstances. Numerous machine learning models, ranging from Random Forest to Gradient Boosting and Neural Networks, have been used to forecast the adsorption capacity, heavy metal content, and environmental behavior of biochar. The evaluation of several safety indicators, such as VOC emissions, heavy metal leaching, and composition safety, is not always unified into a single framework in these implementations, which frequently concentrate on single-objective outputs like yield prediction or adsorption potential. Furthermore, many studies are still limited by dataset size, generalizability problems, or lack of interpretability, even though some have used real-world datasets and experimentally validated model predictions. A more integrated and automated approach is required due to the difficulty of forecasting the environmental impact of biochar, especially in dynamic conditions and long-term applications. These gaps point to the need for a more comprehensive strategy that can effectively and precisely assess a variety of biochar risk factors. The shortcomings of existing approaches might be addressed by a sophisticated, real-time framework that combines time series modeling, regression, and classification. This approach aligns well with the current trends in automation, AI integration, and environmental monitoring, and it has the potential to optimize the safe and sustainable deployment of biochar in industrial, ecological, and agricultural settings while streamlining the assessment process.
3 Methodology
3.1 A classification model to check the safety of biochar based on its compounds
This section outlines the methodology employed to build a classification model for measuring the environmental safety of biochar as per its chemical composition. The proposed biochar safety assessment framework uses a machine learning paradigm that takes advantage of improved feature engineering and conservative thresholding to reduce false positive predictions. The approach is illustrated in Figure 1, which provides a holistic representation of the system architecture, including data preprocessing, feature engineering, training models targeting safety-driven optimization, and robust categorization for safety classifications using conservative thresholds. The proposed approach fills important gaps in existing methods for biochar safety assessment that historically used safety limits based on properties, and the paradigm is shifted to a machine learning framework that incorporates domain knowledge via safety boundary feature engineering with sophisticated ensemble learning, achieving increased safety performance relevant especially to applications with an emphasis on minimizing false positives.
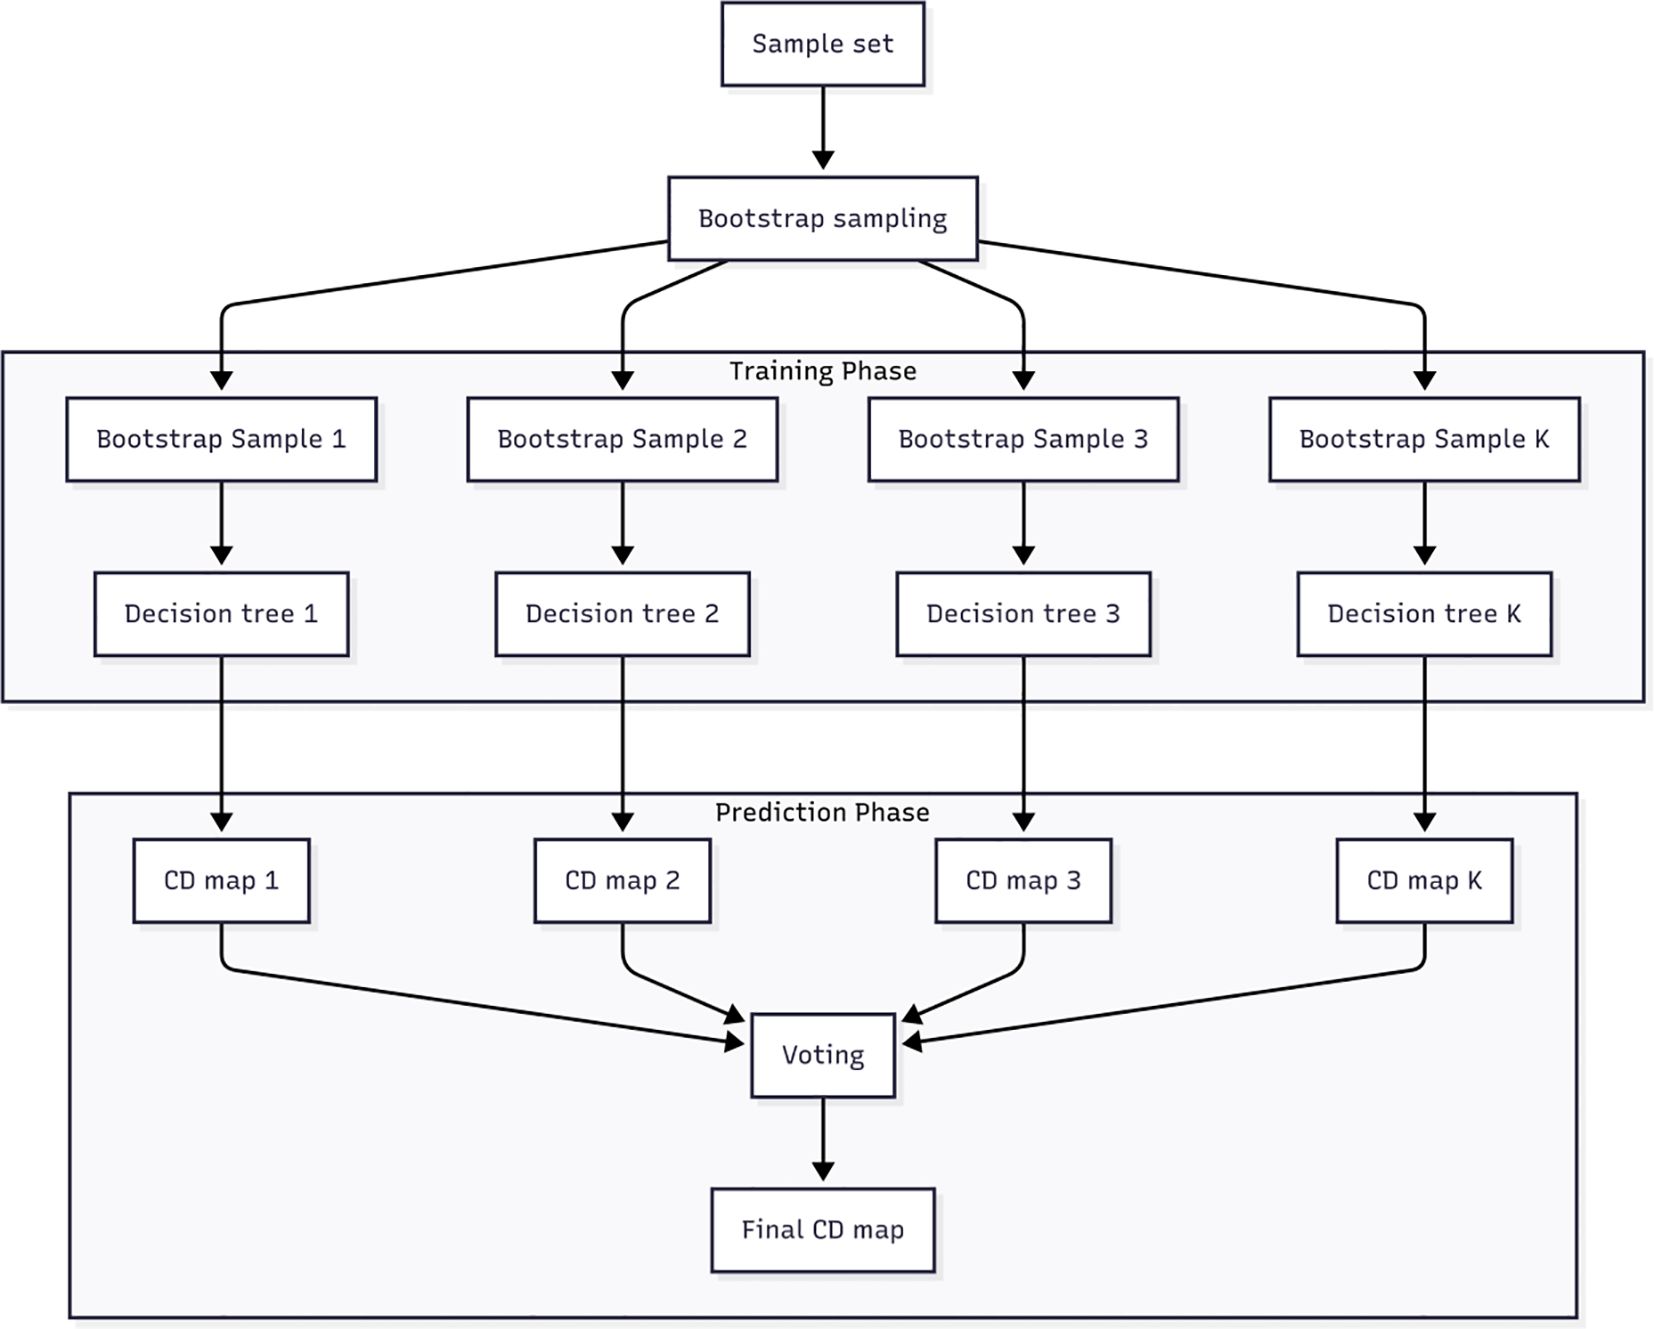
Figure 1. Block diagram of the Random Forest algorithm showing decision tree construction through bootstrap sampling and final prediction with majority voting.
3.1.1 Dataset description and preprocessing
3.1.1.1 Training dataset characteristics
The main training dataset, Biochar Properties.csv, was sourced from the U.S. government’s open data repository, Data.gov (30). The dataset consists of 30 biochar samples with full physicochemical characterization across 37 variables. The dataset includes different feedstock origins, including agricultural residues (wheat straw, barley plants), wood types (conifer wood, juniper, grape wood), and animal manures (poultry litter). Production methods vary within gasification, pyrolysis, flame-cap pyrolysis, and temperatures ranging from 350°C to greater than 1250°C, providing appropriate representations of conditions found in biochar production on commercial scales.
3.1.1.2 External validation dataset
The validation dataset, BiocharDS_V1.0, as referenced in (31), comes from the research work by Gao et al. (1) and is a global compilation of 367 peer-reviewed studies from 37 different countries. It contains 2,438 data points from 891 separate experiments that address greenhouse gas emissions, soil characteristics, and crop yield. This dataset offers strong cross-feedstock and cross-geographic validation capabilities, allowing for a thorough evaluation of the model’s generalizability in a range of production and application scenarios.
3.1.1.3 Preprocessing steps
Data preprocessing was performed systematically to impute missing values using median-based strategies implemented in scikit-learn’s SimpleImputer with strategy=“median”. The training dataset had a total of 47 missing values. We observed that we imputed median values, which are less sensitive to outliers that were likely found in biochar property measurements. Feature scaling was not performed because Random Forest is robust to different feature scales, and we wanted to keep interpretability in the original.
3.1.1.4 Feature selection and imputation
Twelve essential safety-related characteristics that were directly connected to accepted biochar safety standards were identified at the start of the feature selection process. These key characteristics included exchangeable minerals (Ext.Ca, Ext.K, Ext.Mg, Ext.Na, Ext.S in mg/kg), carbon fractions, including inorganic carbon (Inorg.C), elemental composition parameters (C, H, N, and S expressed as percentage dry basis), and critical physical properties (ash content as percentage and pH). The selection criteria gave priority to features that were directly related to safety standards for biochar, available in both training and validation datasets, proven to be significant in agricultural and environmental applications, and measurable using conventional analytical techniques.
Missing values were handled by a SimpleImputer using a median method, helping ensure data completeness (this was an important procedure to make sure that we maintained the integrity and robustness of the dataset for subsequent analysis). The original feature vector x = [C, H, N, S, Ash, pH,…] is returned to a new feature space as defined in Equations 1-3.
Safety boundary features:
Derived ratios:
Risk indicators:
where prevents division by zero.
3.1.1.5 Conservative threshold optimization
The decision function uses a conservative threshold, , to minimise false positives, as defined in Equation 4:
where is the predicted probability of being safe.
3.1.1.6 Class weight optimization
To balance class imbalance and reduce false positives more aggressively, a method of dynamic class weights is calculated as defined in Equations 5 and 6:
where n is the total samples, and are the number of unsafe and safe samples, respectively, and α = 2.0 is penalizing a false positive.
3.1.2 System architecture and implementation
3.1.2.1 Model architecture design
The Random Forest Classifier was chosen as the main algorithm because of its strong performance in managing non-linear relationships between safety outcomes and biochar properties, its ability to interpret feature importance, its resilience to outliers that are frequently found in biochar datasets and its capacity to offer uncertainty analysis and interpretable results, both of which are more pertinent for applications involving safety. Because of its ensemble approach, which maintains interpretability through feature importance rankings while offering prediction stability, the algorithm is especially well-suited for safety-critical applications where it is crucial to comprehend feature contributions.
The model architecture was optimised with certain hyperparameters, such as 100 estimators to balance prediction stability and computational efficiency, no maximum depth restriction to prevent overfitting while capturing important feature interactions, minimum samples per split of 2 and minimum samples per leaf of 1 to ensure robust node creation, and utilizing max_features=‘auto’, the default maximum features setting to add randomness and enhance generalisation.
To address the urgent need for a decrease in false positives in the safety evaluation of biochar, class weight optimisation was put into place. Based on the sample distribution, dynamic class weights were determined. A false positive penalty factor of 2.0 means that misclassifying unsafe biochar as safe carries twice the penalty of the reverse error. This method is in line with the practical reality that misclassifying hazardous biochar as safe is more dangerous than being unduly cautious. Both class imbalance and the asymmetric cost of classification errors are taken into consideration in the class weight formulation.
3.1.2.2 Hyperparameter configuration
The Random Forest implementation used optimal hyperparameters such as n_estimators=100 for balance and efficiency, max_depth=None to limit the algorithm from overfitting, min_samples_split=2 and min_samples_leaf=1 to capture statistical significance when dividing leaf nodes, a max_features = ‘auto’ (default) for adding randomness, and custom class_weights to apply the penalty for false positives for an imbalanced training set. During training, out-of-bag scoring was activated for internal validation, and consistent outcomes across model runs were guaranteed by a fixed random state of 42.
3.1.2.3 Training and validation protocol
The training protocol uses stratified data splitting using an 80% training and 20% internal validation split, keeping class distributions maintained across splits. The external validation was undertaken from completely independent datasets employing the same preprocessing pipeline to further prevent any data leakage. The conservative threshold τ_c = 0.7 was established using the precision-recall curves to best minimize false positives while maintaining an acceptable level of recall.
3.1.2.4 Safety classification labeling
A binary safety label was assigned to each biochar sample according to pre-determined chemical thresholds defined by international standards and industry. Samples were classified as “Safe Biochar” (label = 1) if they met the criteria: Carbon (C) ≥ 50%, ash < 30%, pH between 6 to 10, and Sulfur (S) < 2%. The limits on carbon and ash are recognized by the European Biochar Certificate (EBC) and the International Biochar Initiative (IBI) as standards for healthy and safe quality to ensure a quality product for the removal of pollutants and safety for the environment, as defined by (26) (27),, and (28). The pH range and sulfur limit were aligned with the generally accepted procedures for safe and effective use of biochar.
3.1.2.5 Mathematical model formulation
The classification problem of biochar safety is treated as a binary classification problem, where each biochar sample is assigned a safety label y ∈ {0, 1}, where 0 represents an unsafe type of biochar and 1 represents a safe type of biochar. The safety criteria are defined mathematically as defined in Equation 7:
where is the indicator function returning 1 for true and 0 for false.
3.1.2.6 Performance evaluation
Comprehensive metrics that addressed both standard classification accuracy and safety-specific requirements were used in the performance evaluation. The main metrics were recall, which measured true positives in relation to all actual positive cases, precision, which quantified true positives in relation to all positive predictions (essential for reducing false positives), overall accuracy, which measured correct predictions across all samples, and F1-score, which provided the harmonic mean of precision and recall. Safety-specific assessments that concentrated on false positive analysis were added to these common metrics.
A key element of performance evaluation was false positive analysis, where absolute false positive counts gave a direct assessment of unsafe biochar that was mistakenly labelled as safe. The improvement from standard to conservative threshold approaches was used to calculate the false positive reduction percentage, indicating the efficacy of the conservative approach. The improvement in positive prediction reliability was particularly highlighted by precision improvement metrics, which is important for safety applications where a high level of confidence in “safe” classifications is critical.
In order to assess the robustness of the model across various datasets, generalisation assessment compared the performance of internal validation with the outcomes of external validation. Instead of using k-fold CV to evaluate model robustness, uncertainty analysis and external dataset validation were used to make sure that borderline predictions were flagged conservatively. The distribution of prediction probabilities was analysed using uncertainty analysis, which revealed samples with probabilities ranging from 0.4 to 0.8 that needed more investigation in real-world settings.
The entire pipeline implementation, from data preprocessing to the final model deployment, is shown in Figure 2.

Figure 2. Overview of the ML pipeline for biochar safety analysis.
3.1.3 Visualization
The complete visualizations included performance comparison charts with internal and external validation metrics using the standard and conservative thresholds. The bar charts clearly showed improvements in both accuracy and precision, which demonstrated the value of the false positive reduction strategy directly. The false positive comparison charts supplied convincing evidence of improvements in safety, evidenced by a reduction in the potentially unsafe-to-safe misclassifications from multiple instances to zero when using a conservative threshold.Probabilistic distribution histograms clearly showed the separation between safe and unsafe biochar samples, indicated by decision thresholds at 0.5 and 0.7. This provided viewers not only information about model confidence, but also the impact that conservative thresholds have on borderline cases. With the confusion matrix for this conservative threshold, it was clear that it completely removed false positives, so no unsafe biochar sample was classified as safe.The feature importance plots showed the most significant variables, with pH-based features, inorganic carbon, and exchangeable also listed in the prominent position in each case. It resulted in the validation of the utility of the enhancement feature engineering safety boundaries to formulate a robust classification.
3.1.4 Ethical considerations
The biochar safety assessment model was conducted with the explicit consideration of all potential implications (both environmental and agricultural) of its misclassification types. The conservative threshold-based method prioritizes public safety and aims to achieve the lowest false positive rate since a stakeholder could wrongly classify the biochar as safe; the public will determine there is correspondingly greater risk to society than if stakeholders take a conservative application approach. The reason why this is ethical is that it reflects the precautionary principle in an environmental monitoring and assessment approach. There is an urgency to minimize potential harm to society from wrong decisional outcomes; this is the objective of the toxicologist.
There is a commitment to transparency in the model development process, which is evidenced in the documentation of the rationale for feature selection, the establishment of the safety criteria, and the development of the performance evaluation methods. The openness in every attempt to describe methods enables peer review and reproducibility, as well as useful and responsible deployment of machine learning in safety-critical applications. Reported feature importance supports the direct use of explainable AI (XAI) capabilities, which enables domain experts to understand and validate the model decisions as opposed to being satisfied with black-box predictions.
Data privacy, except where expressly stated, when it can be identified, biochar production (and where it is not a superfluous barrier to our research), and intellectual property concerns related to documenting all biochar samples as prescribed but anonymized where necessary, were addressed whilst retaining scientific defensibility through recording as enough feedstock and production method data as possible and descriptive. The validation dataset was global, and there is no regional or biogeographic bias (or any bias associated when working with biochar-based systems). This guarantees all engaged parties are socially responsible by application of data interpretation in various agricultural representations in associative practices (e.g., risk assessment).
3.1.5 Conclusion
The safety boundary feature engineering approach and conservative threshold implementation provide a dependable framework for safety-critical biochar assessment, supporting informed decision-making for producers, regulators, and agricultural stakeholders in biochar applications. The developed machine learning model successfully established a robust biochar safety classification system through innovative feature engineering and conservative threshold optimisation, achieving 96.7% external validation accuracy with complete false positive elimination and demonstrating excellent generalisation across diverse biochar samples from global datasets.
3.2 Predicting adsorption efficiency of biochar using random forest regression
3.2.1 Data collection and preprocessing
The dataset used in this study was derived from Zhu et al. (2019) in their research titled “The application of machine learning methods for prediction of metal sorption onto biochars.” Their dataset encompassed 353 adsorption experiments involving six heavy metals (Pb, Cd, Ni, As, Cu, Zn) across 44 different biochars produced from various lignocellulosic biomass sources under pyrolysis conditions ranging from 300°C to 700°C. This diversity in experimental conditions and feedstocks ensured a comprehensive representation of biochar characteristics.
Four sections were created from the consideration of fifteen contributing factors: (i) properties of the biochar, such as its pH in water (pHH2O), surface area (SA, m2/g), cation exchange capacity (CEC, cmol(+)/kg), ash content (ash, %), particle size (PS, mm), mass percentage of total carbon in the biochar (C, %), molar ratio of nitrogen and oxygen to carbon [(O+N)/C], molar ratio of oxygen to carbon (O/C), and molar ratio of hydrogen to carbon (H/C); (ii) adsorption conditions, such as solution pH (pHsol) and adsorption temperature (T, oC); (iii) initial concentration ratio of heavy metals to biochars (C0, mmol/g); and (iv) properties of the heavy metals, such as charge number, ion radius (r, nm), and electronegativity (χ).
For this study, the dataset was structured into two Excel sheets: “Biochar_adsorption” and “metadata.” The “Biochar_adsorption” sheet captured the experimental adsorption outcomes, while the “metadata” sheet included detailed physicochemical properties of the biochar samples. These sheets were selected as they comprehensively covered both the experimental results and biochar properties necessary for accurate modeling (Figure 3).
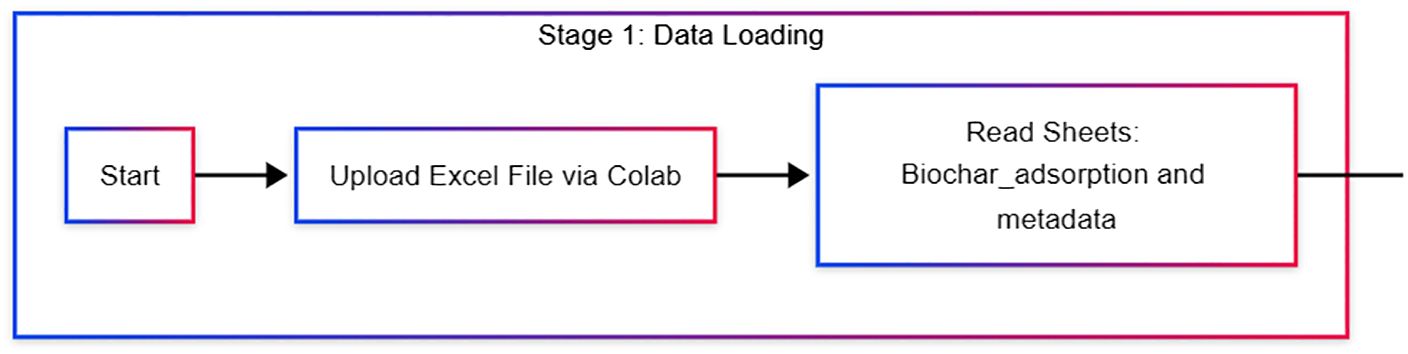
Figure 3. Initial loading of the excel dataset into colab, including reading sheets for analysis.
Multi-entry columns like ‘Metal type’ were split and normalized to ensure each row represented a unique adsorption case (Figure 4), thereby simplifying the dataset structure and avoiding ambiguity. Numeric columns were converted to appropriate data types to enable seamless numerical computations. Categorical variables (“Biomass feedstock” and “Metal type”) were encoded using label encoding. (Figure 5) Label encoding was preferred over one-hot encoding to maintain computational efficiency and avoid the dimensionality explosion, given the moderate number of categories. Missing values were removed to maintain data integrity, ensuring the machine learning model was not biased or skewed due to incomplete records. Independent(features) and dependent(targeted) variables were identified and split into an 80/20 ratio for training and testing of the model (Figure 6).
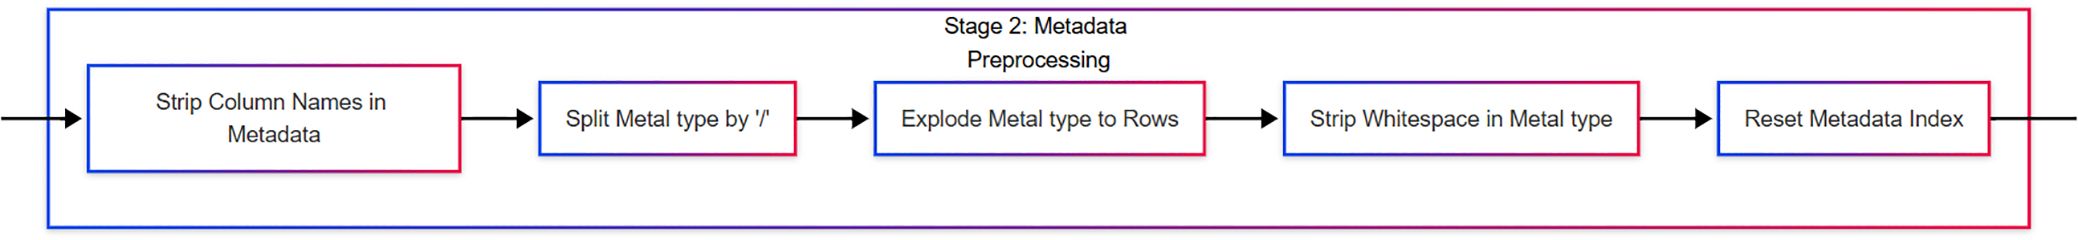
Figure 4. Cleansing and restructuring the metadata, including handling of compound metal types and formatting inconsistencies.
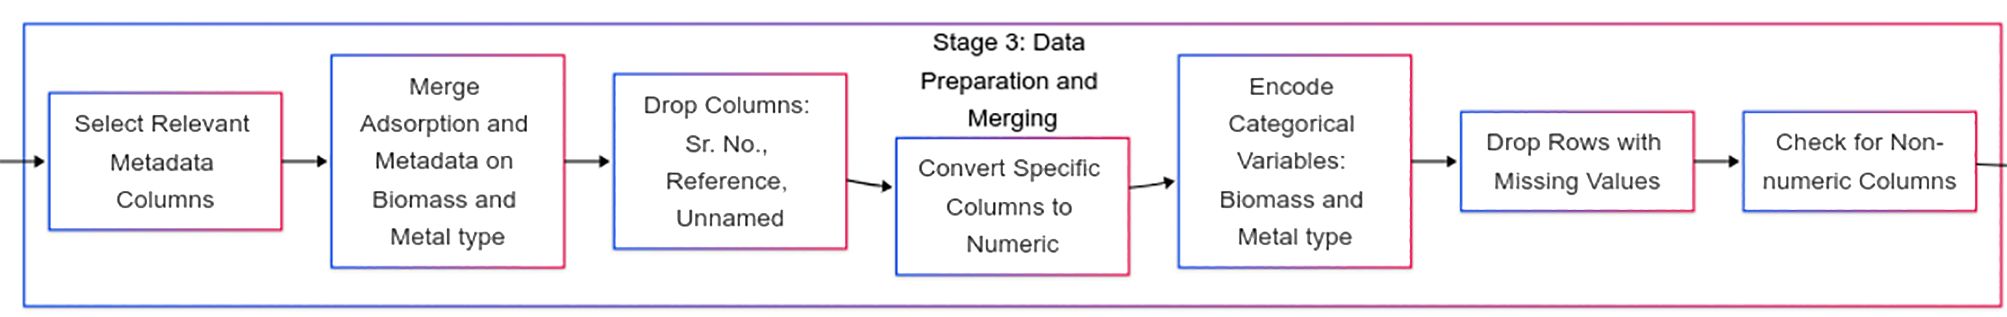
Figure 5. Merging cleaned metadata with adsorption data, handling missing values, encoding categorical variables, and ensuring data consistency.
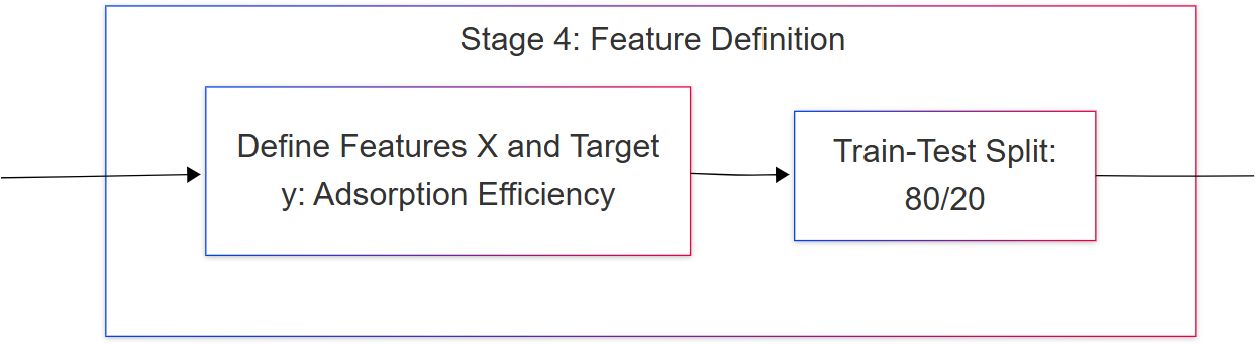
Figure 6. Identifying independent variables (features) and target variable for model training, followed by a standard train-test split.
3.2.2 Model training
The Random Forest Regression model (Figure 7) was employed to predict the adsorption efficiency of biochar for various heavy metals, based on physicochemical and processing parameters. Random Forest is an ensemble-based algorithm that builds multiple decision trees during the training phase and produces the average prediction from these individual trees to enhance predictive accuracy and reduce overfitting.
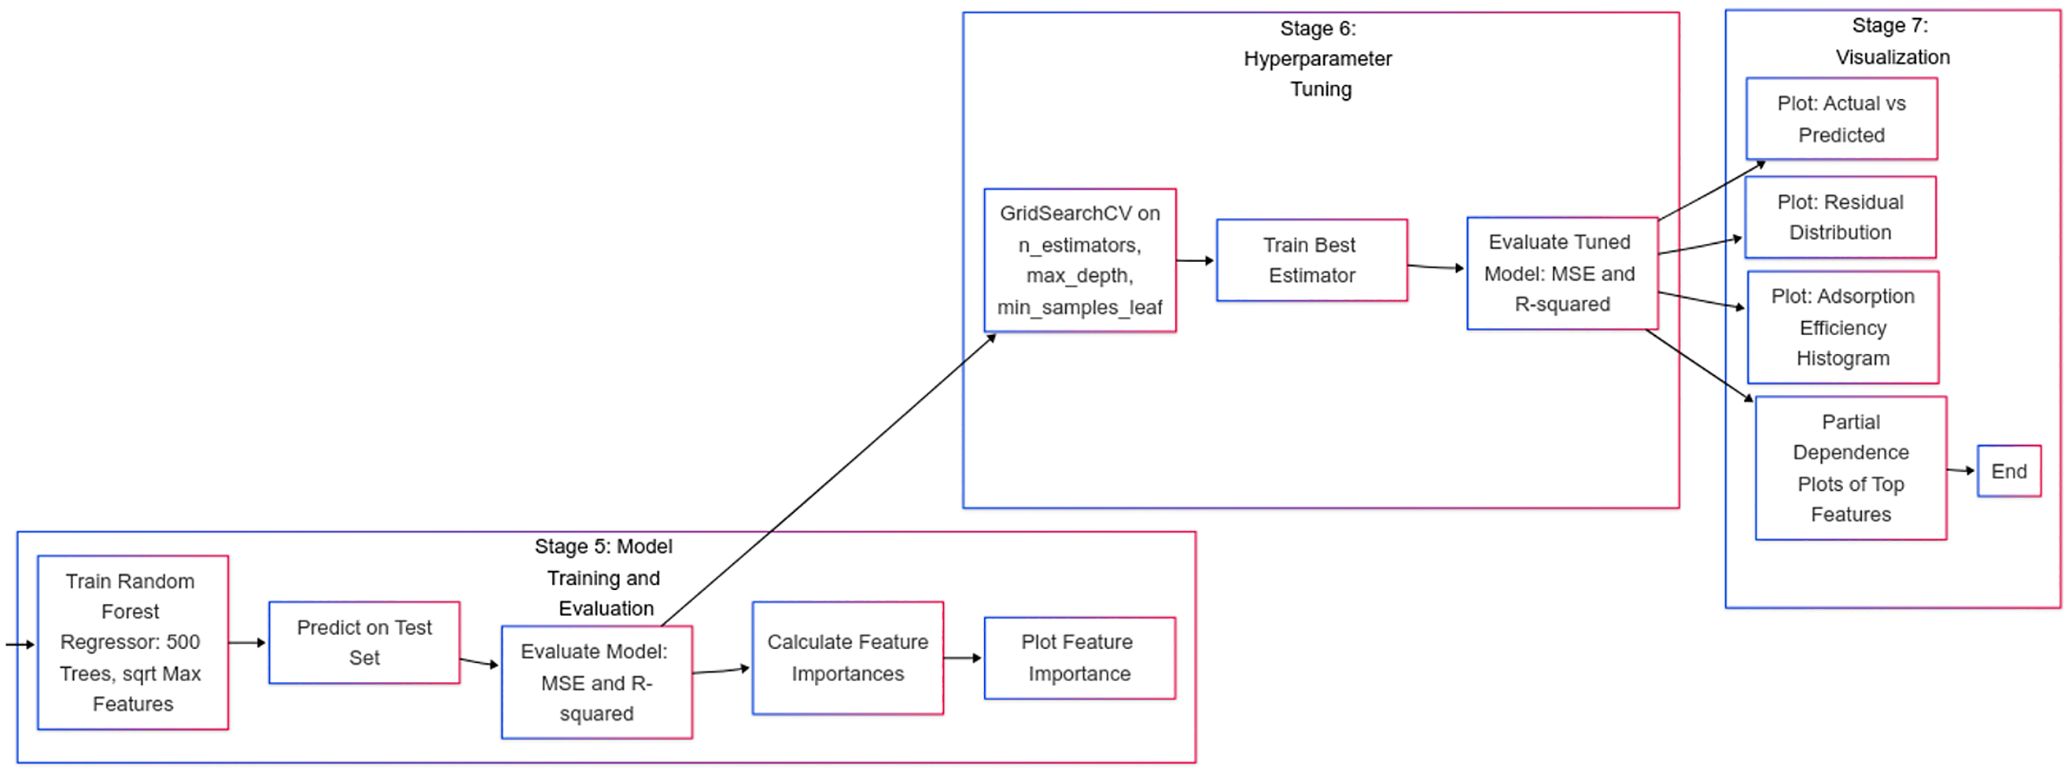
Figure 7. Training a random forest model, making predictions, and evaluating initial performance using metrics such as MSE and R-squared. Optimizing model performance using GridSearchCV and evaluating the tuned estimator for improved accuracy. Visualizing model results through residual analysis, prediction accuracy, and feature influence to interpret model behavior.
The working of the Random Forest model, pictorially, is best explained by Figure 1.
Let the training dataset be (Equation 8):
where represents the feature vector and the corresponding target value.
A Random Forest Regressor creates decision trees. For each tree , a bootstrap sample is drawn with replacement from . At each node split, a random subset of features is chosen to determine the best split. Each tree is grown fully or to a specified maximum depth without pruning.
The final prediction for an unseen input is given by (Equation 9):
where is the prediction from the -th decision tree.
The performance of the model is assessed using the following metrics:
Mean Squared Error (MSE)(Equation 10):
Coefficient of Determination () (Equation 11):
where is the mean of the actual values.
To enhance model performance, hyperparameter tuning was performed using Grid Search with Cross-Validation (Grid Search CV). By training the model on various combinations of hyperparameter values, this method does an exhaustive search over a given parameter grid and evaluates them using -fold cross-validation.
Let represent the set of all possible hyperparameter combinations. For each , -fold cross-validation is performed as follows:
● Split the training data into disjoint subsets: For each fold , train the model on and validate on Compute the average validation score (Equation 12):
The optimal hyperparameter set is selected as (Equation 13):
In this study, GridSearchCV from scikit-learn was used with , and the scoring metric was the score. This allowed identification of the most effective hyperparameters, including the number of trees (n_estimators), maximum tree depth (max_depth), and minimum samples per leaf (min_samples_leaf), to enhance model performance on unseen data.
3.3 Time series model to predict potential VOC emissions from biochar under different environmental conditions, assessing the air quality impact
Another objective is to create a model to predict Volatile Organic Compound (VOC) emissions from biochar in various environmental conditions using time-series data. The dataset is collected from a publicly available research paper (29). The primary dataset (1b - Paper1exp1gas_metadata.csv) contains 1440 experimental observations, each representing a soil core under a specific treatment and measurement time. The dataset includes characterization across 29 variables, covers soil and biochar treatments, temporal factors, and environmental conditions such as the incubation temperature, water content, and porosity. Greenhouse gas data comprise fluxes of CO2, CH4, and N2O along with the initial gas concentrations. The dataset collectively provides an integrated view of the soil, biochar, and environment interactions driving greenhouse gas emissions.
The dataset originates from a controlled soil incubation study conducted in Lincolnshire, United Kingdom, in March 2011. Twenty soil cores (150-180 mm depth, ~1.6 kg dry soil each) were collected three weeks after planting and nitrogen fertilizer addition. The cores were subjected to a four-treatment factorial design (biochar amendment vs. no amendment; wetted vs. unwetted) under controlled temperature and storage conditions.
The data spans a 116-day incubation period with repeated gas flux and concentration measurements taken throughout. Key measurement points were aligned with four wetting events (days 17, 46, 67, and 116) in addition to baseline equilibration and continuous monitoring during incubation.
For making CO2 emission prediction model, only 5 variables were used from the dataset which include the following: ugCH4-Cfluxm2h1 represents CH4 gas flux in the units mg CH4-C flux per square metre soil per hour, ugN2O-Nfluxm2h1 represents N2O gas flux in the units mg N2O-N flux per square metre soil per hour, CO2ppmt0 represents CO2 ppm in the static chamber headspace at t0, CH4ppmt0 represents CH4 ppm in the static chamber headspace at t0, N2Oppmt0 represents N2O ppm in the static chamber headspace at t0. The target variable is mgCO2-Cm2h1, which represents CO2 gas flux (units mg CO2-C flux per square metre soil per hour).
The input features are experimental measurements of greenhouse gas fluxes and initial gas concentrations, which act as predictors, and the output target is the CO2 flux (mgCO2-Cm2h1), which needs to be predicted. The dataset provides high-resolution insights into biochar-soil interactions, particularly CO2 dynamics under moisture variation. The representativeness is, however, limited to a single site (Lincolnshire), one soil type, a specific biochar application rate (3% soil dry weight; ~22 t ha-¹), and controlled incubation conditions. Thus, the extrapolation to other soils, climates, cropping systems or biochar feedstocks should be made with caution.
The main objective is to find CO2 emissions, which are one of the major volatile organic compounds emitted from biochar, which, at high concentrations in the environment, can cause harm. The model predicts CO2 emissions (mgCO2-Cm2h1) using other gas fluxes (CH4, N2O) and initial concentrations. The emissions are predicted using a time series deep learning approach (as data consists of sequential dependencies), which learns from past observed values of fluxes and initial gas concentrations.
3.3.1 Data preprocessing
The dataset is loaded with correct encoding, missing values are removed and selected features are normalised using MinMaxScaler to scale values between 0 and 1 for converging better during training.
3.3.2 Using LSTM model
To input data into the LSTM Model (Long Short Term Memory model), the data is formatted into 3D, which includes samples, time steps, and features to fit the LSTM requirements. This allows the LSTM model to use each feature as a timestamp in a single observation, leading to more effective sequential processing power of the LSTM.
A 3-layer LSTM model with dropout regularization method is used to reduce overfitting, which involves.
LSTM(128) -> Dropout -> LSTM(64) -> Dropout -> LSTM(32) ->Dropout -> Dense(1).
LSTM (64) learns about long-term temporal dependencies, LSTM(32) adds depth and non-linearity, Dense(1) gives a scalar output, which is the target.
With a learning rate of 0.001, the model makes use of the Adam optimizer. It adapts the individual learning rates for each parameter helpful for handling real-world data. The model is trained for 100 epochs with a batch size of 4. The batch size helps the model to understand small nuances in a less variable dataset.
3.3.3 Testing and performance
Using the 80:20 rule, the data is trained and tested using the train_test_split function from Scikit-learn. The bidirectional LSTM model performance is evaluated by using Mean Absolute Percentage Error (MAPE) and R2 score. The output was to predict a single continuous target value. A good R2 score of 0.8992 shows a better fit, an MAPE accuracy score of 77.33% ensures almost reliable predictions, but better models can be found. Traditional LSTMs process time steps sequentially in a forward direction, but this may limit context awareness; thus, another model is created, which uses a bidirectional LSTM along with a dense layer,early stopping, ReduceLRonPlateau that will analyze both forward and backward dependencies effectively.
The new model is a bidirectional LSTM model to predict CO2 flux based on initial flux values of CH4 and N2O and their concentrations. Dropout rates of 0.3, 0.3, and 0.2 were applied over each LSTM layer. Dropout means to randomly disable neurons during the training phase to reduce the overfitting factor.
To increase prediction accuracy, the model was further fine-tuned. Encoding of non-numeric values was performed using ISO-8859-1 encoding. Missing values in the dataset were filled with mean values. The Z-score method was applied to remove outliers that could cause skewness while training the model. It also improves the generalization and convergence factor. To better understand the complex intricacies, more features from the dataset were included in model training (6 features compared to 2 features in the initial model). The model consists of 3 LSTM layers, and batch normalization is applied after each LSTM layer to stabilize the training, to improve convergence, and allow higher learning rates. Adding more layers creates a stacking effect, which helps learning hierarchical temporal characteristics using the model. Lower layers capture short-term interactions like relationships between flux and ppm concentration of gases, whereas deeper layers learn about the abstract and long-term dependencies, which include analyzing emission trends under various environmental conditions.
If no improvement was noted, 10 consecutive epochs of early stopping were introduced to halt training. The model uses a learning rate scheduler to lower the learning rate when the validation loss plateaus. To fine-tune the training phase, the learning rate was reduced from 10 to 5 stagnant epochs to ensure that the data converges better and escapes from local minima. It also gives more time for models to fine-tune deeply.
The new model, which is the optimized Bidirectional LSTM, also uses the Adam optimizer with a learning rate of 0.001. Training was done over 100 epochs with a batch size of 4, like the initial model. The model achieved 87.14% accuracy and R2 score of 0.9829, outperforming the previous model. A higher R2 score of 0.9829 shows a better fit, indicating the ability of the model to explain approximately 98% of the variance in CO2 flux data, symbolizing the excellent fit of the model for the time series predictions. Methane and Nitrous oxides were identified as key predictors. The MAPE accuracy score of 87.14% ensures more reliable predictions than the previous model. The second model has better generalization due to the inclusion of 6 features compared to 2 features in the previous model, the introduction of early stopping, and learning rate reduction.
3.3.4 Features found
Important features found include CH4 flux and N2O flux, whose interaction with CO2 flux is notable and must be considered while making predictions regarding the impact of VOCs on the environment. The initial CO2 baseline concentration also plays a strong role in determining its emission behaviour. These features affect how the VOC emissions from biochar affect the environment and its surroundings, helping in predicting in which locations they can be used safely without causing any additional harm. The feature importance insights can be further supported and verified using permute feature importance or SHAP (SHapley Additive exPlanation) analysis.
3.3.5 Reason for LSTM over other models
LSTM was chosen due to its special ability to model sequential dependencies and to retain long-term information in time series data. It captures past and future dependencies in VOC gas emissions, which help us predict future trends under various environmental conditions, making it easier to classify whether it would be beneficial to use it in the region or not.
3.3.6 Working of LSTM
LSTM (Long Short-Term Memory) is a type of RNN (Recurrent Neural Network) that learns temporal dependencies from time series data. It overcomes the problem of short-term memory in RNNs. It maintains long-term memory using cell gates and mechanisms for gating, namely the Input Gate, Forget Gate, and Output Gate. It is known for efficient handling of vanishing gradients than traditional RNNs. It is most suited for analysing and predicting from time series, sequential data. It remembers the important last-used data and discards the unimportant ones. The model learns this classification of important and unimportant data during its training from datasets. Long-term dependencies can be learned by LSTMs.
Like RNNs, LSTMs also contain chain-like topologies; however, the repeating module is structured differently. Having several neural network layers as opposed to only one, there are four that interact differently. For the VOC emissions dataset, it processes the sequential data of gas readings from the dataset and notes the patterns and time-dependent relationships that impact CO2 emissions. It also predicts the future CO2 flux based on the past fluxes and gas concentration data.
Each line in Figure 8 represents carrying a vector from the output node to the input node. Pointwise operators, neural network layers are also represented in the diagram. A merging line indicates concatenation, whereas a forking line represents content that is copied and relocated to several locations (25).
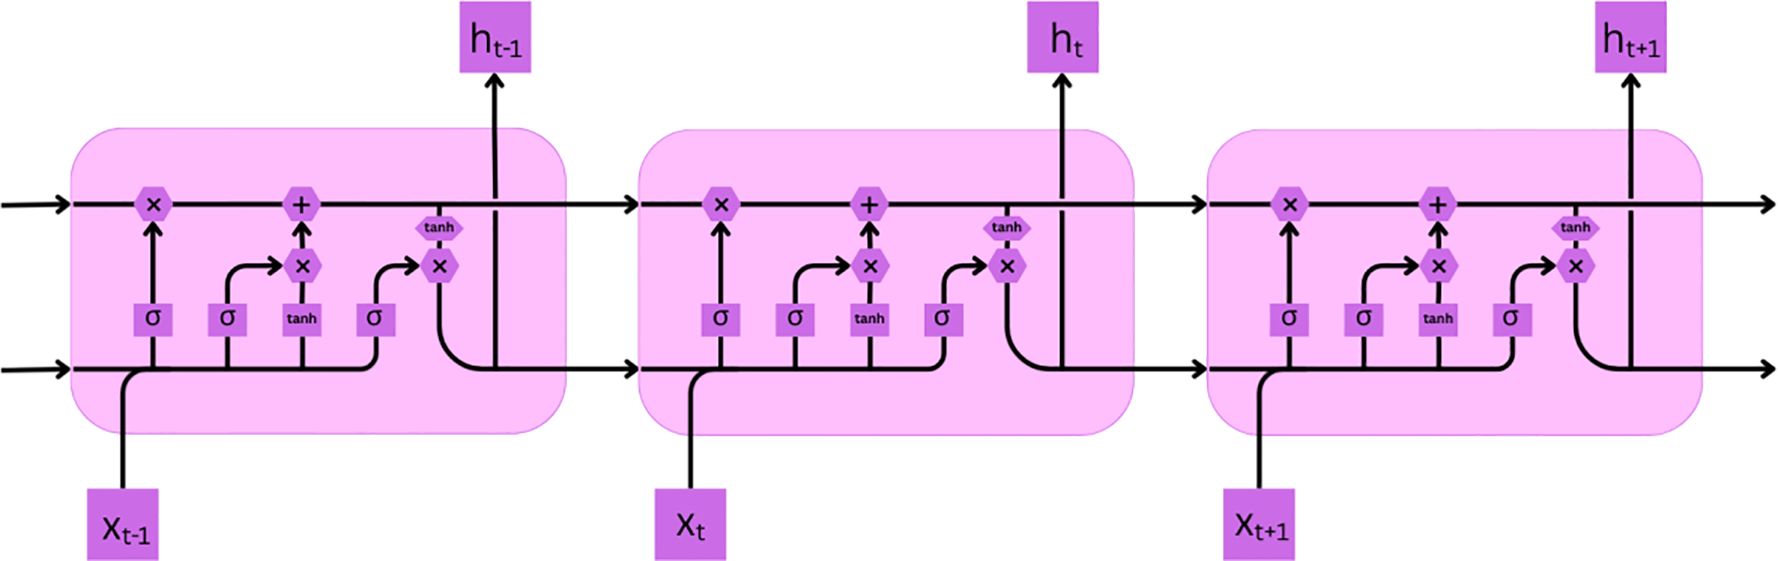
Figure 8. Interaction of four layers in the LSTM model (cell state, forget gate, input gate, output gate).
The first step in LSTM is to decide which step to discard. The sigmoid function makes the decision (forget gate layer) (Equation 14). Input is ht−1 and xt data, output lies between 0 and 1. One means to remember the data, whereas zero means to forget the data.
The next step (Equation 15) decides which new data to remember. The input gate layer uses a sigmoid layer to decide what data needs to be updated. Another vector Ct may be added to the state, which is created by a tanh layer (Equation 16).
The old cell value is then updated from Ct-1 to new cell Ct (Equation 17). The old state is multiplied with ft (to remove old state) then add an additional factor to scale by how much the user wanted to update the state values.
Final output is based on the current state of the cell (Equation 18). First is the sigmoid function, then (Equation 19) the cell state passes through tanh and is multiplied with the output of the sigmoid gate.
This is how LSTM works to forget the data that is not required and to remember the key data that may be needed in the future for analysis. The LSTM model is trained with the dataset to understand the importance of data which helps it learn important patterns and sequences of features from the time series data.
Traditional models like ARIMA, XGBoost, and Random Forest were less effective for time series analysis as they were unable to model linear and temporal dependencies and showed poor performance with incomplete and time series data.
LSTM overcomes these problems by leveraging memory gates to selectively retain relevant information, handle incomplete time sequences, and generalize effectively for various features across different environmental domains, thus providing solutions and analysis that can be used in real life.
The ethical considerations include ensuring environmental responsibility to ensuring that accurate models are used to assess the safety, suitability, and sustainability of biochar usage in agriculture. Features should be chosen carefully based on importance in real-world scenarios, which would help in solving actual problems in the agriculture domain. Certain limitations include using a small dataset, which may cause issues in generalization and may lead to overfitting. Using single steps may also affect accuracy. The usage of interpretation tools like SHAP can help in feature extraction.
The optimized model achieved an accurate score of 87.14% and an R2 score of 0.9829, outperforming its previous model. Key improvements include expanding the feature set from 2 to 6, removing outliers using the Z-outlier method, applying batch normalization, and regularization techniques. This model has strong potential to predict real-time VOC emissions from biochar and helps in proactive risk assessment for the environment by forecasting sustainable biochar utilization strategies. The model offers reduced validation loss and effective generalization.
4 Overall architecture of the model
A cumulative machine learning pipeline was developed in the research, integrating classification, regression, and time-series models. Standard procedures were used to preprocess input data such as chemical composition, adsorption capacity, and emissions measurements. A set of outputs from these models was used to analyze biochar stability, adsorption efficiency, and environmental effects. The integrated workflow of this whole pipeline is schematically represented in Figure 9.
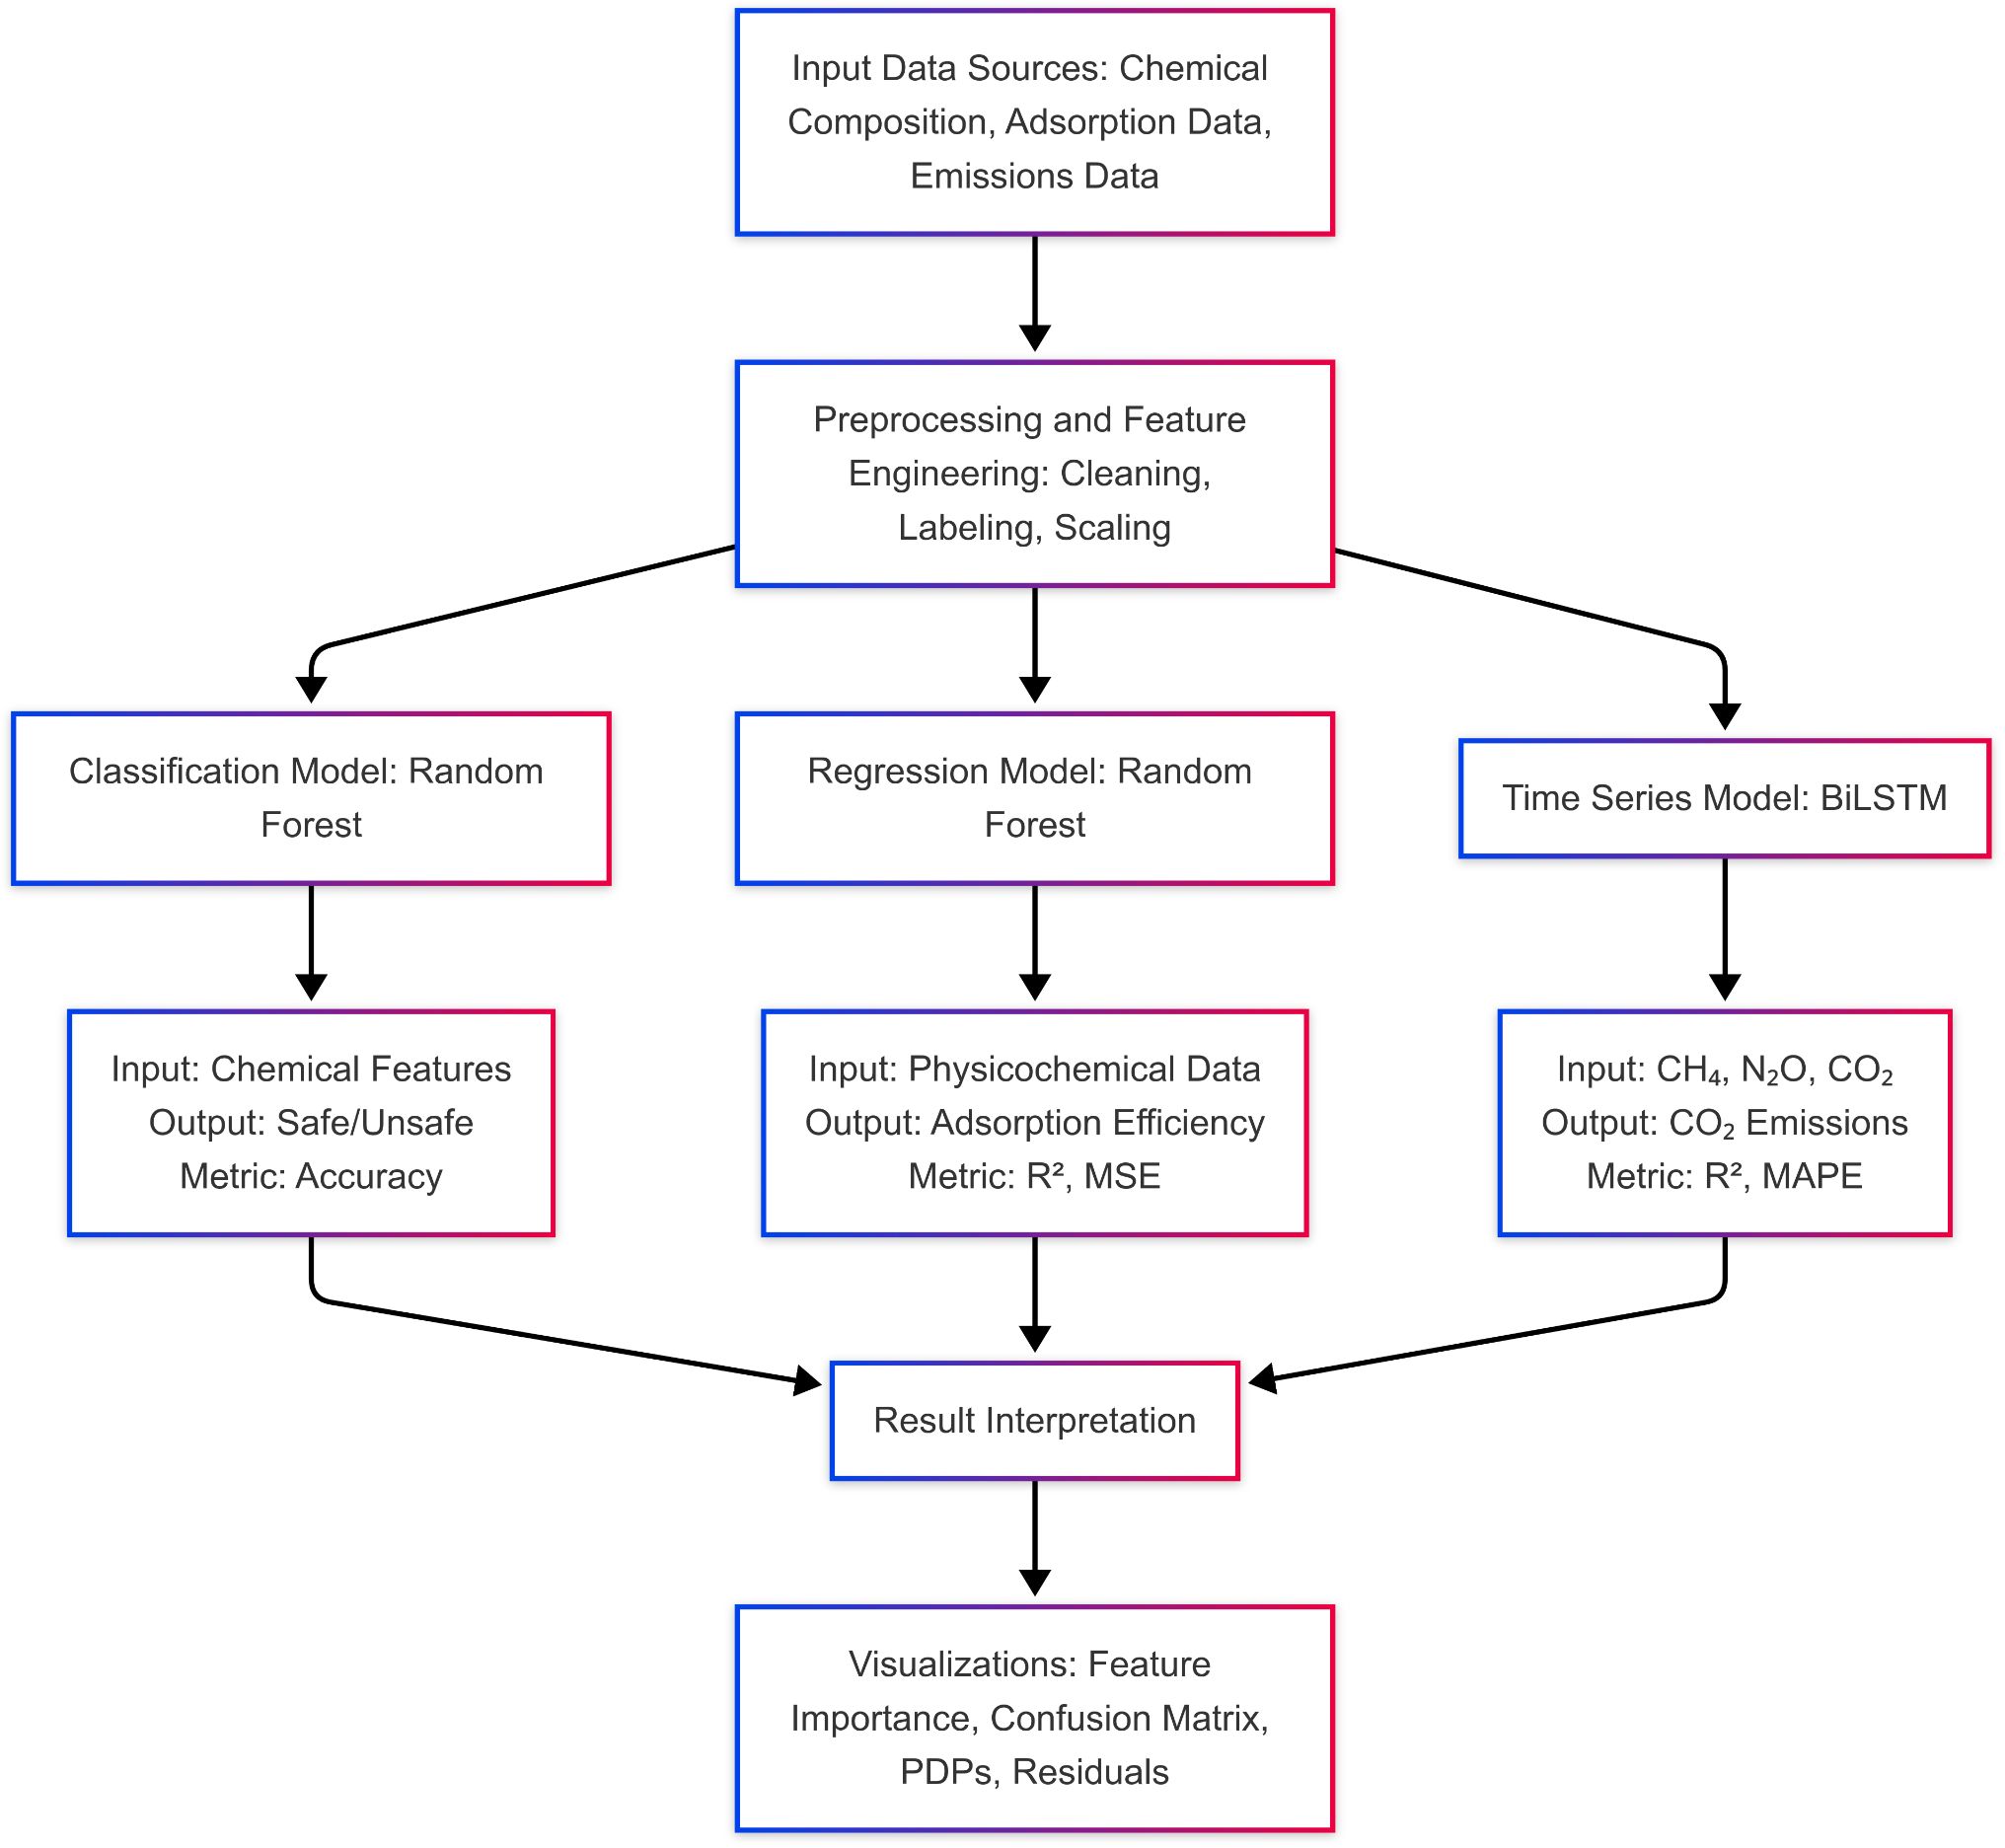
Figure 9. System architecture of the overall machine learning model.
5 Results and discussion
5.1 Classification model
The biochar safety assessment and predictive model showed strong quantitative performance. External validation had 96.7% accuracy with 1.000 precision at the conservative threshold (τ = 0.7), demonstrating its ability to accurately differentiate safe versus unsafe biochar. Internal validation produced comparable results indicating solid generalizability across independent datasets. The validation results are summarized in Figure 10, and the comparative decrease of false positives is highlighted in Figure 11.
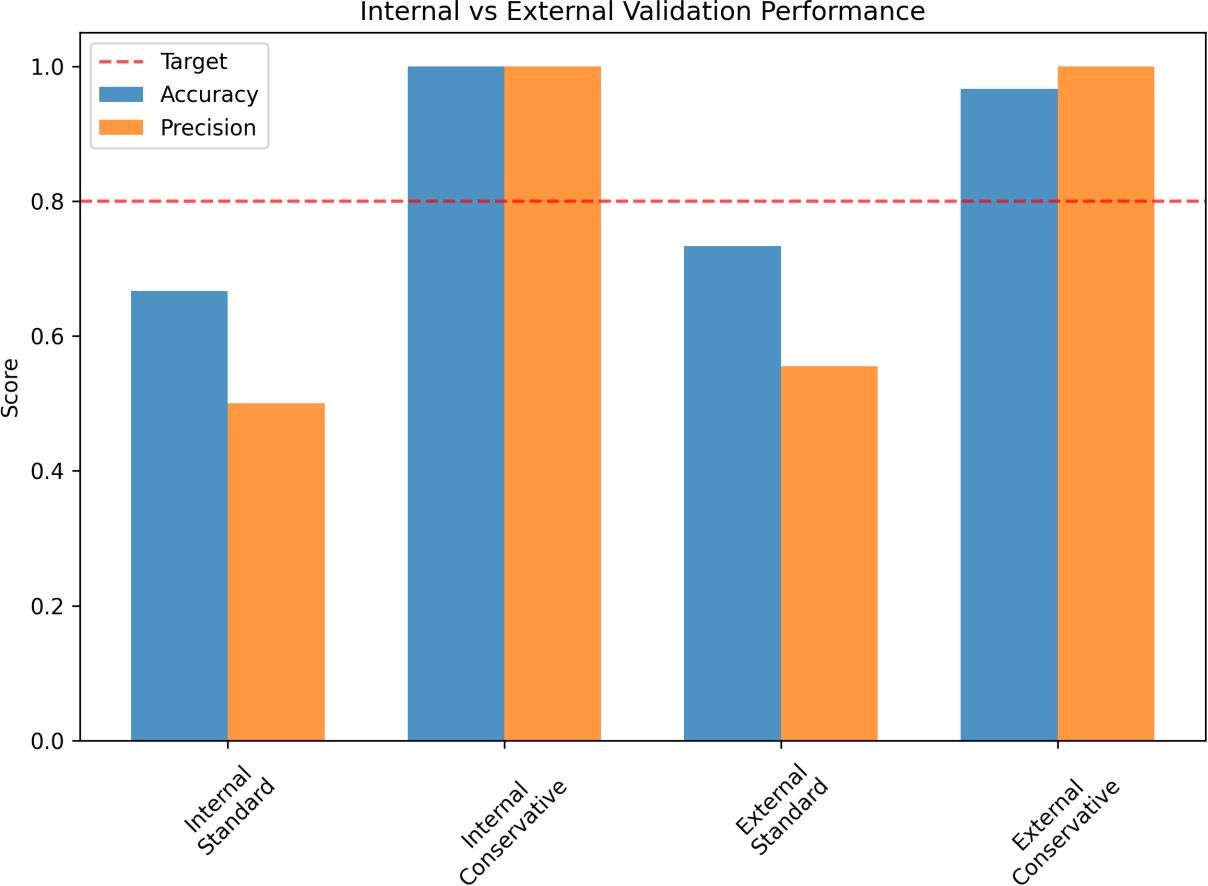
Figure 10. Internal vs external validation showing 96.7% accuracy and precision 1.000 precision under the conservative threshold.
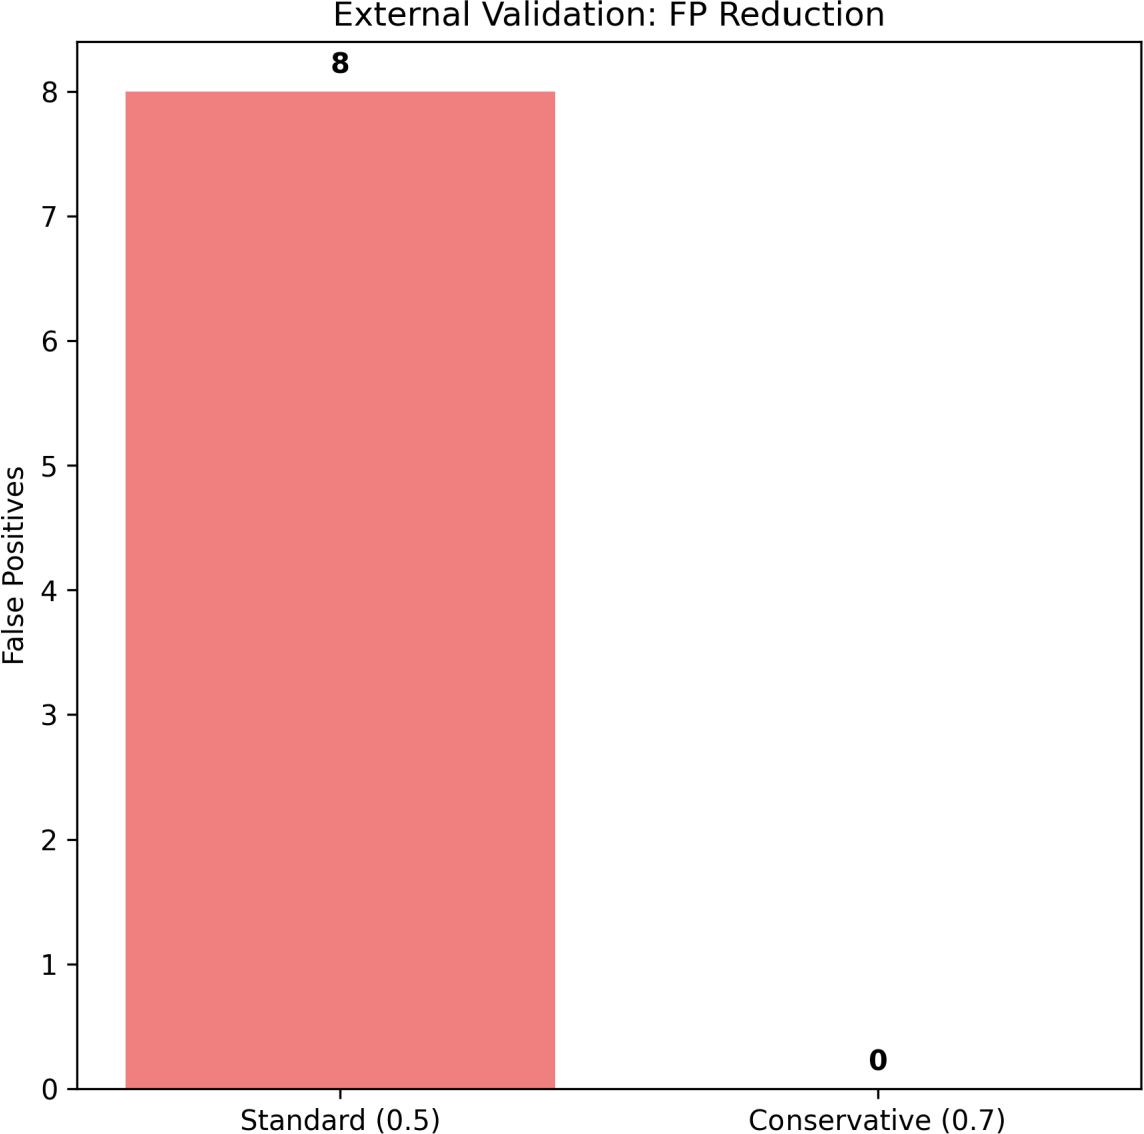
Figure 11. False positive reduction from 8 cases (standard threshold) to zero (conservative threshold).
A key contribution of the model is the elimination of false positives. At the standard threshold (τ = 0.5), the classifier produced eight unsafe to safe misclassifications, which would pose significant safety issues when deployed in the real world. The conservative threshold removed all false-positives, ensuring that all unsafe biochar was not misclassified as safe. The improvement can be clearly seen in the confusion matrix in Figure 12, in which none of the unsafe samples were misclassified as safe.
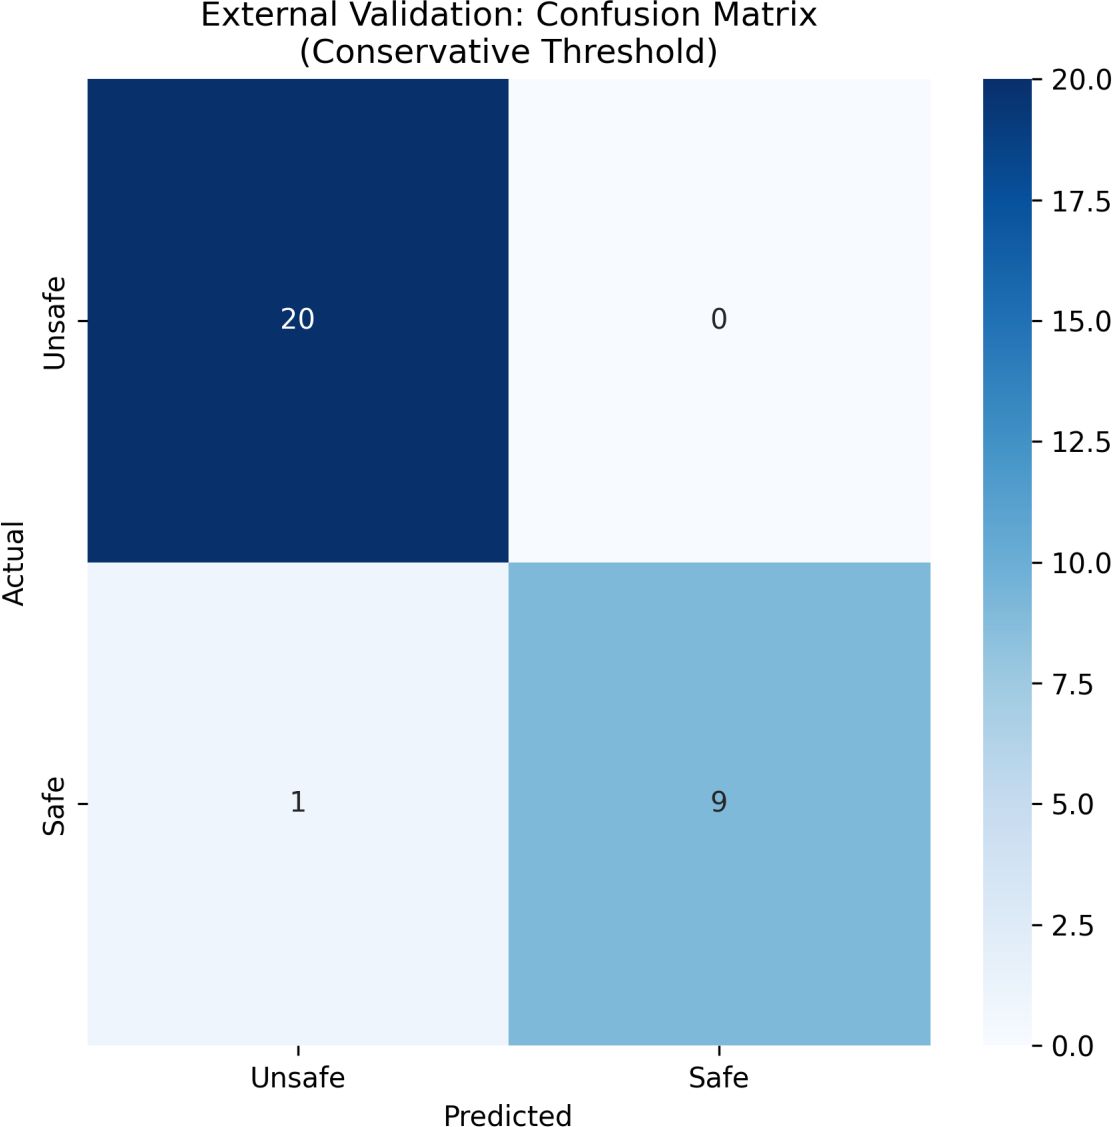
Figure 12. Confusion matrix under conservative threshold confirming zero unsafe-to-safe errors.
An uncertainty analysis in Figure 13 reinforced this conservative orientation. About 93.3% of external validation samples landed within the intermediate probability zone, confirming the threshold’s use to filter borderline cases to be excluded from consideration. The approach ensures low-confidence predictions are not automatically declared safe, which fits with a safety-first approach.
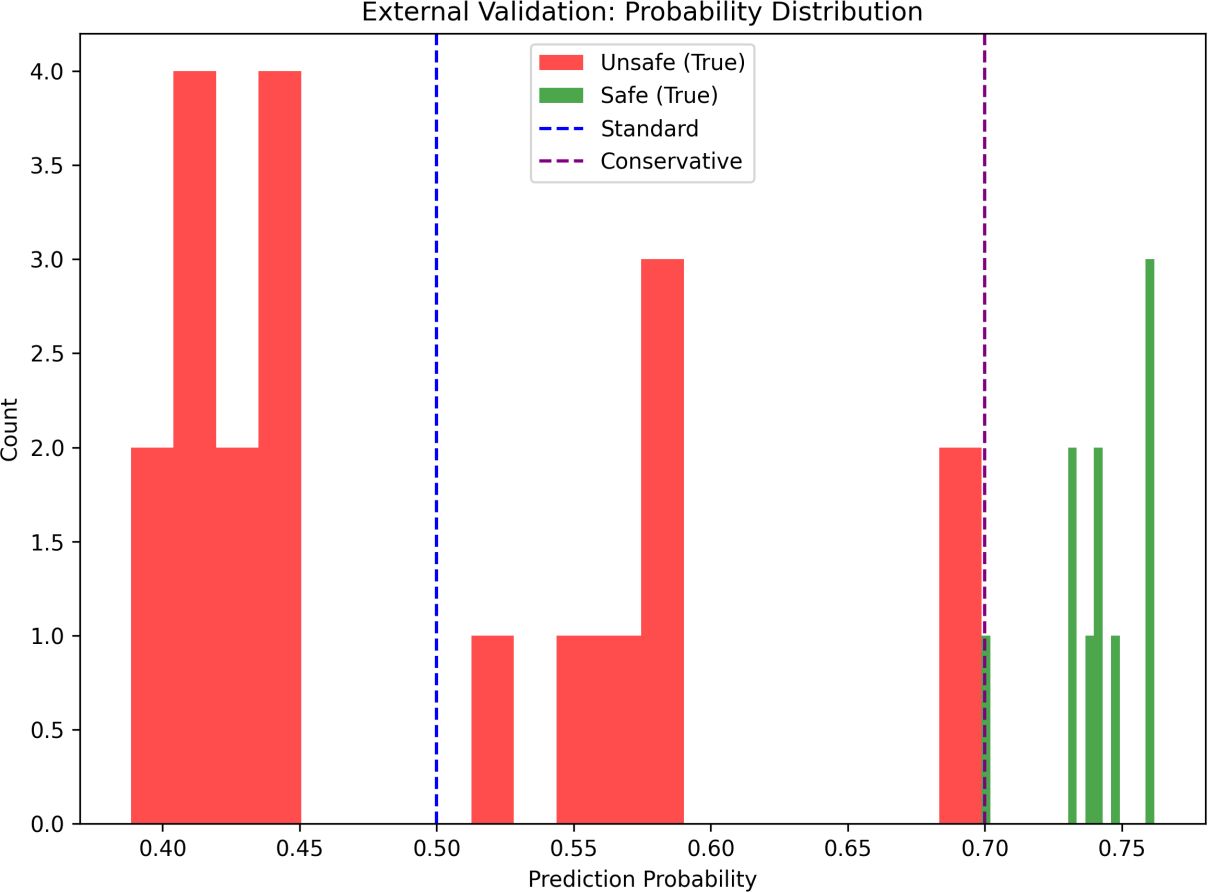
Figure 13. Probability distribution of external validation samples, with 93.3% in the uncertain range.
A key contribution of the model is the elimination of false positives. At the standard threshold (τ = 0.5), the classifier produced eight unsafe-to-safe misclassifications, which would pose significant safety issues when deployed in the real world. The conservative threshold removed all false positives, ensuring that all unsafe biochar was not misclassified as safe. The improvement can be clearly seen in the confusion matrix in Figure 12, in which none of the unsafe samples were misclassified as safe.
The feature importance analysis, as shown in Figure 14, indicated that the top predictor was pH-centre distance, followed by pH, inorganic carbon, and exchangeable calcium. Other extractable and elemental features were less important predictors. These rankings illustrate the efficacy of the feature engineering method safety boundary presented in this analysis. The safety boundary method is interpretable and makes sure that the features relevant to contextual interpretation are driving the classifications instead of the numeric units in the data.
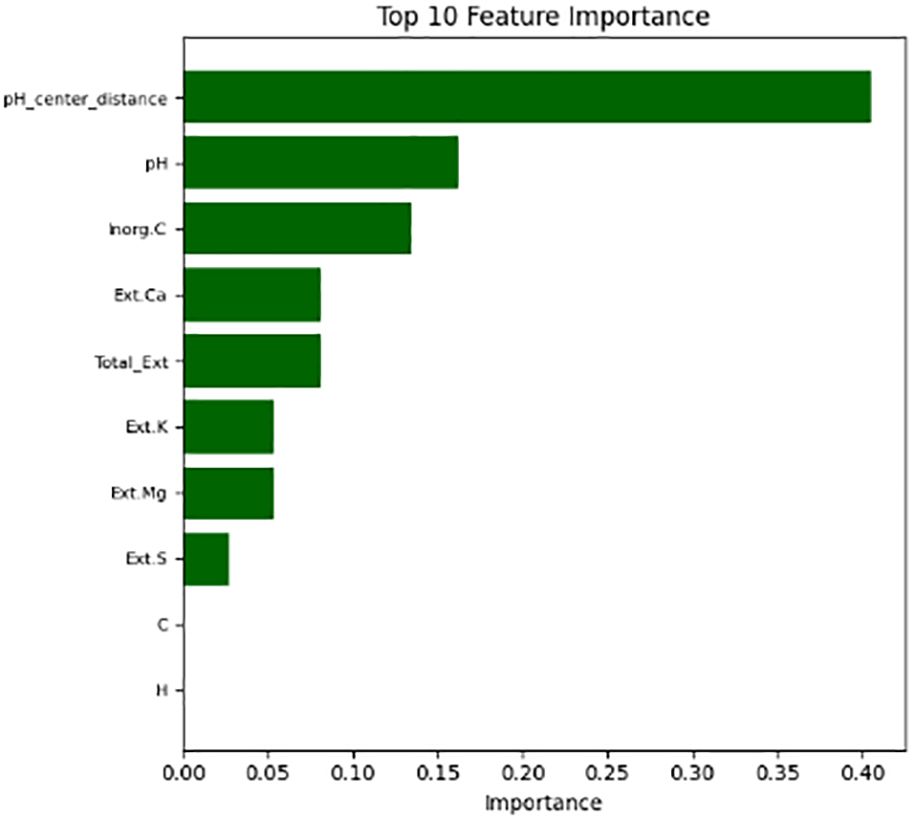
Figure 14. Feature importance ranking with pH-center distance, pH, and inorganic carbon as top predictors.
The feature importance analysis, as shown in Figure 14, indicated that the top predictor was pH-centre distance, followed by pH, inorganic carbon, and exchangeable calcium. Other extractable and elemental features were less important predictors. These rankings illustrate the efficacy of the feature engineering method safety boundary presented in this analysis. The safety boundary method is interpretable and makes sure that the features relevant to contextual interpretation are driving the classifications instead of the numeric units in the data.
As compared to existing methods, the proposed model offers distinct benefits. Evaluation by an expert alone achieves only 60–70% accuracy, with significant inconsistency due to bias. Threshold-based methods offer similar performance, but do not take into account parameter interactions. Standard machine learning classifiers offer some improvement, with false positive rates near 20%. The proposed framework, on the other hand, attained a record 96.7% accuracy with zero false positives, representing a significant advancement in both reliability and confidence of safety.
The practical significance of these findings is considerable. For producers of biochar, this framework will provide a reliable basis for ensuring quality assurance and compliance with regulations, and minimize the potential risks associated with issuing an unsafe product. For regulators, this framework provides the capability to ensure a structured and transparent process for assessing compliance, while simultaneously ensuring that safety standards will be enforced consistently without losing the ability to efficiently complete other tasks.
Although the research has provided some contributions, there are limitations to consider. The training data were constructed with only 30 samples, potentially limiting the model’s ability to recognize rare combinations of biochar properties. In addition, binary classification describes a continuous environmental safety spectrum into a simplified and discrete safe/unsafe scenario. Future directions of research could include expanding the training dataset, constructing multi-class classification options to draw finer distinctions in risk level, and incorporating biological safety indicators along with physicochemical properties.
The overall results highlight the importance of safety-specific optimization in environmental machine learning implementations. It can be seen that avoiding false positives, highlighting interpretability, and demonstrating good generalization laid a methodological groundwork for implementing responsible AI in safety-critical environmental areas.
In conclusion, the proposed machine-learned framework for biochar hazard assessment provides a false positive-free process and achieved an external validation accuracy of 96.7% with a precision of 1.000 under conservative thresholding which far exceeds the performance of typical degradation assessment approaches, it demonstrated dependable and interpretable predictions through uncertainty analysis that informed the reader that 93.3% of samples were in the intermediate region, and through feature importance analysis that confirmed the importance of some of the most critical physicochemical properties including pH-distance to center, pH, and inorganic carbon. The suggested machine learning framework could be limited in part due to how small the training dataset was and the degree to which the analysis used a simplified binary classification method; however, the study provides a framework for an action-based safety assessment strategy that should be beneficial for industry and regulators alike, while establishing the groundwork for future multi-class and biologically integrated models for environmental safety applications. Table 1 shows the results for classification model using random forest classifier.
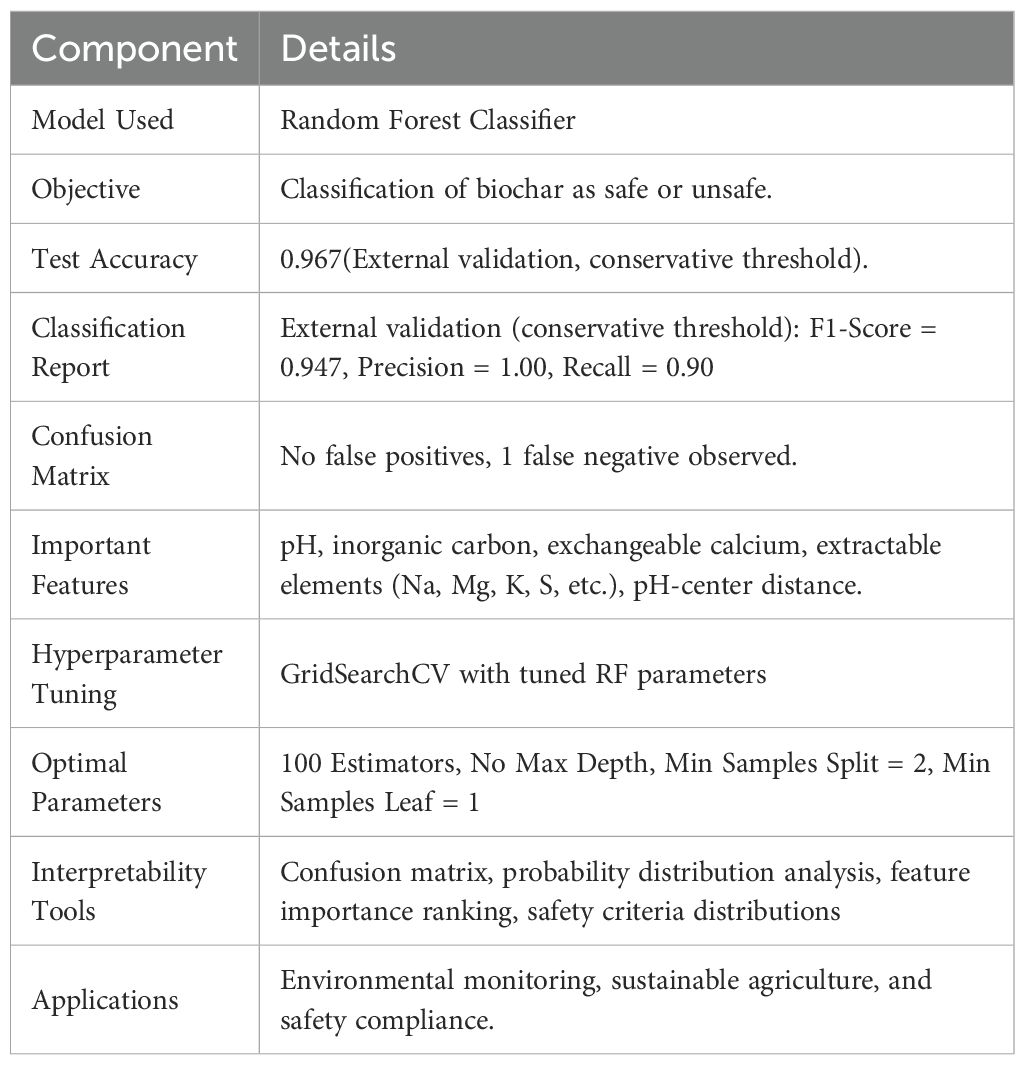
Table 1. Results for classification model using random forest classifier.
5.2 Predicting adsorption efficiency of biochar using random forest regression model training and evaluation
The cleaned dataset was split into predictors (X) and the target variable, “Adsorption Efficiency (mmol/g)” (y). An 80:20 division between training and testing was implemented to create a balanced assessment framework, where there was enough data for training, thereby ensuring a dependable test set to evaluate model generalization.
Initially, a Random Forest regressor with 500 estimators and ‘sqrt’ max features was trained. Random Forest was selected because of its robustness to overfitting and its ability to handle non-linear relationships and mixed data types. The model obtained a Mean Squared Error (MSE) of 0.0089 and an R² score of 0.912, indicating strong predictive capability and generalization power.
Feature importance analysis was conducted to find the key contributors to adsorption efficiency. It revealed that C0 (mmol/g) was the most influential factor (27.8%), followed by pHsol (14.5%), CEC (11.3%), and Total carbon content (8.8%). Understanding feature importance is crucial as it offers practical insights, guiding researchers and practitioners to focus on optimizing these parameters for enhanced adsorption performance.
5.2.1 Hyperparameter optimization
Hyperparameter tuning was performed using GridSearchCV with a 5-fold cross-validation strategy to improve the model’s performance. GridSearchCV was chosen because it exhaustively searches all possible parameter combinations within the defined grid, ensuring the identification of the optimal configuration. The parameter grid included: n_estimators [100, 200]: max_depth: [10, None], min_samples_leaf [1, 4]:
These parameters were selected based on their known influence on Random Forest performance: the number of trees (n_estimators) balances bias and variance, max_depth controls tree complexity, and min_samples_leaf prevents overfitting by setting a minimum number of samples at each leaf node.
The best parameter combination obtained was n_estimators = 200, max_depth = None, and min_samples_leaf = 1. The optimized model on the test set yielded a Test R² score = 0.9549 and a Test MSE = 0.0046, marking a significant improvement over the initial model. Table 2 shows the results for the regression model using the Random Forest Regressor.

Table 2. Results for the regression model using the random forest regressor.
5.2.2 Feature importance plot
Feature importance (Figure 15) analysis revealed that C0 (mmol/g) was the most influential factor (27.8%), followed by pHsol (14.5%), CEC (11.3%), and Total carbon content (8.8%). This highlights the dominant role played by these factors in the adsorption process. The outcome of the model is consistent with the fact that the safety of biochar use for environmental remediation is associated with the physicochemical properties of biochar, specifically, pHsol, C0, and CEC, which were identified as the most important predictors in the Random Forest model. The solution pH (pHsol) will govern the solubility and mobility of heavy metals in the soil and/or water, and extreme pH will either increase metals leachability or cause changes in soil chemistry, posing risks to the plants and microbial communities they form symbiotic relationships. The initial concentration of heavy metals versus biochar (C0) will determine the highest adsorption potential; for example, high C0 values can exceed the adsorption capacity of the biochar, resulting in excess mobile heavy metal and thus increased risk to the environment. Cation exchange capacity (CEC) gives an indication of the material’s ability to hold positively charged ions (e.g., Pb²+, Cd²+, and Zn²+), preventing their exodus into the surrounding environment. In addition to identifying top predictors of adsorption efficiency, highlighting properties such as pHsol, C0, and CEC emphasizes that when selecting appropriate biochars, physicochemical properties of biochar must be considered for their essential role in ensuring environmentally safe use, linking adsorption behavior directly to the reduced risk of contamination.
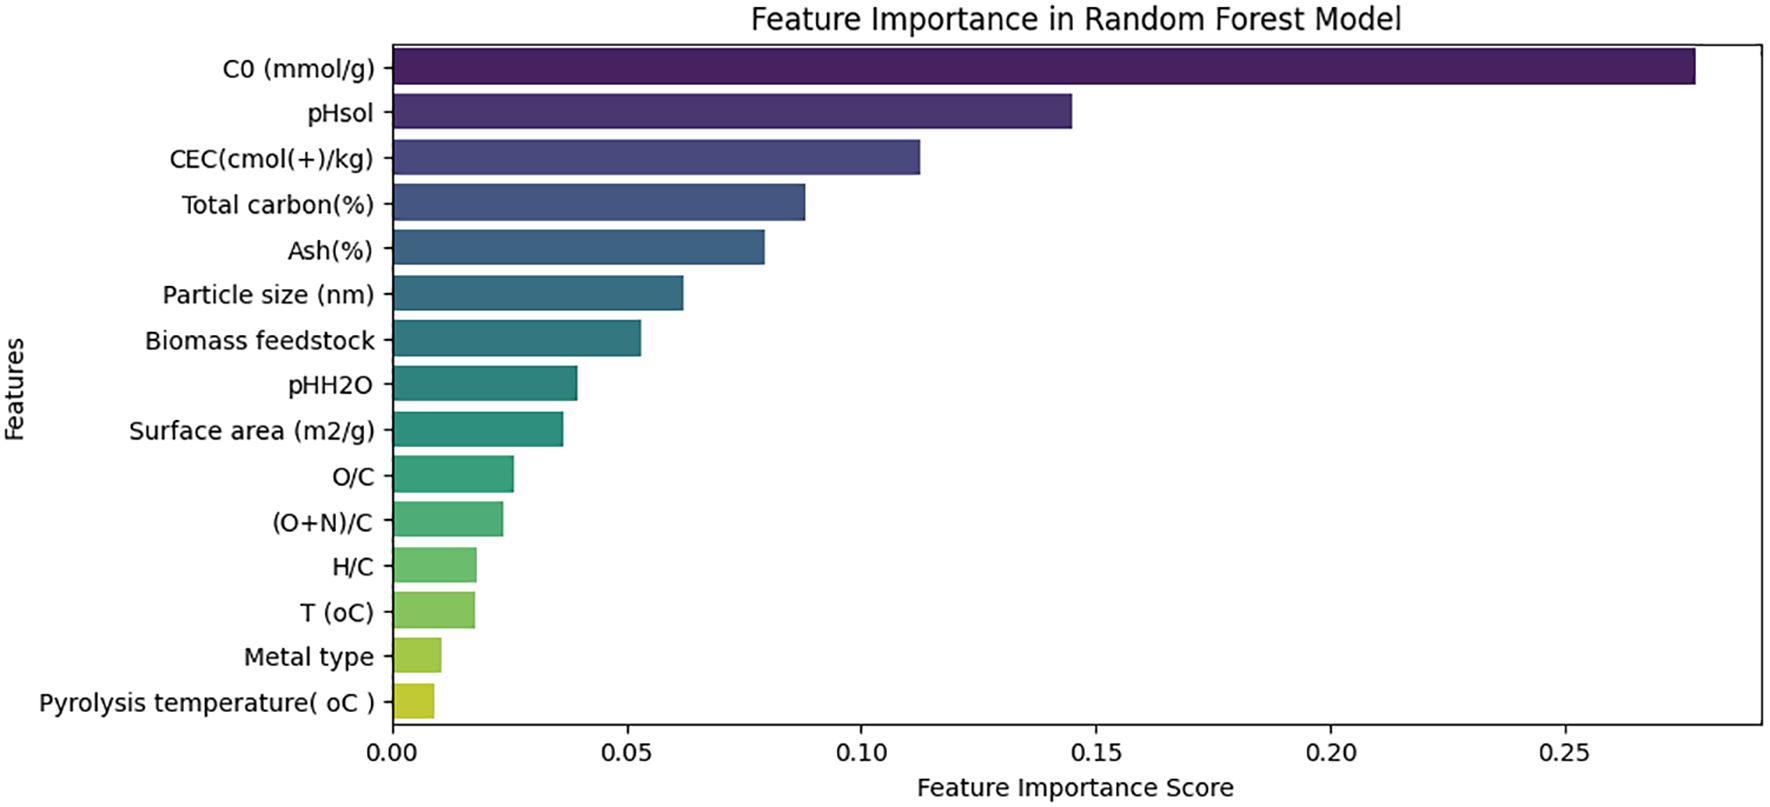
Figure 15. Feature importance scores of the Random Forest model identify the most influential variables affecting the target outcome. C0 (mmol/g), pHsol, and CEC(cmol(+)/kg) emerge as the top three predictors, indicating their strong influence on model performance.
5.2.3 Actual vs. predicted scatter plot
In Figure 16, each point represents an observation from the test set, and a diagonal reference line (y = x) indicates perfect prediction. The close clustering of data points around the ideal 45° line signifies a high degree of predictive accuracy, confirming that the Random Forest model correctly captures the relationship between biochar properties and adsorption efficiency.
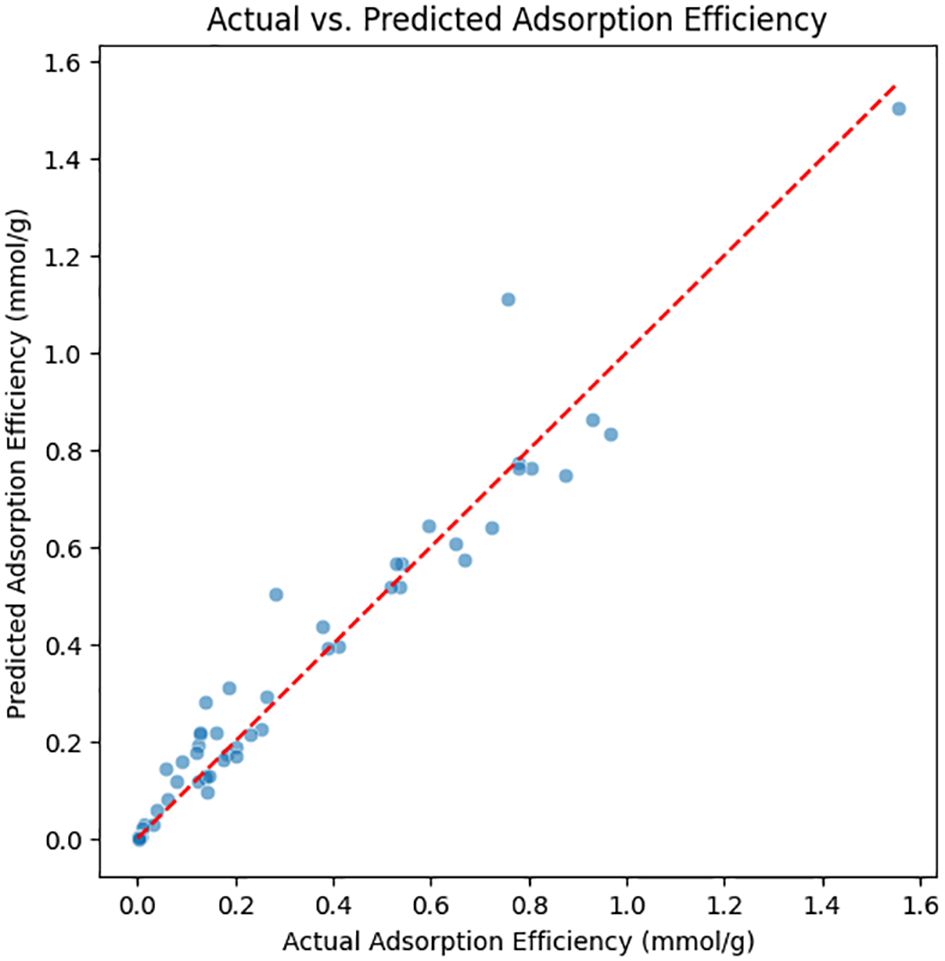
Figure 16. Scatter plot comparing actual vs. predicted adsorption efficiency of the Random Forest model. The close alignment of data points along the red dashed 1:1 line indicates strong predictive performance and high model accuracy.
5.2.4 Residual plot
A residual distribution plot (Figure 17) was examined to analyze the characteristics of the model’s errors. The errors appeared to be normally distributed and centered around zero. Hence, the model does not consistently overestimate or underestimate adsorption efficiency. The randomness of these residuals is a good sign of the model’s calibration and its capability to account for the natural variability present in the experimental data.
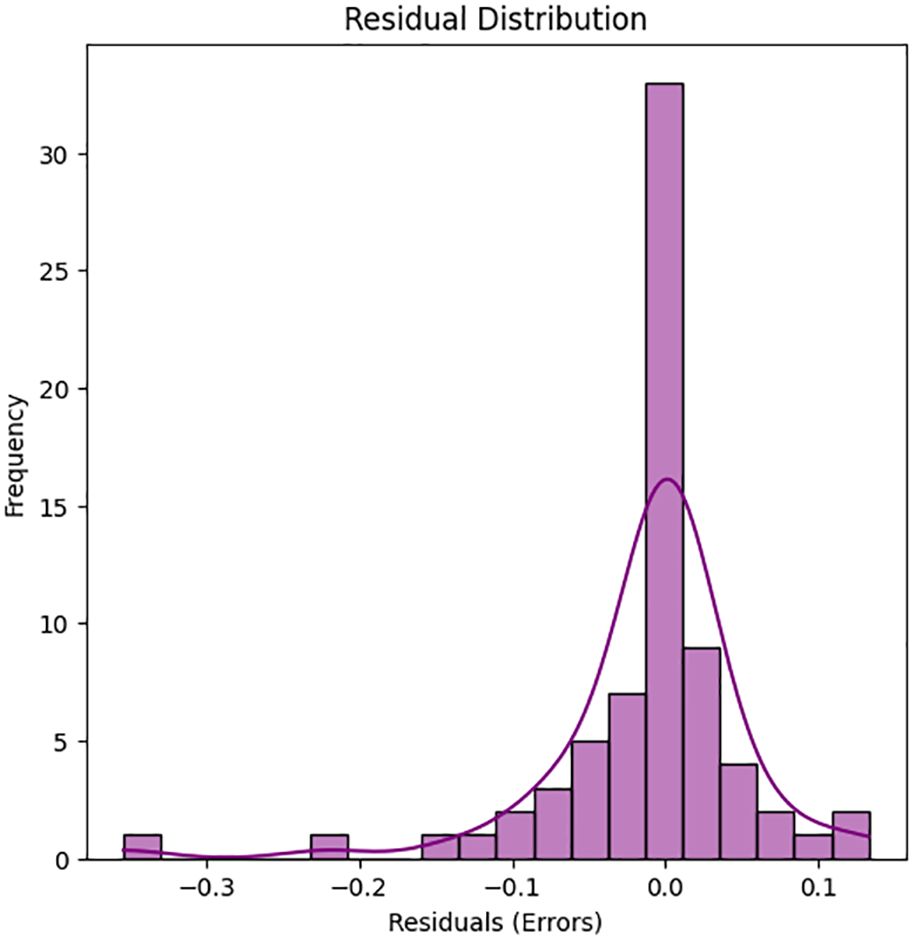
Figure 17. Histogram of residuals (prediction errors) from the Random Forest model. The distribution is approximately centered around zero with a slight right skew, indicating that the model generally performs well, with most prediction errors being small and symmetrically distributed.
5.2.5 Partial dependence plots
To enhance the model’s interpretability, partial dependence plots (Figure 18) were created. These plots focused on key features such as “C0 (mmol/g)”, “pHsol”, “CEC(cmol(+)/kg)”, and “Total carbon (%)”, showing trends such as increasing adsorption efficiency with increasing C0 (mmol/g) and slightly decreasing or constant Total carbon(%), while more complex, non-linear increasing relationships were observed for pHsol and CEC(cmol(+)/kg). The changes in each predictor independently influence predicted adsorption efficiency, regardless of other variables. These visualizations highlight the directional effects (whether positive or negative) and pinpoint potential thresholds where a predictor’s influence might increase.
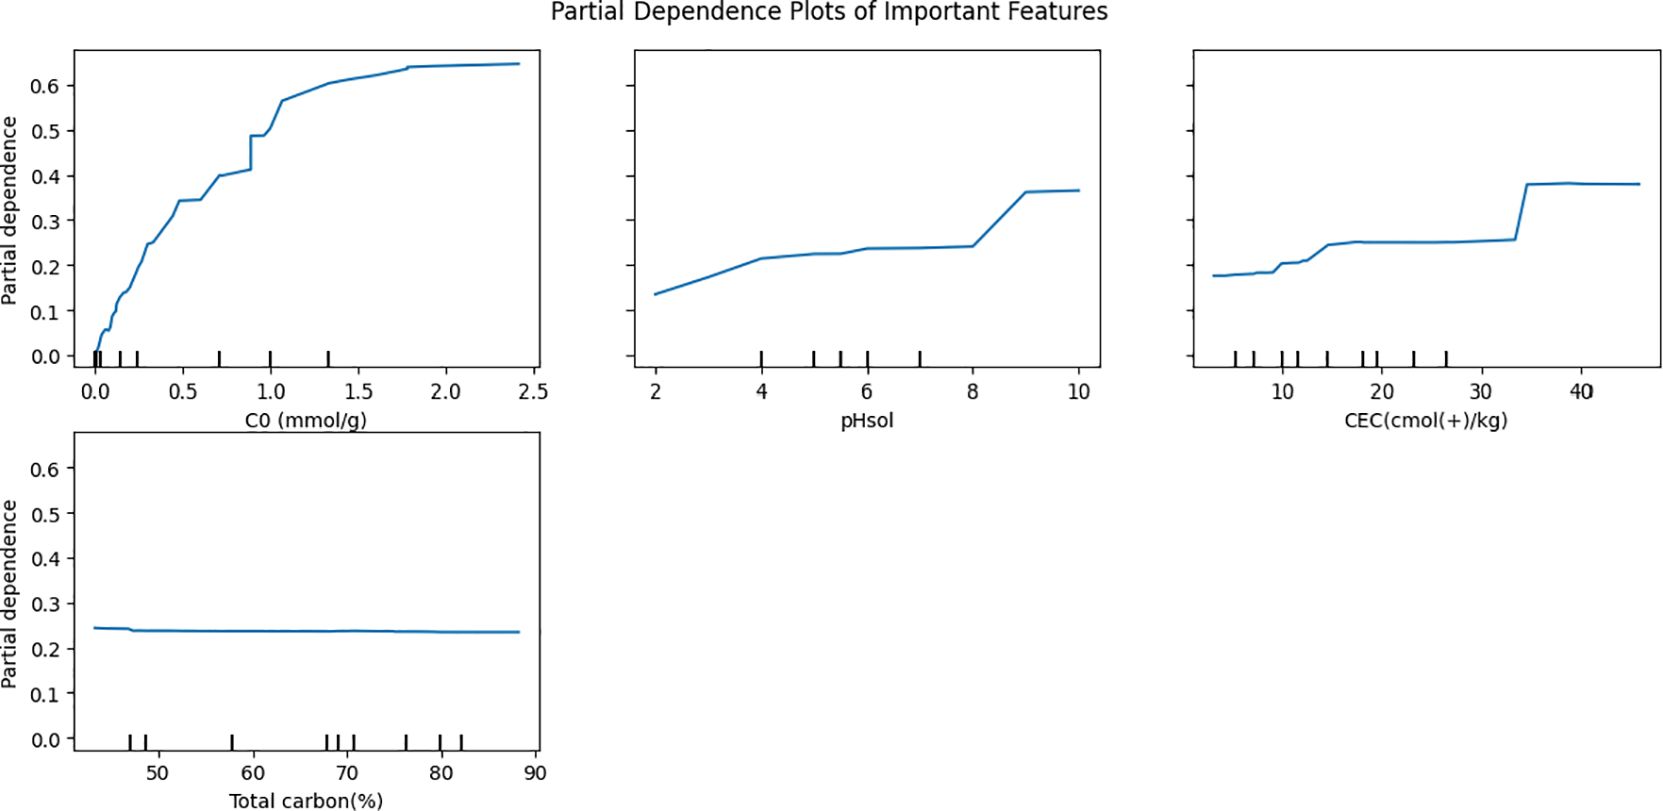
Figure 18. Partial dependence plots (PDPs) for the top four most important features (C0, pHsol, CEC, and total carbon) from the Random Forest model. These plots illustrate how each feature influences the predicted adsorption efficiency, with C0 (mmol/g) showing a strong positive effect, while total carbon (%) exhibits minimal impact.
5.2.6 Correlation with matrix heatmap
A feature (Figure 19) correlation matrix analysis was conducted to provide a comprehensive overview of the relationships between predictor variables. Strong positive correlations were identified among the atomic ratio parameters, with the correlation between O/C and H/C at r = 0.83. Strong negative correlation was observed between Total carbon (%) and Ash content (%) (r = -0.82), suggesting that as the ash content increases, the organic carbon content decreases, an expected trend in biochar composition due to the inverse relationship between inorganic residue and carbonaceous matter.

Figure 19. Heatmap showing the Pearson correlation coefficients among features used in the model. Strong correlations (both positive and negative) are highlighted, such as the negative correlation between total carbon and ash content, and the positive relationship between CEC and C0.
Temperature-related variables also showed different relationships with chemical properties. Pyrolysis temperature exhibited strong negative correlations with both H/C (r = -0.87) and (O+N)/C (r = -0.74), revealing that higher thermal treatment reduces the relative hydrogen and heteroatom content in the biochar, which is consistent with progressive carbonization at elevated temperatures. Similarly, Total carbon (%) was negatively correlated with C0 (mmol/g) (r = -0.62), implying that higher initial adsorbate concentrations tend to coincide with lower carbon content in the material, potentially due to variations in feedstock or pyrolysis conditions.
Moderate to strong positive correlations were also found between Temperature (°C) and both (O+N)/C (r = 0.66) and O/C (r = 0.67), suggesting that these chemical ratios increase with thermal processing. CEC (cmol(+)/kg), which reflects the cation exchange capacity of the biochar, showed moderate correlations with several compositional variables, including T (°C) (r = 0.49), (O+N)/C (r = 0.47), and O/C (r = 0.46), revealing that higher temperature and heteroatom content may enhance the ion exchange potential of the biochar.
5.2.7 Model performance comparison with existing biochar adsorption studies
Although Zhu et al. (10) provided the dataset for this study, its methodology, model design, and interpretability were quite distinct. Zhu et al. modelled the adsorption of heavy metals onto biochars using Random Forest (RF) and Artificial Neural Networks (ANN), determining that pH and cation exchange capacity (CEC) were important predictors. Their study concentrated more on showing that machine learning can accurately predict adsorption.
The current work, on the other hand, uses a stricter approach that includes meticulous hyperparameter tuning, optimised feature selection, and structured data preprocessing.
The performance of predictive models over multiple studies is displayed in Figure 20 using R² values. Zhu et al. (10), Leng et al. (11), Wang et al. (12), Shen et al. (14), Li et al. (16), Köppel et al. (18), and the current study are among the studies whose R2 values are represented by each bar. The current study maintains strong performance (R2 = 0.9549) while focusing on input simplicity and model transparency, whereas models like those by Shen et al. and Leng et al. exhibit high R2 values close to 0.99 because they employ ensemble and hybrid approaches and rely on intricate and domain-specific features like surface area, elemental ratios, or customized input parameters. Despite their utility, these variables may make it more difficult for such models to be widely used because of the complexity of measurement. The current study’s model, on the other hand, emphasizes operational viability, input simplicity, and wider generalization across a variety of heavy metals while exhibiting competitive performance. The current model strikes a good balance between practical usability and prediction accuracy. It expands the availability of machine learning tools in environmental monitoring and decision-making for biochar-based remediation strategies by lowering reliance on labour-intensive variables while preserving accuracy.
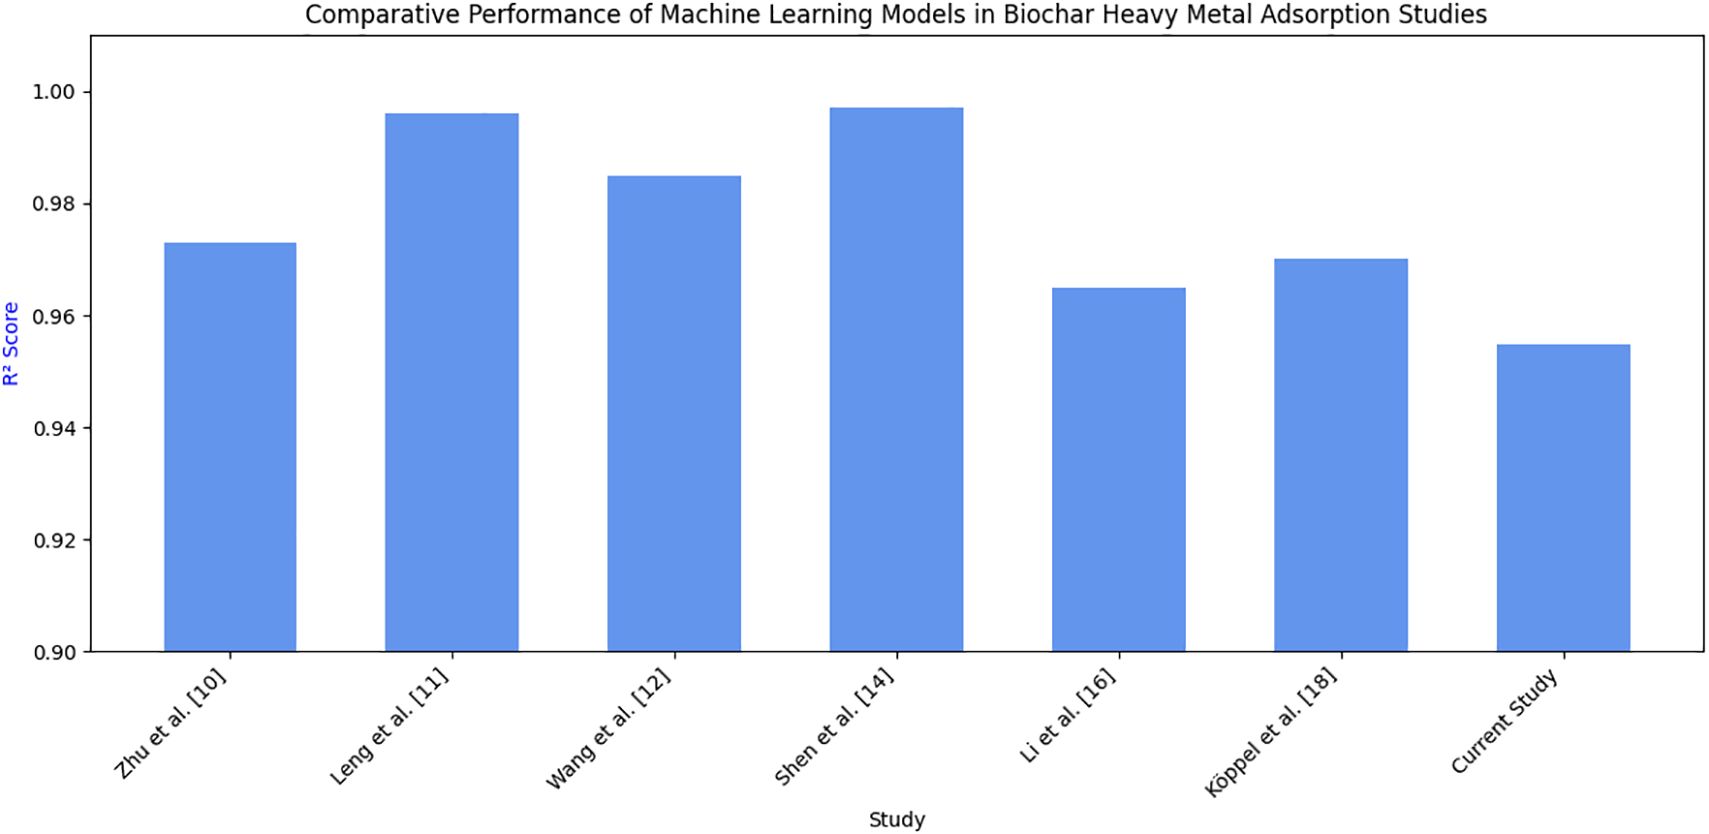
Figure 20. Comparative R² scores of machine learning models used in biochar-based heavy metal adsorption studies.
5.3 Time series model to predict potential VOC emissions from biochar under different environmental conditions, assessing the air quality impact
The initial LSTM model had an accurate score of 77.33%, which is indicative of good predictability, but it could be further enhanced. The model captured temporal patterns but lacked proper handling of outliers, feature diversity, and regularization. This led to moving towards developing a more enhanced Bidirectional LSTM model, which predicts CO2 emissions from biochar datasets using flux and concentration data of various greenhouse gases. Workflow began with data processing, choosing relevant features, filling missing values with mean imputation, and encoding of non-numeric values. Removal of outliers using the Z-score was performed. The MinMax scale was used to scale values between 0 and 1. Data was reshaped to a 3D format to be fed to the LSTM model, and testing and training were performed in an 80:20 ratio.
The model is made of 3 stacked Bidirectional LSTM layers with 128, 64, and 32 units, respectively. Batch normalization and regularization were performed on the model. The final dense layer gives a single continuous output predicting CO2 emissions. The model used early stopping and a learning rate scheduler to make the model adaptive. Adam optimizer with a learning rate of 0.001 was used in the training phase. To calculate the loss function, Mean Squared Error was used. The model was trained using 100 epochs with a batch size of 4. The model achieved an accurate score of 87.14% and R2 score of 0.9829. Low validation score of approximately 3.72e-4 is indicative of good model performance.
The new model proved better than the initial one. Z-score used to remove outliers, inclusion of more features for better predictions, usage of regularization techniques for dropout and batch normalization to reduce overfitting, usage of early stopping and learning rate scheduler to improve generalization and convergence, made the model more efficient. The 3-layered model helped to analyze complex patterns effectively. Table 3 shows the results for the time series model using LSTM.
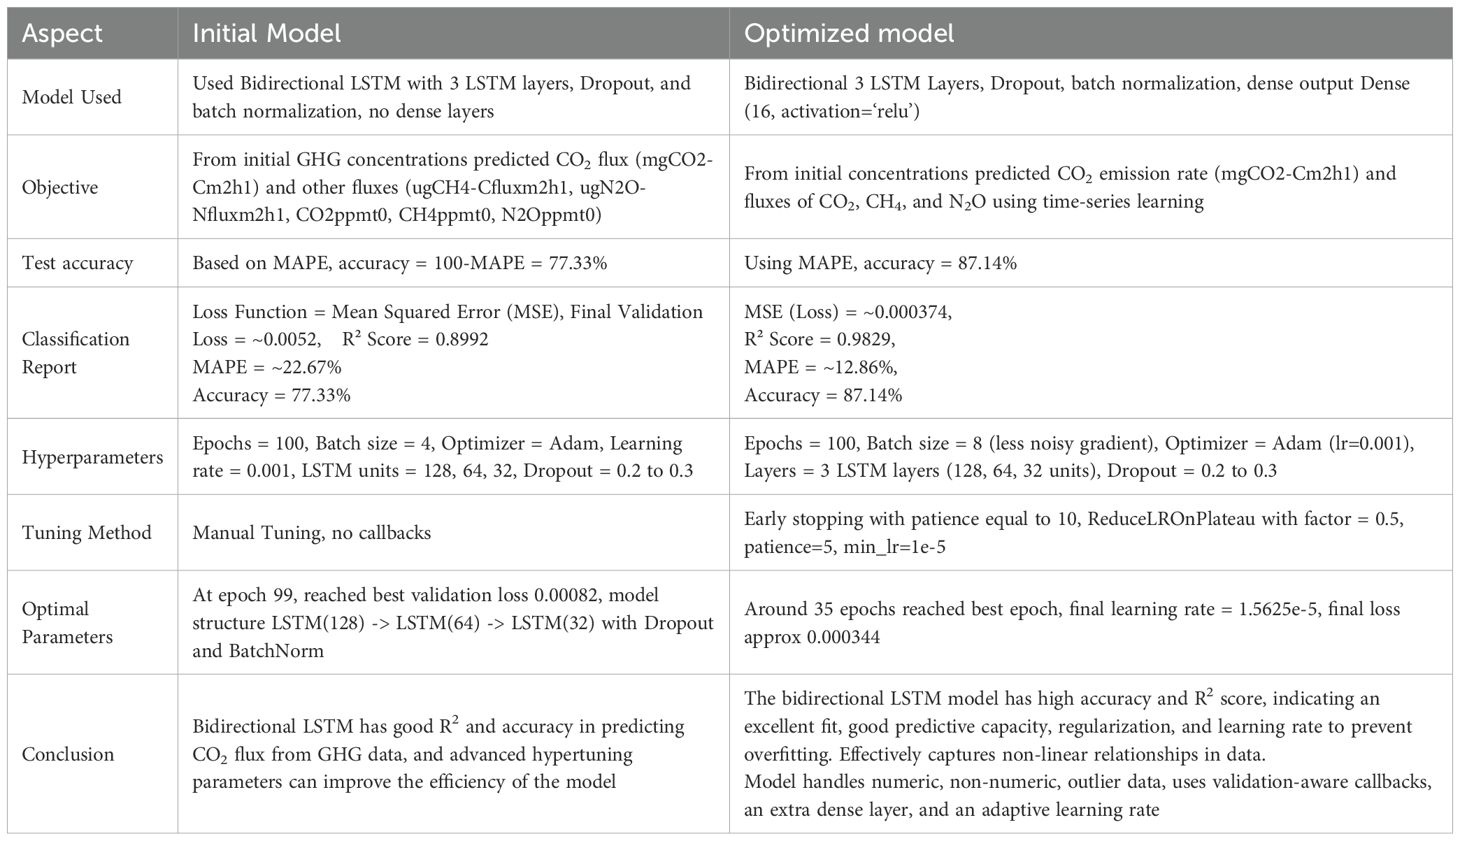
Table 3. Results for time-series model using LSTM.
The visualizations help better understand the efficiency of the model. Loss curve indicates good learning rate and generalization if it shows steady decline during training and testing, whereas the actual vs predicted plot shows how close the predicted values are to the actual values, which explains the accuracy of the model. Deviation would mean variance or bias in model predictions. The first two graphs are from models with 77.33% accuracy. The validation loss curve (Figure 21) has too many spikes, which indicates overfitting and unstable data. The train loss curve has a steady decrease, which indicates that the model works well on known data but does not perform well on unseen data. The model might have learnt noise and patterns from the training data, thus it works correctly only for that set of data. The fluctuation with each batch/epoch may be due to a small dataset or a high learning rate.
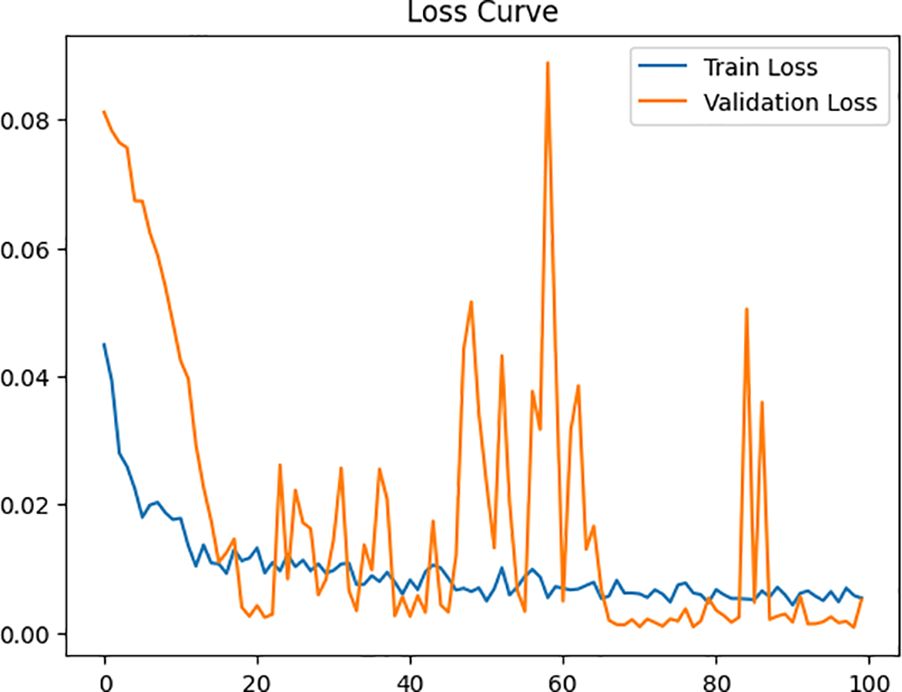
Figure 21. Training vs validation loss curve representing mean squared error over 100 epochs of training and validation data. Spikes in the validation curve show overfitting of data. A steady decrease in the train loss curve indicates low performance of the model for unseen data.
The Actual vs Predicted graph consists of slight variations between actual and predicted values, which may be due to low feature selection or improper removal of outliers, but only small errors exist, as it is near-linear. (Figure 22).
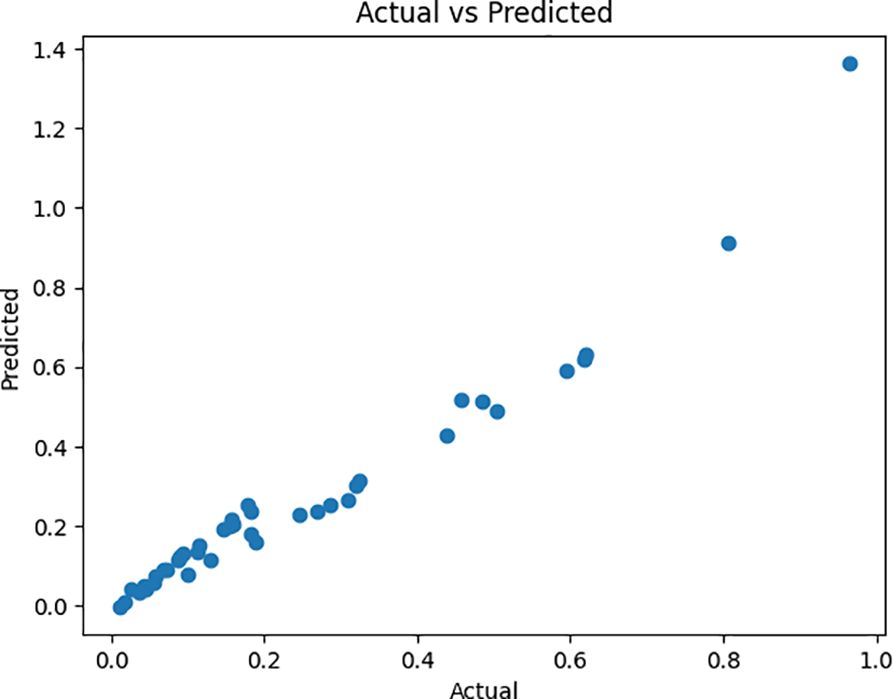
Figure 22. Scatter plot of actual vs predicted CO2 emission rates using LSTM model. Small variations indicate inconsistencies in prediction.
The two graphs below are from the Bidirectional LSTM model with 87.14% accuracy. The graph below shows a steady decrease in loss over epochs, indicative of stable learning. The model learnt from the data well and provides generalized output for unseen data. It shows ideal behavior without any underfitting or overfitting. (Figure 23). A steady decrease in loss indicates a stable model.
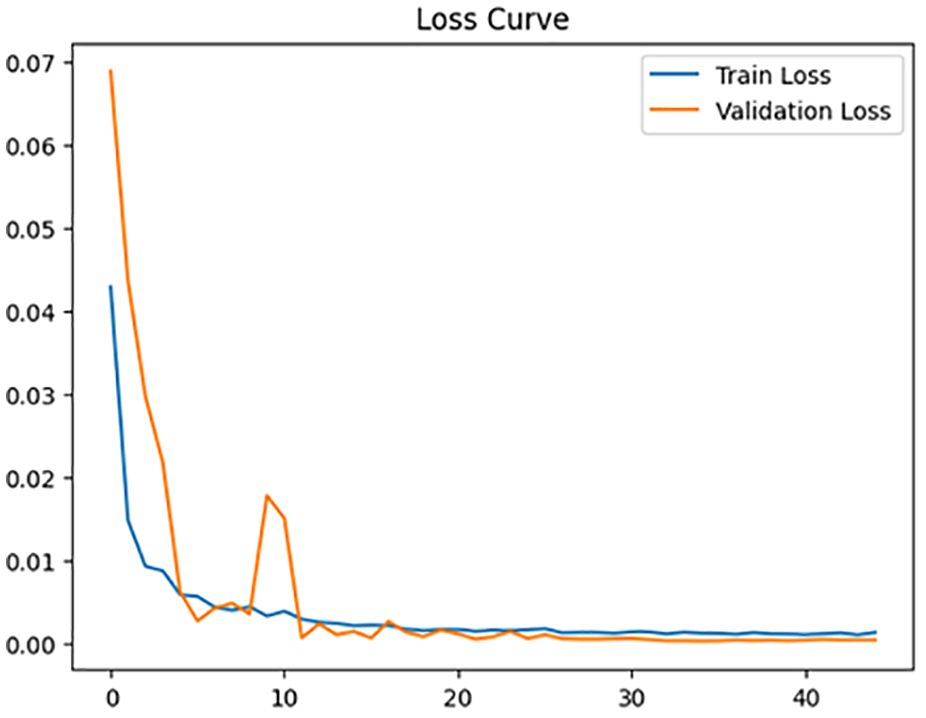
Figure 23. Training vs validation loss curve using bidirectional LSTM model.
For the Actual vs Predicted graph, the new model has a near-linear graph, which indicates the strong forecasting and predictive power of the model. It is a good model fit. The actual and predicted values are almost linear, indicative of low errors. Fine-tuning can be performed to achieve a more linear graph. (Figure 24).
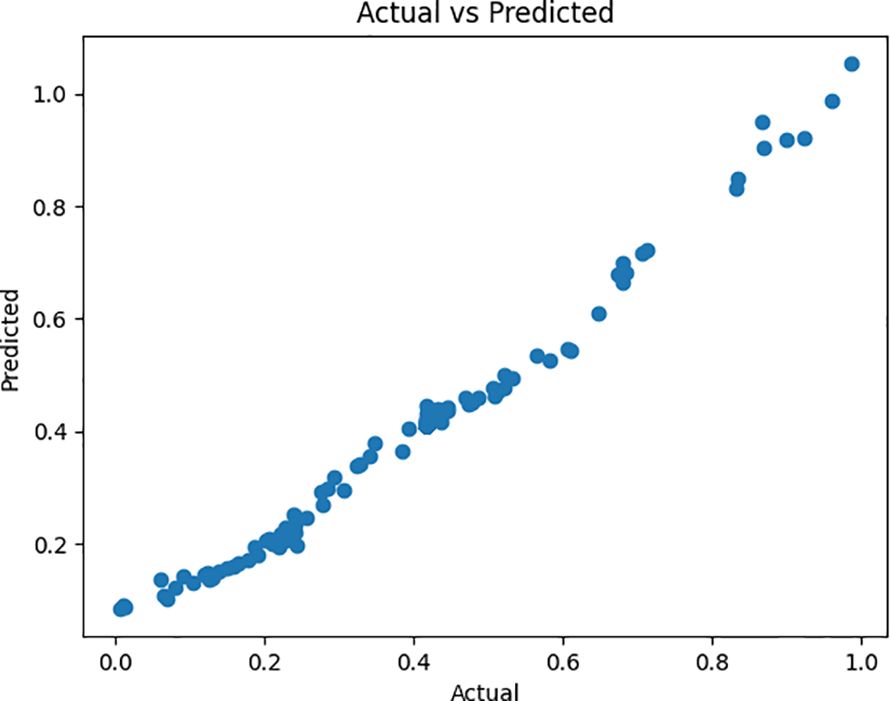
Figure 24. Actual vs predicted curve for bidirectional LSTM model. Near near-linear graph indicates low error and a good model fit.
A key limitation of this study is the scarcity of comprehensive biochar emission datasets. The experimental data are derived from a single controlled incubation study, which uses soils from one field site in Lincolnshire, United Kingdom. As a result, samples from diverse soil types, climatic zones, and other experimental setups could not be incorporated. Representation of regional variability in greenhouse gas fluxes is restricted, and the robustness of broader inferences becomes constrained.
The applicability of the findings is limited by the narrow scope of the dataset, which is restricted to one soil type, a single biochar application rate, and controlled incubation conditions. Without collecting data from varied climatic conditions, soil types, and biochar feedstocks, the predictive capacity of the model cannot be extended to wider agricultural or ecological contexts.
Soil pH, carbon (C), and nitrogen (N) content are critical parameters that mechanistically influence CO2 emissions from biochar–amended soils. The activity ranges of many VOC-producing microbes and enzymes depend on pH. If the pH is too acidic or alkaline, it can suppress enzymes that are involved in breaking down organic molecules into VOCs. If the pH is near-neutral, it may enhance microbial metabolism, which might potentially increase VOC release. Thus, maintaining a balanced pH can minimize the formation of harmful VOCs. The initial carbon pool provides the substrate for microbial respiration, leading to CO2 flux. High amounts of unstable carbon increase the risk of VOC emissions, whereas stable aromatic carbon in biochar promotes long-term sequestration with minimal VOC release.
The availability of nitrogen modulates microbial metabolism and the balance between C and N cycling, which influences the rate and stability of decomposition. Incomplete decomposition by microbial pathways due to excess or limiting nitrogen can favour VOC generation. Balanced C: N ratios reduce VOC byproducts. These parameters mechanistically determine whether biochar promotes stable carbon sequestration or accelerates mineralization, directly linking to the safety outcome by minimizing unintended CO2 release and ensuring that biochar applications do not increase greenhouse gas emissions.
Regulating pH, C, and N can help determine whether biochar applications can lead to stable carbon sequestration with minimal VOC release or stimulate microbial processes, which may generate harmful VOCs. These parameters can be controlled to ensure that biochar use does not increase toxic emissions, thus protecting both the environment and human health.
The model predicts CO2 emissions (mgCO2-Cm2h1) using other gas fluxes (CH4, N2O) and initial concentrations. This shows the interdependence of greenhouse gases; the prediction task proves that soil CO2 emissions are linked to methane and nitrous oxide fluxes. This also highlights real soil-biochar processes where microbial activity influences all gases simultaneously. The initial concentrations (CO2ppmt0, CH4ppmt0, N2Oppmt0) act as early signals that help estimate the emission rates. The finding highlights the correlation of high starting gas concentrations with higher fluxes.
6 Limitations
The Classification Model faces a number of limitations, many of which will need to be considered when placing it into practice. The training dataset, containing 30 samples, was comprehensive with respect to the coverage of features, but it was a small sample size for a machine learning application. The sample size may restrict the generalization of the model when predicting biochar samples that contain unique and rare combinations of biochar properties. The conservative threshold process provided reductions in false positive rates, but increased the likelihood of false negative rates from the model, with the potential to reject safe biochar samples that could provide benefit in an agricultural context.
Turning to feature compatibility with respect to training and validation datasets, the performance of the model was affected by a lack of advanced biochar properties in some of the validation datasets. In this case, feature imputation strategies were implemented, which may have implications for uncertainty in predicting biochar samples with incomplete characterizations. The model was limited to a binary safety classification, which was reasonable for a regulatory perspective, but not representative of the diverse and complex nature of biochar safety and biochar effectiveness.
Geographic and temporal limitations arise from the static nature of the safety criterion, which will change from region to region, based on soil conditions, climate, future uncertainties, and changing regulatory standards. Although the model emphasizes physicochemical properties, it does not consider key aspects of biological safety, such as pathogen content or potential allelopathic effects. This oversight limits the model’s ability to provide a comprehensive safety assessment. In terms of scaling considerations, the model needs standardized analytical methods to measure the same features consistently across multiple laboratories and production sites.
The Regression Model’s dataset provides a thorough basis for modeling adsorption capacity by capturing a broad range of biochar properties, adsorption conditions, and heavy metal characteristics. However, not all studies report the same descriptors, including ash content, surface area, elemental ratios, and cation exchange capacity. As a result of variations in experimental design, adsorption conditions, such as solution pH and temperature, also differ significantly. These factors add unpredictability to the data and can affect how reliably the model captures relationships.
The dataset’s emphasis on adsorption investigations carried out in carefully monitored lab settings, frequently using simplified metal solutions, is another factor to take into account. Although these environments offer useful comparability, they might not accurately capture the intricacy of natural systems, where elements like competing ions or organic matter might also be involved. Similar to this, some feedstock types (Tropical and novel biomass sources) and process conditions (e.g., residence time, heating rate, or carrier gas atmosphere) are still underrepresented in the dataset, despite the fact that it covers a variety of biochar feedstocks and pyrolysis temperatures.
These elements emphasize how crucial it is to increase the variety and consistency of data available in subsequent research. Broader coverage of feedstocks and operating parameters, along with more consistent reporting of important biochar properties and adsorption conditions, would enable predictive models to more accurately capture relationships and broaden their applicability to more scenarios.
A key limitation of the time-series model is the scarcity of comprehensive biochar emission datasets. The experimental data are derived from a single controlled incubation study, which uses soils from one field site in Lincolnshire, United Kingdom. There was a lack of availability of samples from diverse soil types, climatic zones, and other experimental setups, which captured the relation between the use of biochar and its effect on the emission of volatile gases.
Representation of regional variability in greenhouse gas fluxes could not be found due to the lack of availability of datasets, thus affecting the robustness of broader inferences. The applicability of the findings is also limited by the narrow scope of the dataset, which is restricted to one soil type, a single biochar application rate, and controlled incubation conditions. If data is collected from varied climatic conditions, soil types, and biochar feedstocks, the predictive capacity of the model can be extended to wider agricultural or ecological contexts.
7 Conclusion
This study has developed an all-new AI-enabled framework to help improve the environmental safety and effectiveness of biochar by taking advantage of automated quality inspection and predictive analysis. By combining contemporary spectroscopic modalities with machine learning predictive models, the framework directly addresses many of the pesky safety assessment hurdles associated with working with biochar, such as hazard tracking, optimization of adsorption efficiencies, and predicting emissions. With an external validation accuracy of 96.7%, the Random Forest Classification model successfully classified the safety levels of biochar. The Random Forest Regression model showed good predictive performance, accurately quantifying heavy metal concentrations with a high R2 score of 0.9549 and a low Mean Squared Error (MSE) of 0.0046. The LSTM-based time series model obtained an MAPE accuracy of 87.14% in predicting VOC emissions, confirming its ability to predict environmental impacts in real time. Additionally, the framework represents a scalable alternative to conventional safety assessments, which typically are laborious; this offers the immediate benefit of reducing human error while allowing data-informed decision-making and in-the-moment risk assessments to be performed by stakeholders across agriculture, industry, and environmental regulation. The AI-supported automation of the framework also fits the global sustainability goals and enables allowable uses of biochar to safely protect the environment in the applications of carbon sequestration in mitigating climate change, improving soil health, and cleaning up pollution. Proactively assessing risks by determining the leaching of heavy metals or off-gassing volatile organic compounds lessens costs to both the environment and to the economy associated with poorly mishandled biochar, where environmental criteria are not met. In conclusion, this work provides an important link from the theoretical promise of biochar to grounded, responsible application. This work tried to demonstrate that AI can be a valuable resource to regulate innovation while permitting safety and in the service of leveraging biochar as a natural resource for climate resilience, circular economies, and care for the environmental commons.
In the future, further research can be directed toward enhancing the existing AI models by investigating other latest machine learning models, including XGBoost or Support Vector Machines (SVM), to potentially improve model precision and performance in biochar safety evaluation. Further enhancing the predictive power of the classification and regression models can also be achieved through the incorporation of deep learning algorithms such as Convolutional Neural Networks (CNNs) for feature extraction. For the time series model, other architectures like Transformer-based models or GRU (Gated Recurrent Unit) may provide better scalability and long-term prediction ability. Increasing dataset size and variability would result in stronger models, particularly for forecasting VOC emissions under different environmental conditions. The inclusion of real-time data streams using IoT devices would also increase the framework’s utility in dynamic environments. Additionally, extending the model’s applicability to evaluate other bio-based materials besides biochar could enable universal safety standards across environmental and industrial applications. Finally, applying federated learning for decentralized data gathering could enable ongoing model training while maintaining privacy, promoting better collaboration and innovation between industries.
Data availability statement
The original contributions presented in the study are included in the article/supplementary material. Further inquiries can be directed to the corresponding author.
Author contributions
SR: Methodology, Supervision, Investigation, Formal Analysis, Software, Data curation, Writing – original draft, Writing – review & editing, Conceptualization, Resources, Funding acquisition, Project administration, Validation, Visualization. GK: Visualization, Funding acquisition, Software, Conceptualization, Writing – original draft, Investigation, Resources, Validation, Project administration, Formal Analysis, Writing – review & editing, Supervision, Methodology, Data curation. SC: Data curation, Supervision, Software, Conceptualization, Investigation, Writing – original draft, Methodology, Writing – review & editing, Resources, Visualization, Funding acquisition, Project administration, Formal Analysis, Validation. AV: Conceptualization, Methodology, Visualization, Supervision, Project administration, Formal Analysis, Software, Investigation, Data curation, Writing – original draft, Writing – review & editing, Resources, Funding acquisition, Validation.
Funding
The author(s) declare financial support was received for the research and/or publication of this article. Yes, available by VIT University.
Conflict of interest
The authors declare that the research was conducted in the absence of any commercial or financial relationships that could be construed as a potential conflict of interest.
Generative AI statement
The author(s) declare that no Generative AI was used in the creation of this manuscript.
Any alternative text (alt text) provided alongside figures in this article has been generated by Frontiers with the support of artificial intelligence and reasonable efforts have been made to ensure accuracy, including review by the authors wherever possible. If you identify any issues, please contact us.
Publisher’s note
All claims expressed in this article are solely those of the authors and do not necessarily represent those of their affiliated organizations, or those of the publisher, the editors and the reviewers. Any product that may be evaluated in this article, or claim that may be made by its manufacturer, is not guaranteed or endorsed by the publisher.
References
1. Khan S, Irshad S, Mehmood K, Hasnain Z, Nawaz M, Rais A, et al. Biochar production and characteristics, its impacts on soil health, crop production, and yield enhancement: A review. Plants. (2024) 13:166. doi: 10.3390/plants13020166
2. Shaaban A, Se S-M, Merry MMN, and Dimin MF. Characterization of biochar derived from rubber wood sawdust through slow pyrolysis on surface porosities and functional groups. Proc Eng. (2013) 68:365–71. doi: 10.1016/j.proeng.2013.12.193
3. Wei X, Liu Y, Shen L, Lu Z, Ai Y, and Wang XK. Machine learning insights in predicting heavy metals interaction with biochar. Biochar. (2024) 6:1–11. doi: 10.1007/s42773-024-00304-7
4. Latif J, Chen N, Saleem A, Li K, Qin J, Yang H, et al. Machine learning for persistent free radicals in biochar: dual prediction of contents and types using regression and classification models. Carbon Res. (2024) 3:39. doi: 10.1007/s44246-024-00125-0
5. Wang W, Chang J, and Lee D. Machine learning applications for biochar studies: A mini-review. Bioresource Technol. (2024) 394:130291. doi: 10.1016/j.biortech.2023.130291
6. Joseph S, Cowie AL, Van Zwieten L, Bolan N, Budai A, Buss W, et al. How biochar works, and when it doesn't: A review of mechanisms controlling soil and plant responses to biochar. GCB Bioenergy. (2021) 13:1731–64. doi: 10.1111/gcbb.v13.11
7. Kujawska J. Content of heavy metals in various biochar and assessment environmental risk. J Ecol Eng. (2023) 24:287–95. doi: 10.12911/22998993/166557
8. Haider FU, Coulter JA, Liqun C, Hussain S, Cheema SA, Wu J, et al. An overview on biochar production, its implications, and mechanisms of biochar-induced amelioration of soil and plant characteristics. Pedosphere. (2021) 32:107–30. doi: 10.1016/S1002-0160(20)60094-7
9. Chen D, Liu X, Bian R, Cheng K, Zhang X, Zheng J, et al. Effects of biochar on availability and plant uptake of heavy metals – A meta-analysis. J Environ Manage. (2018) 222:76–85. doi: 10.1016/j.jenvman.2018.05.004
10. Zhu X, Wang X, and Ok YS. The application of machine learning methods for prediction of metal sorption onto biochars. J Hazardous Materials. (2019) 378:1–9. doi: 10.1016/j.jhazmat.2019.06.004
11. Leng L, Zheng H, Shen T, Wu Z, Xiong T, Liu S, et al. Engineering biochar from biomass pyrolysis for effective adsorption of heavy metal: An innovative machine learning approach. Separation Purification Technol. (2025) 361:1–14. doi: 10.1016/j.seppur.2025.131592
12. Wang C, Zhao Y, Gao Y, Chen H, Li X, Zhou B, et al. Interpretable machine learning for predicting heavy metal removal and optimizing biochar characteristics. J Water Process Eng. (2024) 68:1–12. doi: 10.1016/j.jwpe.2024.106484
13. Alaboudi KA, Ahmed B, and Brodie G. Effect of biochar on Pb, Cd and Cr availability and maize growth in artificial contaminated soil. Ann Agric Sci. (2019) 64:95–102. doi: 10.1016/j.aoas.2019.04.002
14. Shen T, Peng H, Yuan X, Liang Y, Liu S, Wu Z, et al. Feature engineering for improved machine-learning-aided studying heavy metal adsorption on biochar. J Hazardous Materials. (2024) 466:1–12. doi: 10.1016/j.jhazmat.2024.133442
15. Ullah A, Ren W-L, Tian P, and Yu X-Z. Biochar as a green strategy in alleviating Cd mobility in soil and uptake in plants: A step towards Cd-free food. Int Biodeterioration Biodegradation. (2024) 190:1–14. doi: 10.1016/j.ibiod.2024.105787
16. Li Y, Gupta R, and You S. Machine learning assisted adsorption performance evaluation of biochar on heavy metals. Front Environ Sci Eng. (2024) 18. doi: 10.1007/s11783-024-1815-4
17. Huang W, Wang L, Zhu J, Dong L, Hu H, Yao H, et al. Application of machine learning in prediction of pb²+ Adsorption of biochar prepared by tube furnace and fluidized bed. Environ Res. (2024) 242:117106. doi: 10.1007/s11356-024-32951-5
18. Köppel M, Witzig N., Klausmann T., Cerrato M., Schweitzer T., Weber J., et al. Predicting NOx emissions in biochar production plants using machine learning. arXiv preprint arXiv:2412.07881. (2024) 1:1–6. doi: 10.48550/arXiv.2412.07881
19. Palansooriya KN, Li J, Dissanayake PD, Suvarna M, Li L, Yuan X, et al. Prediction of soil heavy metal immobilization by biochar using machine learning. Environ Sci Technol. (2022) 56:4747–56. doi: 10.1021/acs.est.1c08302
20. Mosleh MH, Rajabi H, and Sedighi M. Containment of emerging VOC pollutants by biochar. In: Proc. 9th Int. Congress Environ. Geotech, Chania, Greece (2023). Available online at: https://publishing.argo-e.com/uploads/9iceg/ICEG2023-271.pdf (Accessed June 25-28, 2023).
21. Boro D, Chirania M, Verma AK, Chettri D, and Kumar A. Comprehensive approaches to managing emerging contaminants in wastewater: identification, sources, monitoring and remediation. Environ Monit Assess. (2025) 197:456. doi: 10.1007/s10661-025-13809-w
22. Liu C, Balasubramanian P, An J, and Li F. Machine learning prediction of ammonia nitrogen adsorption on biochar with model evaluation and optimization. NPJ clean Water. (2025) 8:1–12. doi: 10.1038/s41545-024-00429-z
23. Gou J, Sajid GH, Sabri MM, El-Meligy M, El Hindi K, and Othman NA. Optimizing biochar yield and composition prediction with ensemble machine learning models for sustainable production. Ain Shams Eng J. (2025) 16:103209. doi: 10.1016/j.asej.2024.103209
24. Ukoba KO and Jen T-C. Biochar and Application of Machine Learning: A Review. In: Biochar - Productive Technologies, Properties and Application. United Kingdom: IntechOpen (2022). p. 1–31. doi: 10.5772/intechopen.108024
25. Al-Bahadili RJ and Drewil GI. Air pollution prediction using LSTM deep learning and metaheuristics algorithms. Measurements Sensors. (2022) 24:100546. doi: 10.1016/j.measen.2022.100546
26. International Biochar Initiative. IBI Biochar Standards, Version 2.1 (2020). Available online at: https://biochar-international.org/wp-content/uploads/2020/06/IBI_Biochar_Standards_V2.1_Final2.pdfcarbon-standards (Accessed November 23, 2015).
27. European Biochar Certificate. Guidelines for a Sustainable Production of Biochar (2023). Available online at: https://www.european-biochar.org/media/doc/2/version_en_10_0.pdfbiochar-international. (Accessed September 15, 2023).
28. Busscher M. Standardization, certification, and development of biochar: lessons learned from wood biochar. Environ Int. (2023) 172:107439. doi: 10.1016/j.envint.2023.107439.european-biochar
29. Case SDC, McNamara NP, Reay DS, Chaplow JS, and Whitaker J. Soil properties and soil greenhouse gas emissions in biochar-amended bioenergy soils incubated under controlled laboratory conditions. United Kingdom: NERC Environmental Information Data Centre (2014). doi: 10.5285/2757e972-a7fe-494d-92c3-c3205dfdef19
30. Philips C. Data from "Towards predicting biochar impacts on plant-available soil nitrogen content,". United States of America Data.gov (2023). Available online at: https://catalog.data.gov/dataset/data-from-towards-predicting-biochar-impacts-on-plant-available-soil-nitrogen-content-e352f (Accessed April 10, 2024).
Keywords: biochar, classification, LSTM, machine learning, random forest regression, environmental safety
Citation: Roy SD, Khekare G, Chhajed S and Victor AS (2025) Integrating classification, regression, and time series models to assess biochar safety, optimize pollutant removal, and predict environmental impacts. Front. Soil Sci. 5:1661097. doi: 10.3389/fsoil.2025.1661097
Received: 08 July 2025; Accepted: 02 September 2025;
Published: 23 September 2025.
Edited by:
Naser A. Anjum, Aligarh Muslim University, IndiaReviewed by:
Jinsung An, Hanyang Universiy, Republic of KoreaXiaoli Zhu, Northwest University, China
Copyright © 2025 Roy, Khekare, Chhajed and Victor. This is an open-access article distributed under the terms of the Creative Commons Attribution License (CC BY). The use, distribution or reproduction in other forums is permitted, provided the original author(s) and the copyright owner(s) are credited and that the original publication in this journal is cited, in accordance with accepted academic practice. No use, distribution or reproduction is permitted which does not comply with these terms.
*Correspondence: Ganesh Khekare, Z2FuZXNoLmtoZWthcmVAdml0LmFjLmlu