 Richard Solórzano-Acosta1,2
 Juancarlos Cruz-Luis1
 Rodolfo Chuchon-Remon3
 Lorena Estefani Romero-Chávez4Andi Lozano5Nery Gaona-Jimenez5
 Geomar Vallejos-Torres3,5*
- 1Dirección de Servicios Estratégicos Agrarios, Instituto Nacional de Innovación Agraria (INIA), Lima, Peru
- 2Facultad de Ciencias Ambientales, Universidad Científica del Sur (UCSUR), Lima, Peru
- 3Dirección de Servicios Estratégicos Agrarios, Instituto Nacional de Innovación Agraria (INIA). Estación Experimental Agraria El Porvenir, Juan Guerra, Peru
- 4Dirección de Servicios Estratégicos Agrarios, Instituto Nacional de Innovación Agraria (INIA), Estación Experimental Agraria Pichanaki, Pichanaqui, Peru
- 5Facultad de Ciencias Agrarias, Universidad Nacional de San Martín, Tarapoto, Peru
Introduction: Land-use change from primary forests to agricultural croplands can degrade soil quality by depleting soil organic carbon (SOC), total nitrogen (STN), and soil-available potassium (SAK). The magnitudes and thresholds of these losses in the Peruvian Amazon remain insufficiently quantified.
Methods: We assessed six land-use systems—two primary forests and four croplands (coffee, cocoa, oil palm, camu camu)—collecting 72 surface soil samples (0–20 cm) from 12 subplots per system using pit sampling. SOC, STN, and SAK were measured with standard laboratory procedures and compared across land uses.
Results: The humid primary forest (WE–PF) had the highest nutrient status (SOC 118.99 t C ha⁻¹; STN 0.35%; SAK 181.83 mg kg⁻¹). The lowest values occurred in croplands, especially camu camu (SOC 23.93 t C ha⁻¹; STN 0.08%). Forest-to-cropland conversion was associated with average reductions of 58.98% (SOC), 59.49% (STN), and 59.66% (SAK). Among crops, coffee showed the smallest deficit (18.04%), whereas camu camu showed the largest SOC deficit (30.92%).
Discussion: Converting forests to croplands critically depletes SOC, STN, and SAK, indicating substantial nutrient losses and concomitant deterioration of soil quality. These findings support conserving primary forests and promoting agroforestry and soil-restorative practices to mitigate degradation in the Peruvian Amazon.
1 Introduction
Rapid urbanization, population migration, and ecological restoration policies have deep impacts on human–land relationships, and the intensity of land use (1). Between 2021 and 2023, Peru has lost more than 3 million ha of Amazonian and dry forests as a result of deforestation (2). This represents a substantial loss and contributes to increased ecosystem vulnerability (3). Eighty percent of changes in forest cover worldwide are attributable to agricultural expansion and intensification (4, 5). This makes food production the main direct driver of global deforestation, threatening the security of the ecological environment.
The conversion of forests to agricultural land has been shown to deplete organic carbon and total nitrogen reserves (6), increase soil erosion (7), and promote the loss of key nutrients such as potassium. This problem stems from the type of land use, which affects soil properties and plant community characteristics and probably soil quality; therefore, the loss of forest cover is a global problem that alters ecosystems and contributes to carbon dioxide emissions (8, 9).
In forests, biogeochemical cycles are favored by the presence of leaf litter and root development, which incorporate organic matter above and below the soil surface (10). Therefore, organic carbon and essential nutrients such as nitrogen and potassium depend on soil cover (11). Carbon plays a fundamental role in the nitrogen cycle, as its presence promotes the retention of this nutrient within the ecosystem. According to Cantúy (12), soils that receive a simultaneous input of carbon and nitrogen—from the recycling of organic matter—tend to conserve nitrogen more efficiently. This is because carbon stimulates microbial activity, which promotes nitrogen immobilization and reduces losses through leaching or denitrification (13).
Conversely, nitrogen is important in the soil and plant nutrition, microbial growth, and organic matter degradation. (12). Erosion is a serious problem on different spatial (from the pedon to the watershed) and temporal scales. Soil erodibility is a factor of concern worldwide due to the historical prevalence of crop production involving plowing, harrowing, cultivation, and other forms of soil disturbance through repeated tillage (14). Excessive tillage can result in poor agro-environmental management, leading to nutrient loss and soil degradation (15), with serious implications for productivity, non-point source pollution, and carbon dynamics (16). In addition, it significantly influences ecosystem and agroecosystem functions, soil fertility, water availability, soil organic matter content, microbial fauna presence, flood intensification, and others (17–19).
Crops such as coffee (Coffea arabica L.), cocoa (Theobroma cacao L.), oil palm tree (Elaeis guineensis), and camu camu (Myrciaria dubia) are widely planted in the Peruvian Amazon, causing forest loss. Coffee is one of Peru’s main export products (20), with ever-increasing plantations, this crop is considered a driver of deforestation (21). Cocoa is a strategic export crop and an alternative to coca leaves, with 60% of the global genetic biodiversity located in Peru. Camu camu is widely distributed in the Amazon basin, mainly on the banks of rivers and lakes in Peru, and is a relatively new species as a crop. The first plantations were established in 1995 for reforestation purposes (22). Oil palm is part of migratory agriculture, with increasingly extensive monoculture plantations (23).
Amazonian deforestation, meanwhile, is directly related to economic activities (24), the main causes being migratory agriculture, timber extraction, road construction, coca cultivation, and illegal mining (25). These changes in land use have an impact on soil SOC, N, and K. There is a striking contrast between primary forests, which have higher SOC content and density, and agricultural crops, which have a lower proportion of sequestered SOC, contributing to the increase of CO2 in the atmosphere (9). Consequently, the present study evaluated the nutritional impact on the soil of the forestsconversion into agricultural production of coffee, cocoa, oil palm, and camu camu in the Peruvian Amazon.
2 Materials and methods
2.1 Study area
The study was conducted in five provinces of the San Martín region and one province of the Loreto region in eastern Peru, between August and December 2024 (Figure 1).
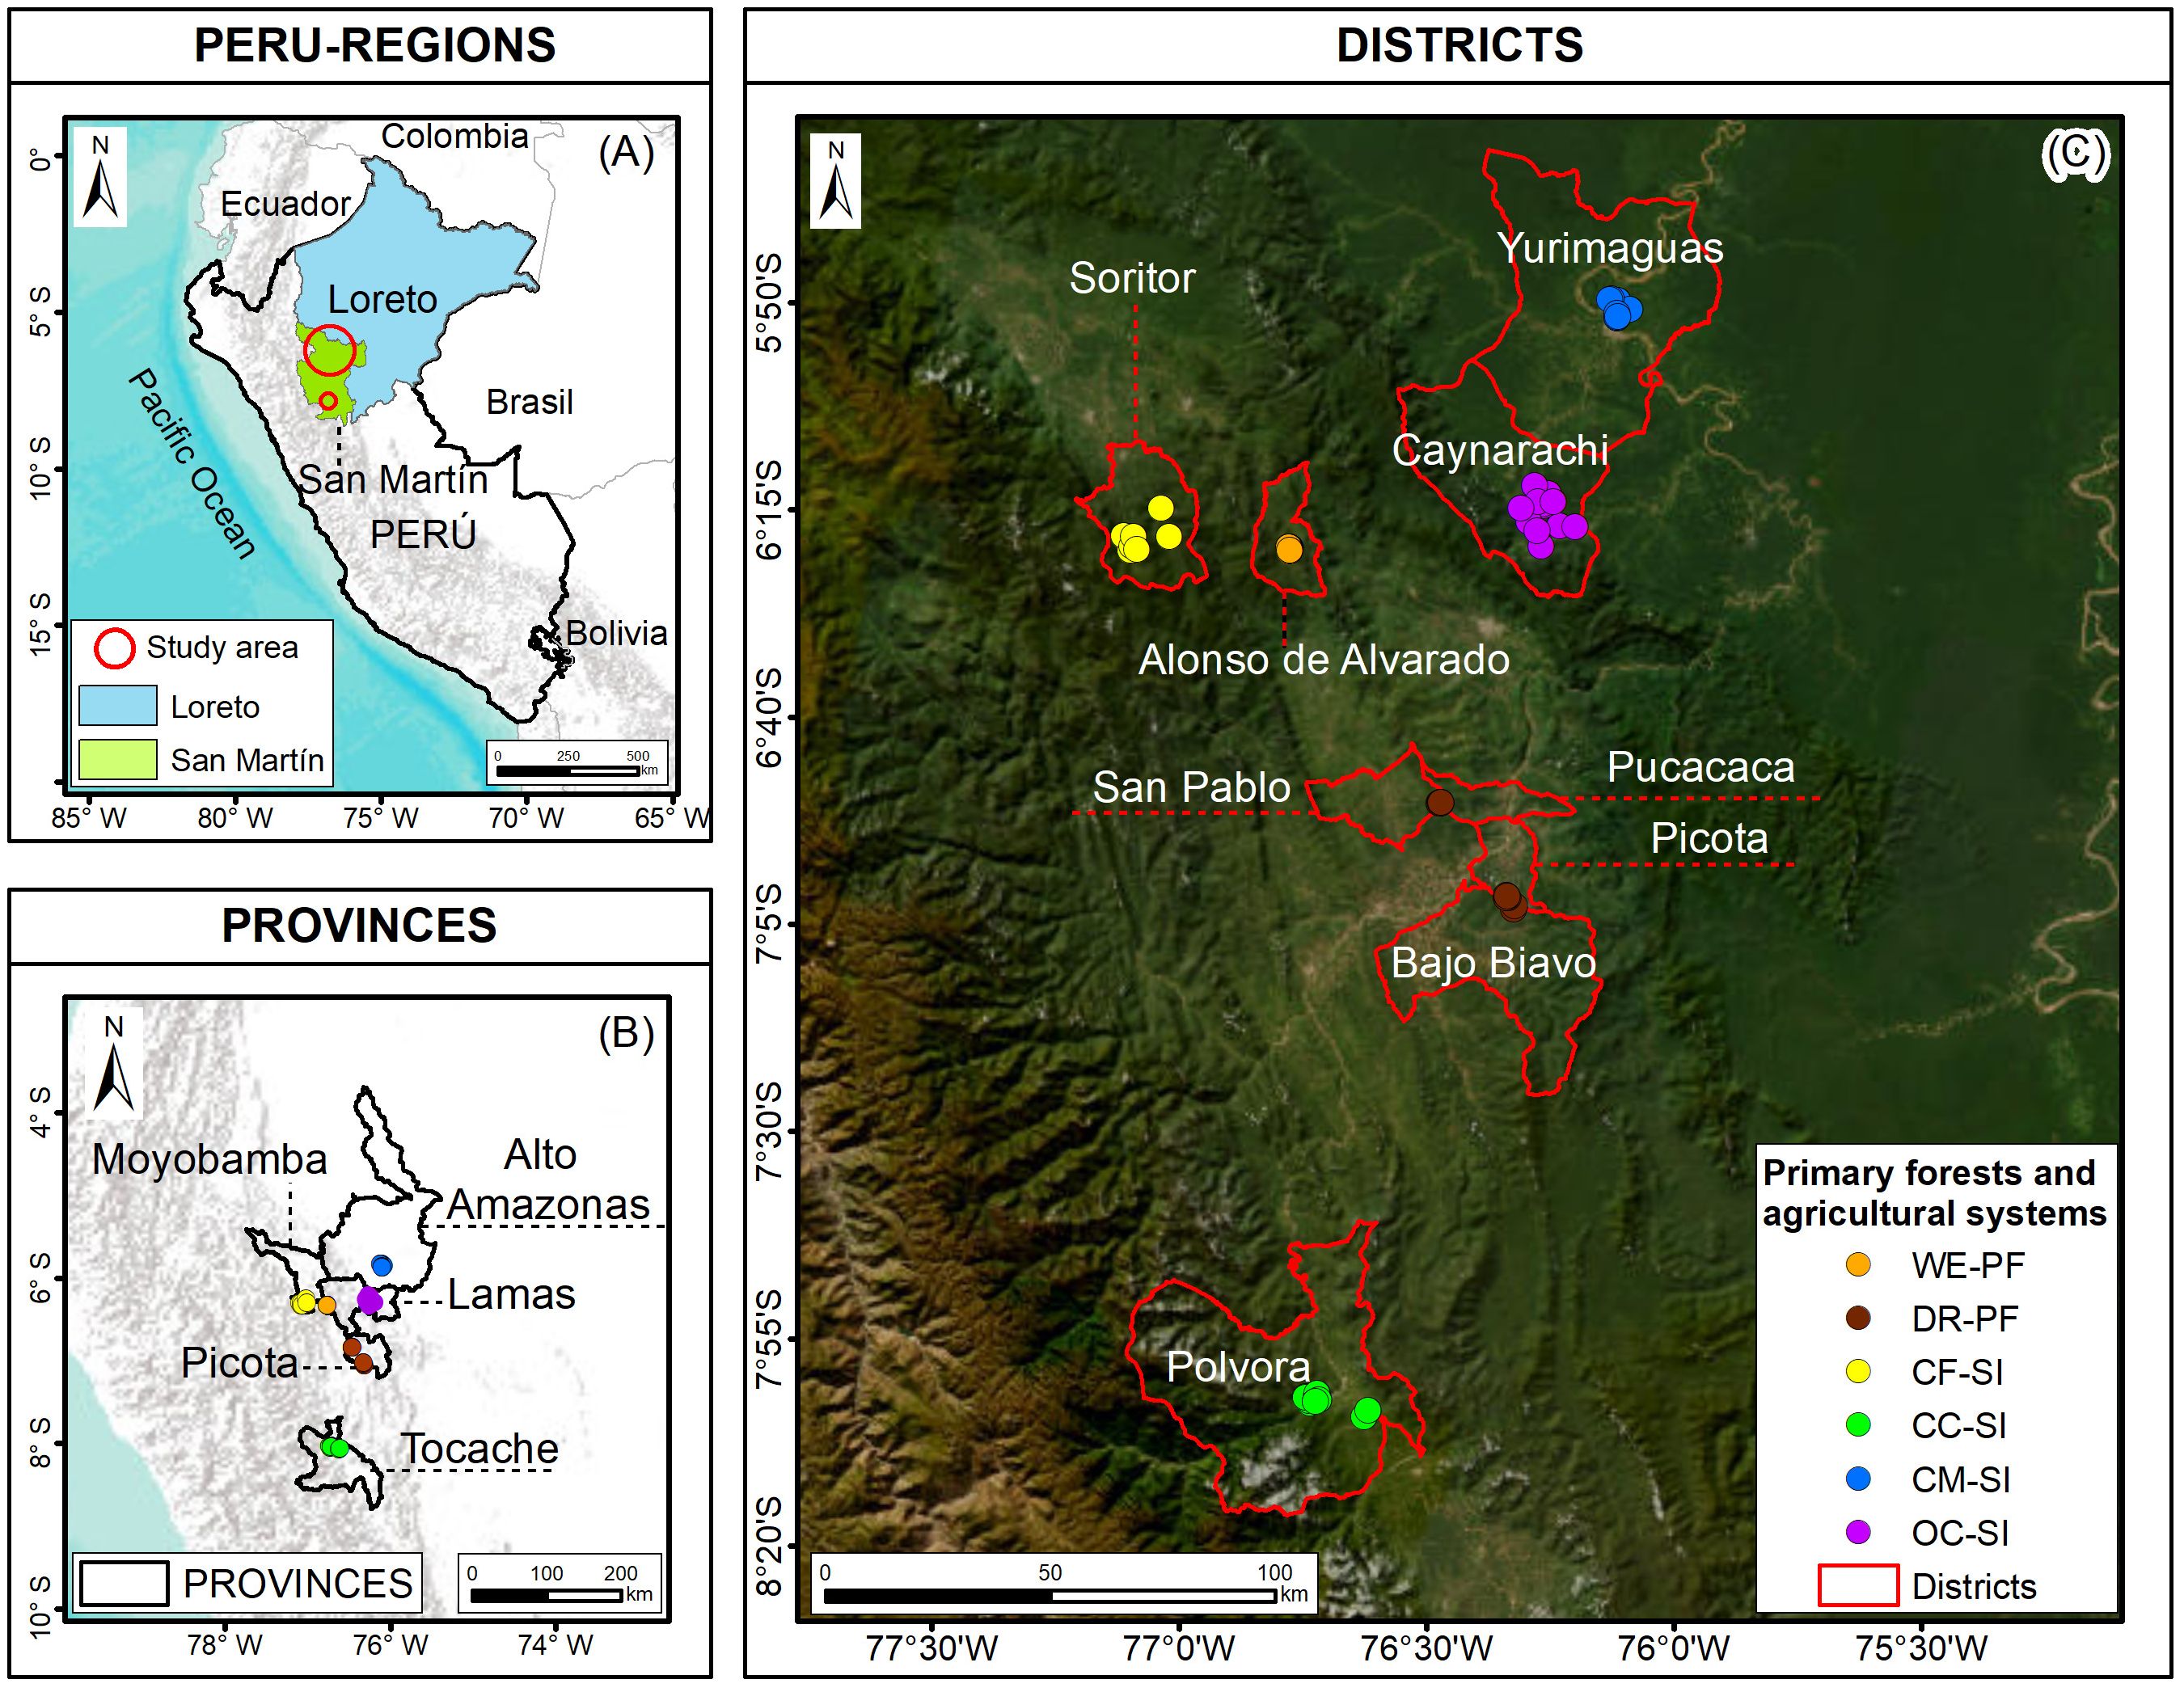
Figure 1. Location of the study area in the Peruvian Amazon: (A) country and region; (B) provincial boundaries; (C) district boundaries and sampling points. WE-PF, wet primary forest; DR-PF, dry primary forest; CF-SI, coffee agroforestry system; CC-SI, cocoa agroforestry system; CM-SI, camu camu system; OC-SI, oil palm tree system.
The San Martín region covers an area of 51,253.31 km2, where a subtropical and tropical climate predominates, with two distinct seasons: a dry season from June to September and a rainy season from October to May. The temperature varies between 23°C and 27°C, and the average annual rainfall is 1,500 mm (add source). In San Martín, the province of Lamas is located at an altitude of between 310 and 814 m.a.s.l, with an average annual rainfall of 1,013 mm and an average temperature of 32°C. August and December are the summer months, and March to April are the winter months (8). This province is home to two districts under study: Alonso de Alvarado-Roque and Caynarachi. The province of Picota has an average temperature of 26°C and annual precipitation of 1,164.4–1,433.3 mm (9, 26). The province of Moyobamba is located between 635 and 1,113 m.a.s.l and has a humid and warm climate, with an average annual maximum temperature of 27 to 35°C and annual rainfall of 1,512 mm (mentioned by 27). The province of Tocache is located at an altitude of 483 m.a.s.l, with maximum and minimum temperatures of 31° and 21°C, respectively (28).
The Loreto region is one of the areas with the greatest species richness within Peruvian territory (29). In Loreto, the province of Alto Amazonas, and specifically the district of Yurimaguas, is located in the northwest of the Peruvian Amazon, at an altitude of 182 m.a.s.l. It has a warm climate, with a rainy season from November to May, an average annual temperature of 26°C, and annual precipitation between 3,000 and 4,000 mm (30). It is estimated that 25,000 hectares of forest cover were lost in the district of Yurimaguas between 2000 and 2015, with these areas being used for commercial crops and grazing (31).
Table 1 details the background and management of each production system for coffee, oil palm, camu camu, and cacao. It includes information such as the age and prior land use before crop establishment, fertilization practices, logging, burning, and tillage activities, as well as whether the crop is grown under the shade of tree species.

Table 1. Characteristics of productive systems and forests.
2.2 Sampling design
Six study areas were identified, distributed in four agricultural plantation systems and two systems of primary forest. Of these, five studies areas were located in the San Martin region and one in Loreto region. The areas included: (1) wet primary forest (WE-PF) in the district of Alonso de Alvarado-Roque, Lamas province; (2) dry primary forest (DR-PF) in Pucacaca district, Picota province; (3) coffee agroforestry system (CF-SI) in the district of Soritor, Moyobamba province; (4) cocoa agroforestry system (CC-SI) in the district of Pólvora, Tocache province; (5) oil palm tree system (OC-SI) in the district of Caynarachi, Lamas province; and (6) camu camu system (CM-SI) in the district of Yurimaguas, province of Alto Amazonas, Loreto region.
Soil samples were randomly collected at depths of 0–20 cm from six study areas by digging test pits in each management system, with 12 subplots considered per system (for a total of 72 soil samples). This depth was chosen because the majority of the SOC is retained in the topsoil layer (approximately 20 cm), decreasing with increasing soil depth (32).
2.3 Computation of edaphic and nutritional parameters of the soil
The samples collected were analyzed at the Soil, Water, and Foliar Laboratory (LABSAF) at the El Porvenir Agricultural Experiment Station of the National Institute of Agrarian Innovation (INIA) in Peru. Soil texture was measured by the hydrometer texture method, pH was measured with a potentiometer suspended in a 1:2.5 soil-water solution (33), and soil organic matter (SOM) was measured by the NOM-021-RECNAT-2002 method. Total nitrogen was analyzed by the Kjeldahl method (34), available phosphorus by Olsen and Sommers (35), and available potassium by NOM-021-RECNAT-2000 (36).
2.4 Determination of organic carbon density and saturated carbon deficit in soil
Soil organic carbon (SOC) was estimated in the laboratory through the method developed by Walkley and Black (37), via Equation 1:
where CO is the soil organic carbon content (%), Pf is the soil sampling depth (cm) and DA is the bulk density (g/cm3).
The soil organic carbon density (SOCD) was computed by the formule of Orton et al. (38), via Equation 2:
where DSOC is the density of SOC (t C ha-1), Hh is the thickness of soil (cm), DAh is the bulk density of soil (g/cm3), SOC (SOCh) is in t C ha-1 and volume percentage of the fraction is >2 mm (Ch).
Saturated carbon was estimated by the equation of Hassink (39) (Equation 3). The value of C stable was compared to the C measured in the soil and, from this, saturated C deficit was estimated (40) (Equation 4).
2.5 Calculation of soil erosion susceptibility.
Soil erodibility was calculated using the model proposed by Williams et al. (41), as shown in Equation 5:
where SAN: sand presence (%); SIL: silt (%); CLA: clay (%); SOC: soil organic carbon (%); SAN/100.
2.6 Statistical analyses
Boxplots were used to explore the distribution and variability of the data. Univariate ANOVA was applied to determine significant differences between the means of the groups classified according to land use. This approach, verified the assumptions of normality and homogeneity of variances using the Shapiro-Wilk and Bartlett tests, respectively. In the case of significant differences (p < 0.05), Tukey HSD identified distinct groups using grouping letters. In addition, a Pearson correlation matrix was constructed to evaluate the linear relationships between carbon indicators and soil physicochemical parameters, including the respective p-values indicating the level of statistical significance of each relationship. The figures were generated in RStudio version 4.5.0 (42) using several specialized libraries. Figures 2–4, associated with post hoc mean comparison tests (Tukey HSD), were produced with the base stats package in combination with ggplot2, dplyr, readxl, and patchwork for data manipulation, analysis, and visualization. Figure 5, corresponding to the USDA textural triangle, was created with the soiltexture package. For Figure 6, which presents the correlation matrix, the dplyr and corrplot packages were employed. Finally, Figure 7, related to the principal component analysis (PCA), was generated using FactoMineR, factoextra, and patchwork, allowing for clear, reproducible, and scientifically robust visualizations.
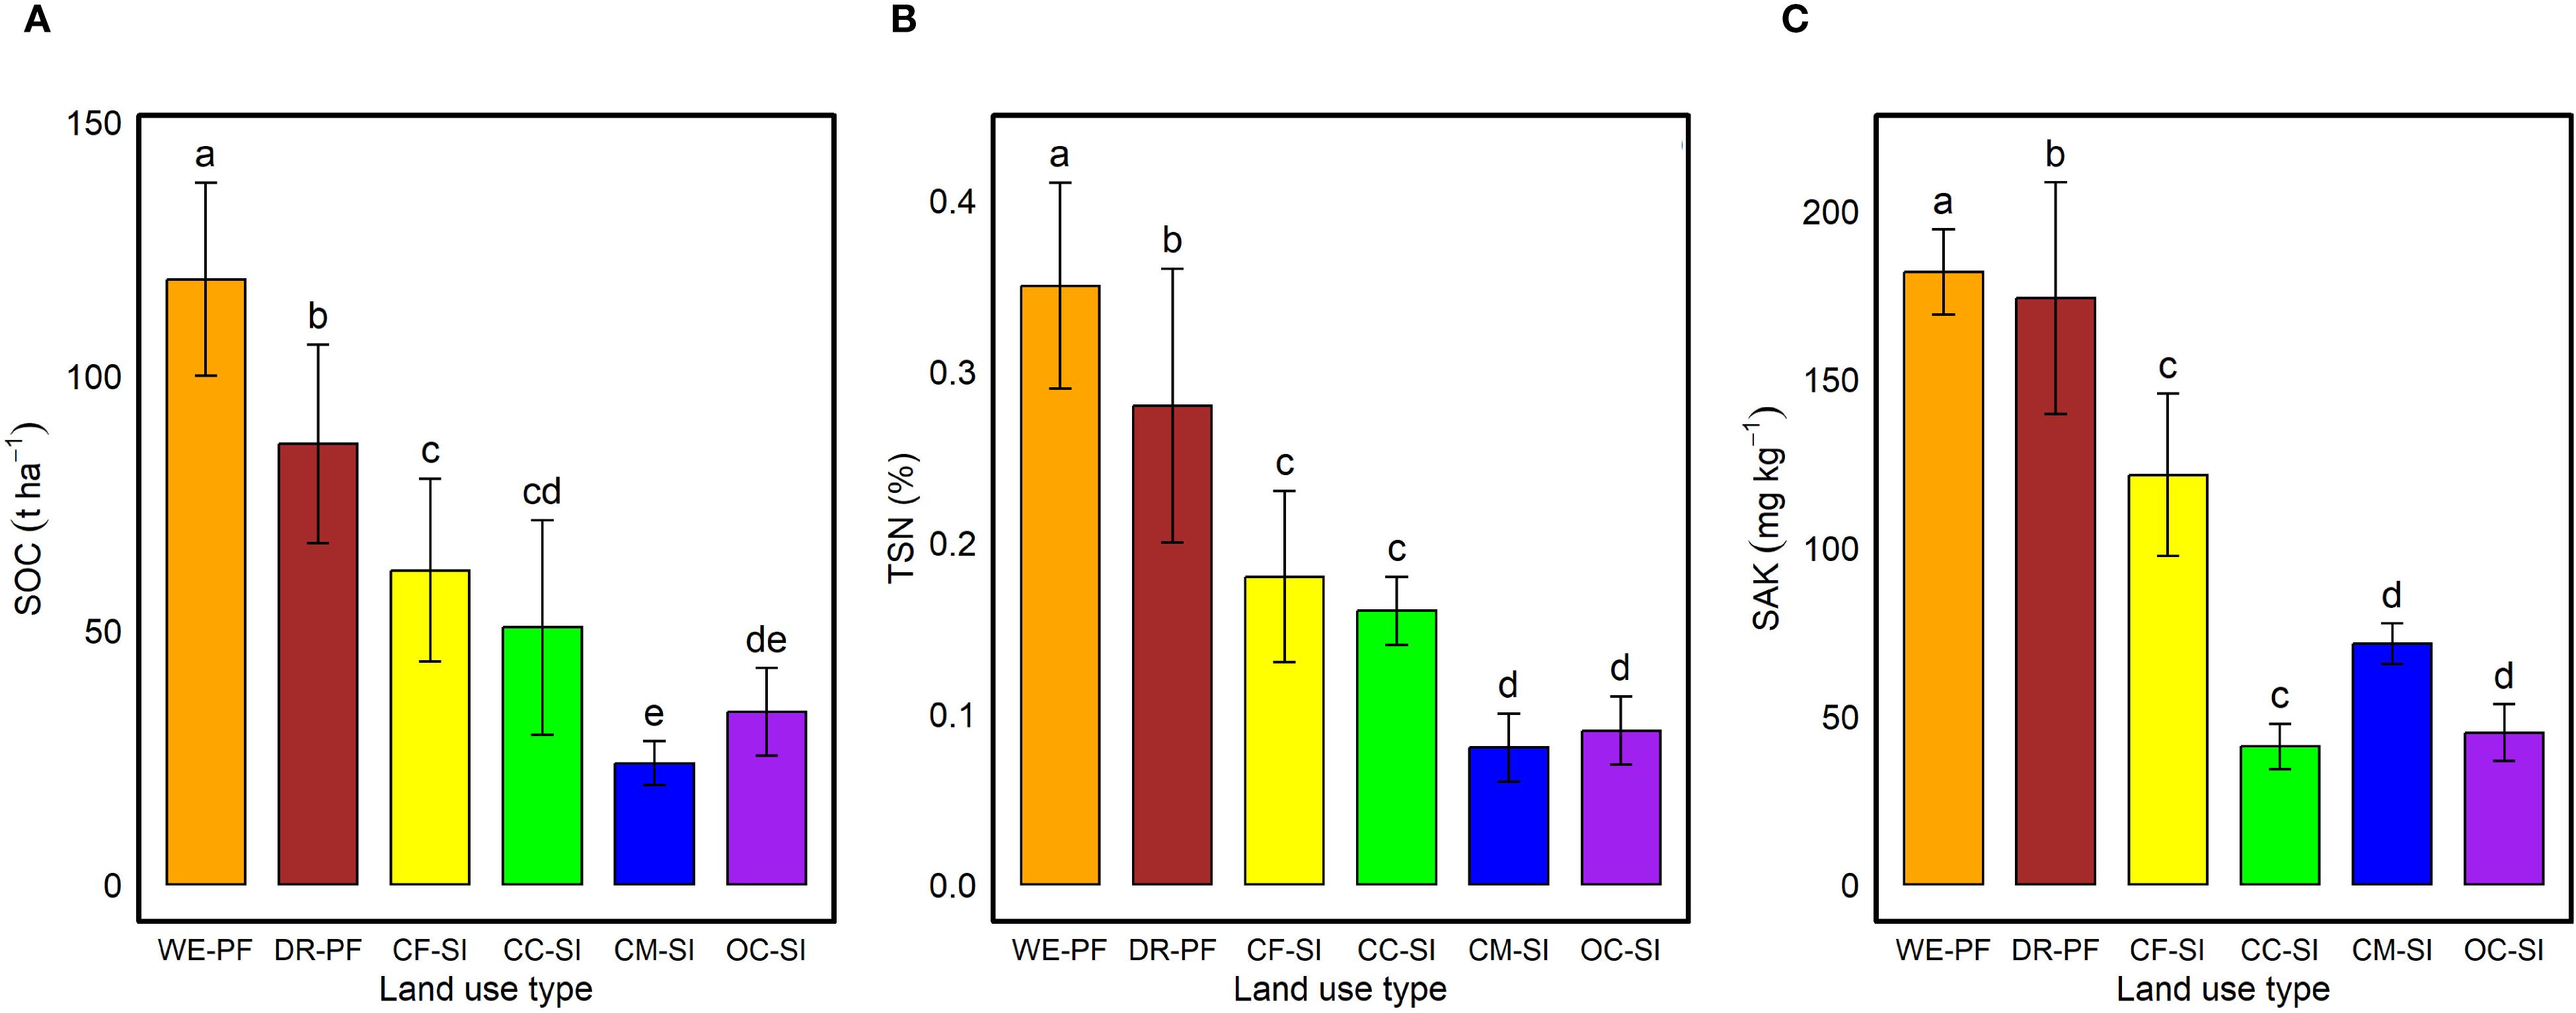
Figure 2. Tukey test (p < 0.05) for (A) soil organic carbon (SOC); (B) total soil nitrogen (TSN); and (C) available soil potassium (SAK) across different land-use types: WE–PF, wet primary forest; DR–PF, dry primary forest; CF–SI, coffee agroforestry system; CC–SI, cocoa agroforestry system; CM–SI, camu camu system; OC–SI, oil palm system. Different letters above the bars indicate significant differences among land-use types.
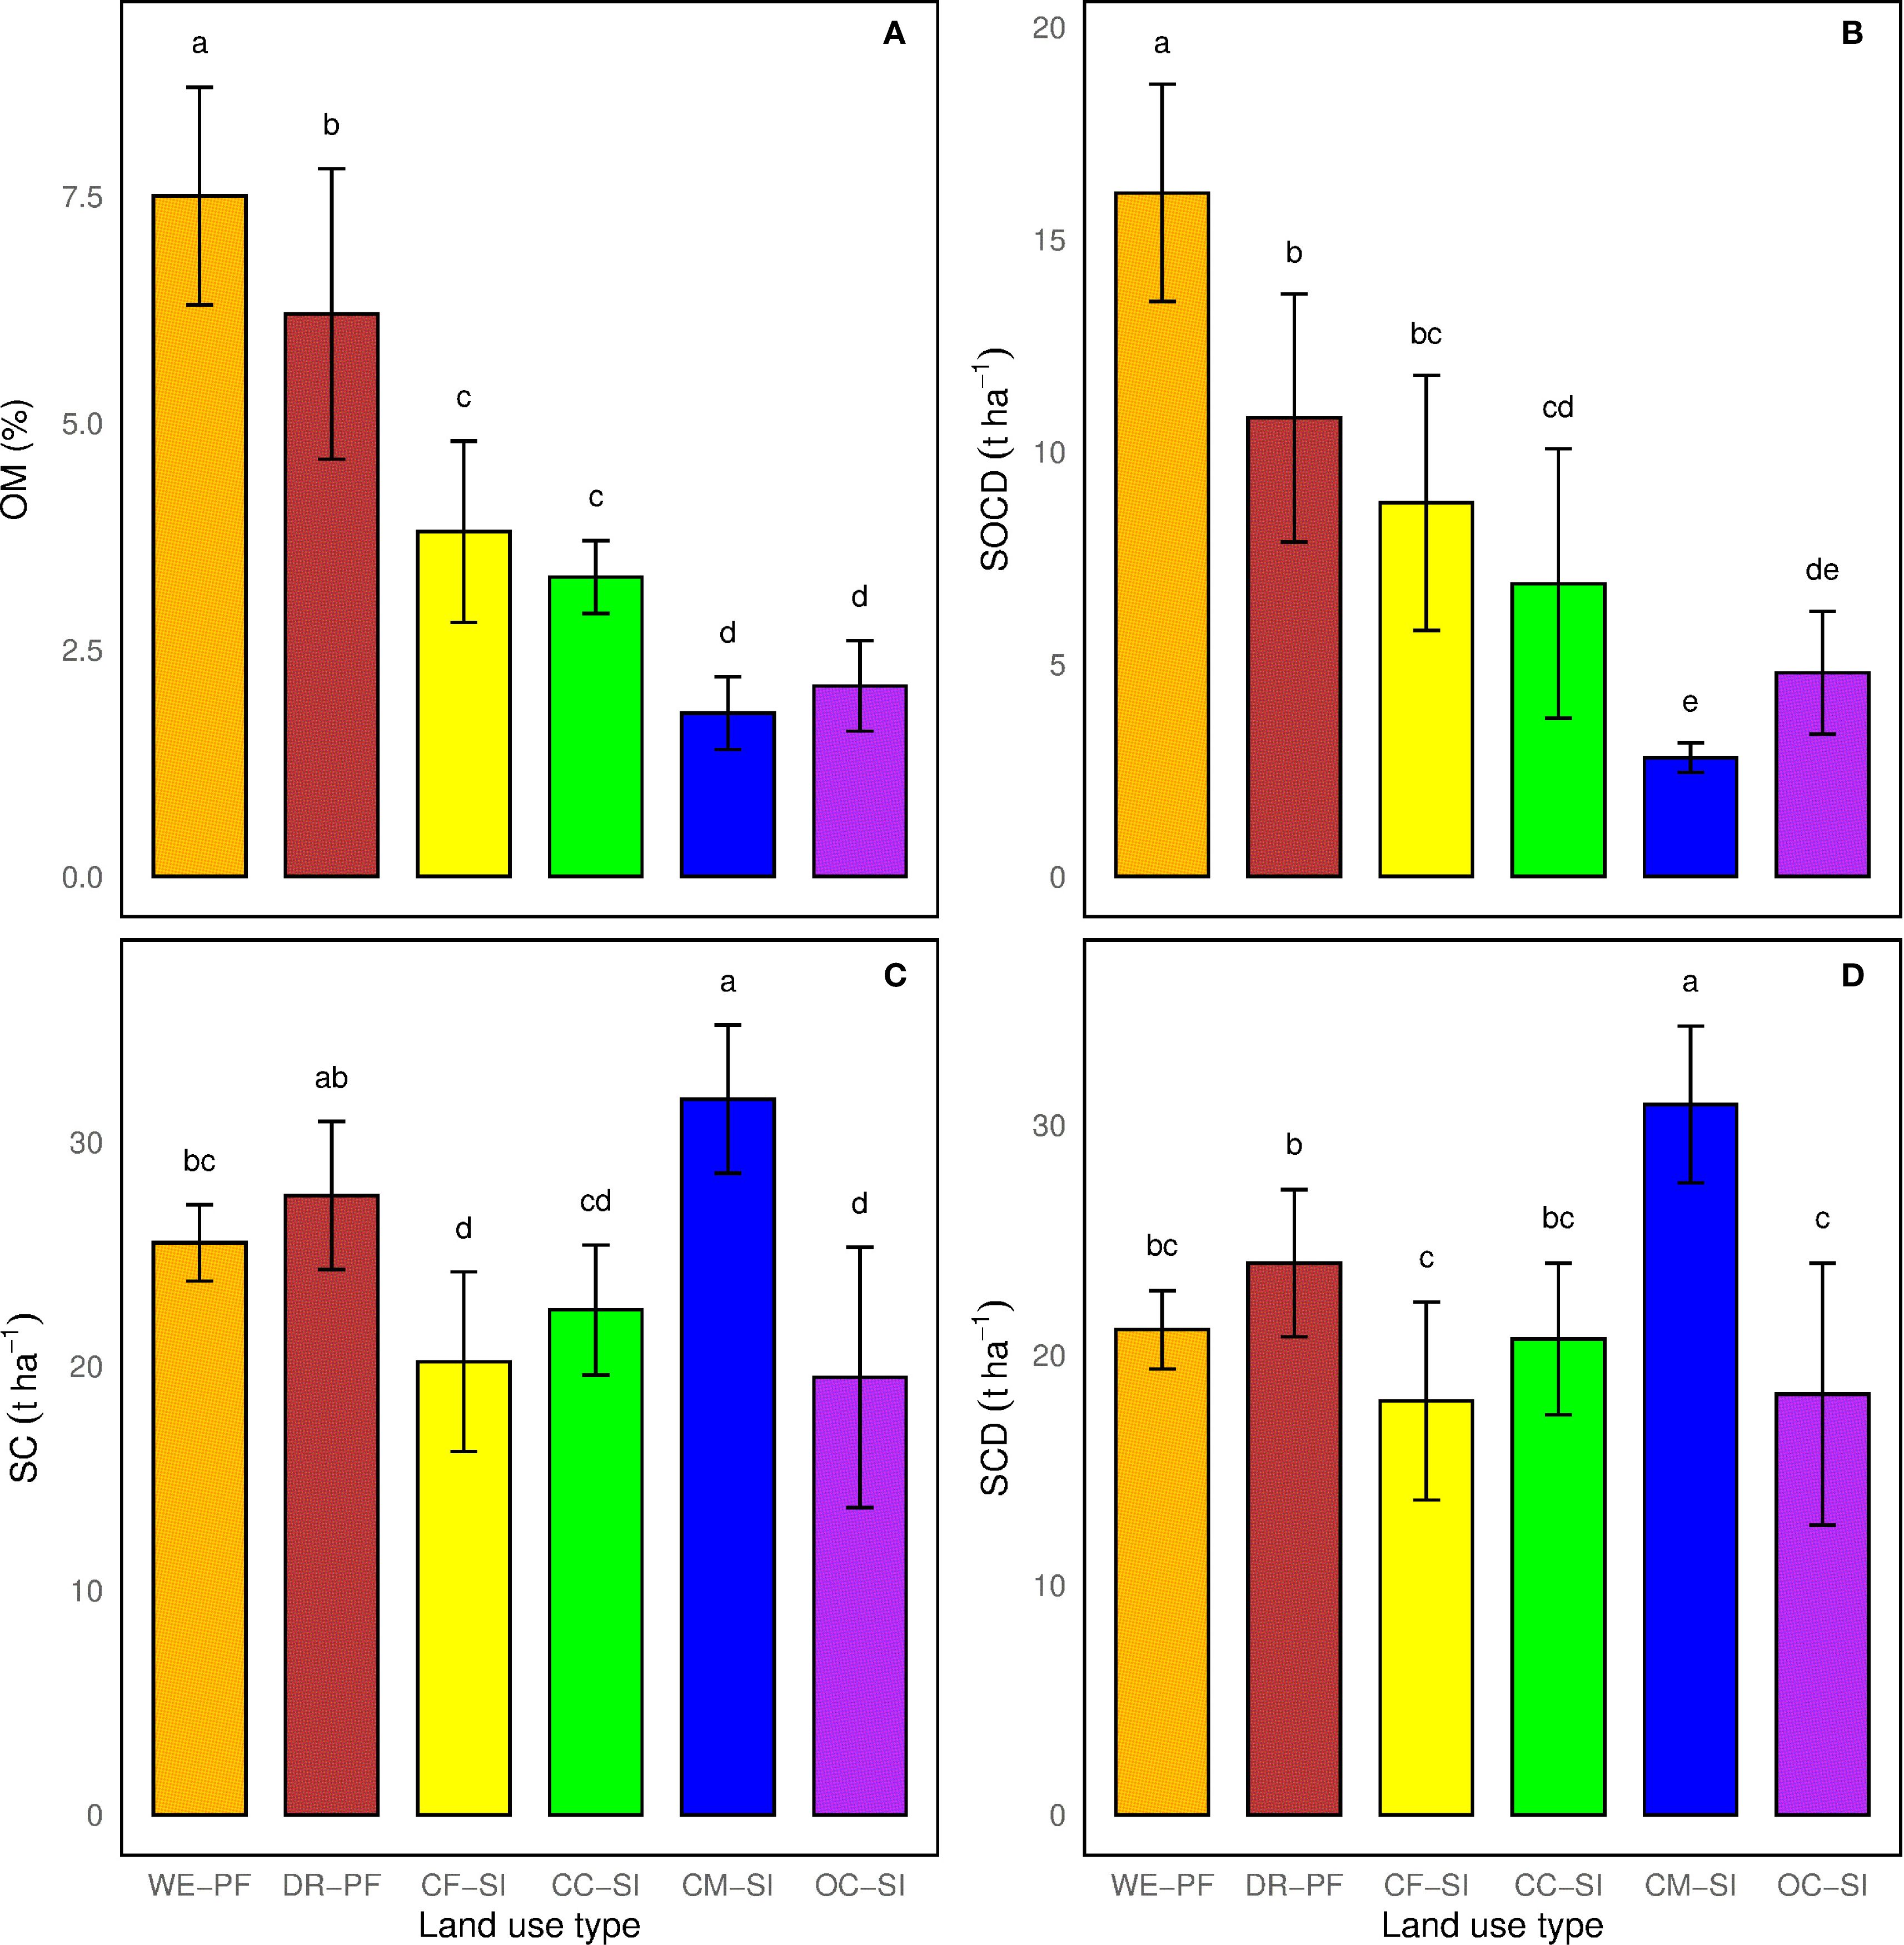
Figure 3. Tukey test (p < 0.05) for (A) organic matter (OM); (B) soil organic carbon density (SOCD); (C) saturated carbon (SC); and (D) saturated carbon deficit (SCD) under different land-use types: WE–PF, wet primary forest; DR–PF, dry primary forest; CF–SI, coffee agroforestry system; CC–SI, cocoa agroforestry system; CM–SI, camu camu system; OC–SI, oil palm tree system. Different letters above the bars indicate significant differences among land-use types.
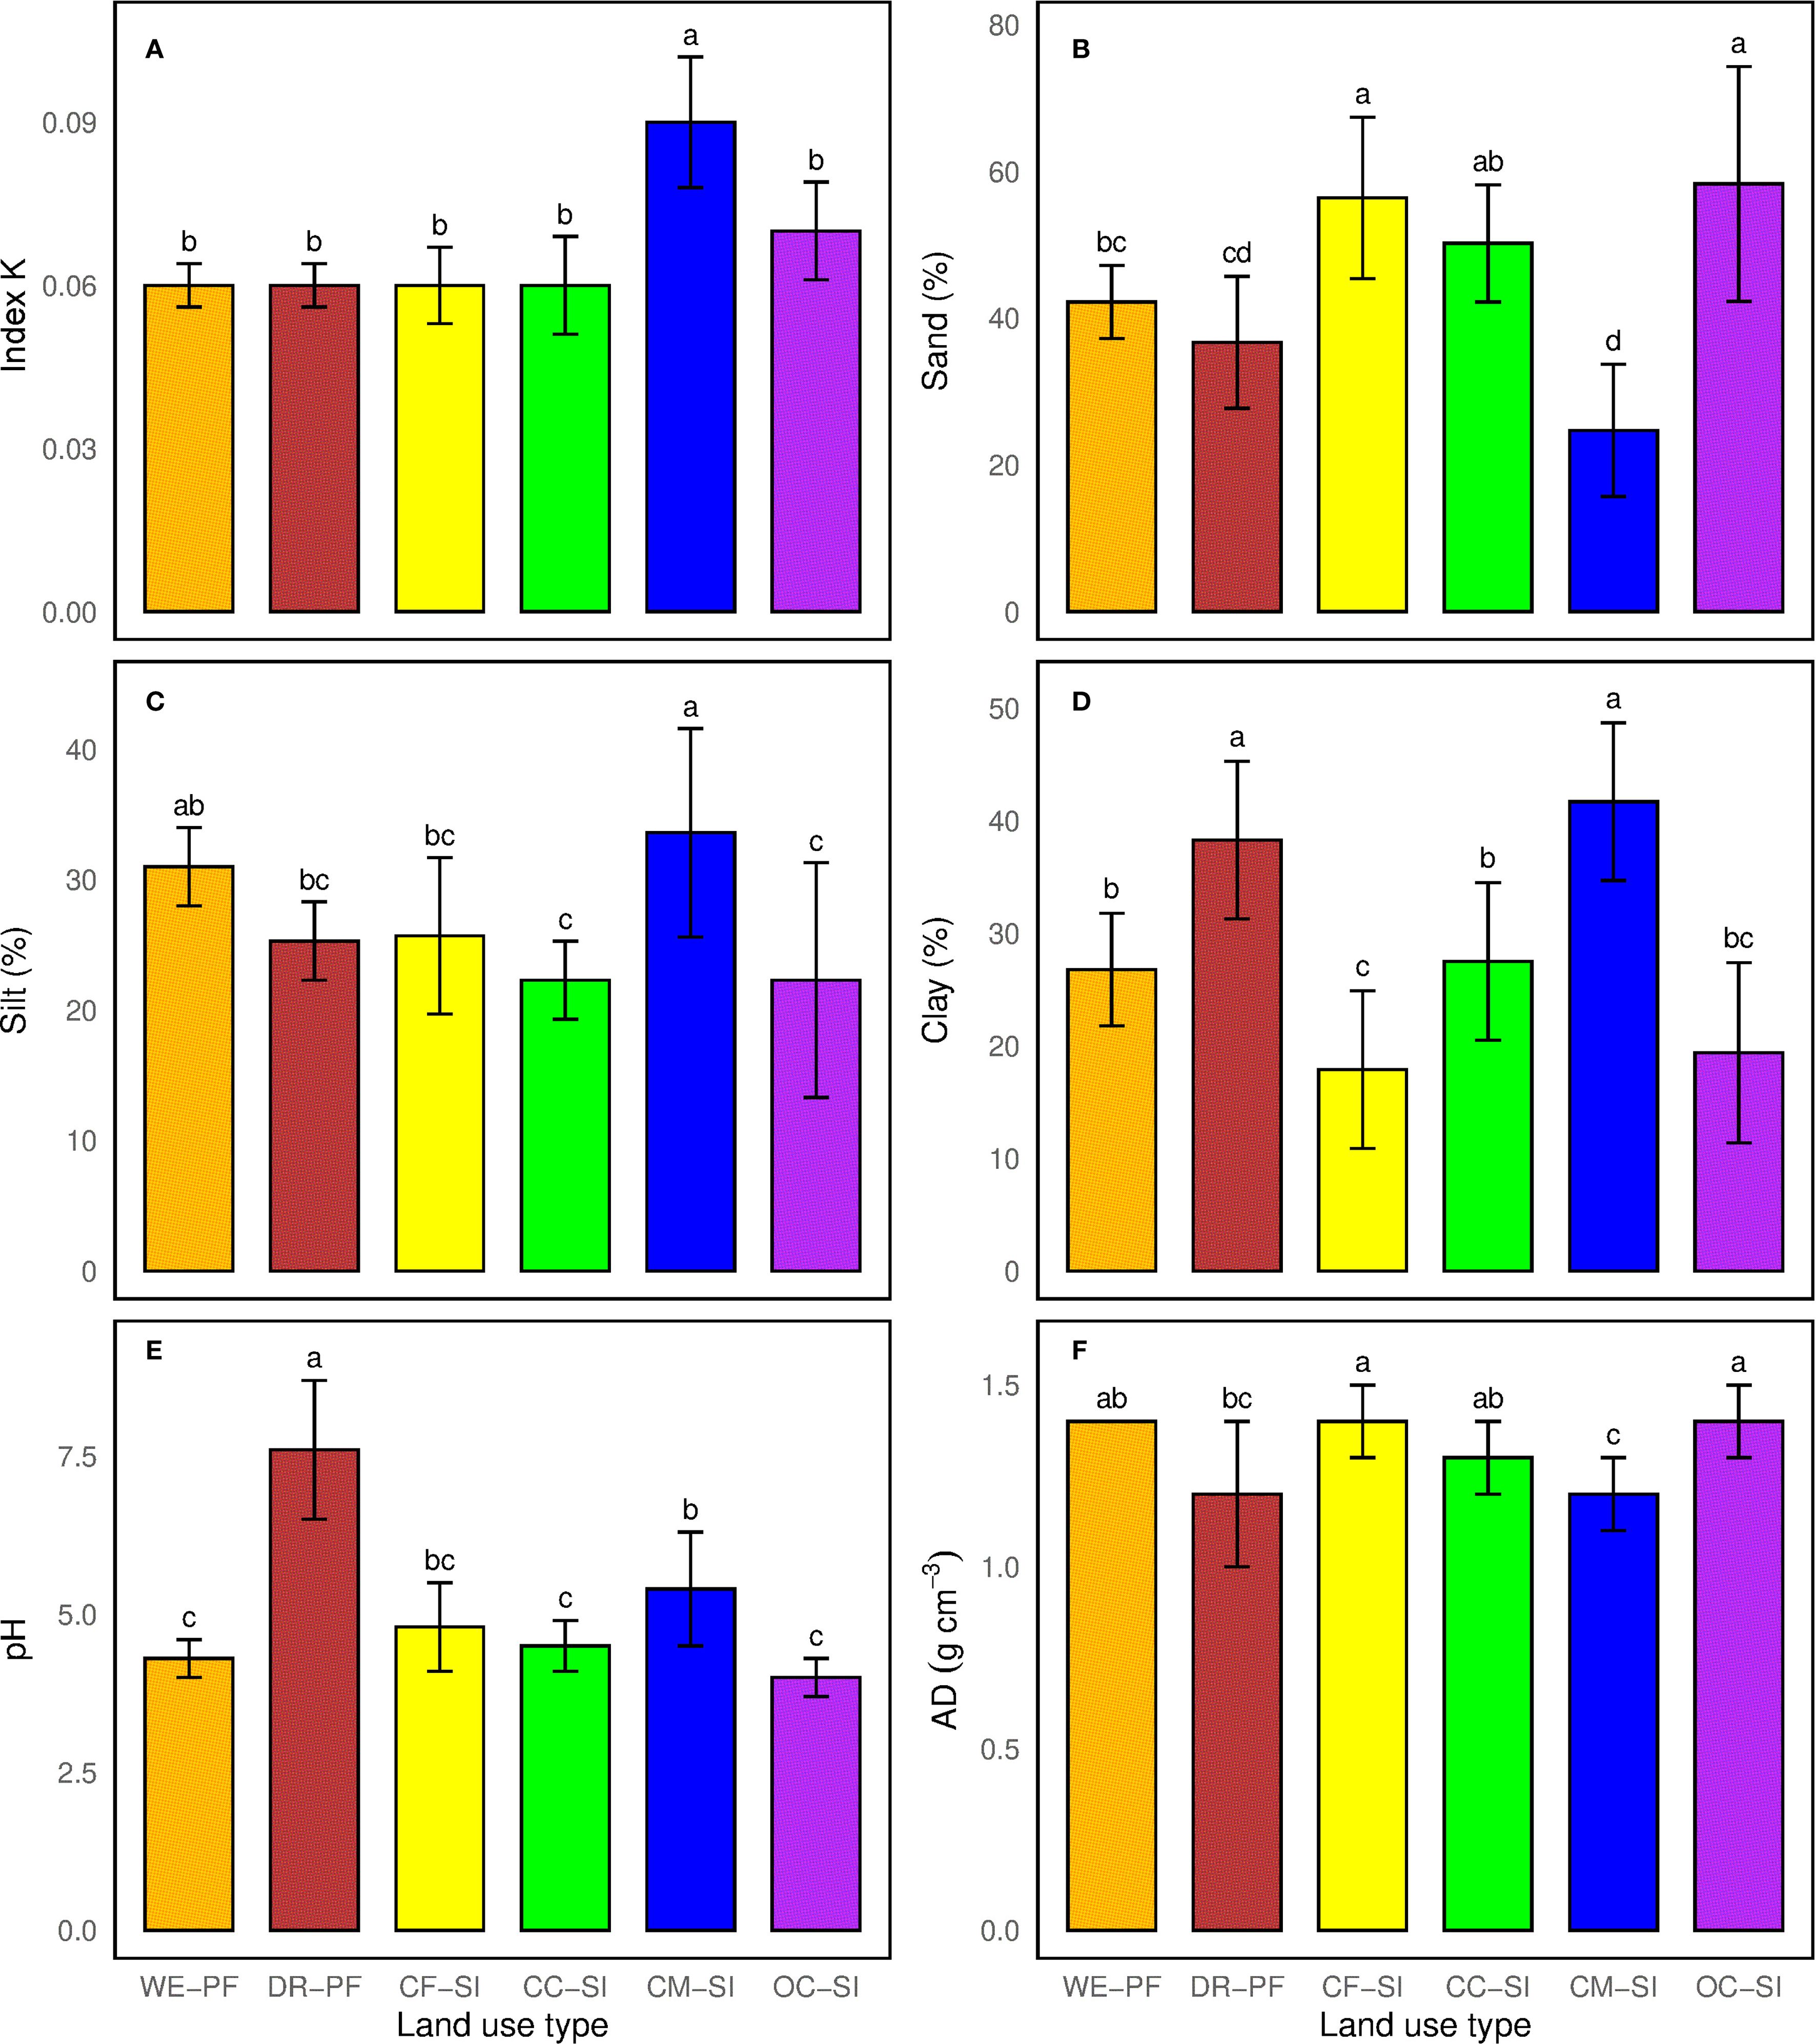
Figure 4. Tukey test (p < 0.05) for (A) soil erodibility K.; (B–D) textural fractions: sand, silt, and clay, respectively; (E) hydrogen potential (pH); and (F) bulk density (AD) under different land-use types: WE–PF, wet primary forest; DR–PF, dry primary forest; CF–SI, coffee agroforestry system; CC–SI, cocoa agroforestry system; CM–SI, camu camu system; and OC–SI, oil palm tree system. Different letters above the bars indicate significant differences among land-use types.
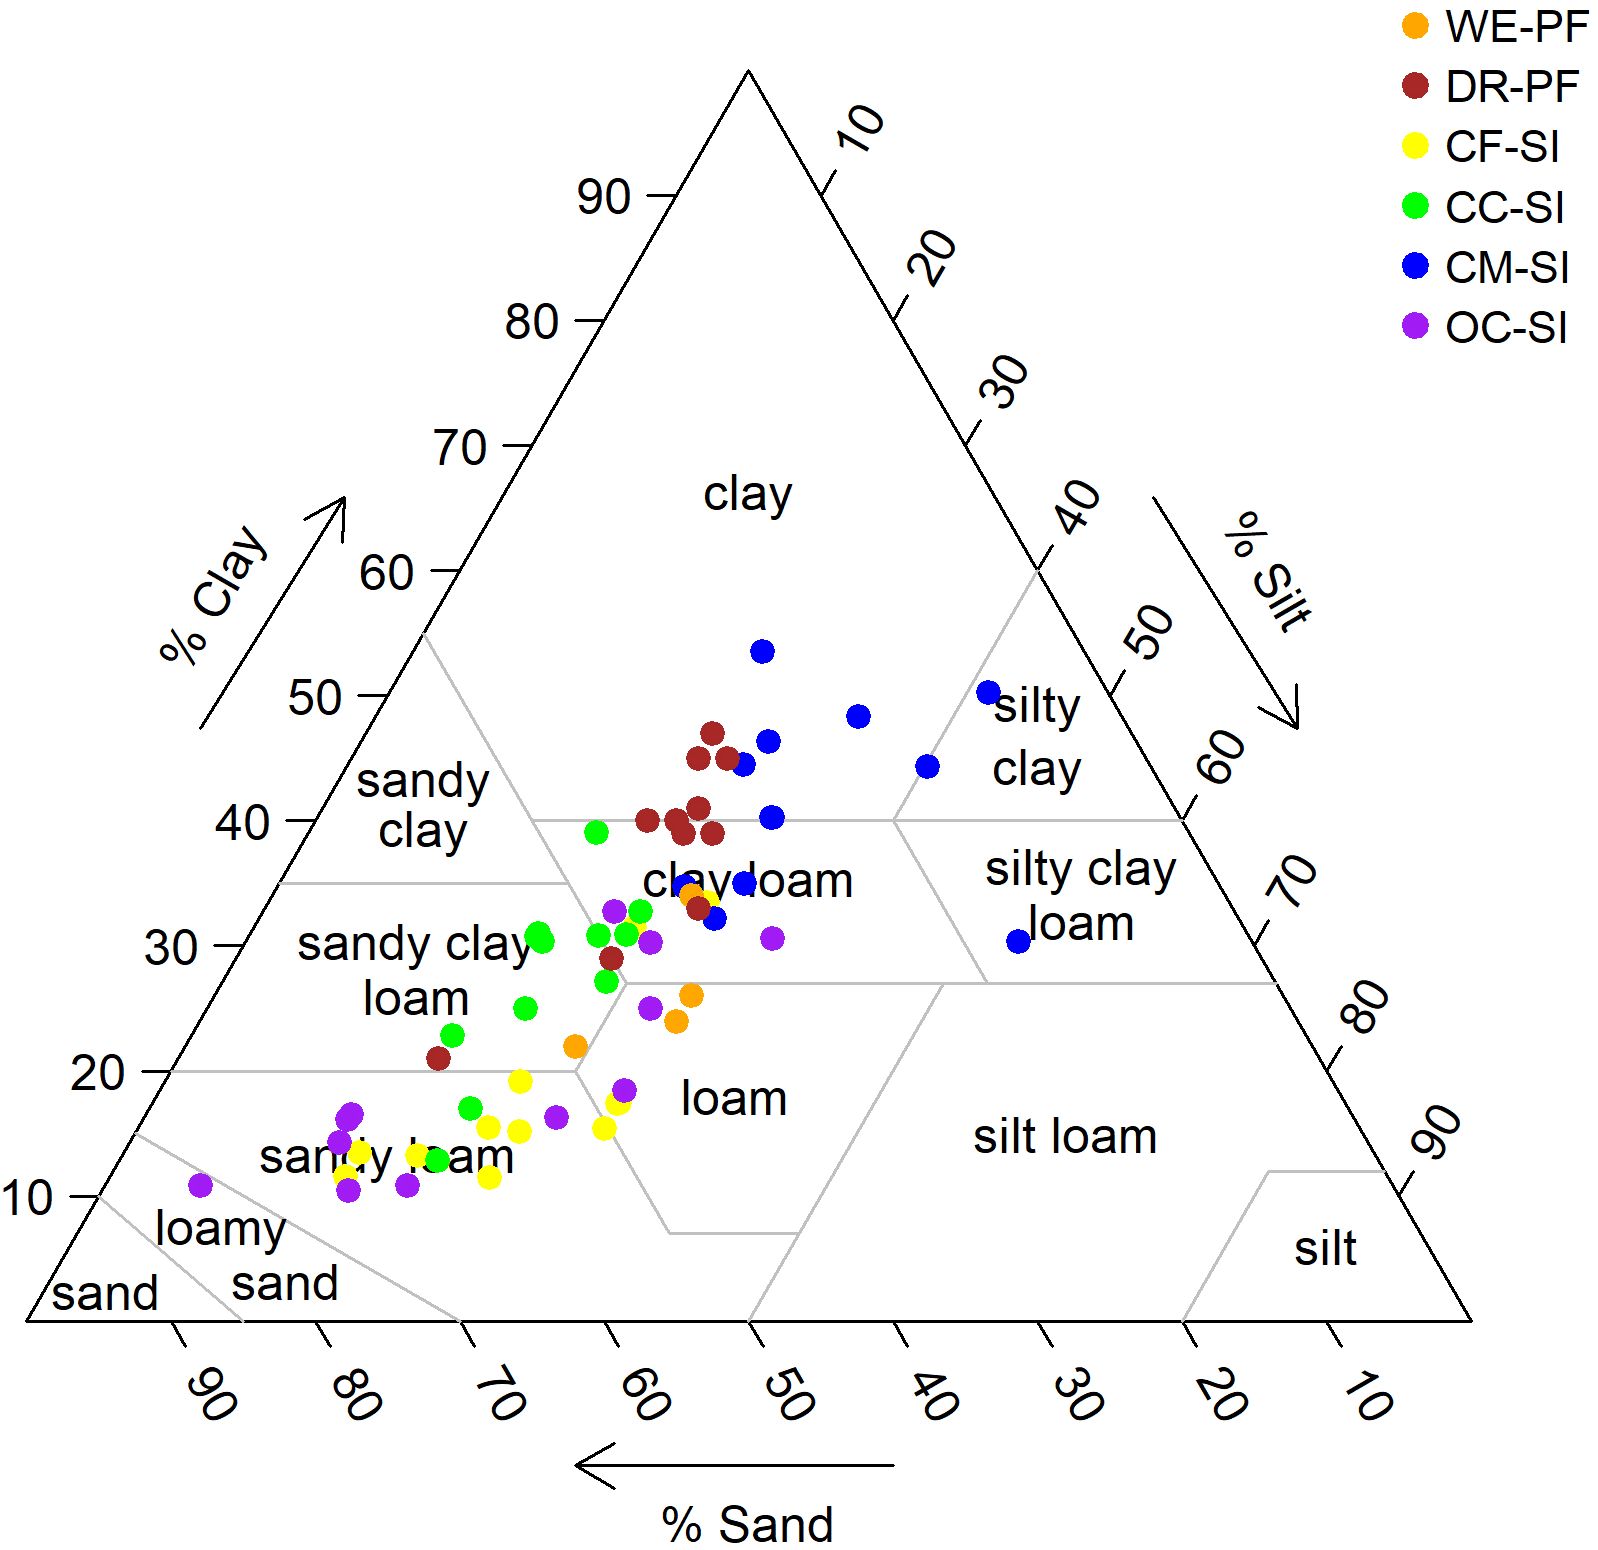
Figure 5. Soil textural triangle (USDA classification system) showing the distribution of samples across different textural classes. Colored points represent the evaluated land-use systems: WE–PF, wet primary forest; DR–PF, dry primary forest; CF–SI, coffee agroforestry system; CC–SI, cocoa agroforestry system; CM–SI, camu camu system; OC–SI, oil palm tree system.
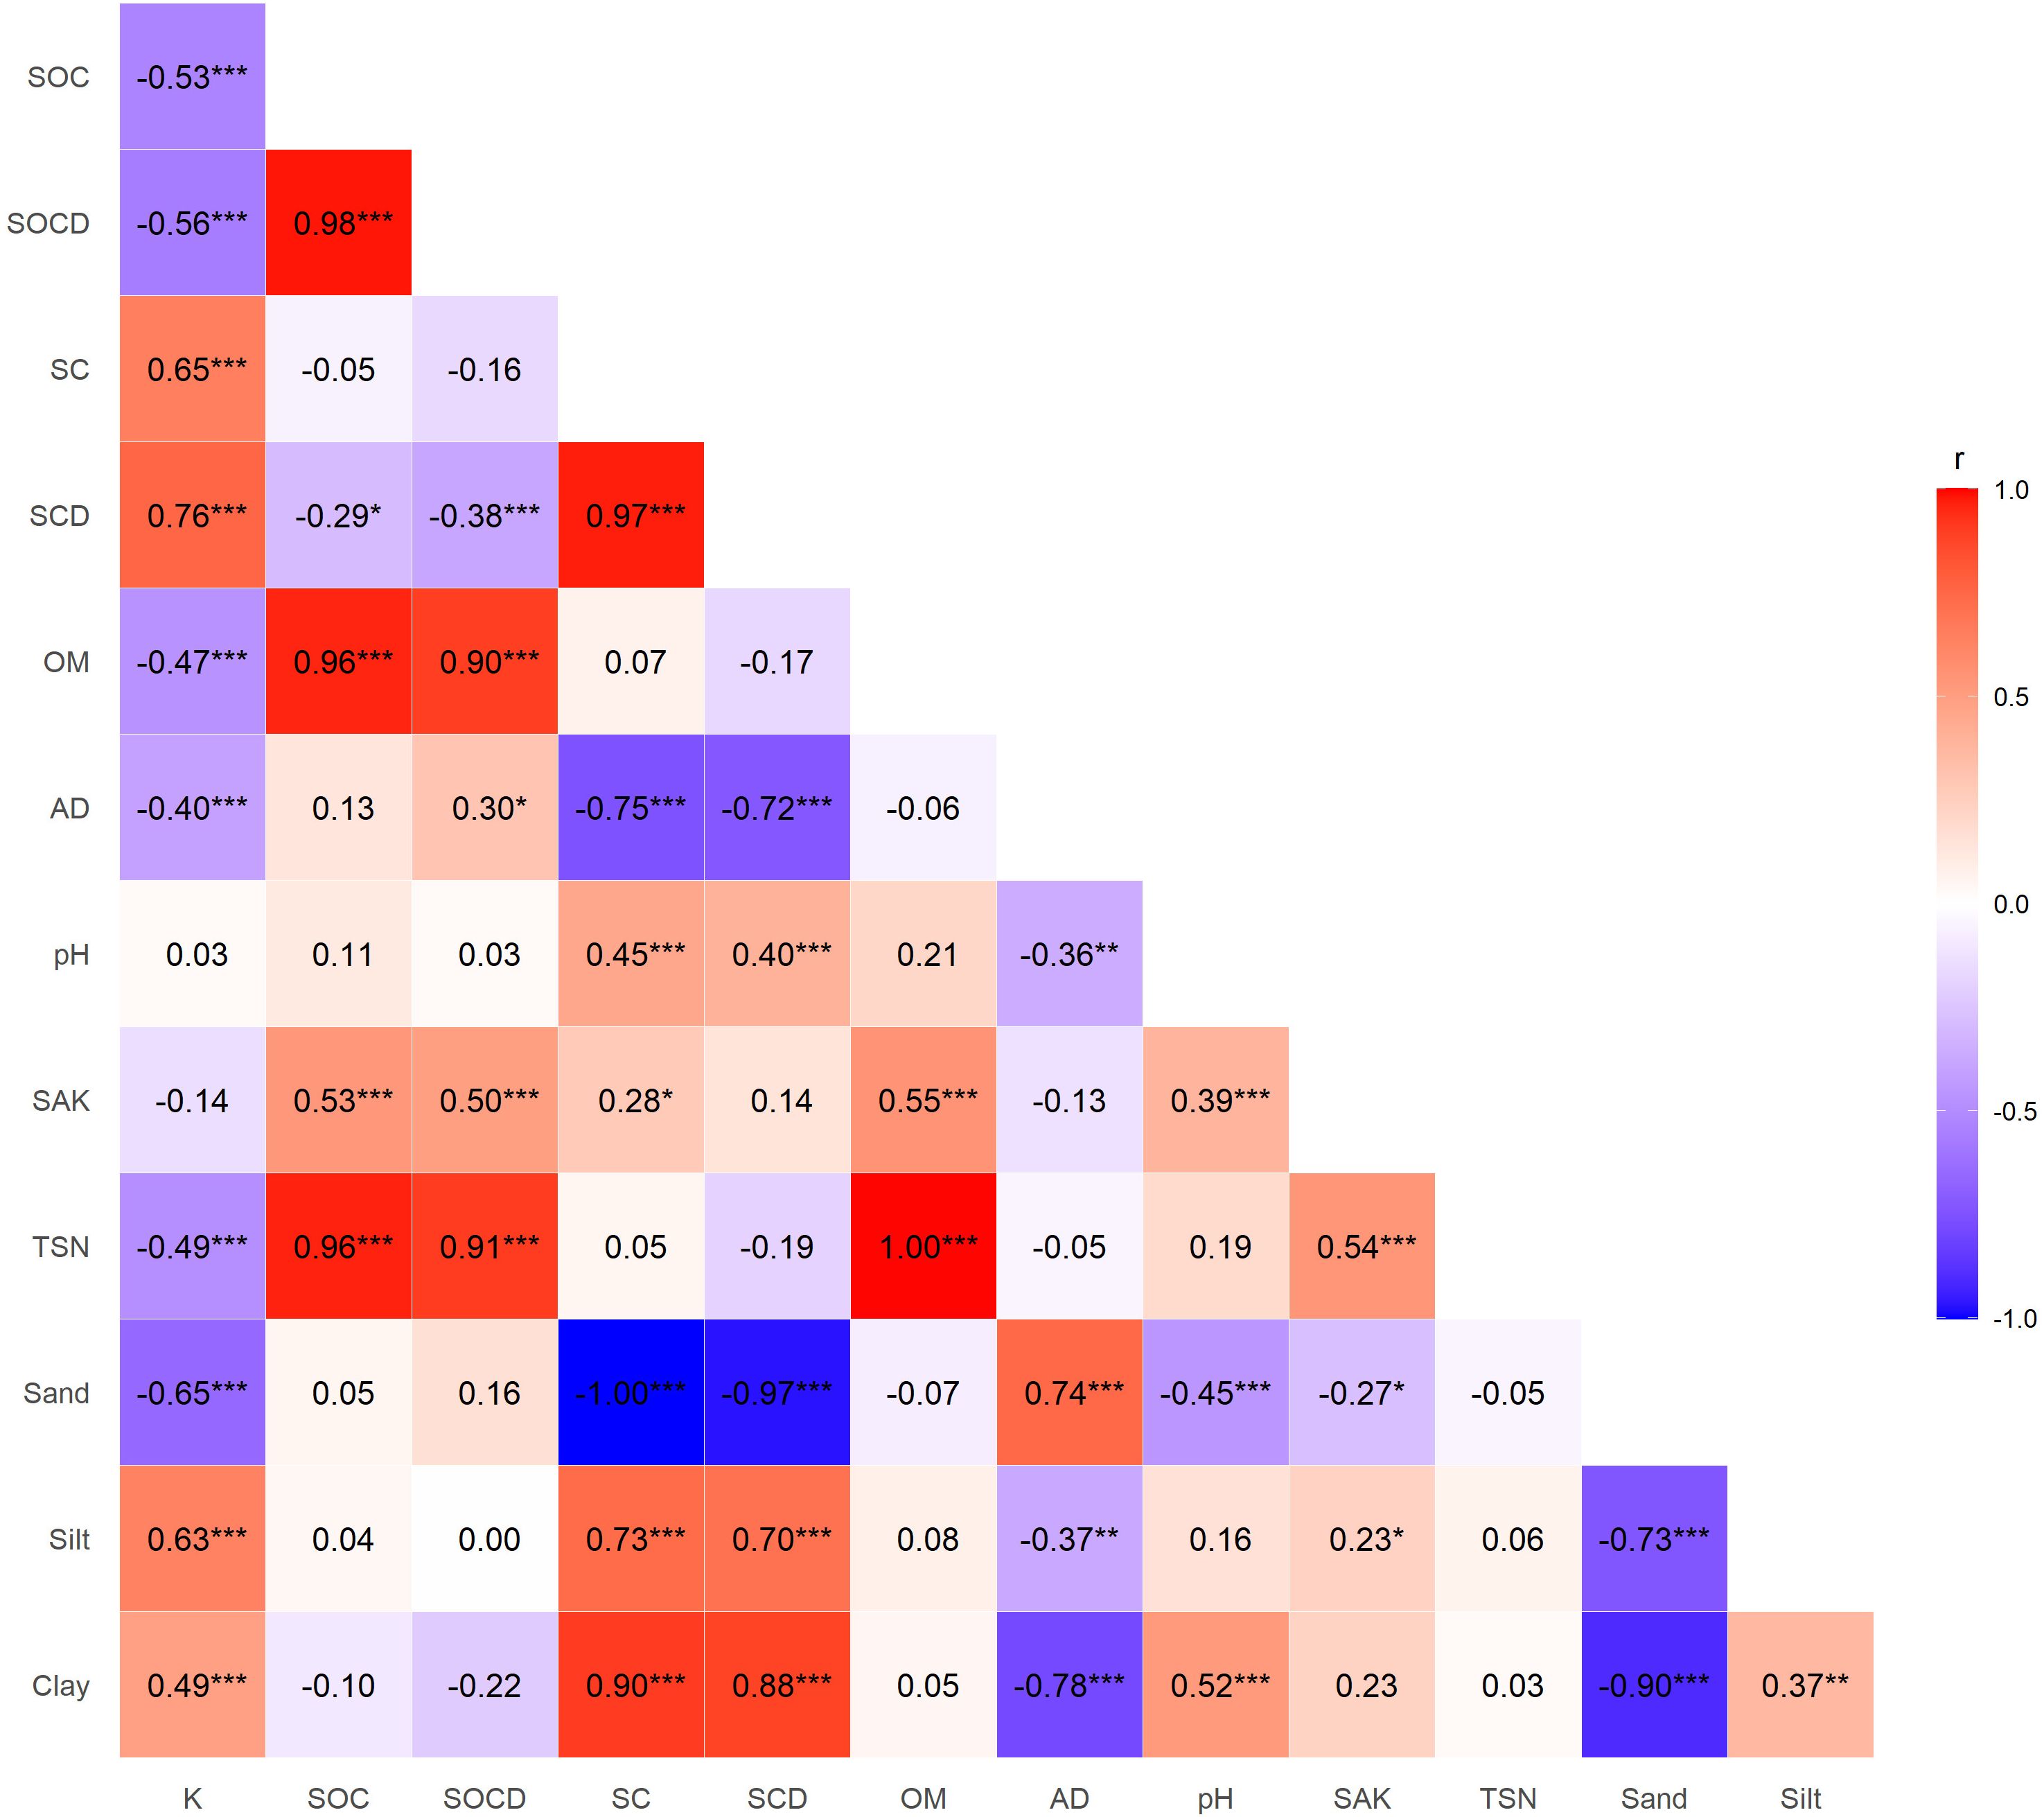
Figure 6. Pearson correlation matrix between physicochemical and textural soil properties in the Peruvian Amazon. K, soil erodibility; SOC, soil organic carbon; SOCD, soil organic carbon density; SC, saturated carbon; SCD, saturated carbon deficit; OM, organic matter; AD, bulk density; pH, hydrogen potential; SAK, available soil potassium; TSN, total soil nitrogen; Sand, Silt, and Clay, textural fractions (%). The color gradient represents the magnitude and direction of correlations (r), and asterisks indicate the levels of statistical significance associated with p-values (* p < 0.05; ** p < 0.01; *** p < 0.001).
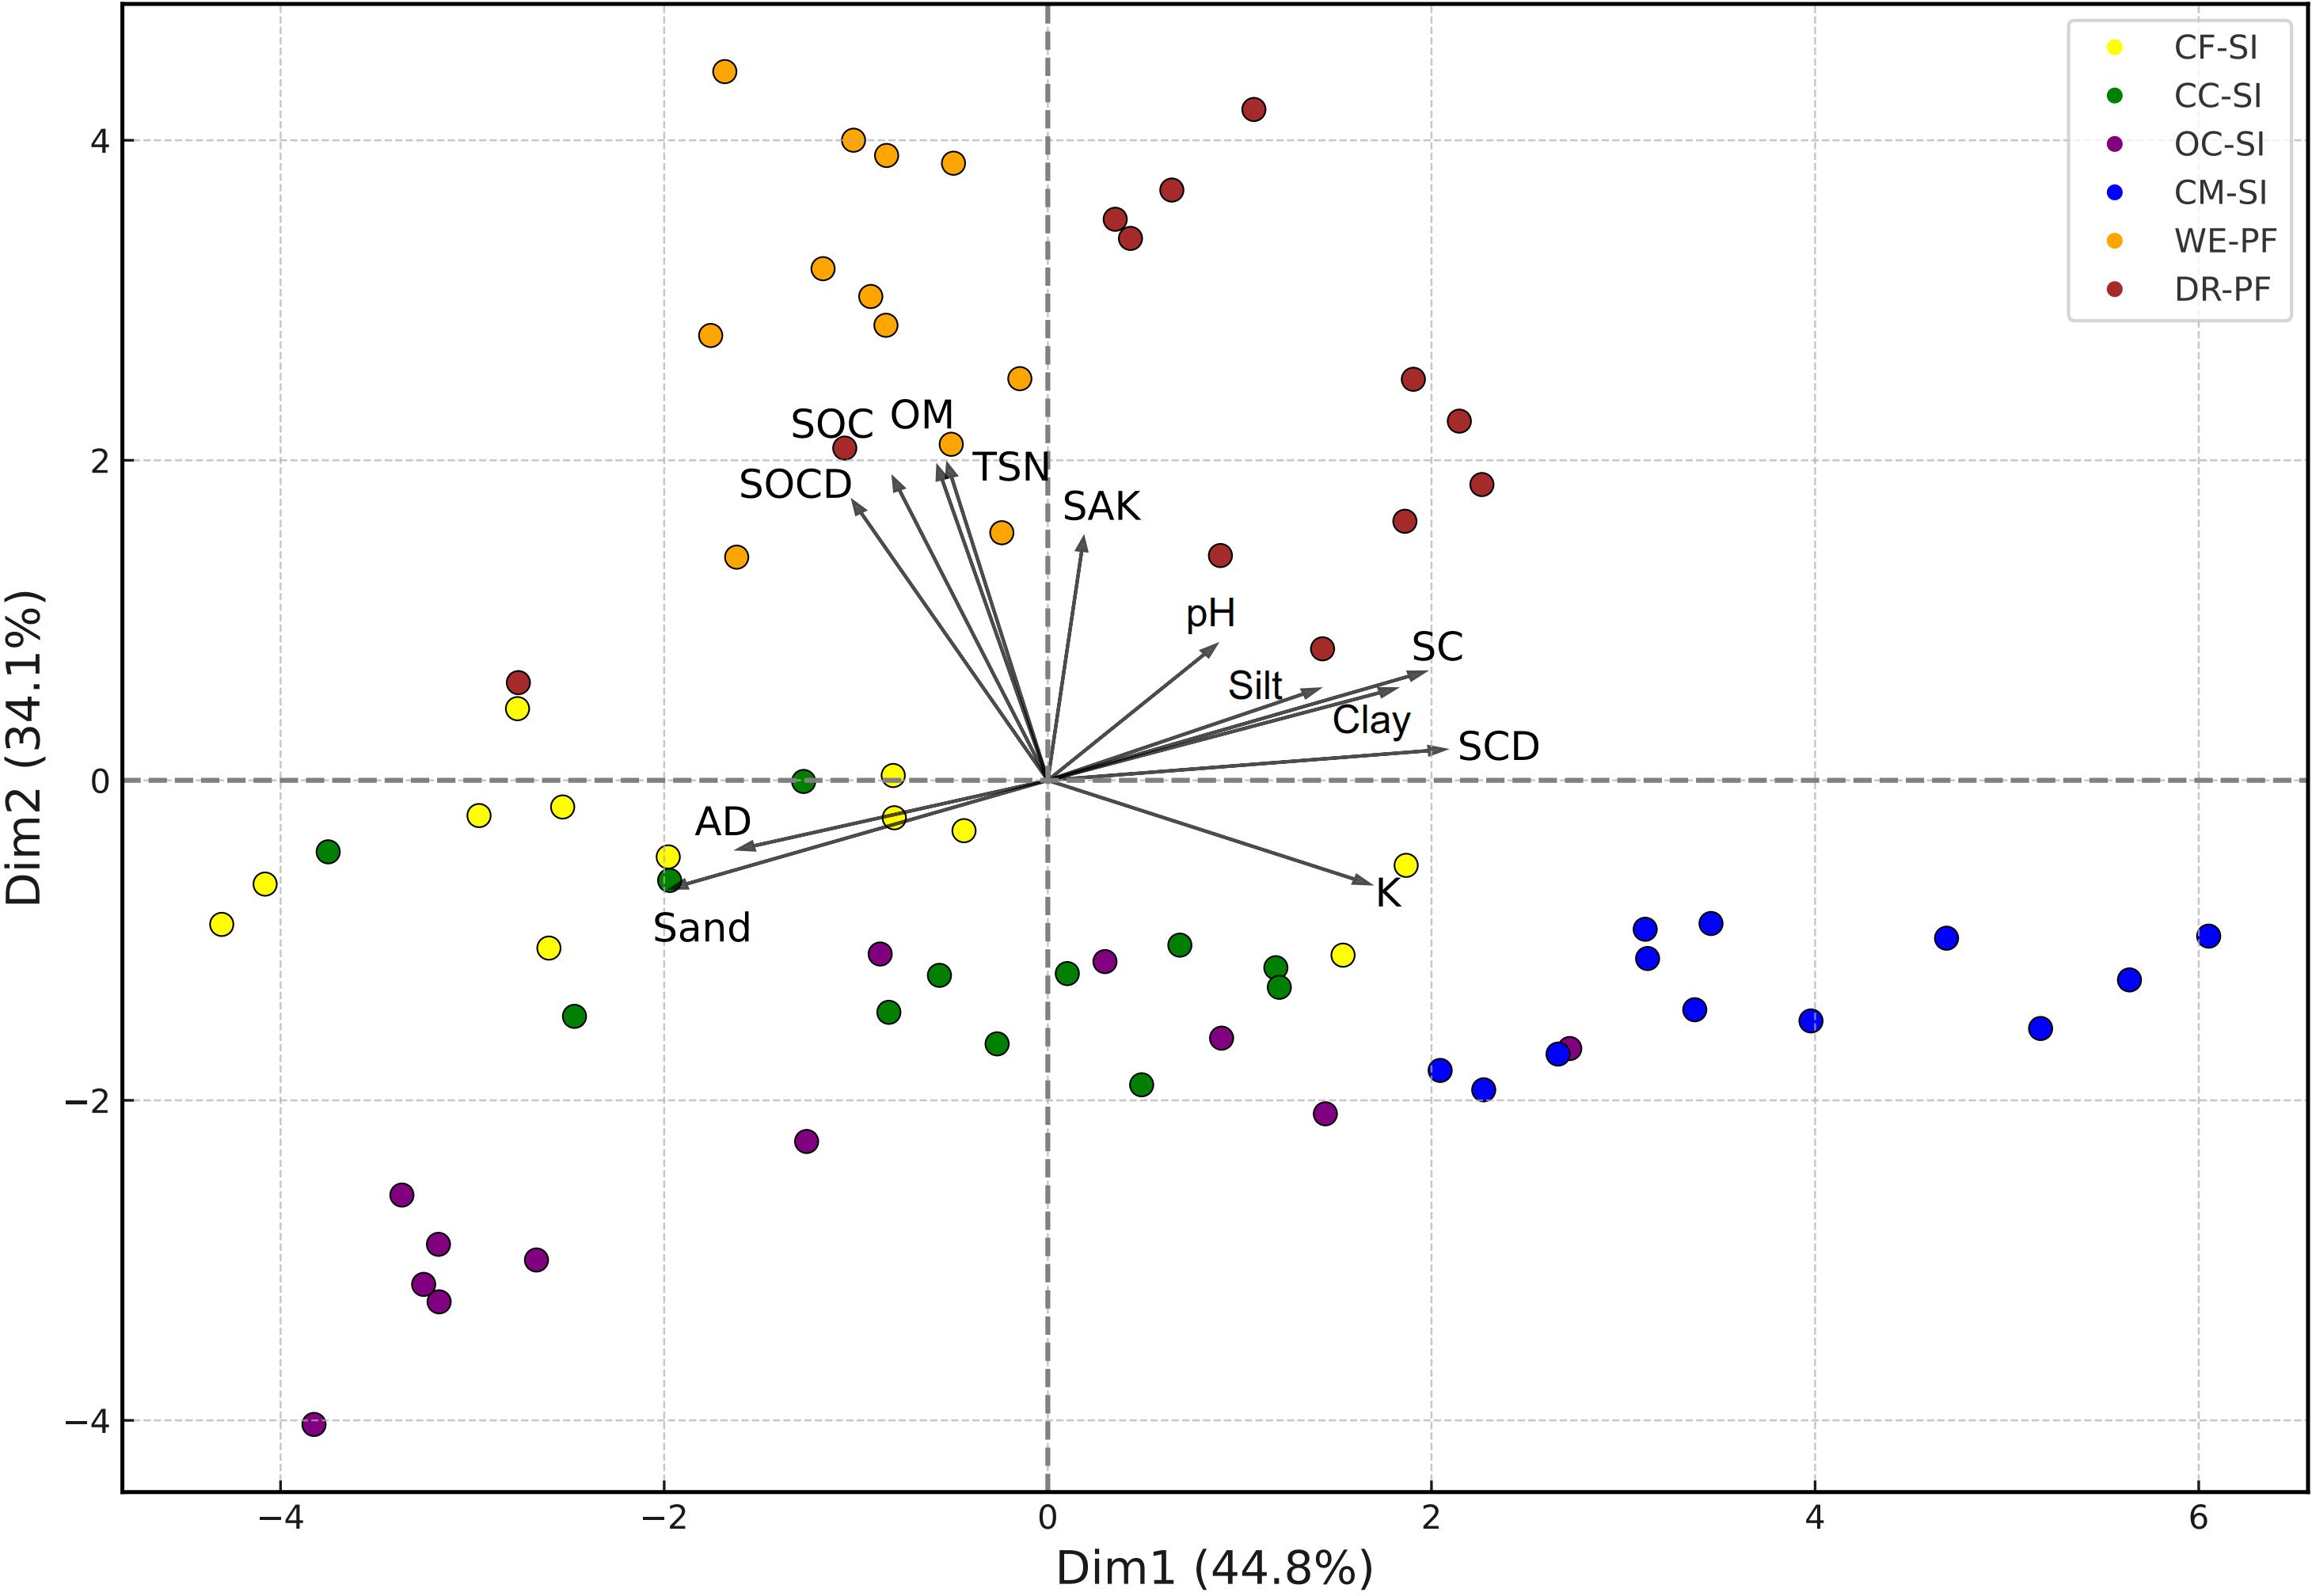
Figure 7. Biplot of the principal component analysis (PCA) based on soil variables: available potassium (K), soil organic carbon (SOC), soil organic carbon density (SOCD), saturated carbon (SC), saturated carbon deficit (SCD), organic matter (OM), bulk density (AD), soil available potassium (SAK), total soil nitrogen (TSN), textural fractions (sand, silt, and clay), and pH. Points represent observations grouped by land-use type: CF–SI, coffee agroforestry system; CC–SI, cocoa agroforestry system; OC–SI, oil palm tree system; CM–SI, camu camu system; WE–PF, wet primary forest; and DR–PF, dry primary forest. Arrows indicate the contribution and direction of the variables to the first two principal components.
3 Results
3.1 Distribution of organic carbon, total nitrogen, and available potassium according to soil texture class
The stock level of SOC exhibited substatial variation across both forests and diverse agricultural crops (p < 0.01). It attained the maximum value of WE-PF (118.99 t C ha-1) and the minimum was obtained in CM-SI (23.93 t C ha-1) (Figure 2A). The total nitrogen value was significantly different between forest and agricultural crops. The CF-SI and CC-SI values were found to be significantly higher than those of the CM-SI and OC-SI (p < 0.01) (Figure 2B). The highest value was observed in WE-PF (0.35%) and the lowest content in CM-SI (0.08%). A similar trend was followed by available potassium (Figure 2C). The highest value was found in WE-PF (181.83 mg kg-1) and the lowest content was achieved CC-SI (45.06 mg kg-1).
These properties are under textural classes influences and the soil type. Consequently, these results indicate that CF-SI and OC-SI develop predominantly in sandy loam soils, with a sand content of 50–70%. CM-SI and DR-PF are predominantly found in clay soils with a clay content of approximately 40-60%, while CC-SI is predominant in sandy clay loam soils, with approximate proportions of 45–65% sand, 15–25% silt and 20–35% clay. Additionally, WE-PF is known to thrive in loamy soils, with a balance close to 40% sand, 40% silt and 20% clay (Figure 5, Table 2).
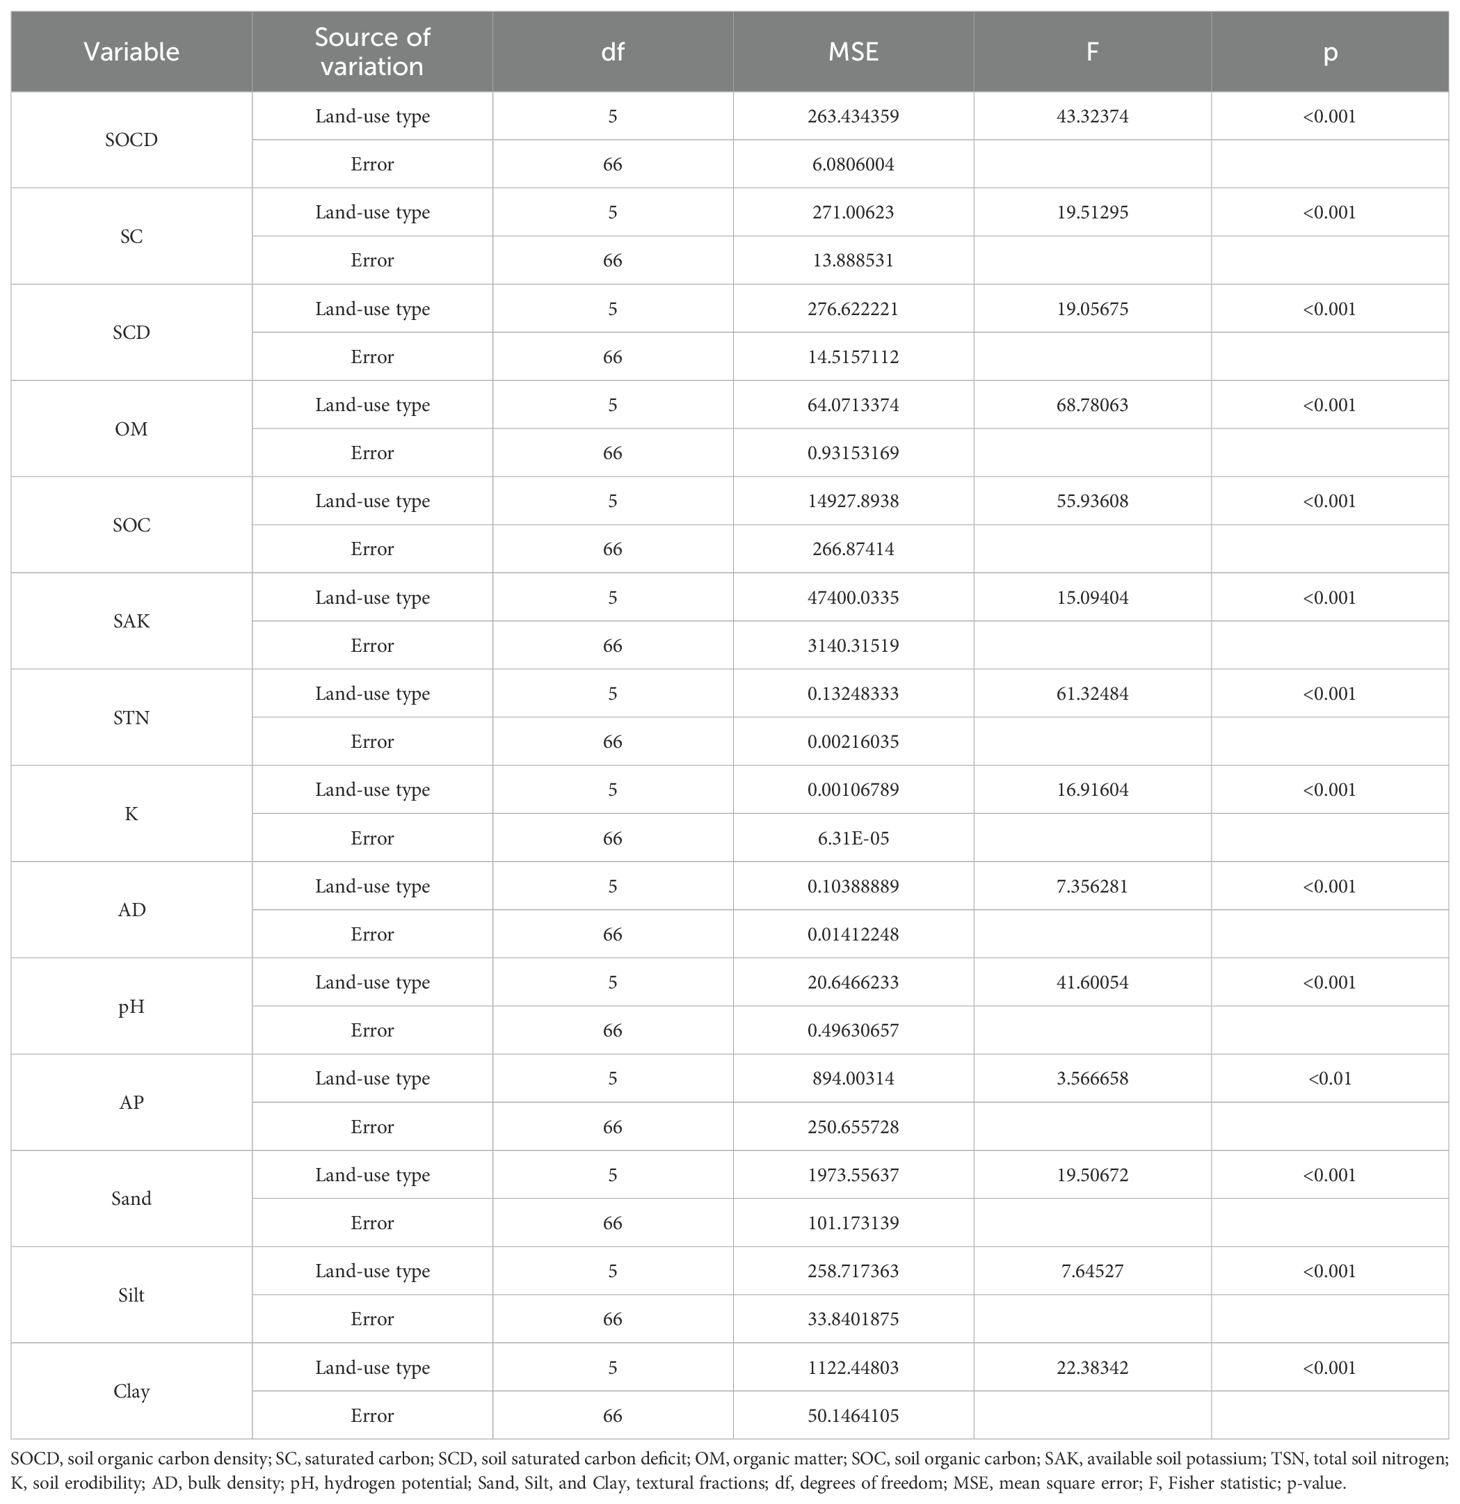
Table 2. One-way ANOVA for the effect of land-use type on physicochemical and textural soil properties.
SOC, STN and SAK exhibited a downward trend between forest and agricultural crops. The conversion of forest to agricultural crops resulted in the loss of soils nutrients, including total nitrogen and available potasiumm. Aditionally, WE-PF showed higher values of 118.99 t C ha-1 and lower values in soils with camu camu plantations in terms of SOC and STN with 23.83 t C ha-1 and 0.08% values each, and an SAK of 45.06 mg kg-1 for oil palm tree plantation. Consequently, post-convertion, of primary forest to agricultural crops, stratification rate of SOC, total nitrogen and available potasiumm decreased by 58.98 59.49 and 59.66% respectively, in soils between 0–20 cm deep.
3.2 Distribution of organic carbon density, saturated carbon, and saturated carbon deficit
Soil organic carbon (SOC) was lower in agricultural crops compared to dry forest, and substantially lower than in wet forest, with significant differences. This difference is due to the fact that humid forests are located at higher altitudes. The organic matter content in this study followed the same trend as SOC. The highest SOCD was found in WE-PF with an average of 16.06 t ha-1, and the lowest in camu camu cultivation with 2.82 t ha-1. These findings, describe a progressive and significantly differentiated decrease according to land use (p < 0.001, WE-PF > DR-PF > CF-SI > CC-SI > OC-SI > CM-SI), from the average of the highest value recorded in WE-PF (16.06 ± 2.56 t ha-¹), with decreases of 34.1%, 45.2%, 57.3%, 69.8%, and 82.4% for DR-PF, CF-SI, CC-SI, OC-SI, and CM-SI, respectively (see Figure 3, Table 2). The highest saturated carbon deficit in the soil was observed in the camu camu crop, with an average of 30.92%, and the lowest content was obtained in the coffee crop, with 18.04%. These variables, displayed significant differences among three groups: the first group consisting of CM-SI; the second group consisting of DR-PF, WE-PF, and CC-SI; and the third group consisting of OC-SI and CF-SI.
3.3 Distribution of erodibility with soil texture
This study reveals that the camu camu management system (CM-SI) exhibits greater erodibility and significant differences compared to other systems. The lowest erosion values (K) were found in the humid primary forest (WE-PF) and the dry primary forest (DR-PF); however, there were no significant differences compared to the agricultural management systems (see Figure 4A). Similarly, higher silt and clay content was found in camu camu cultivation, with significant differences compared to other systems (Figures 4C, D), while the same cultivation system presented lower sand content (Figure 4B). The average pH in forests was 5.96, whereas in agricultural soils it was 4.57 (Figure 4E). The average bulk density was 1.28 g cm-3 in forests and 1.32 g cm-3 in agricultural crop soils (Figure 4F), displaying significant differences between the two (Table 2).
3.4 Correlation between SOC and soil physicochemical parameters
Soil erodibility (K) decreases as soil organic carbon (SOC) increases, as does soil organic carbon density (-0.56) and sandy soil fragments (-0.65). Conversely, erodibility increases with saturated carbon deficit (0.76) and with an increase in silt (0.63). Overall, the results emphasise the pivotal role of soil texture, SOC and SOCD in stabilising the soil structure and making it resistant to erosion processes. In adittion, a positive and slight correlation of SOC was observed between sand (0.05) and silt (0.04) while a negative correlation was identified with clay (-0.10). In the present study, positive correlations were detected between erodibility and sand (0.65), and negative correlations with organic matter (-0.47) (Figure 6).
3.5 Multivariate analysis of the physical and chemical properties of soil under different land uses
The principal component analysis (PCA) jointly explained 78.9% of the total variance in two dimensions. Dimension 1 (44.8%) was dominated by saturated carbon deficit (SCD), saturated carbon (SC), sand, clay, and erodibility (K), forming an edaphic gradient associated with carbon storage capacity, soil texture, and susceptibility to erosion. Dimension 2 (34.1%) was mainly associated with organic matter (OM), total soil nitrogen (TSN), soil organic carbon (SOC), soil organic carbon density (SOCD), and available potassium (SAK), reflecting a gradient of chemical fertility and nutrient quality. In the factorial space, primary forests (WE–PF and DR–PF) showed a strong association with carbon and nutrient-related properties (SOC, SOCD, OM, and TSN), confirming their role as soil reservoirs. Agroforestry systems (CF–SI and CC–SI) exhibited a moderate association, whereas oil palm (OC–SI) and camu camu (CM–SI) systems showed a weak association (Figure 7).
The PCA revealed two clearly defined patterns of association. The first corresponded to a strong positive relationship among SOC, SOCD, OM, and TSN, reflecting the close link between soil organic carbon and key indicators of soil chemical fertility. In contrast, a marked negative association was observed between sand and bulk density (AD) versus silt, clay, SC, and SCD, indicating that sandier and denser soils tend to exhibit lower fine fraction contents and a reduced capacity for carbon storage (Figure 7).
4 Discussion
4.1 Distribution of organic carbon, total nitrogen, and available potassium according to soil texture class
In the present study, 58.98% of soil organic carbon (SOC) and 59.49% of soil total nitrogen (STN) were lost across different management systems, including agricultural crops and forest systems, within the 0–20 cm soil depth. Magalhães et al. (6) reported that deforestation of evergreen mountain forests for crops such as bananas reduced soil organic carbon and total nitrogen reserves to alarming levels. In that study, the authors also mentioned that soils lost 18.56 t C ha-1 (37%) of SOC from the top 20 cm, 2.98 (43%) of STN, and the SOC stratification rate decreased by 49%, implying a decline in soil quality. These results are consistent with Fartyal et al. (43), who indicated that the conversion of natural forests to grasslands resulted in significant losses of SOC and STN reserves that can be attributed to the disturbance of natural forests. These findings emphasize the potential of forests in these areas to retain nutrients and protect the soil against runoff and erosion. Mbibueh et al. (44) observed a significant decrease in total nitrogen and soil organic carbon (SOC) concentrations in different land uses.
Sandy soils for coffee and oil palm tree crops are particularly prone to potassium deficiency, weakening the plants’ ability to resist drought stress (45). Potassium deficiency can limit plant growth and production (46, 47). Moreover, sand concentration is the complement of clay and silt, and represents a notable characteristic for determining soil organic carbon and total nitrogen (48). The relative losses of SOC and STN stocks in the topsoil layer in the present research are within the range of losses following the change in land use from forest to crops (49). Following the conversion of forests to cropland, Montfort et al. (49) reported a 43% decrease in SOC in the top 30 cm. de Blécourt et al. (50) found that agricultural lands had between 20% and 39% less SOC and STN in southern Africa. Touré et al. (51), Demessie et al. (52), and Hounkpatin et al. (53) reported SOC and STN losses ranging from 12% to 52% following deforestation for agricultural fields in Namibia, Ethiopia, and Burkina Faso. The study is also consistent with global research and meta-analyses that show a decrease in SOC and STN reserves subsequent to agricultural deforestation (54, 55). Furthermore, the conversion of forests to agricultural crops reduced the available potassium content by 59.66%. The relatively higher SAK in forest lands could be related to the return of potassium to the soil through the decomposition of leaves and other plant parts (56).
In addition, extensive trees and deep roots act as nutrient pumps, extracting nutrients from deep subsoil horizons and recycling them into the surface layer through leaf fall. Therefore, it has been confirmed that forest soils had a higher available potassium content than all commercial agricultural soils (57). Although most studies claim that changes in SOC, SAK, and STN resulting from land use change occur primarily at the soil surface (54, 58). It is believed that the leading cause of SOC and STN losses, once forests are converted to agricultural fields, is the massive export of nutrients by agricultural products (59). This is exacerbated by the fact that fertilizer is generally not used to replenish exported nutrients from cocoa, coffee, camu camu, and oil palm tree crops in the Peruvian Amazon. In this context, the use of organic or inorganic fertilizers increases SOC and STN concentrations and reserves (60, 61).
4.2 Distribution of organic carbon density, saturated carbon, and saturated carbon deficit
Arunrat et al. (62) were able to show that land use types and conversion time affected SOC stocks, with variations between soil depths. These reports are also corroborated by Paramesha et al. (63), who indicated that SOC reserves were higher in natural forest soil and lower in agricultural crops such as pineapple (Ananas comosus L.). In our research, the lowest SOC content was exhibited in camu camu crops, with an average of 23.93 t C ha-1. The primary forest contains abundant leaf litter and marked vegetation stratification, generating a large amount of plant residue decomposition, thus promoting SOC input (64). Khanal et al. (65) showed high levels of SOC in high-altitude forests with an average of 125 t C ha-1, very close to the 118.99 t C ha-1 obtained in the present study.
Meanwhile, SOC in dry forests stood at 86.73 t C ha-1, far from the findings of Mendoza-Lopez et al. (9) for dry primary forests in the Peruvian jungle (108.52 t C ha-1). The higher SOCD leves registered in the humid primary forest is due to the increase in altitude, where the temperature leads to a reduction in the rate of decomposition of soil organic matter. This phenomenon facilitates SOC accumulation and, thus, increases SOCD (66); these results are similar to those noted by Mendoza-Lopez et al. (9).
The results for saturated carbon deficit are very close to those found by Mendoza-López et al. (9) in soils with varying vegetation cover in the province of Picota. Saturated carbon deficit is known to be important indicator of SOC sequestration potential (67); therefore, soils with C levels far from saturation will have a high C deficit (68). The average saturation rate in the soils of the Picota dry forest was 26.54%. This means that it is possible to increase the average C content to 1,455.50 t C ha-1. Soils with higher deficits, and therefore lower % C saturation, can provide greater C sequestration efficiency through higher C accumulation rates that can be maintained through years or decades until a new steady state is reached (69). Consequently, C sequestration efficiency, a ratio between C input to soils and stored C, would be superior in soils with low SOC content, but inferior when soils are close to saturation (69).
4.3 Distribution of erodibility with soil texture
The agricultural land use system, K index values ranged from 0.08 to 0.41 with an average of 0.25 ± 0.02. In the case of forest and uncultivated lands, these varied from 0.08 to 0.42 with an average of 0.20 ± 0.01; 0.09 to 0.40 with an average of 0.22 ± 0.02 and 0.10 to 0.34 with an average value of 0.23 ± 0.02, respectively (70). Our results indicate that forest soils showed greater resistance to erosion compared to cultivated soils. This is due to the decreasing trend in erodibility as altitude increases (71). Similar values were achieved by coffee and cocoa agroforestry systems, which benefit from reduced erosion and improved soil nutrient recycling as a result of the association of trees and crops (72).
Although camu camu cultivation attained the lowest average sand content in the soil, its silt content is one of the highest and also shows a moderate positive correlation with soil erodibility (Figure 6). This is because silt and medium sand lack adhesive properties and, when moistened, break down and are easily transported, which has a greater impact on soil erodibility (73), making them considered erodible soils (74). Similar values were found by Vallejos-Torres et al. (8) in primary forests with an erosion susceptibility of 0.065. The aforementioned changes in the physicochemical properties of the soil, the root system, and the litter, depending on the type of land use, will inevitably influence the erodibility or erosion resistance of the soil (75). Numerous studies have shown that land use type significantly affects soil erodibility under various conditions (76, 77). Wang et al. (78) selected five typical land use types to assess the variation in soil erodibility on the Loess plateau in China, finding that the soil erodibility of shrublands was the lowest, followed by orchards, grasslands, forests, and croplands (78). Some other studies have also indirectly confirmed that the intensity of soil erosion is strongly influenced by land use type (79–81).
4.4 Correlation between SOC and soil physicochemical parameters
SOC content results from a net balance between the rate of organic matter input and the rate of organic carbon mineralization (82), the former being predominantly determined by vegetation cover and plant roots (83). A change in vegetation type can significantly affect the balance between carbon input and output from the soil, changing the SOC content (84). Yao et al. (85) showed that soil organic carbon content was significantly and positively correlated with TSN and SAK in the soil; confirming the results of the present study. Based on the fact that most of the nitrogen in the soil is stored in organic matter (86), and that an increase in nitrogen improves the microbial activity that promotes decomposition. This increases the organic carbon content and its active carbon fraction (87, 88). This explains the significant positive correlation between the soil organic carbon fraction and the total nitrogen content in the different land use changes. Meanwhile, the SOC content was significantly and positively correlated with the SAK content (89), influenced by the type of land use.
Mendoza-Lopez et al. (9) reported that SOC exhibited a significant positive correlation with sand (0.528), whereas it showed significant negative correlations with SC (−0.814), SCD (−0.856), silt (−0.543), and clay (−0.636). Similarly, Schapel et al. (90) observed a positive correlation between SOC and clay stocks. In the present study, however, SOC did not show a significant correlation with soil textural fractions, suggesting that other factors, such as soil structure, degree of aggregation, and agricultural management practices, may exert greater influence on its variability (91). Nevertheless, sand exhibited significant negative correlations with SCD (−0.97), silt (−0.73), and clay (−0.90). SCD is a level indicator of the future C sequestration potential of SOC or the amount of space available for sequestration (92). The higher the SCD, the greater the potential for future SOC sequestration (93). The positive correlation between sand and negative correlations with organic matter were corroborated by Othmani et al. (94), where statistical evaluation using Pearson’s correlation revealed positive correlations between erodibility and silt (0.63%) and negative correlations with organic matter (−0.32%), in addition to erodibility being negatively correlated with STN (-0.49). The mean soil pH values observed in this study varied considerably, with pH 4.35 in humid forests, 7.58 in dry forests, and 4.57 in agricultural systems. These results suggest that both climatic conditions and anthropogenic activities shape the spatial distribution of soil pH (95). Similarly, bulk density values resulting from changes in land use, such as the conversion of forests and intensive cropland, increase the soil bulk density (96).
4.5 Multivariate analysis of the physical and chemical properties of soil under different land uses
In the factorial space, primary forests (WE–PF and DR–PF) were strongly associated with SOC, SOCD, OM, and TSN, confirming their role as soil reservoirs of carbon and nutrients. In contrast, agroforestry systems (CF–SI and CC–SI) showed intermediate associations, whereas oil palm tree (OC–SI) and camu camu (CM–SI) exhibited weak relationships with carbon properties. This pattern is consistent with the findings of Beillouin et al. (97), who highlighted the importance of forests in maintaining carbon stocks compared to agricultural systems, and with the study of Azevedo et al. (98), which demonstrated how agricultural expansion in the Amazon ‘deforestation arc’ significantly reduces soil carbon and nitrogen stocks.
The PCA revealed that edaphic fertility is strongly conditioned by carbon dynamics and soil texture. The positive association among SOC, SOCD, OM, and TSN confirms the close relationship between soil organic carbon and the main indicators of mineral fertility, as the increase in organic matter not only enhances nitrogen availability but also contributes to the stabilization of carbon in soils (99). Sand and bulk density (AD) were positively associated with each other, forming a group opposite to that of silt, clay, SC, and SCD, which also showed positive associations among themselves. The negative relationship between these two groups indicates that sandier soils with higher bulk density tend to exhibit a lower proportion of fine fractions, thereby limiting carbon stabilization and reducing the capacity for storage in the form of saturated carbon. This result is consistent with Zhang et al. (2022), who demonstrated that silt and clay contribute to the stabilization of soil organic carbon through its incorporation into microaggregates, significantly reducing losses through mineralization. Taken together, these findings highlight that soil texture and bulk density are key determinants of the capacity of Amazonian soils to conserve carbon stocks and sustain fertility, emphasizing the importance of preserving fine fractions and mitigating erosive processes as essential management strategies.
The results of the Tukey test showed that the conversion of primary forests to agricultural systems leads to a significant potential losses of soil organic carbon (SOC), total soil nitrogen (TSN), and available soil potassium (ASK), with reductions exceeding 50%. These patterns are consistent with the multivariate analysis (PCA), where primary forests (WE–PF and DR–PF) were closely associated with SOC, SOCD, OM, and TSN, confirming their role as nutrient and carbon reservoirs in loam-textured soils that facilitate carbon stabilization in microaggregates and its association with fine fractions. In contrast, agricultural systems, particularly CM–SI and OC–SI, exhibited lower SOC, TSN, and SAK contents and were associated with sandier and denser soils, where the lower proportion of silt and clay limits carbon and nutrient retention, thereby increasing vulnerability to loss through erosion and mineralization. Taken together, both analyses confirm that edaphic degradation driven by land-use change is strongly conditioned by soil texture and structure, which determine both the decline in carbon and the reduction of essential nutrients for fertility.
These findings highlight the influence of land-use change on the edaphic properties of the Amazon. Likewise, wet forests (WE–PF) and dry forests (DR–PF) showed significant differences (Tukey’s test, p < 0.05) in seven evaluated edaphic properties. Compared with dry forests (DR–PF), wet forests (WE–PF) exhibited higher values of SOC, STN, SAK, OM, and SOCD, as well as lower values of clay content and pH, thus providing contrasting edaphic references between both forest types. Although this study gathered relevant information on plantation age, fertilization practices, and soil texture, the observational, non-experimental, and cross-sectional nature of the research did not allow for the systematic control of these variables, which limited their inclusion as covariates in the statistical models. These factors, which likely influence SOC, STN, and SAK levels, should be incorporated in future studies using designs that enable a more precise isolation of the effects of management practices and edaphic characteristics on nutrient dynamics in Amazonian soils.
5 Conclusions
Following the conversion of primary forests to agricultural crops, the stratification rate of SOC, total nitrogen, and available potassium decreased significantly by 58.98%, 59.49%, and 59.66%, respectively. Likewise, erodibility was reduced by 10.76% in soils between 0–20 cm deep. The notable findings with marked statistical differences show an alarming loss of nutrients with negative impacts on soil quality. The conservation management of these areas of Amazonian Forest in the Peruvian jungle can be considered an important sink for soil organic carbon mitigation. These findings emphasize the value of maintaining natural vegetation (primary forests) in these areas to retain nutrients and protect the soil from runoff and erosion. Additional research is needed to assess the extent to which land use change from primary forests to agricultural crops such as oil palm tree, camu camu, cocoa, and coffee, affects soil erodibility and saturated carbon deficit, and how these in turn contribute to losses of organic carbon, nitrogen, and potassium. The multivariate analysis revealed that primary forests are closely associated with SOC, SOCD, OM, and TSN, confirming their importance as major reservoirs of carbon and nutrients, whereas agricultural systems—particularly OC-SI and CM-SI—showed weak links with these edaphic properties. Two contrasting groups were identified: on the one hand, sand and bulk density (AD), and on the other, silt, clay, SC, and SCD. The negative association between these groups indicates that an increase in sandy and dense soils is linked to the loss of fine fractions, thereby reducing carbon stabilization and nutrient retention, and ultimately compromising the fertility and resilience of Amazonian soils. Some practical considerations regarding potential solutions to mitigate negative impacts on soil ecosystems are grounded in the sustainability of soil quality and health, with direct implications for agricultural production and food security. This requires integrating scientific, environmental, and socioeconomic dimensions to achieve sustainable agricultural systems. In addition, it is essential to incorporate detailed knowledge of soil formation processes and their evolution, biodiversity, and the functional analysis of key biological traits of edaphic communities. Another relevant aspect is the rotation of agricultural crops, the use of green manures, and the continuous application of organic amendments and/or biofertilizers—produced from crop residues and enriched with efficient microorganisms—in nutrient-poor soils, thereby contributing to improvements in soil quality and health.
Data availability statement
The raw data supporting the conclusions of this article will be made available by the authors, without undue reservation.
Author contributions
RS: Conceptualization, Data curation, Investigation, Methodology, Project administration, Writing – original draft. JC: Funding acquisition, Project administration, Supervision, Validation, Writing – original draft. RC: Data curation, Investigation, Software, Validation, Writing – original draft. LR-C: Conceptualization, Investigation, Methodology, Visualization, Writing – original draft. AL: Conceptualization, Data curation, Formal analysis, Software, Supervision, Writing – original draft. NG-J: Conceptualization, Data curation, Formal analysis, Writing – original draft. GV-T: Conceptualization, Data curation, Formal analysis, Software, Writing – review & editing.
Funding
The author(s) declare financial support was received for the research and/or publication of this article. The research was funded by the Instituto Nacional de Innovación Agraria, within the framework of the project: Mejoramiento de los servicios de investigación y transferencia tecnológica en el manejo y recuperación de suelos agrícolas degradados y aguas para riego en la pequeña y mediana agricultura en los departamentos de Lima, Áncash, San Martín, Cajamarca, Lambayeque, Junín, Ayacucho, Arequipa, Puno y Ucayali” CUI 2487112.
Conflict of interest
The authors declare that the research was conducted in the absence of any commercial or financial relationships that could be construed as a potential conflict of interest.
Generative AI statement
The author(s) declare that no Generative AI was used in the creation of this manuscript.
Any alternative text (alt text) provided alongside figures in this article has been generated by Frontiers with the support of artificial intelligence and reasonable efforts have been made to ensure accuracy, including review by the authors wherever possible. If you identify any issues, please contact us.
Publisher’s note
All claims expressed in this article are solely those of the authors and do not necessarily represent those of their affiliated organizations, or those of the publisher, the editors and the reviewers. Any product that may be evaluated in this article, or claim that may be made by its manufacturer, is not guaranteed or endorsed by the publisher.
References
1. Levers C, Müller D, Erb K, Haberl H, Rudbeck JM, Metzger MJ, et al. Archetypical patterns and trajectories of land systems in Europe. Regional. Environ Change. (2018) 18:715–32. doi: 10.1007/s10113-015-0907-x
2. Geoboques. Bosque y pérdida de bosque. Ministerio del Ambiente - Perú (2022). Available online at: https://geobosques.minam.gob.pe/geobosque/view/perdida.php. (Accessed June 18, 2025).
3. Burgess AJ, Correa Cano ME, and Parkes B. The deployment of intercropping and agroforestry as adaptation to climate change. Crop Environ. (2022) 1:145–60. doi: 10.1016/j.crope.2022.05.001
4. Sylvester JM, Gutiérrez-Zapata DM, Pérez-Marulanda L, Vanegas-Cubillos M, Bruun TB, Mertz O, et al. Analysis of food system drivers of deforestation highlights foreign direct investments and urbanization as threats to tropical forests. Sci Rep. (2024) 14:15179. doi: 10.1038/s41598-024-65397-3, PMID: 39014003
5. Pendrill F, Gardner TA, Meyfroidt P, Persson UM, Adams J, Azevedo T, et al. Disentangling the numbers behind agriculture-driven tropical deforestation. Science. (2022) 377:eabm9267. doi: 10.1126/science.abm9267, PMID: 36074840
6. Magalhães TM, Cossa ERB, Nhanombe HE, and Mugabe ADM. Montane evergreen forest deforestation for banana plantations decreased soil organic carbon and total nitrogen stores to alarming levels. Carbon Balance Manage. (2024) 19:28. doi: 10.1186/s13021-024-00278-w, PMID: 39210203
7. Zeng C, Li T, He B, Feng M, Liang K, Xu Q, et al. Vegetation succession increases soil organic carbon density and decreases soil erodibility: Evidence from a karst trough valley experiencing farmland abandonment. Catena. (2024) 246:108359. doi: 10.1016/j.catena.2024.108359
8. Vallejos-Torres G, Gaona-Jimenez N, Pichis-García R, Ordoñez L, García-Gonzales P, Quinteros A, et al. Carbon reserves in coffee agroforestry in the Peruvian Amazon. Front Plant Sci. (2024) 15:1410418. doi: 10.3389/fpls.2024.1410418, PMID: 39726424
9. Mendoza-Lopez K, Ordoñez-Sánchez L, Valdez-Andía MJ, Lozano-Chung A, García-Gonzales PE, Saavedra-Ramírez J, et al. Estimates of soil organic carbon in the ojos de agua and el quinillal forests in the central huallaga of Peru. Int J Forestry Res. (2024) 2024:5692145. doi: 10.1155/2024/5692145
10. Bravo C, Ramírez A, Marín H, Torres B, Alemán R, Torres R, et al. Factores asociados a la fertilidad del suelo en diferentes usos de la tierra de la Región Amazónica Ecuatoriana. Rev Electrónica Veterinaria. (2017) 18:1–16. Available online at: https://www.redalyc.org/articulo.oa?id=63653574014
11. Abril RV, Changoluisa D, Morell L, Toscano MK, and Pérez BT. Cobertura del suelo sobre la concentración de nutrientes en un agroecosistema en Napo, Ecuador. Agronomía Mesoamericana. (2023) 34:54138. doi: 10.15517/am.2023.54138
12. Cantúy Y. Efecto Del Cambio De Uso De Suelo En El Contenido Del Carbono orgánico Y nitrógeno Del Suelo. Rev Mexicana Cienc Forestales. (2018) 9:1–29. doi: 10.29298/rmcf.v9i45.138
13. Goulding KWT, Murphy DV, Macdonald A, Stockdale EA, Gaunt JL, Blake L, et al. The role of soil organic matter 4 and manures in sustainable nutrient cycling. Sustain Manage Soil Organic Matter. (2001) 221–32. doi: 10.5555/20073011461
14. Shojaei S, Kalantari Z, and Rodrigo-Comino J. Prediction of factors affecting activation of soil erosion by mathematical modeling at pedon scale under laboratory conditions. Sci Rep. (2020) 10:20163. doi: 10.1038/s41598-020-76926-1, PMID: 33214590
15. Hateffard F, Mohammed S, Alsafadi K, Enaruvbe GO, Heidari A, Abdo HG, et al. CMIP5 climate projections and RUSLE-based soil erosion assessment in the central part of Iran. Sci Rep. (2021) 11:7273. doi: 10.1038/s41598-021-86618-z, PMID: 33790351
16. David A. Assessment of soil erosion rates, carbon stocks, and erosion-induced carbon loss in dominant forest types of the Himalayan region using fallout-137Cs. Sci Rep. (2025) 15:14950. doi: 10.1038/s41598-025-94953-8, PMID: 40301424
17. Chen S, Luo Y, Zhou H, Wang K, and Wang C. Soil erodibility indicators as affected by water level fluctuations in the Three Gorges Reservoir area, China. Catena. (2021) 207:105692. doi: 10.1016/j.catena.2021.105692
18. Devátý J, Dostál T, Hösl R, Krása J, and Strauss P. Effects of historical land use and land pattern changes on soil erosion–Case studies from Lower Austria and Central Bohemia. Land Use Policy. (2019) 82:674–85. doi: 10.1016/j.landusepol.2018.11.058
19. Vallejos-Torres G, Gaona-Jimenez N, Lozano A, Paredes CI, Lozano CM, Alva-Arévalo A, et al. Soil organic carbon balance across contrasting plant cover ecosystems in the Peruvian Amazon. Chilean J Agric Res. (2023) 83:553–64. doi: 10.4067/s0718-58392023000500553
20. Ministerio de Desarrollo Agrario y Riego. Observatorio de commodities (2024). Available online at: https://cdn.www.gob.pe/uploads/document/file/6461268/5316298-commodities-cafe-n-01-2024.pdf?v=1718054404 (Accessed June 16, 2025).
21. Díaz CV and Carmen MW. Línea de Base del Sector Café en el Perú. UNDP (2017). Available online at: https://www.undp.org/es/latin-america/publicaciones/linea-de-base-del-sector-cafe-en-el-peru (Accessed June 22, 2025).
22. Imán S and Samanamud A. Guía técnica para el cultivo de camu camu en la amazonía del perú (2021). Available online at: https://repositorio.inia.gob.pe/items/1d075958-5be4-4d86-a88b-8ec67f1f2c08 (Accessed June 26, 2025).
23. Coomes OT, Cheng Y, Takasaki Y, and Abizaid C. What drives clearing of old-growth forest over secondary forests in tropical shifting cultivation systems? Evidence Peruvian Amazon. Ecol Economics. (2021) 189:107170. doi: 10.1016/j.ecolecon.2021.107170
24. Cotrina-Sánchez A, Bandopadhyay S, Rojas-Briceño NB, Banerjee P, Torres Guzmán C, and Oliva M. La desaparición de la Amazonía Peruana: transformación de las áreas protegidas durante las últimas dos décadas (2001-2019) y modelado de la posible deforestación futura mediante computación en la nube y el enfoque MaxEnt. J Nat Conserv. (2021) 64. doi: 10.1016/j.jnc.2021.126081
25. Giraldo-Malca UF, Dunin-Borkowski A, Facho-Bustamante N, Mori-Reaño MJ, and Giraldo-Armas JM. Minería de oro aluvial, conflictos e intervención estatal en la Amazonia sur del Perú. Las industrias extractivas y la sociedad. (2023) 13. doi: 10.1016/j.exis.2023.101219
26. García-Villacorta R. Diversidad, composición Y estructura de un hábitat altamente amenazado: los bosques estacionalmente secos de tarapoto, Perú. Rev Peruana Biol. (2011) 16:081–92. doi: 10.15381/rpb.v16i1.177
27. Rojas H, Serrano-Martínez E, Tantaleán V. M, Casas V. GC, and Quispe H. M. Presencia de Cotylophoron sp en Bovinos de la Provincia de Moyobamba, Perú. Rev Investigaciones Veterinarias Del Perú. (2015) 26:519–24. doi: 10.15381/rivep.v26i3.11179
28. Servicio Nacional de Meteorología e Hidrología del Perú – SENAMHI. Datos hidrometereológicos a nivel nacional (2025). Available online at: https://www.senamhi.gob.pe/servicios/?p=estaciones (Accessed June 30, 2025).
29. Hice CL, Velazco PM, and Willig M. Bats of the National Reserve Allpahuayo-Mishana, northeastern Peru, with notes on community structure. Acta Chiropterologica. (2004) 6:319–34. doi: 10.3161/001.006.0210
30. Van-Heurck M, Alegre J, Solis R, Del Castillo D, Pérez L, Lavelle P, et al. Measuring sustainability of smallholder livestock farming in Yurimaguas, Peruvian Amazon. Food Energy Secur. (2020) 9:e242. doi: 10.1002/fes3.242
31. Paz P, Tello J, and Solis R. Validación de Terra-i en la Amazonía Peruana. Centro Internacional de Agricultura Tropical (2015). Available online at: http://www.terra-i.org/es/news/news/Validating-Terra-i-in-the-Peruvian-Amazon.html (Accessed July 6, 2025).
32. Hao XX, Han XZ, Li LJ, Zou WX, Lu XC, and Qiao YF. Profile distribution and storage of soil organic carbon in a black soil as affected by land use types. Ying Yong Sheng Tai Xue. (2015) 26:965–72. Avaible online at: https://pubmed.ncbi.nlm.nih.gov/26259435/, PMID: 26259435
33. Mclean EO and Page AL. Soil pH and lime requirement. Agron Monogr. (1982), 199–224. doi: 10.2134/agronmonogr9.2.2ed.c12
34. Bremmer JM. Nitrogen-Total. En: Methods of soil analysis. Part 3 chemical methods. SSSA Book Ser. 5. Sparks DL, editor. SSSA, Madison (1996) p. 1103–8. Available online at: https://www.scirp.org/(S(czeh2tfqyw2orz553k1w0r45))/reference/ReferencesPapers.aspx?ReferenceID=1234500 (Accessed July 1, 2025).
35. Olsen SR and Sommers LE. Phosphorus. In: Page AL, editor. Methods of Soil Analysis Part 2 Chemical and Microbiological Properties, American Society of Agronomy, Soil Science Society of America. Madison: American Society of Agronomy and Soil Science Society of America (1982). p. 403–30. doi: 10.2134/agronmonogr9.2.2ed.c24
36. NOM-021-RECNAT-2000. Natural resources and environment secretary. Mexican official standard. Specifications of fertility, salinity, and soil classification. Study Sampling Analysis. (2002).
37. Walkley A and Black IA. Un examen del método de Degtjareff para determinar la materia orgánica del suelo y una modificación propuesta del método de titulación de ácido crómico. Soil Sci. (1934) 37:29–38. doi: 10.1097/00010694-193401000-00003
38. Orton T, Pringle MJ, Page KL, Dalal RC, and Bishop TF. Spatial prediction of soil organic carbon stock using a linear model of coregionalisation. Geoderma. (2014) 230:119–30. doi: 10.1016/j.geoderma.2014.04.016
39. Hassink J. La capacidad de los suelos para preservar el carbono y el nitrógeno orgánicos mediante su asociación con partículas de arcilla y limo. Plant Soil. (1997) 191:77–87. doi: 10.1023/A:1004213929699
40. Angers DA, Arrouays D, Saby NPA, and Walter C. Estimating and mapping the carbon saturation deficit of french agricultural topsoils. Soil Use Manage. (2011) 27:448–52. doi: 10.1111/j.1475-2743.2011.00366.x
41. Williams JR, Jones CA, and Dyke PT. A modeling approach to determining the relationsh ipbetween erosion and soil productivity. Trans Asae. (1984) 27:129–44. doi: 10.13031/2013.32748
42. R Core Team. R: A language and environment for statistical computing. Vienna, Austria: R Foundation for Statistical Computing (2024). Available online at: https://www.R-project.org/ (Accessed June 2, 2025).
43. Fartyal A, Bargali SS, Bargali K, and Negi B. Changes in soil properties, organic carbon, and nutrient stocks after land-use change from forests to grasslands in Kumaun Himalaya, India. Land Degradation Dev. (2025) 36(7):2438–57. doi: 10.1002/ldr.5507
44. Mbibueh BT, Fokeng RM, Tellen VA, and Tawe IT. Land use and topographic controls on soil chemical properties in some selected sites of the North West Region of Cameroon. Geology Ecology Landscapes. (2024) 9:753–74. doi: 10.1080/24749508.2024.2328899
45. Wang M, Zheng Q, Shen Q, and Guo S. El papel crítico del potasio en la respuesta de las plantas al estrés. Int J Mol Sci. (2013) 14:7370–90. doi: 10.3390/ijms14047370, PMID: 23549270
46. Sardans J and Peñuelas J. Potasio: un nutriente desatendido en el cambio global. Glob Ecol Biogeogr. (2015) 24:261–75. doi: 10.1111/geb.12259
47. Qiu K, Xie Y, Xu D, and Pott R. Ecosystem functions including soil organic carbon, total nitrogen and available potassium are crucial for vegetation recovery. Sci Rep. (2018) 8:7607. doi: 10.1038/s41598-018-25875-x, PMID: 29765070
48. Franzluebbers AJ. Sand is the unifying textural component influencing surface-soil carbon and nitrogen fractions across undisturbed land uses in North Carolina. Soil Sci Soc America J. (2025) 89:e70011. doi: 10.1002/saj2.70011
49. Montfort F, Nourtier M, Grinand C, Maneau S, Mercier C, Roelens JB, et al. Regeneration capacities of woody species biodiversity and soil properties in Miombo Woodland after slash-and-burn agriculture in Mozambique. Ecol Manage. (2021) 488. doi: 10.1016/j.foreco.2021.119039
50. de Blécourt M, Gröngröft A, Baumann S, and Eschenbach A. Losses in soil organic carbon stocks and soil fertility due to deforestation for low-input agriculture in semi-arid southern Africa. J Arid Environ. (2019) 165:88–96. doi: 10.1016/j.jaridenv.2019.02.006
51. Touré A, Temgoua E, Guenat C, and Elberling B. Land use and soil texture effects on organic carbon change in dryland soils, Senegal. Open J Soil Sci. (2013) 04:253–62. doi: 10.4236/ojss.2013.46030
52. Demessie A, Singh BR, and Lal R. Soil carbon and nitrogen stocks under chronosequence of farm and traditional agroforestry land uses in Gambo District, Southern Ethiopia. Nutr Cycl Agroecosystems. (2013) 95:365–75. doi: 10.1007/s10705-013-9570-0
53. Hounkpatin KOL, Welp G, Akponikpè PBI, Rosendahl I, and Amelung W. Carbon losses from prolonged arable cropping of Plinthosols in Southwest Burkina Faso. Soil Tillage Res. (2018) 175:51–61. doi: 10.1016/j.still.2017.08.014
54. Biazin B, Kim D-G, and Mengistu T. Soil organic carbon and nitrogen stocks following land use changes in a sub-humid climate. Environ Nat Resour Res [Internet]. (2018) 8:70–83. doi: 10.5539/enrr.v8n1p70
55. Durigan MR, Cherubin MR, Camargo PB, Ferreira JN, Berenguer E, Gardner TA, et al. Soil Organic matter responses to Anthropogenic Forest Disturbance and Land Use Change in the eastern Brazilian Amazon. Sustainability. (2017) 9:1–16. doi: 10.3390/su9030379
56. Vashisht BB, Maharjan B, Sharma S, and Kaur S. Soil quality and its potential indicators under different land use systems in the Shivaliks of Indian Punjab. Sustainability. (2020) 12:3490. doi: 10.3390/su12083490
57. Leul Y, Assen M, Damene S, and Legass A. Effects of land use types on soil quality dynamics in a tropical sub-humid ecosystem, western Ethiopia. Ecol Indic. (2023) 147:110024. doi: 10.1016/j.ecolind.2023.110024
58. Rolando JL, Dubeux JCB, Souza TC, Mackowiak C, Wright D, George S, et al. Organic carbon is mostly stored in deep soil and only affected by land use in its superficial layers: A case study. Agrosystems Geosci Environ. (2021) 4:1–10. doi: 10.1002/agg2.20135
59. Chaplot V and Smith P. Cover crops do not increase soil organic carbon stocks as much as has been claimed: What is the way forward? Global Change Biol. (2023) 29:6163–9. doi: 10.1111/gcb.16917, PMID: 37638821
60. Aula L, Macnack N, Omara P, Mullock J, and Raun W. Effect of Fertilizer Nitrogen (N) on Soil Organic Carbon, total N, and Soil pH in long-term continuous winter wheat (Triticum Aestivum L). Commun Soil Sci Plant Anal. (2016) 47:863–74. doi: 10.1080/00103624.2016.1147047
61. Li C, Aluko OO, Yuan G, Li J, and Liu H. The responses of soil organic carbon and total nitrogen to chemical nitrogen fertilizers reduction base on a meta-analysis. Sci Rep. (2022) 12:1–11. doi: 10.1038/s41598-022-18684-w, PMID: 36175419
62. Arunrat N, Sereenonchai S, Kongsurakan P, and Hatano R. Soil organic carbon and soil erodibility response to various land-use changes in northern Thailand. Catena. (2022) 219:106595. doi: 10.1016/j.catena.2022.106595
63. Paramesha V, Kumar P, Francaviglia R, Nath AJ, Mishra G, Kumar RM, et al. Evaluating land use and climate change effects on soil organic carbon. A simulation study in coconut and pineapple systems in west coast India. Catena. (2025) 248:108587. doi: 10.1016/j.catena.2024.108587
64. Lei Z, Yu D, Zhou F, Zhang Y, Yu D, Zhou Y, et al. Changes in soil organic carbon and its influencing factors in the growth of Pinus sylvestris var. mongolica plantation in Horqin Sandy Land, Northeast China. Sci Rep. (2019) 9:16453. doi: 10.1038/s41598-019-52945-5, PMID: 31712743
65. Khanal S, Nolan RH, Medlyn BE, and Boer MB. Mapping soil organic carbon stocks in Nepal’s forests. Sci Rep. (2023) 13:8090. doi: 10.1038/s41598-023-34247-z, PMID: 37208346
66. Chen ST, Huang Y, Zou JW, and Shi YS. Mean residence time of global topsoil organic carbon depends on temperature, precipitation and soil nitrogen. Glob Planet. Change. (2013) 100:99–108. doi: 10.1016/j.gloplacha.2012.10.006
67. Zhang L, Wang Y, Chen J, Feng L, Li F, and Yu L. Characteristics and drivers of soil organic carbon saturation deficit in karst forests of China. Diversity. (2022) 14:62. doi: 10.3390/d14020062
68. Rodrigues LAT, Giacomini SJ, Dieckow J, Cherubin MR, Ottonelli AS, and Bayer C. Carbon saturation deficit and litter quality drive the stabilization of litter-derived C in mineral-associated organic matter in long-term no-till soil. Catena. (2022) 219:106590. doi: 10.1016/j.catena.2022.106590
69. Georgiou K, Jackson RB, Vindušková O, Abramoff RZ, Ahlström A, Feng W, et al. Global stocks and capacity of mineral-associated soil organic carbon. Nat Commun. (2022) 13:3797. doi: 10.1038/s41467-022-31540-9, PMID: 35778395
70. Olaniya M, Bora PK, Das S, and Chanu PH. Soil erodibility indices under different land uses in Ri-Bhoi district of Meghalaya (India). Sci Rep. (2020) 10:14986. doi: 10.1038/s41598-020-72070-y, PMID: 32917970
71. Huang X, Lin L, Ding S, Tian Z, Zhu X, Wu K, et al. Characteristics of soil erodibility K value and its influencing factors in the changyan watershed, Southwest Hubei, China. Land. (2022) 11:134. doi: 10.3390/land11010134
72. Villa PM, Martins SV, de Oliveira Neto SN, Rodrigues AC, Hernández EP, and Kim D-G. Policy forum: Shifting cultivation and agroforestry in the Amazon: Premises for REDD+. For Policy Economics. (2020) 118:102217. doi: 10.1016/j.forpol.2020.102217
73. Huang TCC and Lo KFA. Effects of land use change on sediment and water yields in Yang Ming Shan National Park Taiwan. Environments. (2015) 2:32–42. doi: 10.3390/environments2010032
74. Dutal H and Reis M. Determining the effects of land use on soil erodibility in the Mediterranean highland regions of Turkey: a case study of the Korsulu stream watershed. Environ Monit Assess. (2020) 192:192. doi: 10.1007/s10661-020-8155-z, PMID: 32080771
75. Zhang J, Zhang C, Li Q, and Pan X. Grain-size distribution of surface sediments of climbing and falling dunes in the Zedang valley of the Yarlung Zangbo River, southern Tibetan plateau. J Earth Syst Sci. (2019) 128:11. doi: 10.1007/s12040-018-1030-4
76. Aneseyee AB, Elias E, Soromessa T, and Feyisa GL. Land use/land cover change effect on soil erosion and sediment delivery in the Winike watershed, Omo Gibe Basin, Ethiopia. Sci Total Environ. (2020) 728:138776. doi: 10.1016/j.scitotenv.2020.138776, PMID: 32353799
77. Melese T, Senamaw A, Belay T, and Bayable G. The spatiotemporal dynamics of land use land cover change, and its impact on soil erosion in Tagaw Watershed, Blue Nile Basin, Ethiopia. Global Challenges. (2021) 5:2000109. doi: 10.1002/gch2.202000109, PMID: 34267925
78. Wang H, Zhang G, Li N, Zhang B, and Yang H. Variation in soil erodibility under five typical land uses in a small watershed on the loess plateau, China. Catena. (2019) 174:24–35. doi: 10.1016/j.catena.2018.11.003
79. Ma W, Li Z, Ding K, Huang B, Nie X, Lu Y, et al. Soil erosion, organic carbon and nitrogen dynamics in planted forests: A case study in a hilly catchment of Hunan Province, China. Soil Tillage Res. (2016) 155:69–77. doi: 10.1016/j.still.2015.07.007
80. Tang J, Liu G, Xie Y, Duan X, Wang D, and Zhang S. Annual variation of ephemeral gully erosion in a cultivated catchment. Geoderma. (2021) 401:115166. doi: 10.1016/j.geoderma.2021.115166
81. Xie Y, Lin HH, Ye Y, and Ren XY. Changes in soil erosion in cropland in northeastern China over the past 300 years. Catena. (2019) 176:410–8. doi: 10.1016/j.catena.2019.01.026
82. Sheng H, Zhou P, Zhang Y, Kuzyakov Y, Zhou Q, Ge T, et al. Loss of labile organic carbon from subsoil due to land-use changes in sub-tropical China. Soil Biol Biochem. (2015) 88:148–57. doi: 10.1016/j.soilbio.2015.05.015
83. Zhang Y, Ai J, Sun Q, Li Z, Hou L, Song L, et al. Soil organic carbon and total nitrogen stocks as affected by vegetation types and altitude across the mountainous regions in the Yunnan Province, south-western China. Catena. (2021) 196:104872. doi: 10.1016/j.catena.2020.104872
84. Luo Y, Li Y, Liu S, and Yu P. Effects of vegetation succession on soil organic carbon fractions and stability in a karst valley area, Southwest China. Environ Monit Assess. (2022) 194:562. doi: 10.1007/s10661-022-10254-x, PMID: 35789436
85. Yao Y, Dai Q, Gao R, Yi X, Wang Y, and Hu Z. Characteristics and factors influencing soil organic carbon composition by vegetation type in spoil heaps. Front Plant Sci. (2023) 14:1240217. doi: 10.3389/fpls.2023.1240217, PMID: 37900766
86. Xie B, Zhang C, and Xie Y. Global convergence in correlations among soil properties. Int J Agric Biol Engineering. (2020) 13:108–16. doi: 10.25165/10.25165/j.ijabe.20201303.4547
87. Liu M, Li P, Liu M, Wang J, and Chang Q. The trend of soil organic carbon fractions related to the successions of different vegetation types on the tableland of the Loess Plateau of China. J Soils Sediments. (2021) 21:203–14. doi: 10.1007/s11368-020-02710-3
88. Xu HQ, Qing. L, Bing BZ, Yue L, and Guo BX. Variation in soil organic carbon stability and driving factors after vegetation restoration in different vegetation zones on the Loess Plateau, China. Soil Tillage Res. (2020) 204:104727. doi: 10.1016/j.still.2020.104727
89. Zhang Y, Jia W, Yang L, Zhu G, Lan X, Luo H, et al. Change characteristics of soil organic carbon and soil available nutrients and their relationship in the subalpine shrub zone of qilian mountains in China. Sustainability. (2023) 15:13028. doi: 10.3390/su151713028
90. Schapel A, Marschner P, and Churchman J. Clay amount and distribution influence organic carbon content in sand with subsoil clay addition. Soil Tillage Res. (2018) 184:253–60. doi: 10.1016/j.still.2018.08.001
91. Six J, Elliott ET, and Paustian K. Soil macroaggregate turnover and microaggregate formation: a mechanism for C sequestration under no-tillage agriculture. Soil Biol Biochem. (2000) 32:2099–103. doi: 10.1016/S0038-0717(00)00179-6
92. Merabtene MD, Faraoun F, Mlih R, Djellouli R, Latreche A, and Bol R. Forest soil organic carbon stocks of tessala mount in North-West Algeria-preliminary estimates. Front Environ Sci. (2021) 8-2020. doi: 10.3389/fenvs.2020.520284
93. Zhang Y, Li P, Liu X, and Xiao L. Changes in soil aggregate fractions, stability, and associated organic carbon and nitrogen in different land-use types in the Loess Plateau, China. Sustainability. (2022) 14:3963. doi: 10.3390/su14073963
94. Othmani O, Khanchoul K, Boubehziz S, Bouguerra H, Benslama A, and Navarro-Pedreño J. Spatial variability of soil erodibility at the rhirane catchment using geostatistical analysis. Soil Syst. (2023) 7:32. doi: 10.3390/soilsystems7020032
95. Sun W, Li S, Zhang G, Fu G, Qi H, and Li T. Effects of climate change and anthropogenic activities on soil pH in grassland regions on the Tibetan Plateau. Global Ecol Conserv. (2023) 45:e02532. doi: 10.1016/j.gecco.2023.e02532
96. Bufebo B and Elias E. Effects of land use/land cover changes on selected soil physical and chemical properties in Shenkolla watershed, south Central Ethiopia. Adv Agric. (2020) 2020:5145483. doi: 10.1155/2020/5145483
97. Beillouin D, Corbeels M, Demenois J, Berre J, Boyer A, Fallot A, et al. A global meta−analysis of soil organic carbon in the Anthropocene. Nat Commun. (2023) 14:2912. doi: 10.1038/s41467-023-39338-z, PMID: 37349294
98. Azevedo JCD, Cardoso ADS, Lage Filho NM, Faturi C, Silva TCD, Domingues FN, et al. Effects of agricultural expansion on soil carbon and nitrogen stocks in the Amazon deforestation arc. Soil Syst. (2024) 8:25. doi: 10.3390/soilsystems8010025
Keywords: primary forest, agricultural crops, land use change, soil organic carbon reserves, total nitrogen, available potassium, soil texture, Peruvian Amazon
Citation: Solórzano-Acosta R, Cruz-Luis J, Chuchon-Remon R, Romero-Chávez LE, Lozano A, Gaona-Jimenez N and Vallejos-Torres G (2025) The conversion of forests to agricultural croplands significantly depletes soil organic carbon reserves, total nitrogen, and available potassium, reaching critical thresholds in the Peruvian Amazon. Front. Soil Sci. 5:1662180. doi: 10.3389/fsoil.2025.1662180
Received: 16 July 2025; Accepted: 01 September 2025;
Published: 19 September 2025.
Edited by:
Andrés Calderín García, Federal Rural University of Rio de Janeiro, BrazilReviewed by:
Grazia Masciandaro, National Research Council, ItalyFernando Igne Rocha, USDA Agricultural Research Service, United States
Copyright © 2025 Solórzano-Acosta, Cruz-Luis, Chuchon-Remon, Romero-Chávez, Lozano, Gaona-Jimenez and Vallejos-Torres. This is an open-access article distributed under the terms of the Creative Commons Attribution License (CC BY). The use, distribution or reproduction in other forums is permitted, provided the original author(s) and the copyright owner(s) are credited and that the original publication in this journal is cited, in accordance with accepted academic practice. No use, distribution or reproduction is permitted which does not comply with these terms.
*Correspondence: Geomar Vallejos-Torres, Z3ZhbGxlam9zQHVuc20uZWR1LnBl