 Jun Qiao
 Jiahao Liu1,2,3
 Xiaokang Chen
 Guibin Ma
- 1Engineering Research Center of Coal-Based Ecological Carbon Sequestration Technology of the Ministry of Education, Shanxi Datong University, Datong, Shanxi, China
- 2Key Laboratory of Graphene Forestry Application of National Forest and Grass Administration, Shanxi Datong University, Datong, Shanxi, China
- 3School of Chemistry and Chemical Engineering, Shanxi Datong University, Datong, Shanxi, China
Poplar trees and saline–alkali soil commonly occur in northern China, especially around the Datong district in northern Shanxi. To better utilize this type of soil, it is important to know how to neutralize saline–alkali conditions and how poplar leaves decompose in this soil media. Graphene oxide (GO) is widely known for improving soil nutrient content in agricultural and forestry soils. Here, we examined the effect of a graphene oxide composite combined with the addition of external bacterial agents on the decomposition of poplar leaves in saline–alkali soil. A litterbag method was used, and content analyses were conducted on both the litter residue and the decomposed soil at different sampling times. Overall, the humus content of the leaf-litter–decomposed soil gradually increased over time. Meanwhile, the total nitrogen, phosphorus, ammonium nitrogen, available potassium, and most phosphorus contents showed a trend of initially decreasing slightly and then gradually increasing. Nutrient concentrations, as well as humus content in the soil, reached their maximum after 120 days with the addition of both 25.0 mg/L GO and microbial agents. We conclude that the combination of GO and microbial agents promotes soil enzyme activity and accelerates litter decomposition, with the highest enzyme activity observed when both 25.0 mg/L GO and bacterial agents were present in the saline–alkali soil.
1 Introduction
The annual, repetitive decomposition cycle of plant litter is the main way through which nature improves and reinforces the organic matter of surface soil (1). Microorganisms in the soil are the main driving force for litter decomposition and can promote the formation of soil humic acid (2, 3). Microorganisms are involved in the conversion of substances and energy in the soil. Due to their large numbers and diverse functions, their impact on the litter decomposition process has become an attractive research topic (4–6). Studies have shown that microorganisms can promote the decomposition of litter in cultivated soil and saline–alkali soil, accelerate the release of carbon, nitrogen, and phosphorus from litter, accelerate the decomposition of cellulose and lignin, increase the content of nutrients such as total nitrogen and total phosphorus in soil, and increase the activity of enzymes such as soil cellulase and urease. At the same time, microorganisms increase the diversity of soil microbial communities, thereby accelerating litter decomposition—a complementary and mutually promoting relationship (7, 8).
In recent years, environmental changes, rising temperatures, drought, and excessive agricultural use have been shown to decrease soil organic matter and potentially microbial biomass, resulting in reduced microbial abundance (5, 9, 10). This change slows the decomposition and decay of litter in soil. The low productivity and poor structure of saline–alkali soil lead to fewer microorganisms than in normal soil, which in turn affects water and air movement, root penetration, and litter decomposition (5, 11–14).
At the beginning of this century, with the rise of nanotechnology—especially the large-scale synthesis and preparation of new materials such as graphene (G) and graphene oxide (GO)—many researchers began exploring the potential applications of these materials in different fields (15–17). Our laboratory is recognized as one of the pioneer teams in China studying the application of graphene oxide in agriculture and forestry. Our preliminary experimental results have shown that graphene oxide has a significant growth-promoting effect on beneficial bacteria and an inhibitory effect on harmful bacteria (18–21). In addition, there is a dose–response relationship in different application fields. In a previous article, we systematically explored the effect of adding a specific dose of GO (25.0 mg/L) on soil microbial number and diversity, finding increased microbial abundance and species richness (22). In another study, treatment with an optimized dose of 25.0 mg/L GO altered the relative abundances of nitrogen- and phosphorus-cycling microorganisms in peat soil, promoted changes in soil physicochemical properties, and ultimately improved the growth of Vicia faba plants (23). Moreover, in maize, root treatment with 25.0 mg/L GO elevated ammonium (NH4+) and potassium (K+) levels in the rhizosphere soil and stimulated the expression of genes involved in nitrogen and potassium metabolism (20). Together, these results indicate that GO can promote bacterial growth in soil and demonstrate that 25.0 mg/L is the optimal concentration, showing maximal positive effects on plant growth and soil health.
Graphene oxide is a chemically modified material with many oxygen-containing hydrophilic functional groups, such as carboxyl, carbonyl, epoxy, and hydroxyl groups (24). Because of its excellent physicochemical properties—including outstanding electrical conductivity, high chemical stability, and superior surface activity and hydrophilicity—GO has been widely applied in agricultural production. Other studies have shown that GO can promote the growth and development of leguminous plants (25), increasing root and shoot length, leaf number, root nodules per plant, pod number, and seed number per pod. This suggests that the presence of GO in soil may be closely related to improvements in soil conditions and plant productivity.
Saline–alkali soil is common in northern China, especially around the Datong district in northern Shanxi. The soil in this area is chestnut soil with a loamy clay texture. It has a high degree of salinization (pH ≥ 9, total soil salt content ≥ 0.3%). The land use types are grassland and woodland, and the soil has not been used for agricultural production. The main vegetation types include natural herbs and shrubs such as tall fescue, Suaeda salsa, Medicago sativa, Caragana korshinskii, Nitraria tangutorum, and poplar trees. The saline–alkali soil source area has a temperate continental monsoon climate, with an annual average temperature of 6.4°C, an annual accumulated temperature of 2,846.5°C, and an average annual precipitation of 389 mm (26, 27). The region is windy and experiences large temperature differences between day and night. How can the biological interaction between saline–alkali soil and fallen poplar leaf litter be utilized—through the application of our developed GO as a catalyst—to improve soil properties and enable its use for agricultural production? This question stimulated us to initiate this research project (22, 23, 26). Ultimately, our goal is to build an interaction model for improving this soil type and upgrading it for agricultural use.
Therefore, we selected poplar leaf litter and saline–alkali soil from the same location as the research materials. Our aim was to explore whether GO can enhance the effect of bacterial agents (Bacillus subtilis, Pseudomonas fluorescens, and yeast) in improving the decomposition rate of litter in saline–alkali soil, and to examine the influence of GO and external bacterial agents on litter decomposition from the soil microbial perspective. The goal is to provide a theoretical basis for the effective use of GO-based composite bacterial agents to decompose litter in soil and to clarify the various influencing factors.
2 Materials and methods
2.1 Materials and methods
2.1.1 Materials
The bacteria and yeast strains (Bacillus subtilis (TY-1), Pseudomonas fluorescens (T38), and yeast (H4)) were obtained from the Institute of Plant Nutrition and Environmental Resources, Liaoning Academy of Agricultural Sciences. The solid microbial agent was formulated by mixing Bacillus subtilis (TY-1), Pseudomonas fluorescens (T38), and yeast (H4) at a 1:1:1 ratio based on colony-forming units (CFU). The final concentration of the agent was adjusted to 1 × 10⁹ CFU per gram. Graphene oxide (GO) was prepared using the two-step electrochemical method described in the literature (28). Graphite was employed as both the anode and cathode, with distilled water as the electrolyte. The graphite electrode underwent electrolysis and oxidation through the application of high-frequency pulse current, resulting in the production of functionalized graphene oxide. External electrolyte ions were introduced into the layered materials through an electrochemical electric field, following a mechanism analogous to liquid-phase stripping. The intercalation of electrolyte molecules into the graphite cathode was facilitated by direct electrochemical application of the electric field, causing an increase in interlayer spacing and a reduction in van der Waals forces between graphite layers. Ultimately, functionalized graphene oxide was synthesized successfully (28).
2.1.2 Experimental design
A litterbag method was employed to investigate the effects of GO on the decomposition of poplar leaves (Scheme 1). Poplar leaf litter was cut into uniformly sized fragments, and 2.5 g of leaves were accurately weighed and placed into nylon mesh bags measuring 15 cm × 10 cm with a mesh aperture of 0.15 mm. The saline–alkali soil used in the experiment was collected from Duzhuang Township, Yunzhou District, Datong City. Surface soil (0–30 cm depth, pH =8.7) was used for all laboratory tests. Roots, stones, and other debris were removed, and the soil was thoroughly mixed and sieved. Distilled water was added to adjust the soil moisture to 50–60% of field capacity, and the soil was incubated at room temperature for 7 days to ensure uniformity. Plastic culture pots with a diameter of 12.5 cm and a height of 11.5 cm were used in the decomposition experiment. The saline–alkali soil was placed into the pots, and the litterbags were inserted diagonally to ensure uniform contact. After placement, each pot was sprayed with 30 mL of the GO solution or distilled water using a sprayer. The pots were incubated at room temperature, and GO solution or distilled water was reapplied every 10 days to maintain consistent soil moisture. The experiment was terminated after 120 days, with three replicates per treatment. The saline-alkali soil treatments were as follows:
i. CK: saline–alkali soil irrigated with tap water.
ii. CJ: 0.2 g bacterial agents added to the straw and saline–alkali soil irrigated with tap water.
iii. CJ25: 0.2 g bacterial agents added to the straw and 25.0 mg/L GO irrigated onto the saline–alkali soil (29).
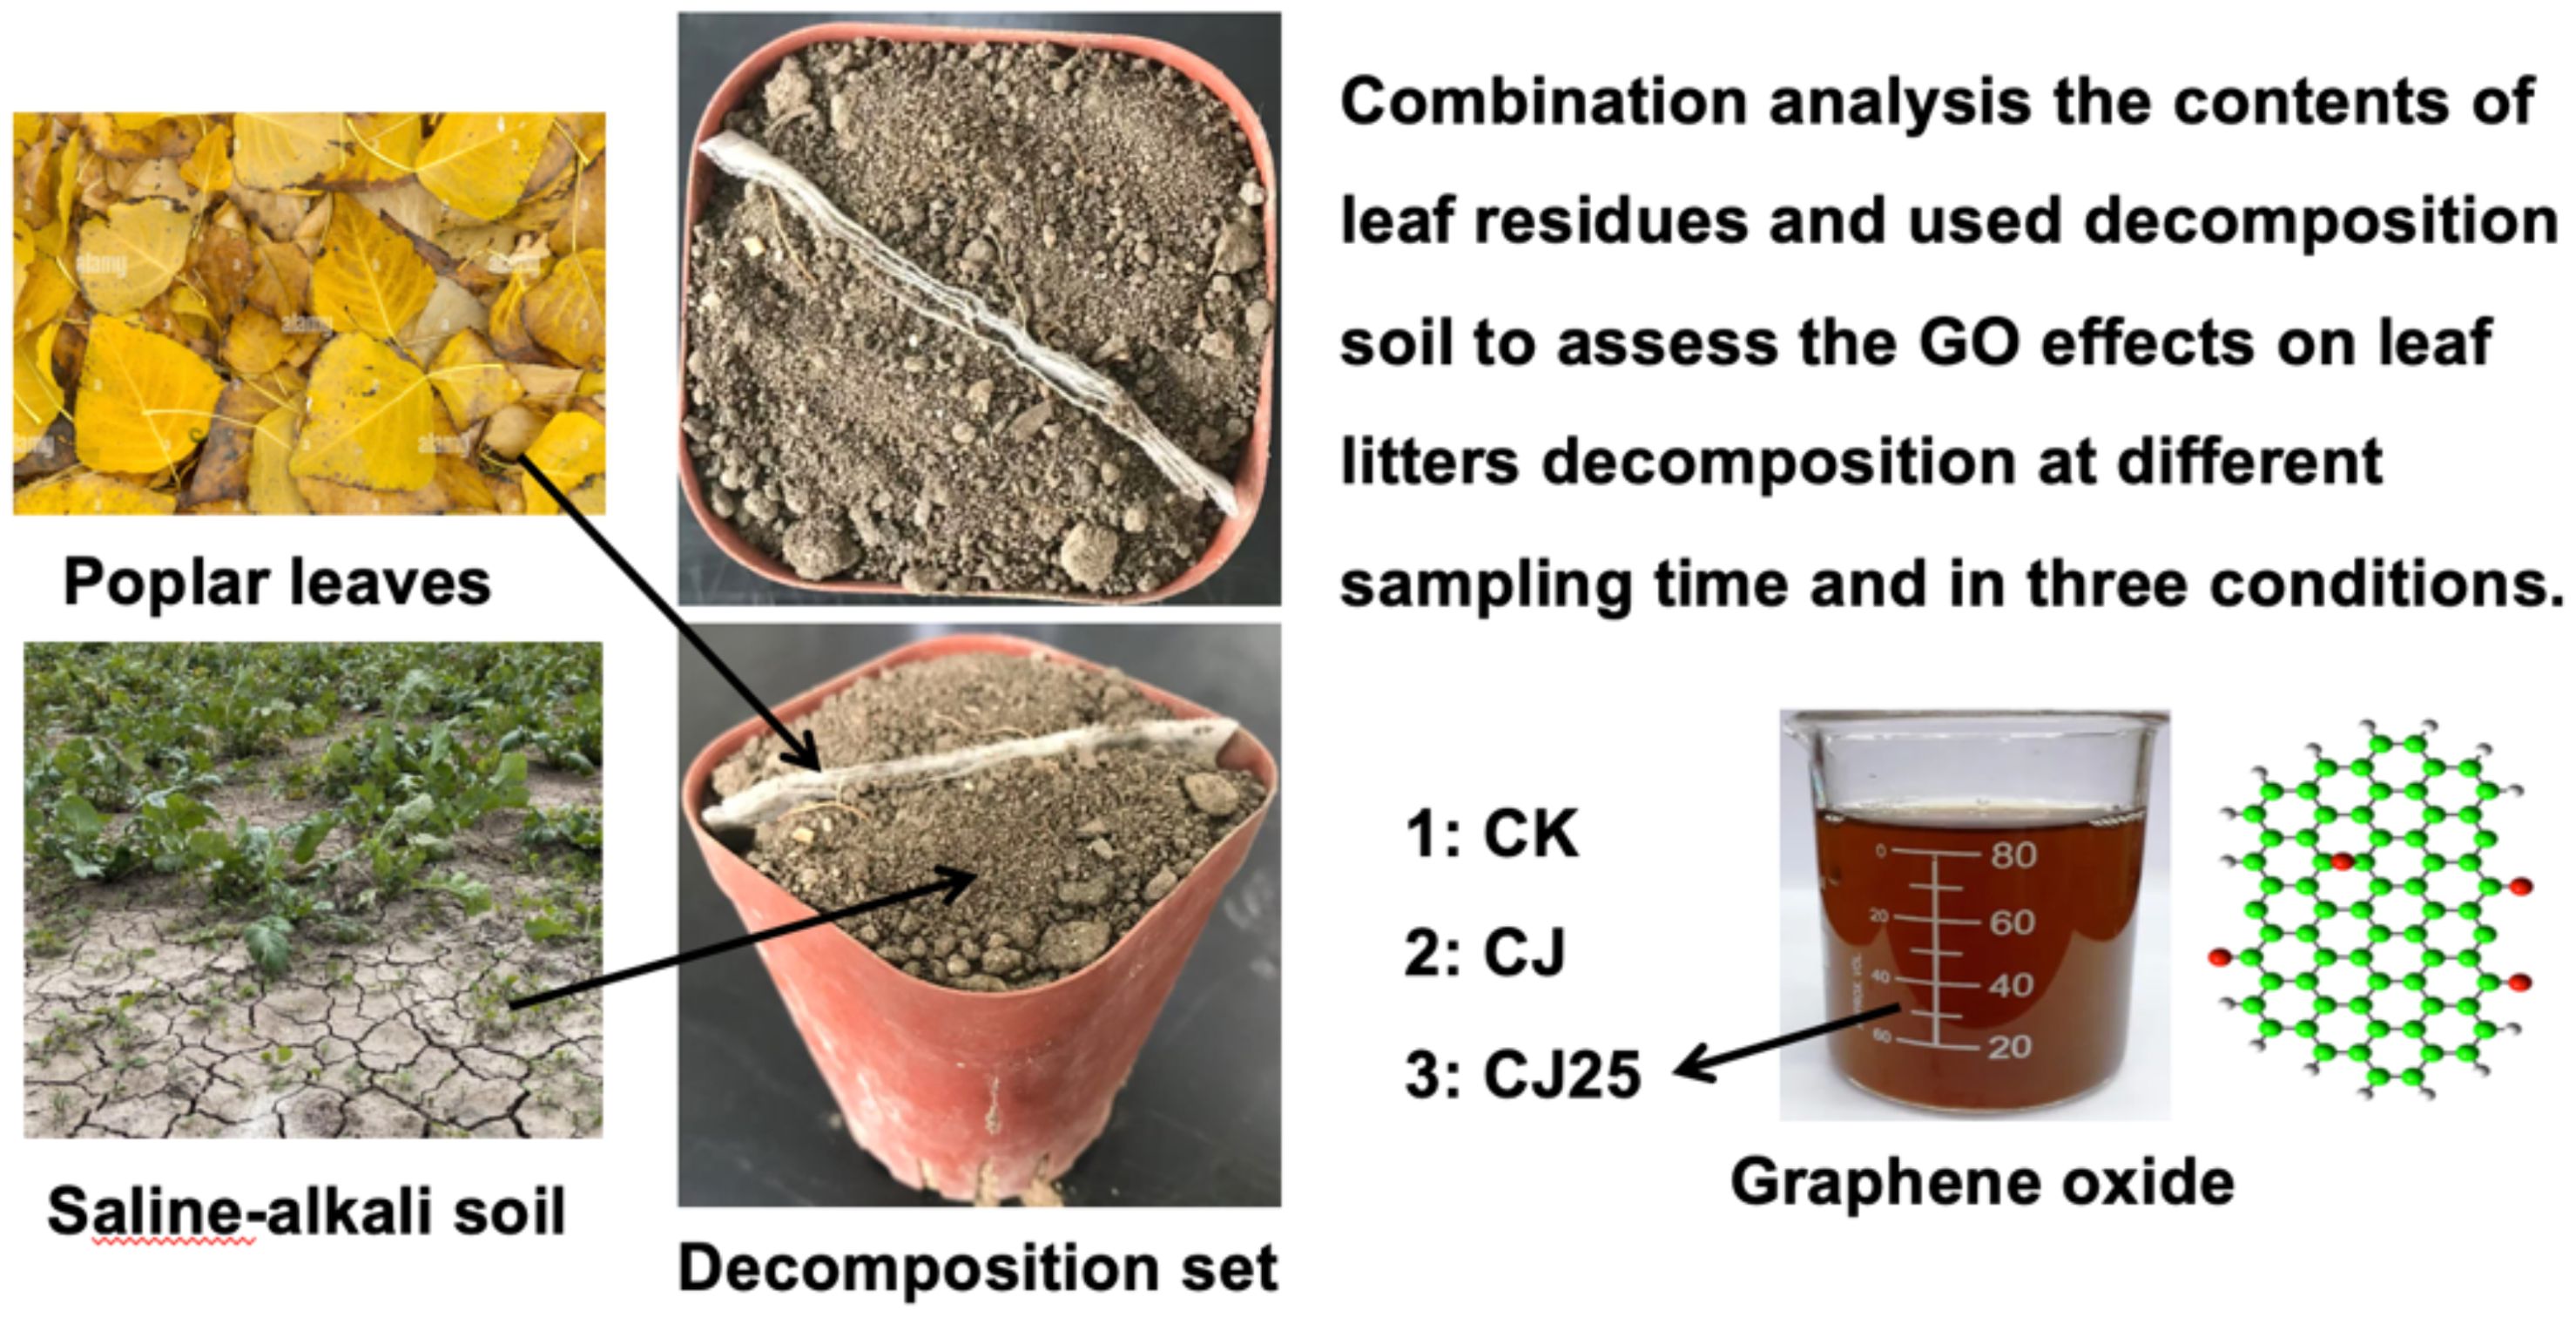
Scheme 1. Experimental design to assess the effects of GO leaves on the decomposition of poplar leaf litter.
During the experiment, decomposition bags were recovered five times at 0, 30, 60, 90, and 120 days after the start of decomposition. At each time point, three bags were taken from each treatment as replicates. Soil samples (100 g) were also collected at each time point. The decomposed litter residues were removed and washed thoroughly with deionized water until all decomposed material was eliminated. The samples were dried to constant weight at 65°C, and the mass and nutrient content of the decomposed residues were measured. Litter mass loss was calculated using the mass method. Humic acid concentrations in the litter and soil were determined using the method of fertilizers and soil conditioners-determination of humic acid concentrations in GB/T 45891-2025 (11–13).
2.1.3 Sample collection and analysis
The total nitrogen and total phosphorus contents were measured using the H2SO4–H2O2 digestion method. After digestion, the Kjeldahl nitrogen determination method and the vanadium–molybdenum yellow colorimetric method were used to determine total nitrogen and total phosphorus, respectively (11–13). The 2 mol/L KCl leaching–indophenol blue colorimetric method was used to determine soil ammonium nitrogen (30). The NaHCO3 solution leaching–molybdenum antimony colorimetric method was used to determine soil phosphorus content (30). Soil available potassium content was measured using the NH4OAc extraction–flame photometric method. Soil cellulase, dehydrogenase, urease, phosphatase, lignin, and cellulose contents were measured using the soil cellulase (S-CL) activity assay kit (BC0155), soil dehydrogenase (sDHA) kit (BC0390), soil urease (S-UE) activity assay kit (BC0125), lignin content assay kit (BC4205), and cellulose content assay kit (BC4285) (Beijing Solarbio Science & Technology Co., Ltd.).
2.1.4 Enzyme activity analysis
The activities of soil cellulase, dehydrogenase, urease, and phosphatase were determined using the soil cellulase (S-CL) activity assay kit (BC0155), soil dehydrogenase (sDHA) kit (BC0390), soil urease (S-UE) activity assay kit (BC0125), and soil acid phosphatase (S-ACP) activity assay kit (BC0140) (Beijing Solarbio Science & Technology Co., Ltd.). Enzyme activity was measured using a microplate reader (ELISA instrument; RT-6100, RAYTO, USA). Fresh soil samples were accurately weighed and passed through a 30–50 mesh sieve for analysis. The activities of different enzymes were conducted using relative methods. The content of reducing sugars produced through cellulase-catalyzed degradation was determined using the 3,5-dinitrosalicylic acid method. One unit of enzyme activity was defined as the amount of enzyme that produces 1 mg of glucose per gram of soil per day. Dehydrogenase activity was determined using the triphenyl tetrazolium chloride reduction method, with one unit defined as the amount of enzyme that causes an increase of 0.01 in optical density (OD) per mL of reaction mixture per hour per gram of sample at 37°C. The amount of NH3-N produced by urease hydrolysis of urea was determined using the indophenol blue colorimetric method, with one unit of activity defined as the production of 1 μg NH3-N per gram of soil per day. Phosphatase activity was measured using the p-nitrophenyl phosphate method, with one unit of activity defined as the amount of enzyme that releases 1 nmol of phenol per gram of soil per day at 37°C (22).
2.1.5 Scanning electron microscopy characterization and analysis
Poplar leaf tissues treated with the synergistic combination of graphene oxide and bacterial agents were cut into approximately 1 mm× 1 mm squares using a microtome. The samples were fixed with 2.5% glutaraldehyde (340885, Sigma), rinsed, and subjected to gradient dehydration in ethanol aqueous solutions at concentrations of 30%, 50%, 70%, 90%, and 100%. After natural drying, the samples were sputter-coated with gold and observed for surface morphology using scanning electron microscopy (SEM; TESCAN MAIA 3 LMH).
2.2 Data processing and analysis
The formula used to calculate the litter mass loss rate (Lt) is as follows:
where M0 is the initial dry weight of litter and Mt is the dry weight of litter in the litterbag bag at time t.
The Olson exponential decay model was used to fit the litter mass residual rate (18, 31, 32):
where y is the mass residual rate (%), A is the fitting coefficient, e is the natural base, k is the decomposition coefficient, and t is the decomposition time (33).
The formula to calculate the relative nutrient return index (RRI) is (34):
where is the initial concentration of an element in the litter, and is its concentration at time t. CRRI (carbon relative return index), NRRI (nitrogen relative return index), and PRRI (phosphorus relative return index) represent the relative return indices of carbon, nitrogen, and phosphorus, respectively. A positive RRI value indicates a net release of elements during litter decomposition, while a negative value indicates net accumulation.
Statistical analysis was performed using Microsoft Excel for data organization, and Origin 9.0 was employed for graphical representation. Prior to the two-way ANOVA, the assumptions of normality (assessed using the Shapiro–Wilk test) and homoscedasticity (evaluated using Levene’s test) were verified. To assess differences in litter mass loss rate, soil nutrient content, and soil enzyme activities, a two-way analysis of variance (two-way ANOVA) was conducted using SPSS 26.0, followed by the Tukey HSD post hoc test at a significance level of p<0.05. The main factors in the ANOVA were time and treatment, with all indicators measured repeatedly over time.
3 Results and discussion
3.1 Changes in surface morphology and microscopic appearance during litter decomposition
Changes in the surface morphology of poplar leaves during decomposition are shown in Figure 1. At day 0, the litter was mostly yellow, and the stalks displayed clear fiber structures. As decomposition progressed, the color of the litter gradually darkened. Across treatments, the visible surface morphology did not differ greatly during most of the decomposition period; however, at 120 days, the surface of the poplar leaves under the CJ25 treatment appeared the darkest (dark brown). This suggests that GO can enhance the effect of bacterial agents and promote litter decomposition.

Figure 1. Changes in surface morphology during litter decomposition under three different treatments (CK, CJ, and CJ25).
The effects on the surface structure of the litter are shown in Figure 2. Figure 2a shows the initial surface structure of poplar leaves, characterized by a relatively flat surface and intact stomata. Figures 2–d show the surface structures of poplar leaves under CK, CJ, and CJ25 treatments at 120 days. The surface structure of CK-treated leaves showed slight disruption, whereas CJ- and CJ25-treated leaves exhibited substantial damage, with CJ25 showing the greatest degree of degradation.
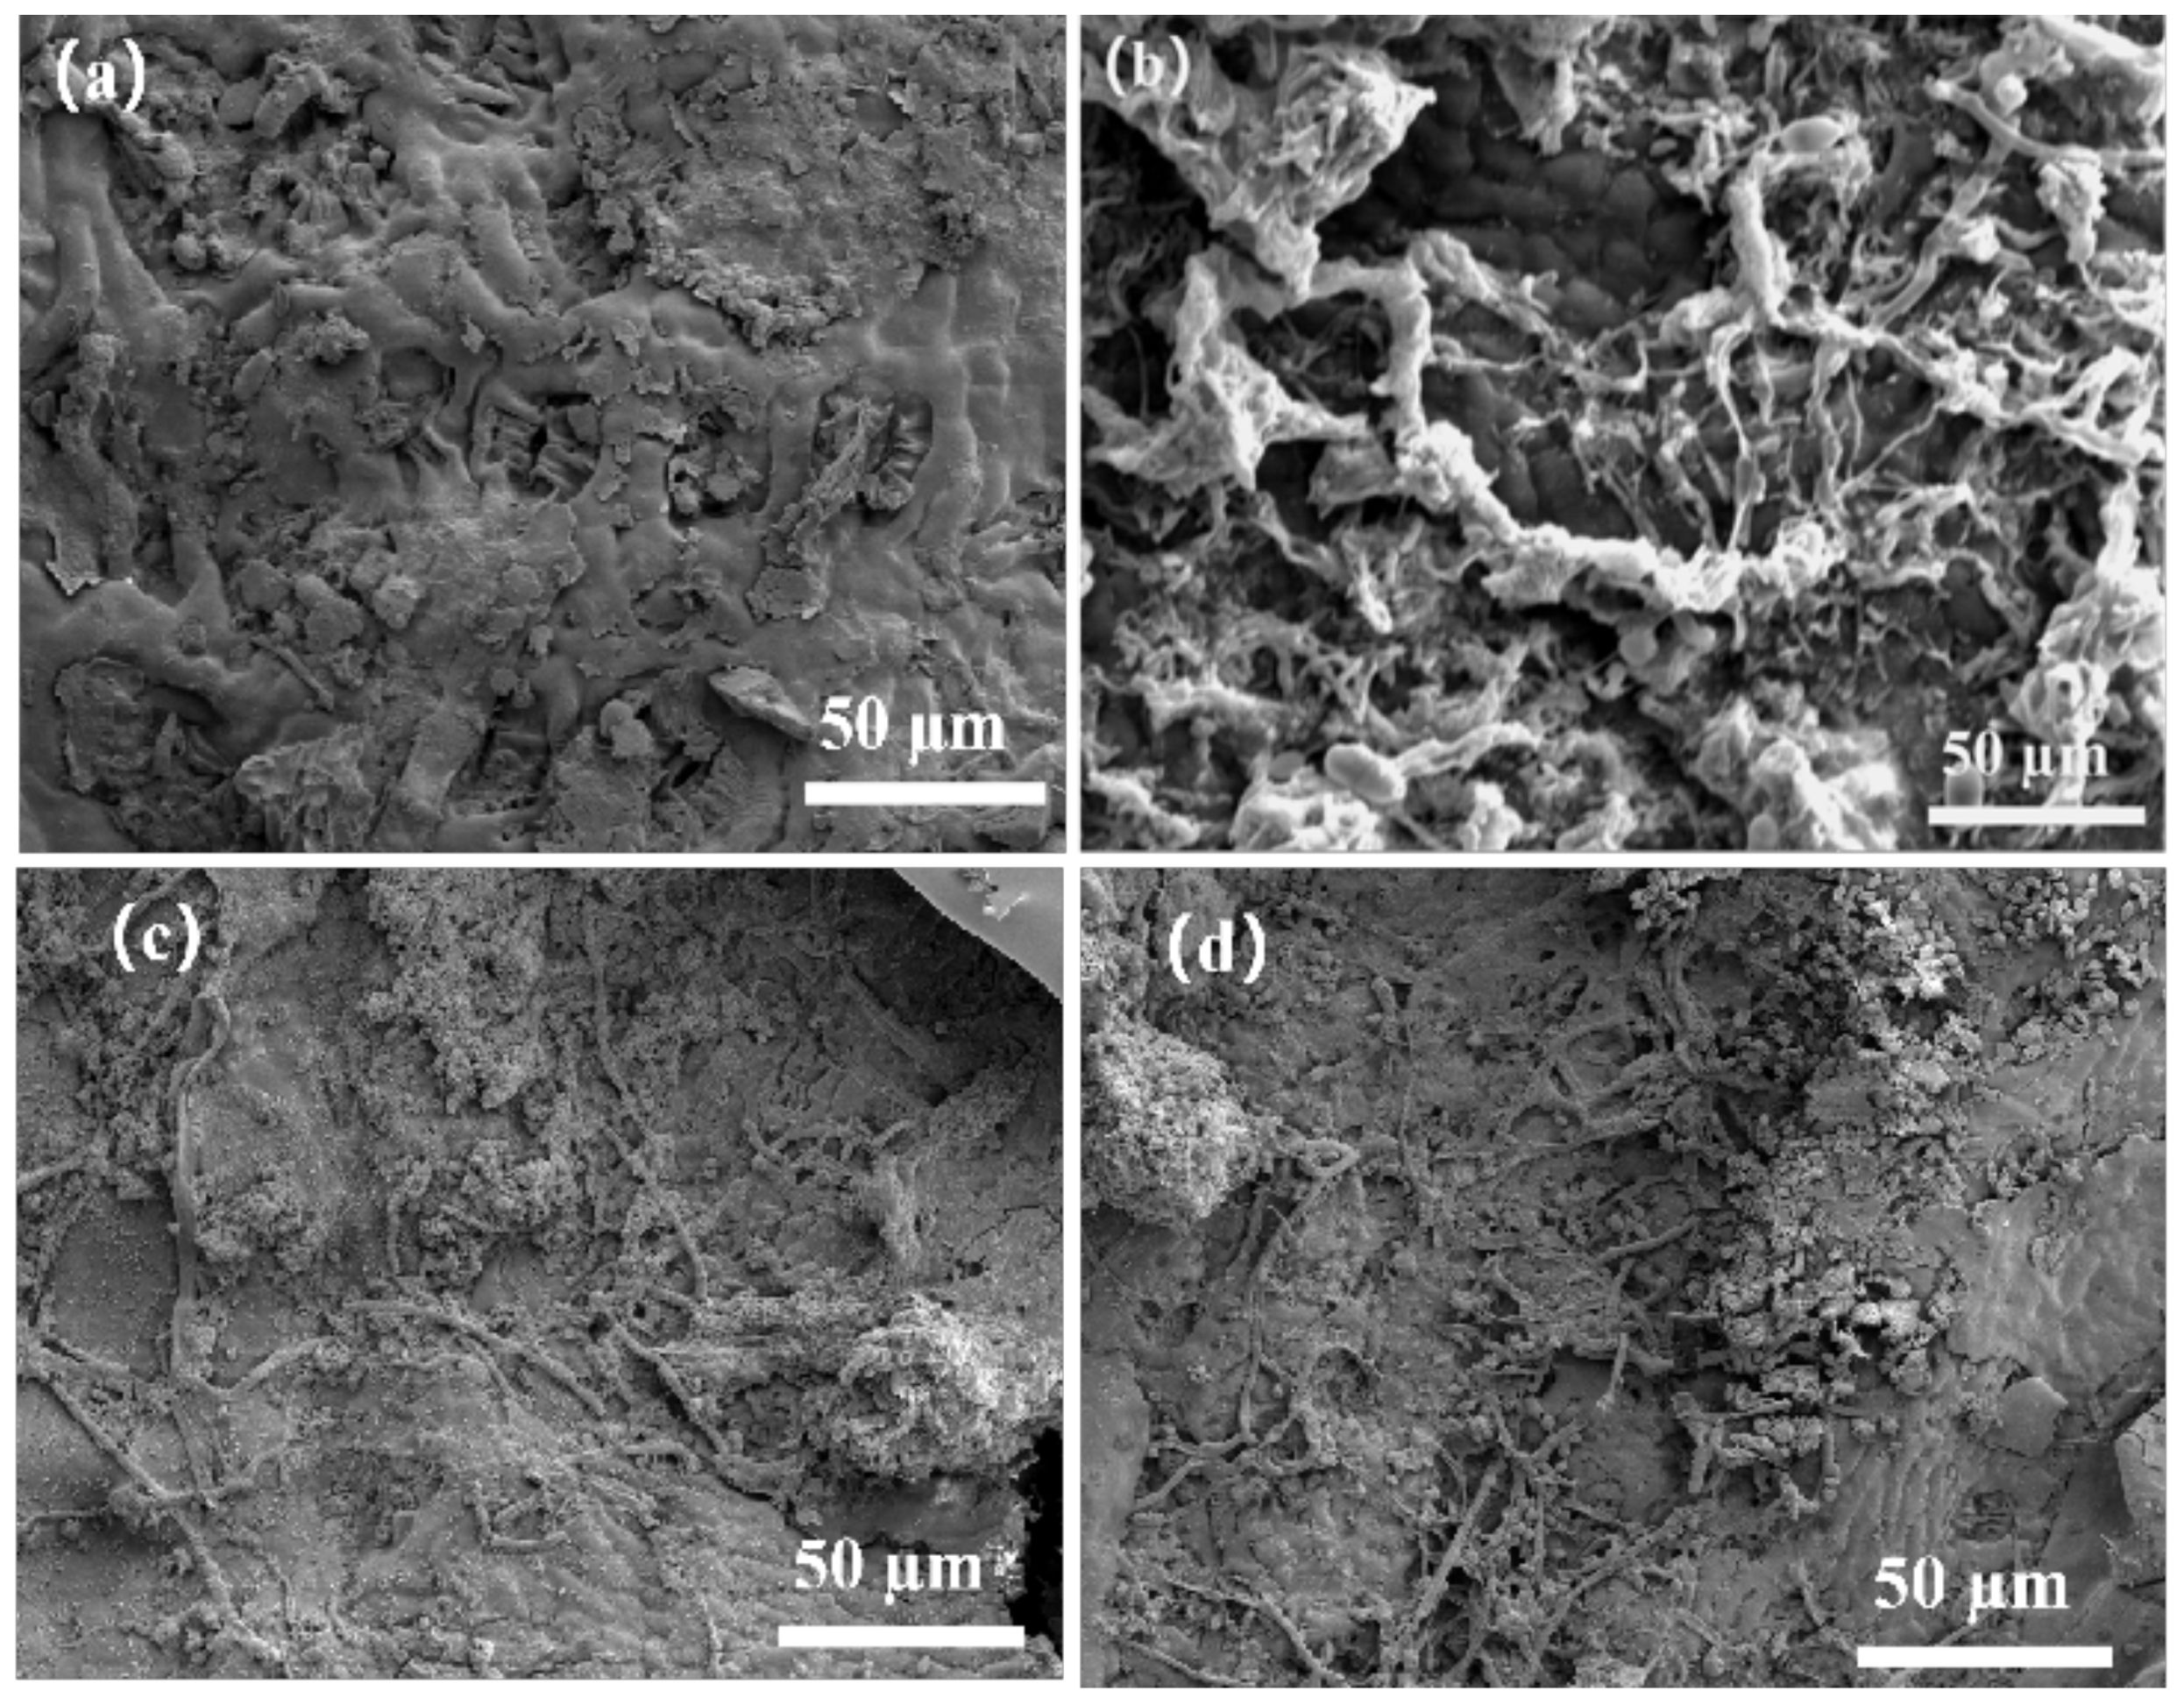
Figure 2. Scanning electron microscopy (SEM) of poplar leaves before and after decomposition under different treatments. (a) Initial poplar leaves; (b–d) leaves under CK, CJ, and CJ25 treatments at 120 days of decomposition.
Furthermore, GO was successfully isolated from the surface of the decomposed litter and characterized using SEM and Raman spectroscopy. SEM imaging revealed that GO exhibits a transparent, gauze-like layered structure with distinct wrinkles, curled edges, and folds (Supplementary Figure S1a). Raman spectroscopy confirmed the presence of functionalized graphene, indicated by prominent D and G peaks (Supplementary Figure S1b).
3.2 Changes in litter mass loss rates
Changes in litter mass loss rate are shown in Figure 3. The litter mass loss rates of all three treatments increased rapidly at first and then gradually leveled off. The mass loss rate in the CJ25 treatment was consistently higher than those under CK and CJ. At 30, 60, and 90 days, the decomposition rates under CK were 25.5%, 39.7%, and 48.2%, respectively. Under CJ, the rates were 30.1%, 44.1%, and 51.7%, while those under CJ25 were 40.6%, 58.9%, and 64.2%, which were 10.5%, 14.8%, and 12.5% higher than CJ, respectively, showing significant differences (p<0.05). At 120 days, the mass loss rates of CK, CJ, and CJ25 were 50.5%, 57.7%, and 65.6%, respectively, with CJ25 being 7.9% higher than CJ (p < 0.05).
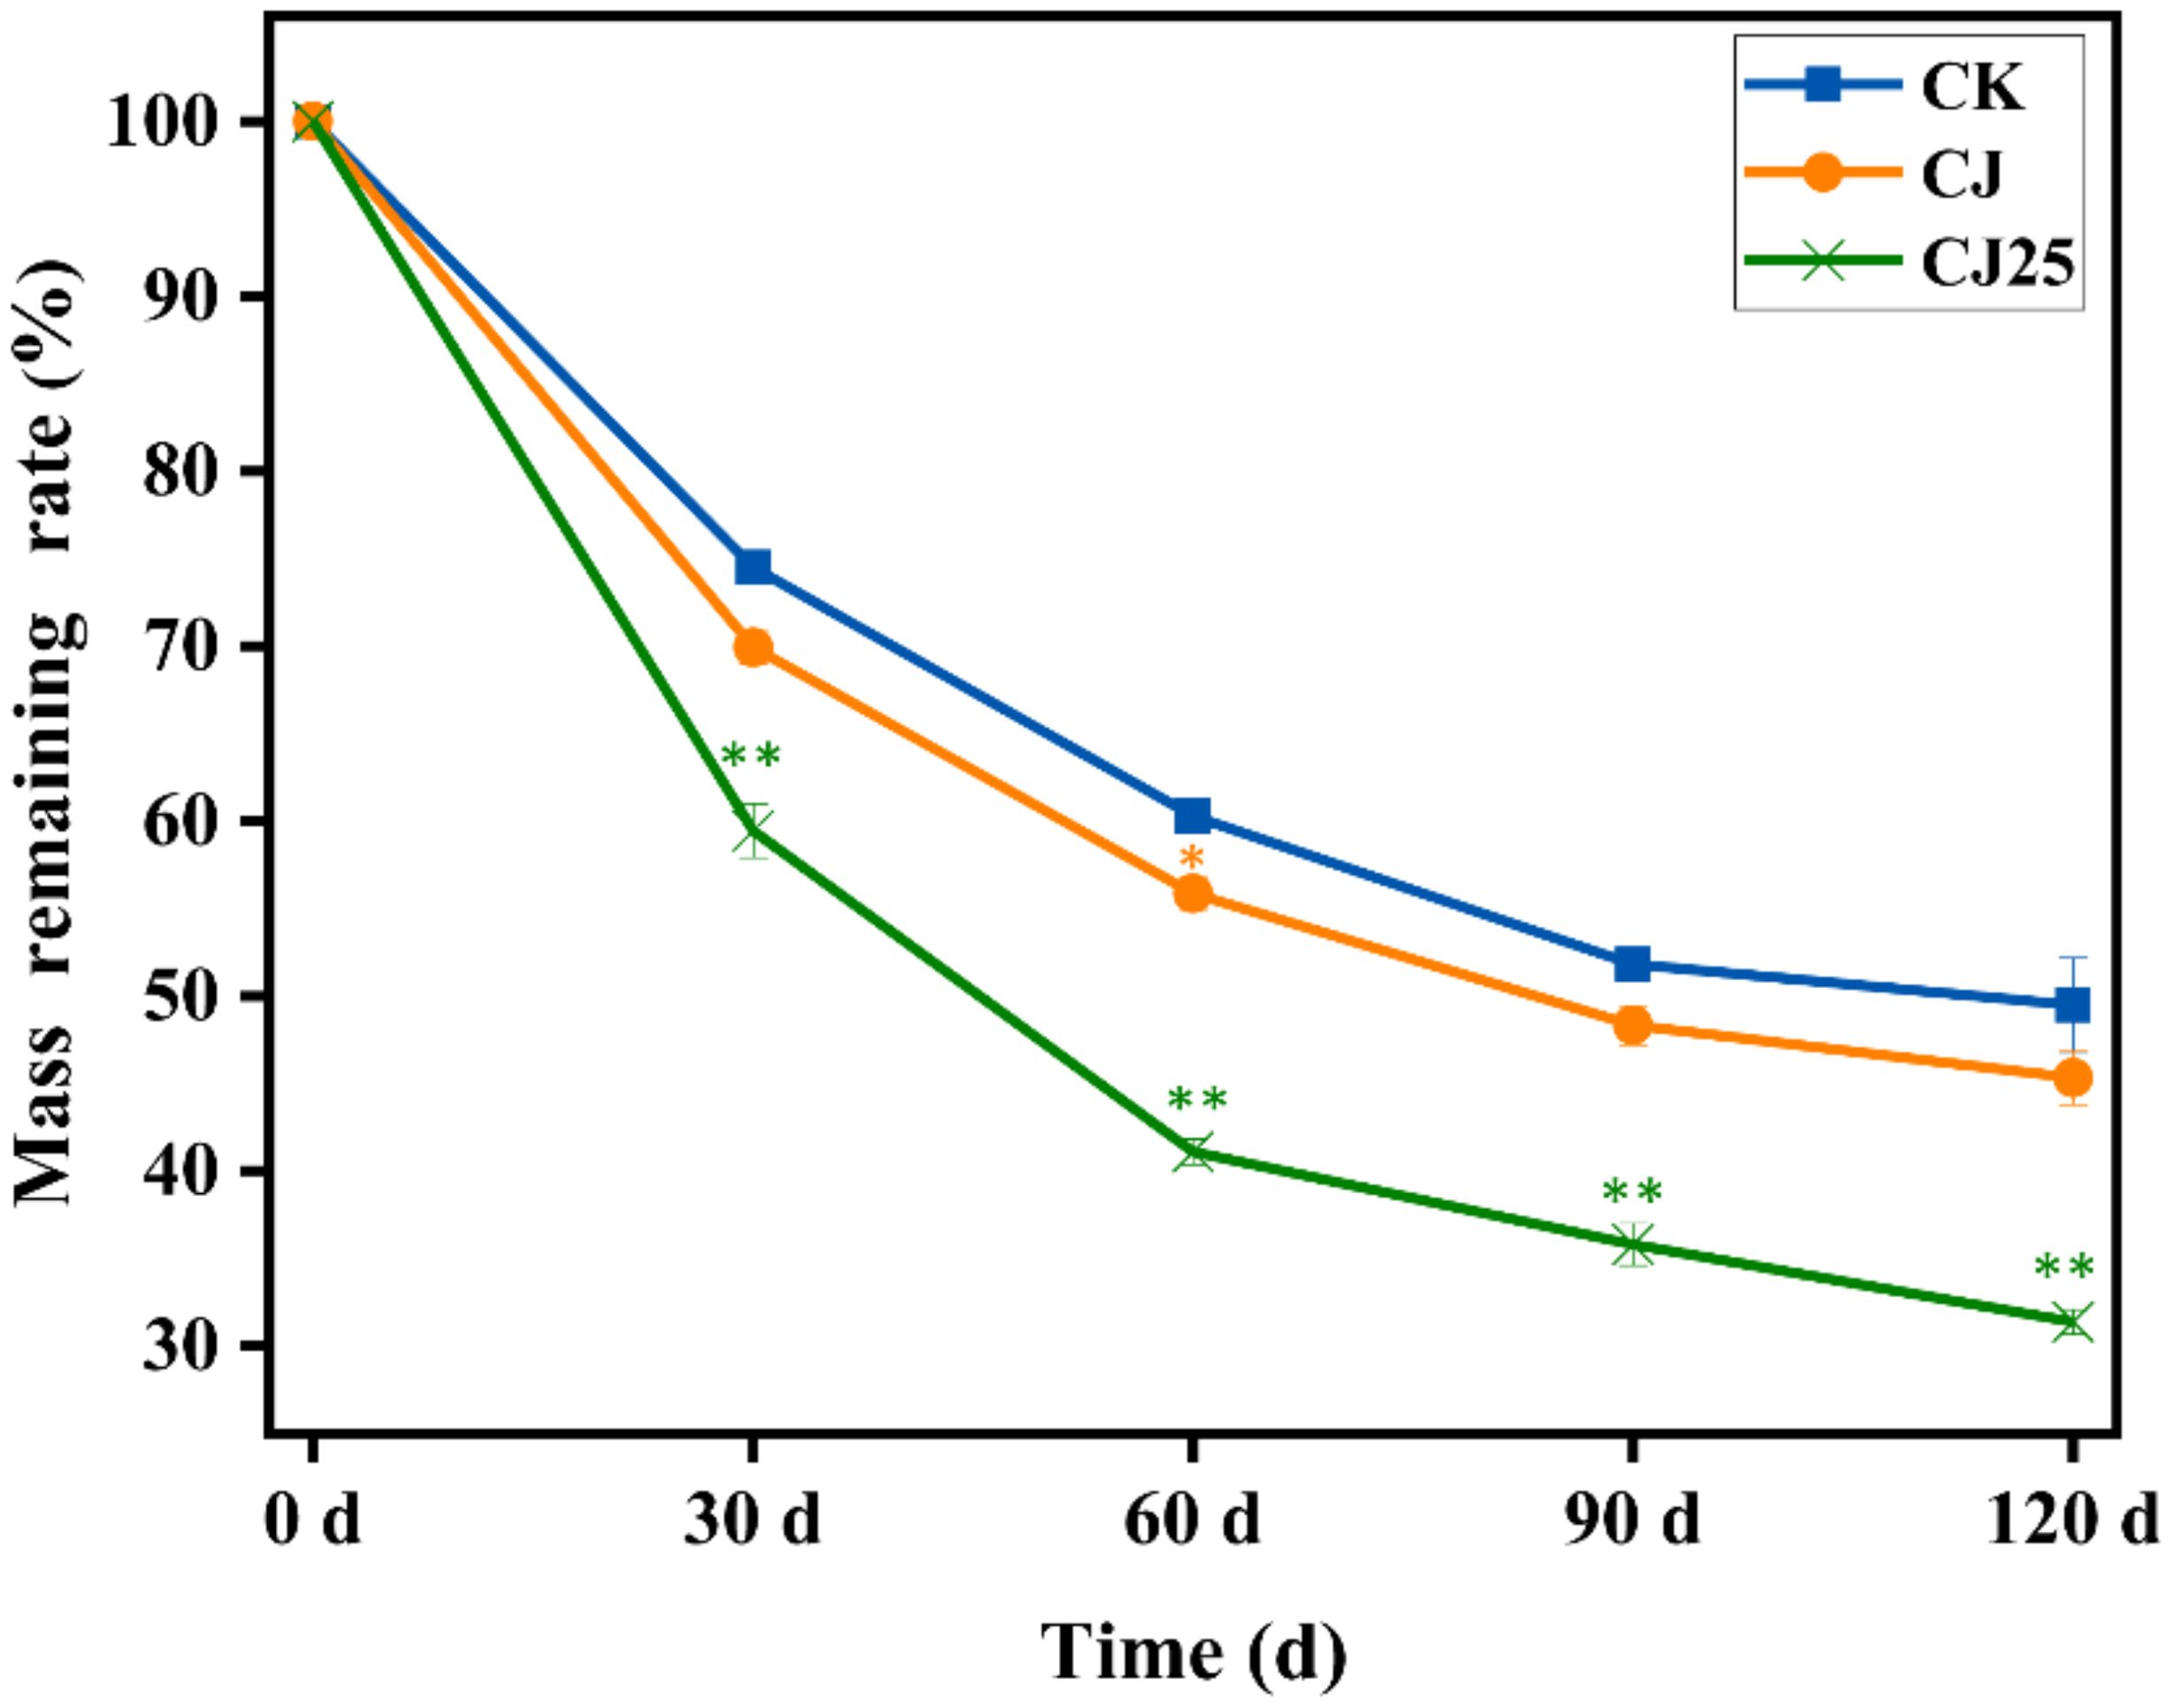
Figure 3. Effects of different treatments on litter mass loss rate over time (days). Error bars represent the standard deviations of three biological replicates (litterbag). Data were statistically analyzed using two-way ANOVA. Significance is indicated with asterisks (* indicates p<0.05, ** indicates p<0.01).
Changes in litter decomposition rate: The mass loss rate is shown in Figure 3. Based on these change curves over time, the Olson negative exponential decay model was used to fit the mass change of litter decomposition, and the fitting coefficients R2 were all high (>0.91), which indicates that the fitting effect is acceptable (Table 1). The fitting equation was used to calculate the half-life (T0.5) and turnover period (T0.95) of litter mass decomposition. It was predicted that the time required for 50.0% decomposition of litter under CK, CJ, and CJ25 treatments is approximately 119, 106, and 73 days, respectively, and the time required for 95.0% decomposition is 515, 460, and 318 days, respectively.

Table 1. Olson time decay model fitting of litter decomposition process.
Among the treatments, the time required for 50.0% and 95.0% decomposition under CJ25 was 63.0% (p<0.05) and 62.0% (p<0.05) shorter, respectively, than that under CJ. This indicates that the addition of 25.0 mg/L GO along with bacterial agents significantly accelerates litter decomposition.
In summary, the addition of 25.0 mg/L GO and bacterial agents has a certain promoting effect on litter decomposition and increases the decomposition rate. At present, studies have shown that GO can strengthen bacterial colonies and promote pollutant degradation. For example, Sun et al. (36) showed that appropriate concentrations of graphene oxide strengthened Pseudomonas aeruginosa and promoted the degradation of polycyclic aromatic hydrocarbons in soil; Mu et al. (37) found that graphene oxide quantum dots (GOQDs) can induce the proliferation of Bacillus cereus and the secretion of extracellular polymers, promoting the degradation of polycyclic aromatic hydrocarbons, indicating that GO can be used as a reinforcing and stimulating substance in bioremediation for pollutant degradation and soil remediation.
3.3 Changes in total carbon, total nitrogen, and total phosphorus content in litter
Changes in total carbon content in litter: The release of carbon is mainly related to the decomposition of organic matter and is consistent with the decomposition rate of litter. In most cases, the faster the litter decomposition rate, the faster the carbon release rate, and vice versa (11, 12). Figure 4a shows the change of carbon content during litter decomposition. The initial carbon content of litter was 709.7 g/kg, with the carbon content in litter gradually decreasing over time. At 30 and 60 days of decomposition, the carbon content of CJ25 and CJ was significantly lower than that of CK (p <0.05). However, at 90 and 120 days of decomposition, the carbon content of each treatment was CK>CJ>CJ25, with CJ and CJ25 almost equal (p>0.05) but significantly lower than CK (p < 0.05).
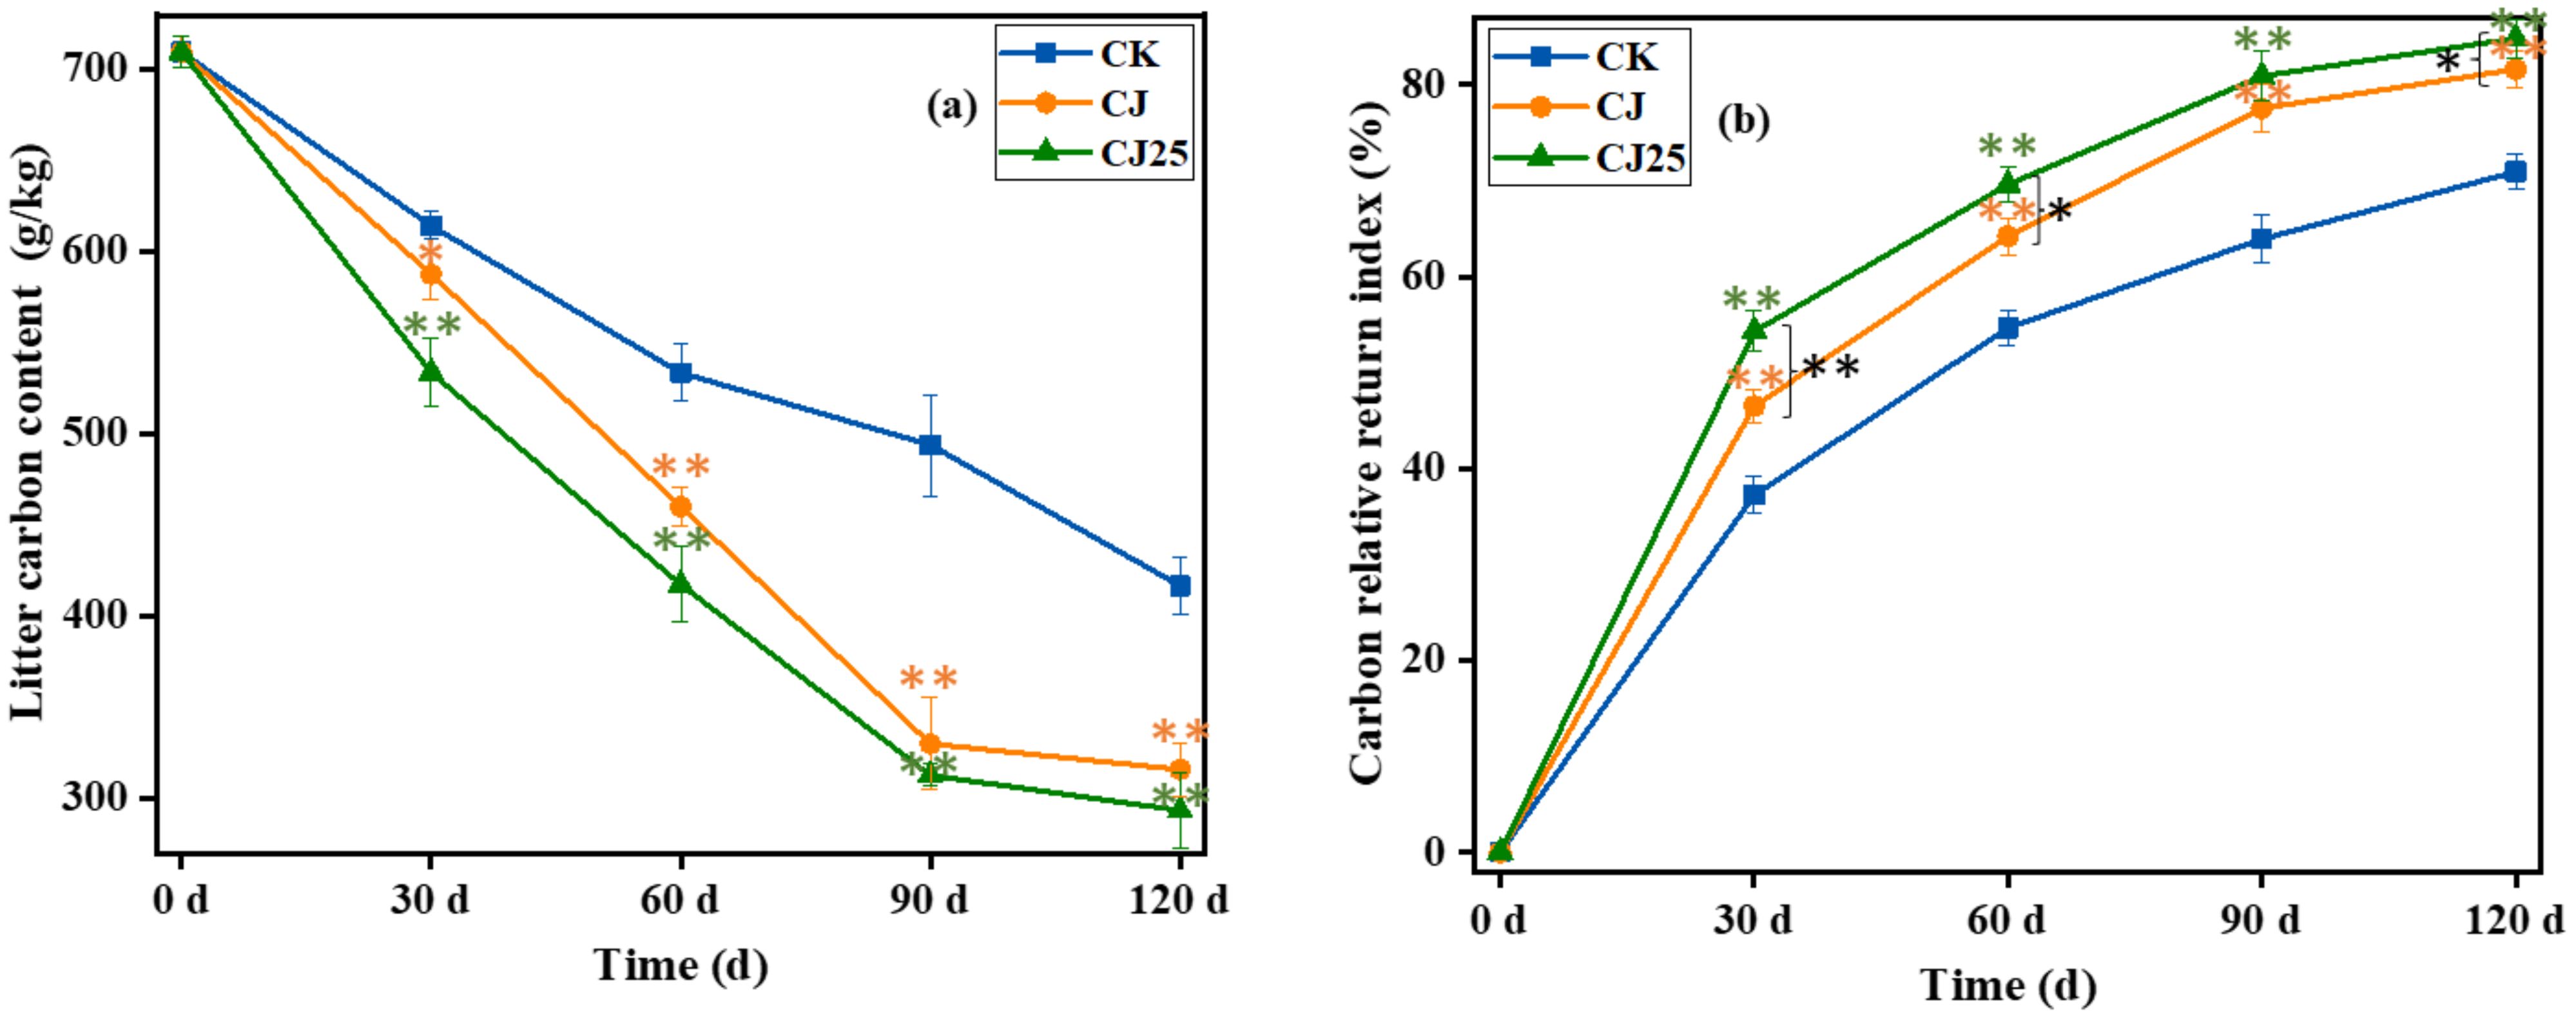
Figure 4. Effects of different treatments during the litter decomposition process over time: (a) litter total carbon content and (b) carbon relative return index. In the line charts, error bars represent the standard deviations from three biological replicates (litterbags). Data were statistically analyzed using two-way analysis of variance (two-way ANOVA). Significance is indicated with asterisks (*p<0.05, **p<0.01).
The change in relative carbon return index during litter decomposition is shown in Figure 4b. During decomposition, the CRRI was always greater than zero, indicating that carbon was in a net release mode. At 30 and 60 days of decomposition, the CRRI of CJ25 and CJ was significantly higher than that of CK—16.7% and 8.4% higher, respectively (p<0.05). At 90 and 120 days of decomposition, the CRRI of CJ25 and CJ was significantly higher than CK, but there was no major difference between CJ25 and CJ (p>0.05). This indicates that the addition of 25.0 mg/L GO and bacterial agents can increase the release rate of carbon in the early stage.
Changes in total nitrogen content in litter: Litter decomposition is an important source of soil nitrogen and an important link in the soil nitrogen cycle (38). Figure 5a shows the changes in nitrogen content during litter decomposition. The initial nitrogen content of litter was 14.3 g/kg. Unlike the trend of litter carbon content, nitrogen content first increased and then decreased. At 30 days of decomposition, the nitrogen content of litter in each treatment was 21.1 g/kg (CK), 24.3 g/kg (CJ), and 27.0 g/kg (CJ25), with significant differences (p<0.05). At 60, 90, and 120 days of decomposition, the nitrogen content of litter was CK>CJ>CJ25, with CJ and CJ25 much lower than CK (p < 0.05), but with no obvious difference between CJ and CJ25 (p>0.05).
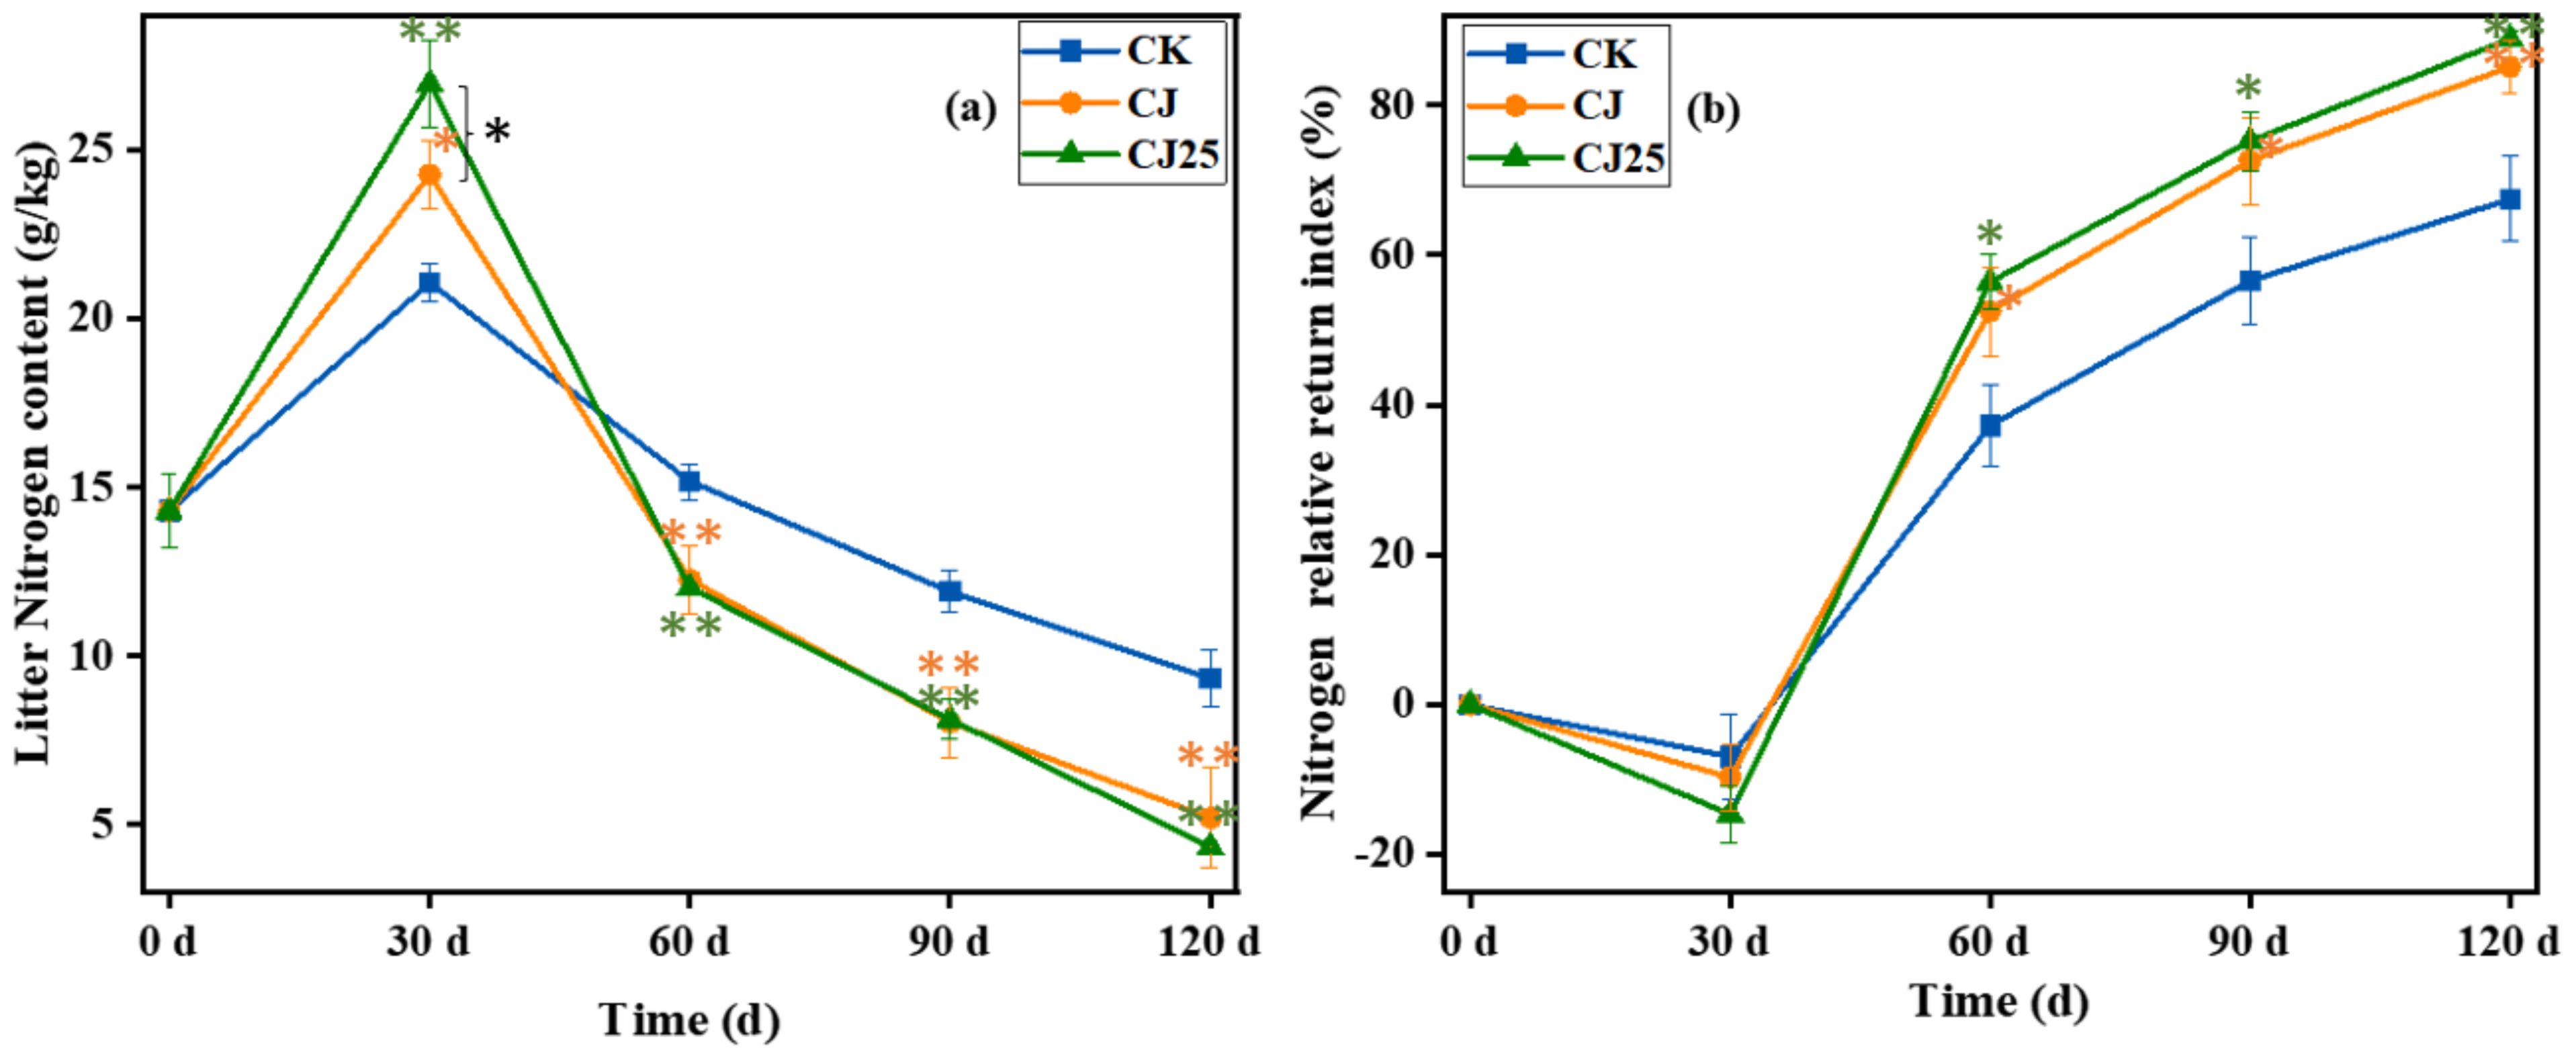
Figure 5. Effects of different treatments on nitrogen content during the litter decomposition process as a function of time: (a) litter total nitrogen content and (b) nitrogen relative return index. In the line charts, the error bars represent the standard deviations from three biological replicates (litterbags). Data were statistically analyzed using two-way analysis of variance (two-way ANOVA). Significance is indicated with asterisks (*p<0.05, **p<0.01).
Figure 5b shows the change in the relative return index of nitrogen during litter decomposition. NRRI first decreased and then increased over time. At 30 days of decomposition, NRRI was less than zero, indicating that nitrogen in the litter increased at this time, showing net accumulation. At 60, 90, and 120 days of decomposition, NRRI was greater than zero, indicating that nitrogen was in a net release stage, with CJ25 being the largest, CJ next, and CK the lowest. The NRRI of CJ and CJ25 was higher than CK (p<0.05), while there was no major difference between CJ and CJ25 (p>0.05), indicating that the addition of 25.0 mg/L GO and bacterial agents can slightly increase the release rate of nitrogen at 60–120 days of decomposition. This experimental data suggests that the different effect may come from the addition of bacterial agents and that the GO effect is not so significant.
Changes in total phosphorus content in litter: The changes in phosphorus content during litter decomposition are shown in Figure 6a. The initial phosphorus content of the litter was around 0.7 g/kg, and the phosphorus content during decomposition showed a trend of first increasing and then decreasing. At 30 days of decomposition, the phosphorus content of the litter in each treatment was in the order CJ25>CJ>CK. At 60 and 90 days of decomposition, the order reversed to CK>CJ>CJ25, with significant differences (p < 0.05). At 120 days of decomposition, the phosphorus content of litter in each treatment was CK>CJ≈CJ25, with CJ and CJ25 significantly lower than CK (p<0.05) but not significantly different from each other (p > 0.05).
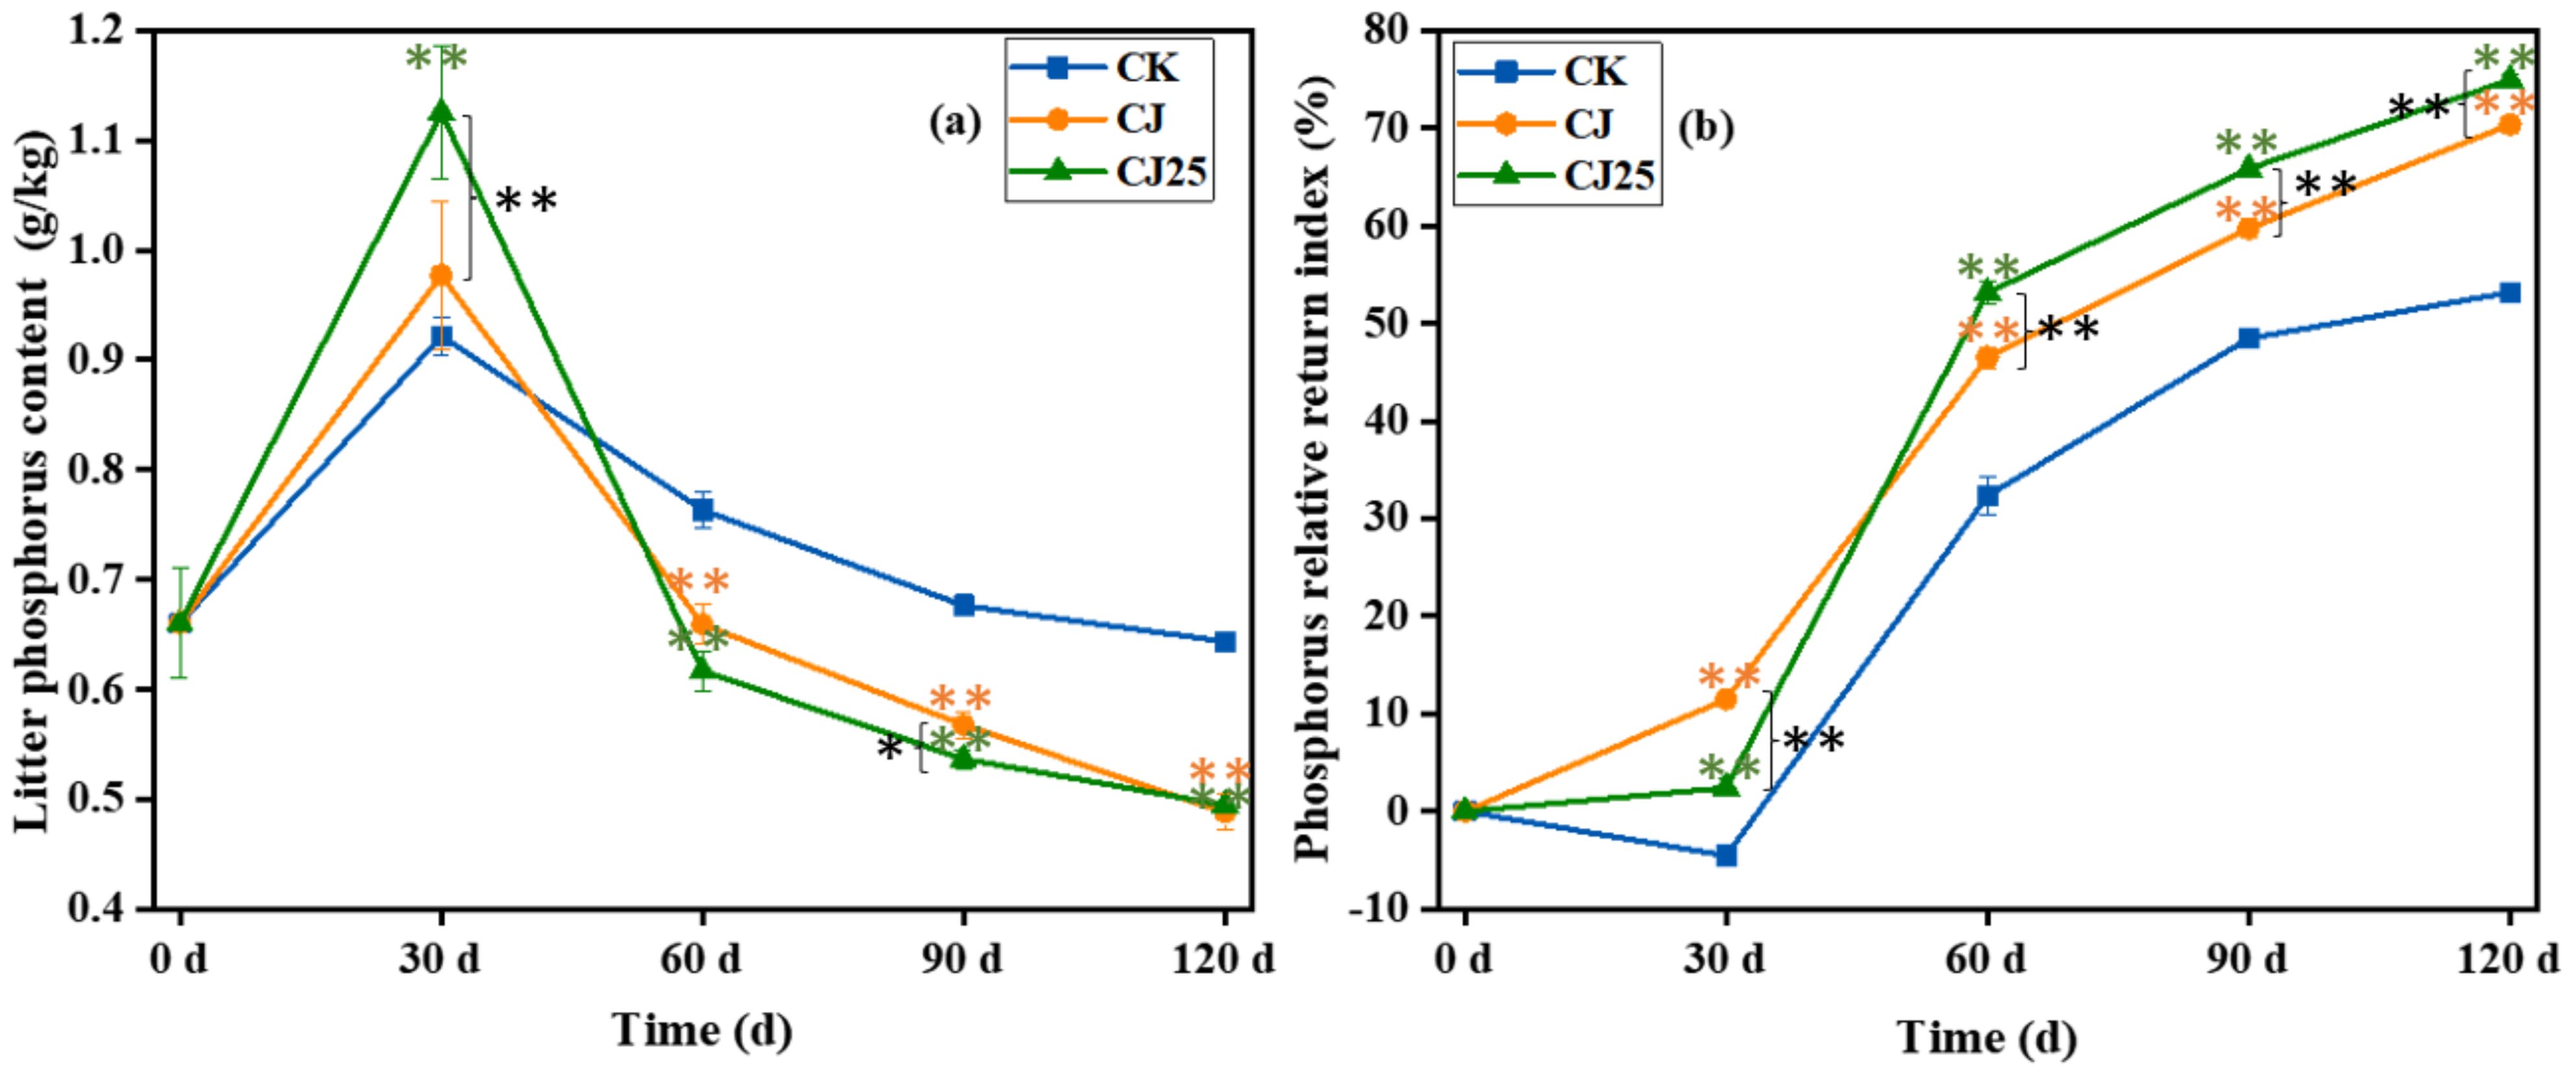
Figure 6. Effects of different treatments during the litter decomposition process: (a) litter total phosphorus content and (b) phosphorus relative return index, both as a function of time. The error bars represent the standard deviations from three biological replicates (litterbags). Data were statistically analyzed using two-way analysis of variance (two-way ANOVA). Significance is indicated with asterisks (*p<0.05, **p<0.01).
Figure 6b shows the relative return index of phosphorus during litter decomposition. The PRRI first decreased and then increased over time. At 30 days of decomposition, the PRRI of CK was less than zero, indicating that phosphorus in the litter increased under this treatment, showing a net accumulation stage, while the PRRI of CJ and CJ25 was greater than zero, indicating that phosphorus in these treatments was in a net release stage. At 60, 90, and 120 days of decomposition, PRRI was greater than zero for all treatments, indicating net release of phosphorus during this period, with CJ25>CJ>CK and significant differences (p < 0.05). This indicates that the addition of 25.0 mg/L GO and bacterial agents can increase the release rate of phosphorus at 60–120 days of decomposition.
Changes in cellulose and lignin content in litter: Cellulose and lignin have complex structures and are intertwined with hemicellulose to form a heterogeneous network, with a slow decomposition rate (39). The change in cellulose content during litter decomposition is shown in Figure 7a. The cellulose content of the CK treatment first increased and then decreased, while the cellulose content of the CJ and CJ25 treatments showed a gradual decrease. During decomposition, the cellulose content of CK was much higher than those of CJ and CJ25 (p<0.05). At 30 and 60 days of decomposition, the cellulose content of CJ25 was clearly lower than that of CJ, by 10.0% and 9.5%, respectively (p<0.05), but there were no major differences between CJ and CJ25 at 90 and 120 days (p > 0.05). On the 120th day of decomposition, the cellulose contents of CK, CJ, and CJ25 were 10.0%, 5.7%, and 5.6%, respectively.
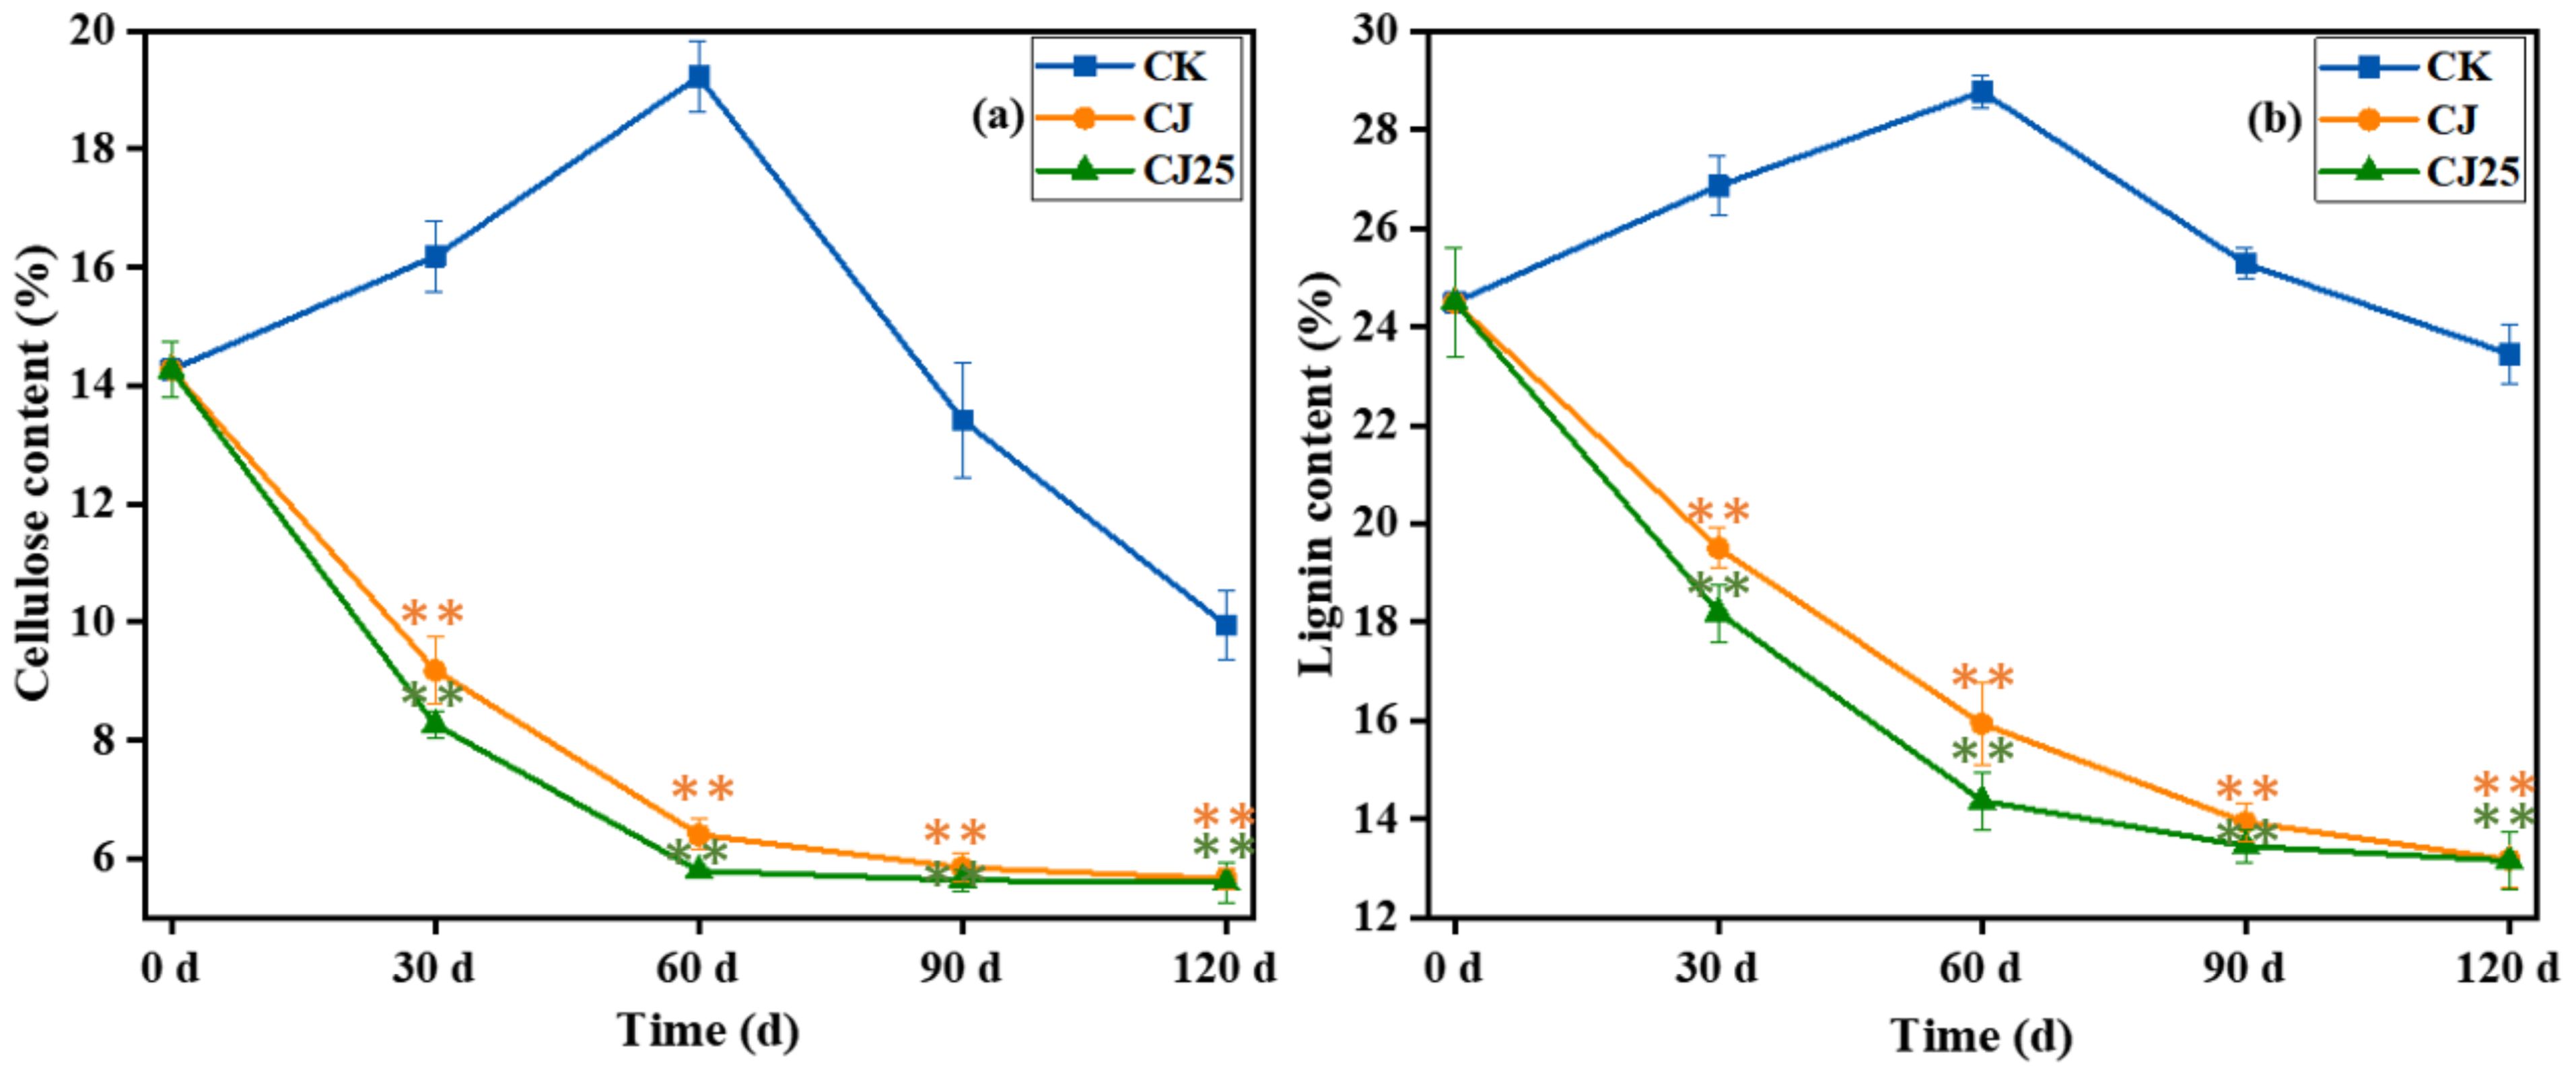
Figure 7. Cellulose (a) and lignin (b) content as a function of time during the litter decomposition process. The error bars represent the standard deviations from three biological replicates (litterbags). Data were statistically analyzed using two-way analysis of variance (two-way ANOVA). Significance is indicated with asterisks (**p<0.01).
The change in lignin content during litter decomposition is shown in Figure 7b. Its trend is similar to that of cellulose. The lignin content of the CK treatment first increased and then decreased, while the lignin content of the CJ and CJ25 treatments gradually decreased.
During the decomposition process, the lignin content of CK was much higher than those for CJ and CJ25 (p<0.05). At 30 and 60 days of decomposition, the lignin content of CJ25 was significantly lower than that of CJ by 6.7% and 9.4%, respectively (p<0.05), but there was no significant difference between CJ and CJ25 at 90 and 120 days (p > 0.05). At 120 days of decomposition, the lignin contents of CK, CJ, and CJ25 were 23.4%, 13.2%, and 13.1%, respectively. This indicates that the addition of 25.0 mg/L GO and bacterial agents can increase the degradation rate of cellulose and lignin during decomposition.
Summarizing, the addition of 25.0 mg/L GO and bacterial agents can promote the release of carbon, nitrogen, and phosphorus in litter. Nitrogen and phosphorus elements are temporarily enriched during the decomposition process and then released as decomposition continues. The enrichment of nitrogen and phosphorus may occur because nutrients in the soil migrate to the vicinity of the decomposition bag and are adsorbed by the litter. The initial nitrogen content in the litter is low, and the released nitrogen is insufficient for microorganisms. Thus, microorganisms obtain nitrogen from the soil to meet their needs, ultimately reducing the nitrogen content in the soil and increasing the nitrogen content in the litter. Nitrogen therefore shows an enrichment behavior (40). At the same time, the cellulose and lignin contents of the CJ25 treatment are the lowest, indicating that 25.0 mg/L GO and bacterial agents can promote the degradation of cellulose and lignin in the litter (41). Comparing CJ and CJ25, there are no significant differences in the long-term effects on N and P release or in the degradation rates of cellulose and lignin between 90–120 days or after 120 days, indicating that GO addition is not more significant than adding bacterial agents alone. This demonstrates that these decomposition processes are dominated by microbial activity at later stages. However, GO is a contributing factor in the short period between 30–90 days. This is a significant finding for litter decomposition in this type of soil.
3.4 Changes in soil nutrient content
Nutrients are released during the decomposition of litter, part of which is absorbed and utilized by microorganisms and animals, with the other part returned to the soil to be utilized by plants (42). This promotes the recovery of soil fertility, is an important link in the nutrient cycle of the ecosystem, and is also an important manifestation of ecosystem function (43). Table 2 shows the changes in soil nutrient content during litter decomposition. As seen in the table, soil humic acid content gradually increased over time. On the 30th, 60th, 90th, and 120th days of decomposition, the soil humic acid content of the CJ25 treatment was significantly higher than those of CJ and CK (p < 0.05). By the 120th day, the humic acid content was 72.2 g/kg, higher than that of CJ and CK by 52.0% and 124.2%, respectively (p<0.05). The soil total nitrogen content (STNC) showed a trend of first decreasing and then increasing. At 30 days, the STNC of CJ25 was the lowest. At 60, 90, and 120 days, the STNC of CJ25 was the highest (p<0.05). At 120 days, STNC under CJ25 was higher than CJ and CK by 25.6% and 61.7%, respectively (p < 0.05).
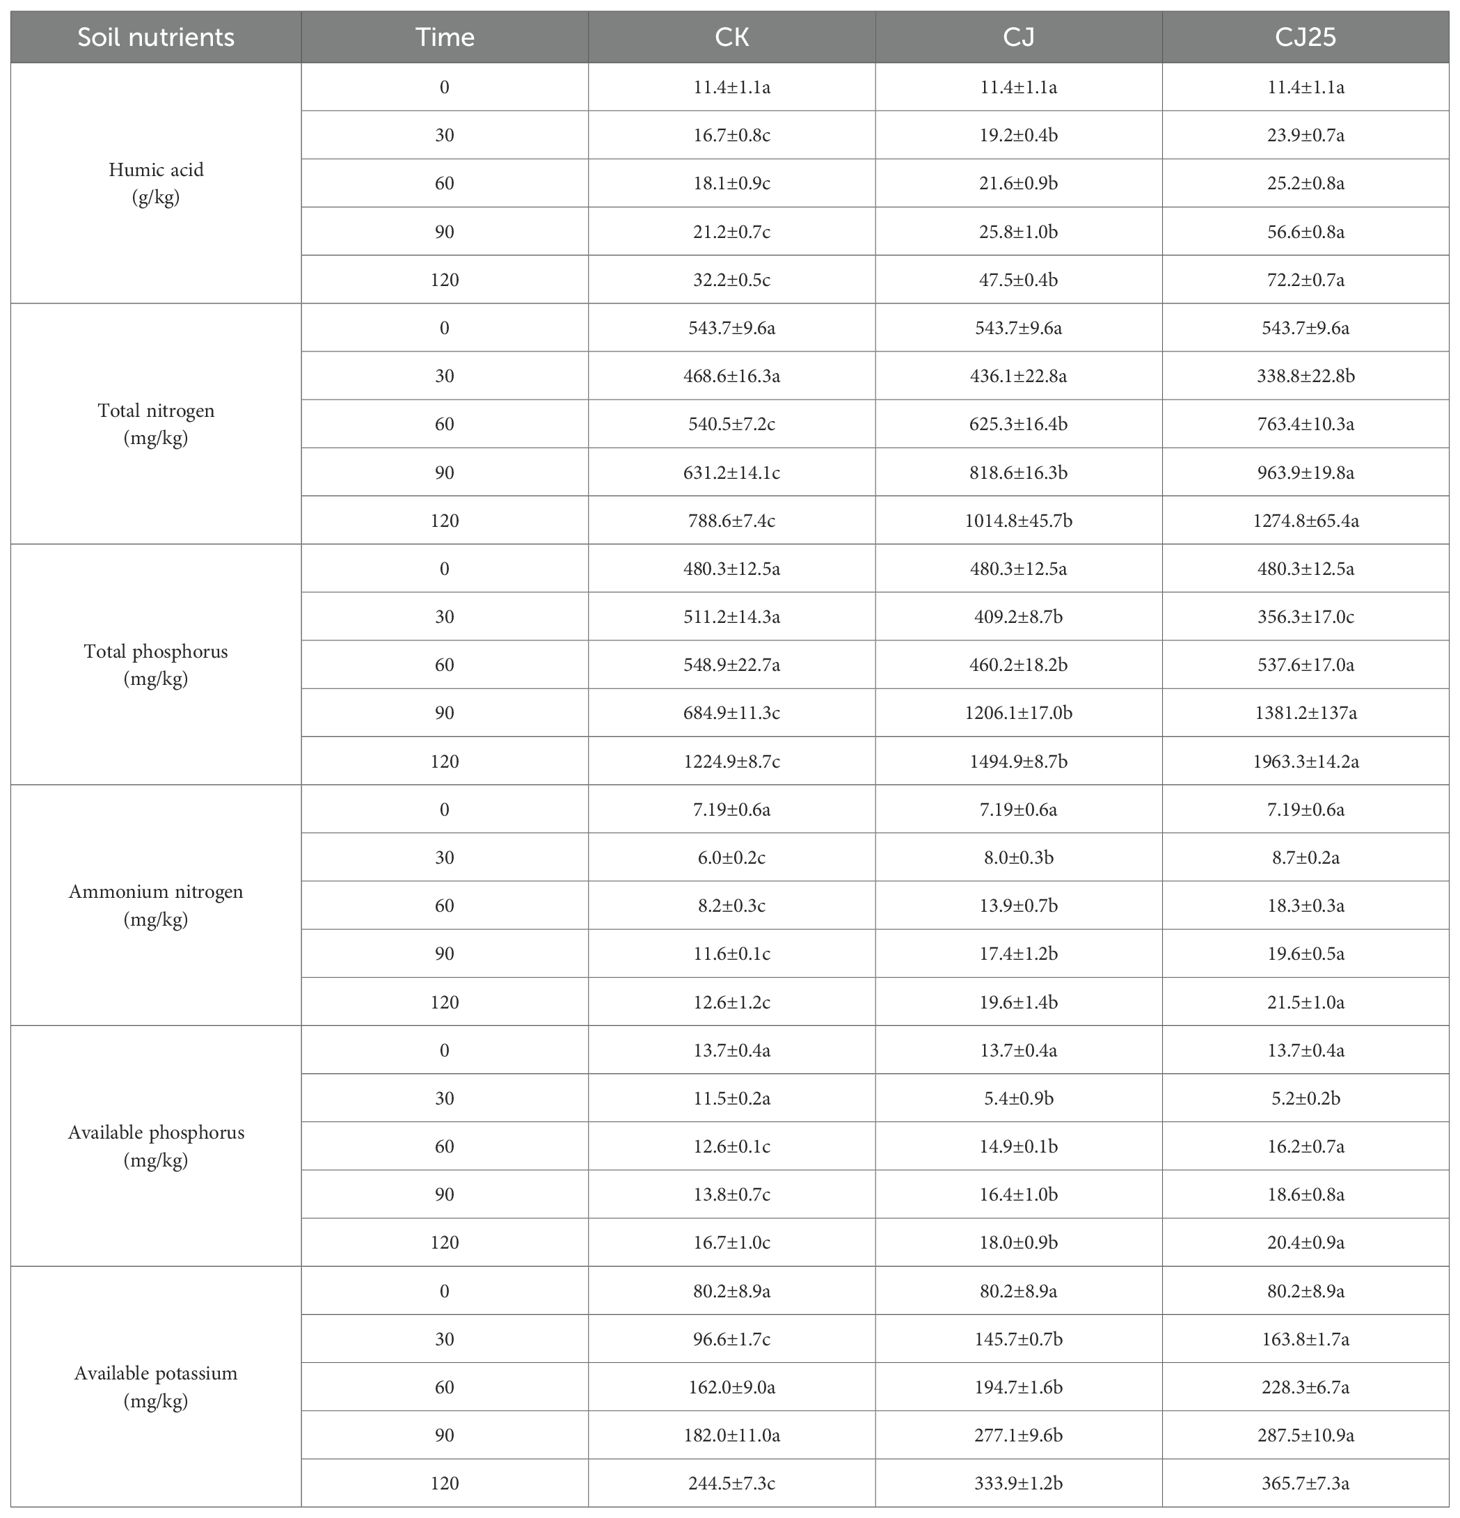
Table 2. Effects of different treatments on the contents of soil humic acid, total nitrogen, total phosphorus, ammonium nitrogen, available phosphorus and available potassium.
The soil total phosphorus content (STPC) showed different trends under different treatments. For CK, the STPC gradually increased over time, while those for CJ and CJ25 first decreased and then increased. STPC under CJ25 was the lowest at 30 days, whereas at 60, 90, and 120 days, the STPC for CJ25 increased notably compared to the initial 30 days. At 120 days, STPC under CJ25 was higher than CJ and CK by 31.3% and 60.3%, respectively (p<0.05).
The soil ammonium nitrogen content showed different changing trends for different treatments. For CK, ammonium nitrogen first decreased and then increased, while for CJ and CJ25 it gradually increased throughout the decomposition period. On the 30th, 60th, 90th, and 120th days, the ammonium nitrogen content of CJ25-treated soil was significantly higher than that of CJ and CK (p < 0.05). At 120 days, ammonium nitrogen content under CJ25 was higher than CJ and CK by 9.7% and 70.6%, respectively (p<0.05).
The soil available phosphorus content first decreased and then increased. At 30 days, CJ25 was the lowest, but afterwards it became the highest among treatments (p < 0.05). At 120 days, available phosphorus under CJ25 was higher than CJ and CK by 13.3% and 22.2%, respectively (p<0.05).
The soil available potassium content gradually increased over time, with CJ25 consistently the highest (p<0.05). At 120 days, the available potassium content under CJ25 was higher than that under CJ and CK by 9.5% and 49.6%, respectively (p<0.05).
The data in Table 2 were measured from soil collected surrounding the decomposition bags at different time points. It is evident that humic acid and total phosphorus increased more significantly than other components, indicating that poplar leaves generate mainly humic acid and organic phosphorus in the soil surrounding the litter.
3.5 Changes in soil enzyme activity
Figure 8 shows the changes in soil dehydrogenase, cellulase, urease, and phosphatase activities under different treatments. The dehydrogenase activity first increased and then decreased. At 30, 60, and 90 days, the dehydrogenase activity of CJ25-treated soil was higher than those of the CJ- and CK-treated soils; at 30 days, it was higher by 31.6% and 38.9%, respectively (p<0.05), while the activity of CJ-treated soil was only slightly higher than that of CK (p>0.05). At 30 days, the dehydrogenase activity reached its maximum values for all three treatments: 1.8, 1.9, and 2.5 U/g for CK, CJ, and CJ25, respectively. However, at 120 days, there were no significant differences in dehydrogenase activity among the three treatments (p>0.05).
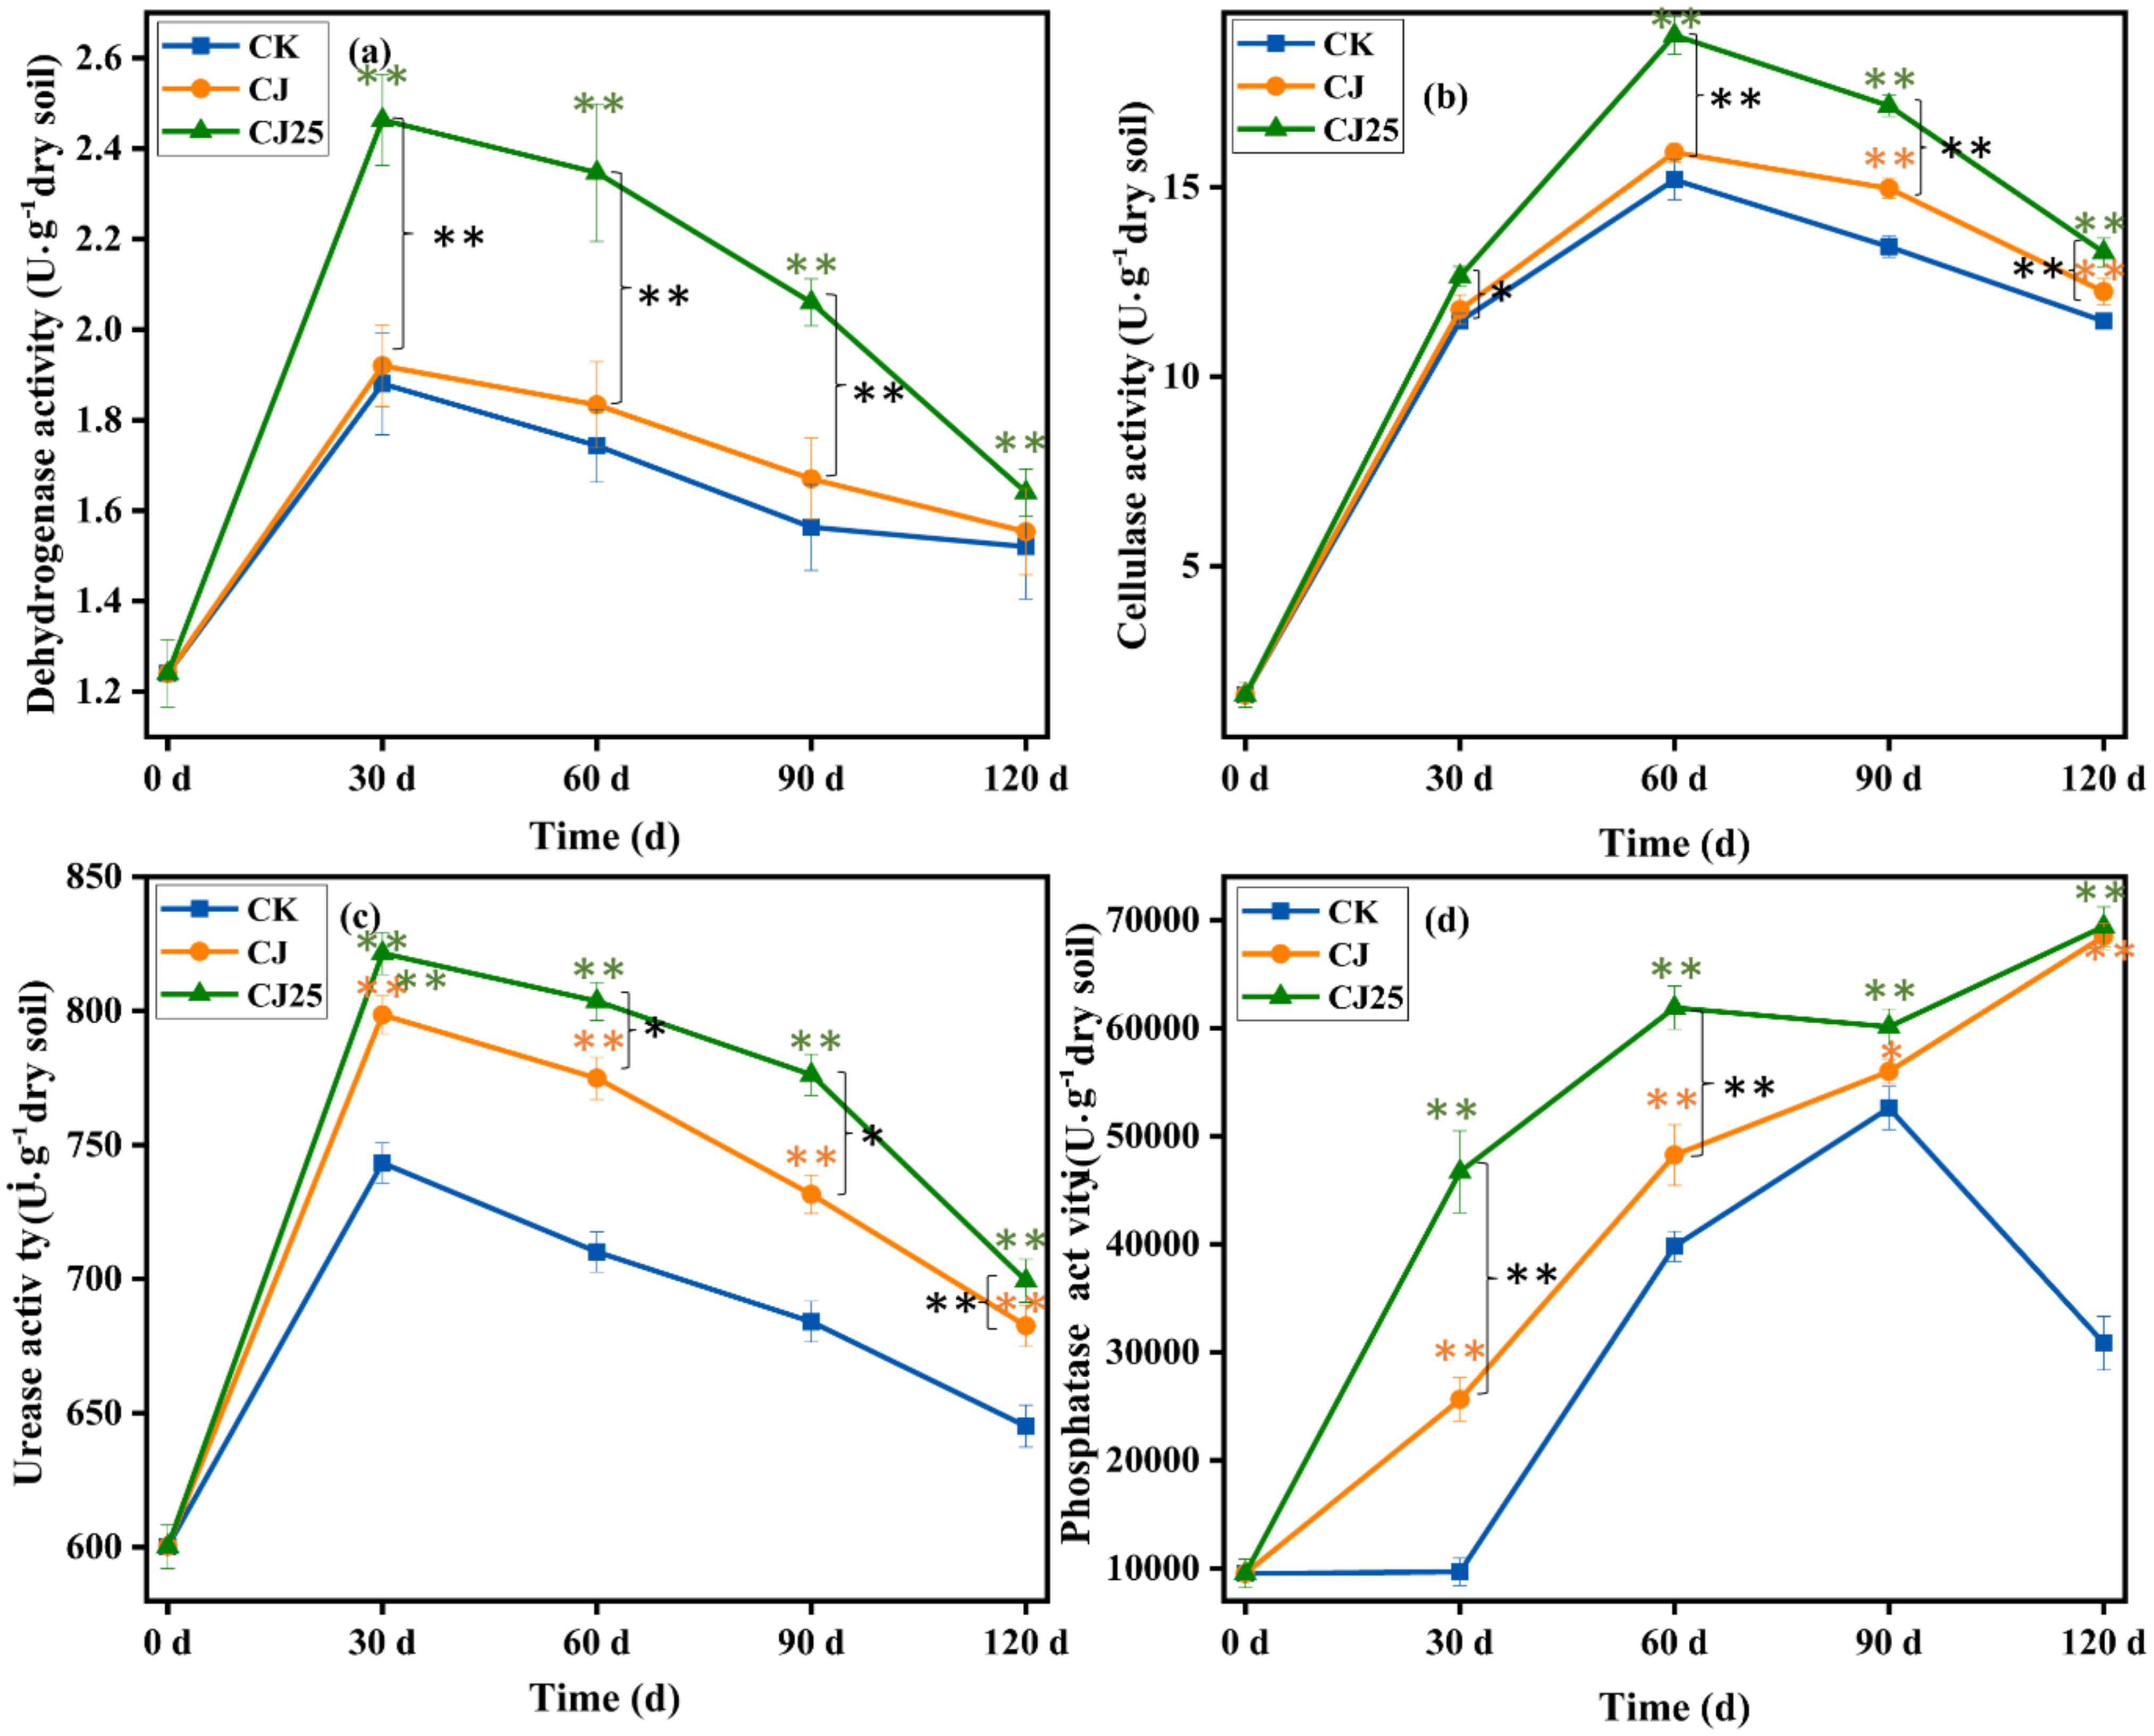
Figure 8. Enzyme activities as a function of time under different treatments during litter decomposition: (a) dehydrogenase; (b) cellulase; (c) urease; and (d) phosphatase. In the charts, the error bars represent the standard deviations from three biological replicates (pots). Data were statistically analyzed using two-way analysis of variance (two-way ANOVA). Significance is indicated with asterisks (**p < 0.01).
Figure 8b shows the changes in soil cellulase activity under different treatments. The cellulase activity first increased and then decreased. At 30 and 60 days, the cellulase activity of soil treated with CJ25 was considerably higher than those for the CJ- and CK-treated samples (p<0.05), but there was no major difference between CJ and CK (p > 0.05). At 90 and 120 days, the cellulase activity of the CJ25 treatment was greater than those for CJ and CK (p<0.05), with the activity for the CJ treatment greater than that for CK (p<0.05). The cellulase activity was maximal at 60 days—15.2, 15.9, and 19.0 mg/g for CK, CJ, and CJ25, respectively. The cellulase activity of CJ25-treated soil was greater than those of CJ and CK by 19.4% and 25.0% (p<0.05).
Figure 8c shows the changes in soil urease activity under different treatments. Consistent with the changes in soil dehydrogenase activity, urease activity first increased and then decreased. At 30, 60, and 90 days, the order of urease activity was CJ25>CJ>CK, with clear differences (p<0.05). At 30 days, the urease activity reached its maximum values—743.3, 798.5, and 821.5 U/g for CK, CJ, and CJ25, respectively—with the activity of the CJ25 treatment slightly greater than those for the CJ and CK treatments by 2.9% and 10.5%, respectively (p<0.05). At 120 days, there was no significant difference in urease activity between the CJ and CJ25 treatments, but both were greater than that for CK.
Figure 8d shows the changes in soil phosphatase activity (SPA) under different treatments. Different trends were observed compared to those of the previous three enzymes. The SPA of the CK treatment first increased over time and then decreased after 90 days, while the SPA of the CJ and CJ25 treatments gradually increased. At 30, 60, and 90 days, the trend of SPA from high to low was CJ25>CJ>CK, with considerable differences (p<0.05). At 120 days, the CJ25 and CJ treatments reached their highest SPAs, and the values for CJ25 and CJ were essentially equal and much higher than that for CK.
The enzyme activity results demonstrate that the addition of both bacterial agents and GO overall increased the activities of these four enzymes in this type of soil. The effects of GO in the CJ25 treatment were significant mainly in shorter periods compared to CJ and CK—such as 0–30 days for dehydrogenase and urease, 0–60 days for cellulase, and 0–120 days for phosphatase (Figure 8). These enzymes are well known to be involved in the catalytic conversion of carbon-containing organic compounds into oxidized forms, the degradation of cellulose into glucose, the hydrolysis of urea into CO2 and amines, and the removal of phosphate groups from organic molecules to yield phosphate ions. Overall, these enzymes are closely related to litter decomposition in soil media. The discovery of positive effects of GO on these four enzymes is very important for applications aimed at improving litter decomposition in saline–alkali soil.
To further elucidate the correlation between environmental factors and litter decomposition, the collected data showed that after 120 days of treatment with graphene-synergized bacterial agents, the litter decomposition rate was the fastest compared to the control (Figure 3). Consequently, principal component analysis (PCA) was performed using the data collected after 120 days of treatment, including litter mass residual rate, litter composition content, soil physicochemical properties, and enzyme activities. These results revealed that the contributions of principal component 1 (PC1) and principal component 2 (PC2) were 87% and 9.9%, respectively.
When the angle between two arrows is acute, it indicates a positive correlation; when the angle is obtuse, it indicates a negative correlation. Along the PC1 axis, the mass residual rate was negatively correlated with ammonium nitrogen, soil phosphatase, soil total nitrogen, humic acid, total phosphorus, soil dehydrogenase, cellulase, and urease. Meanwhile, along the PC2 axis, the mass residual rate was positively correlated with the contents of C, N, and P in the litter, as well as lignin and cellulose contents. Furthermore, based on the projections of variables on PC1, ammonium nitrogen, soil total nitrogen, humic acid, total phosphorus, soil phosphatase, cellulase, and urease were identified as key factors influencing plant litter decomposition (Figure 9).
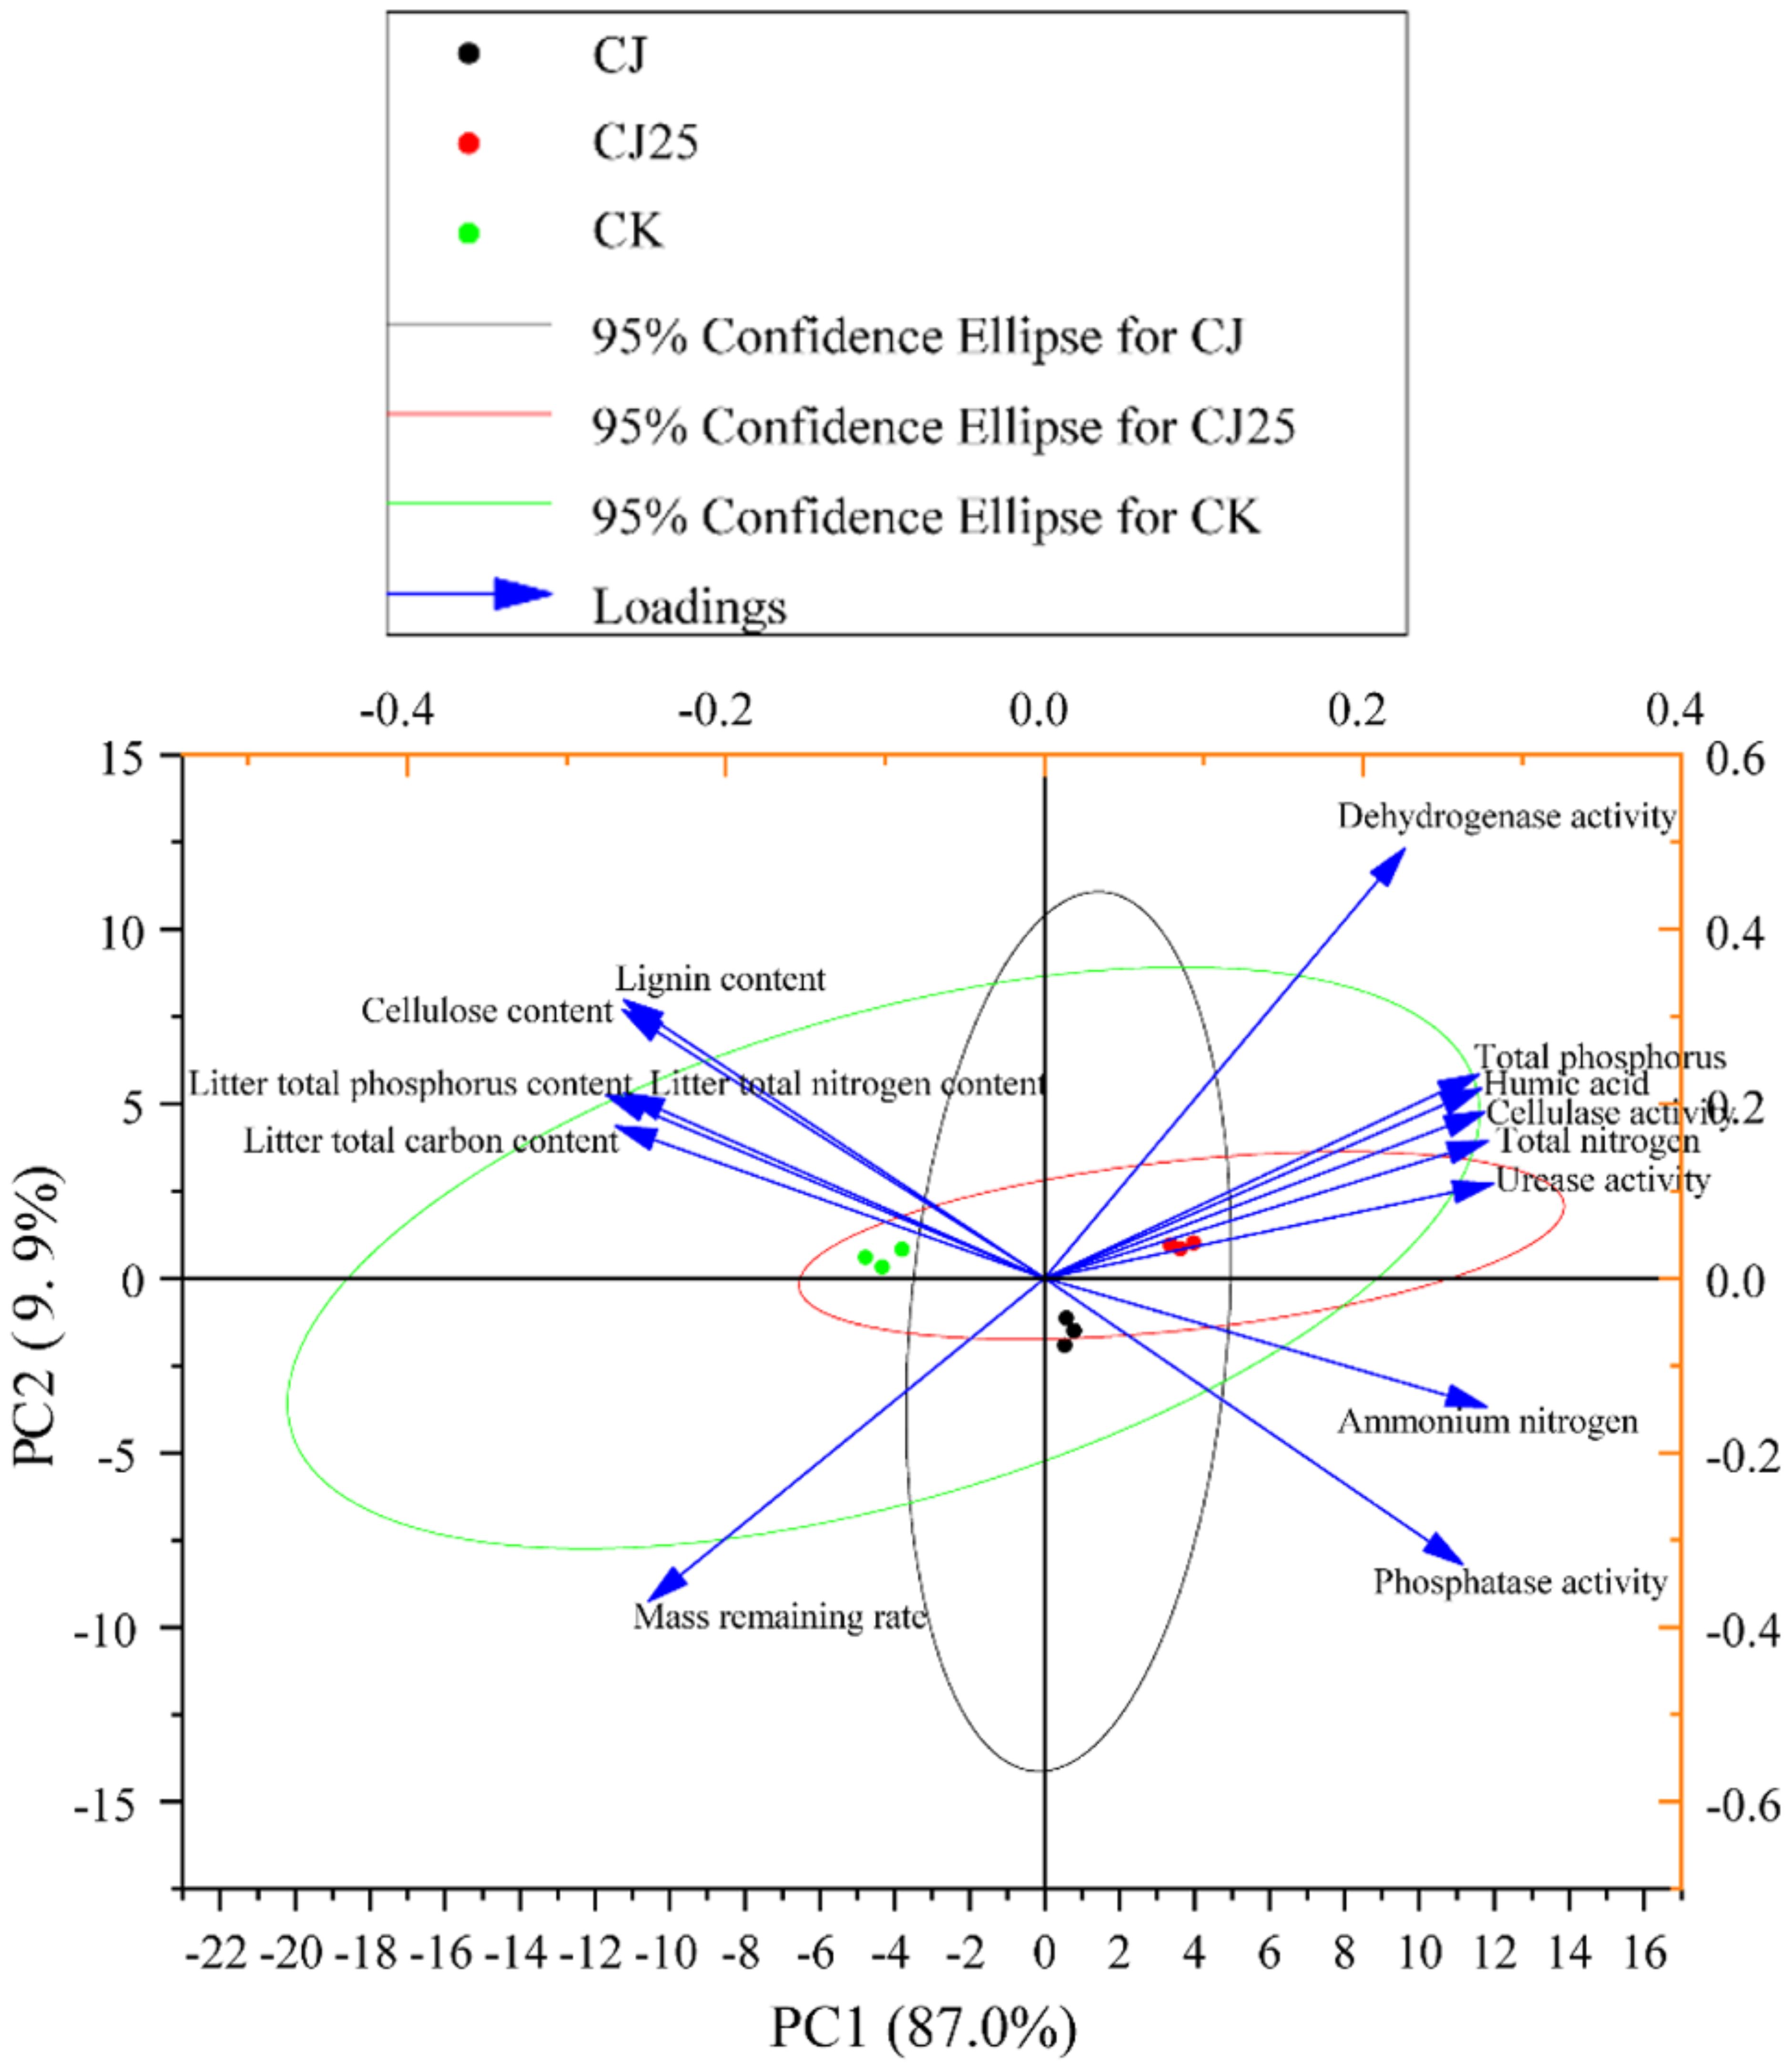
Figure 9. Principal component analysis (PCA) analysis results of the mass residue rate of litter, litter composition content, soil physicochemical properties, and enzyme activities after 120 days of treatment with GO synergistic bacterial agent. The image was drawn using the Origin 2022 software. Arrows representee different environmental factors. Small circles representee groups.
In summary, adding 25.0 mg/L GO and bacterial agents can increase the nutrient contents of humic acid, total nitrogen, total phosphorus, ammonium nitrogen, available phosphorus, and available potassium in the soil. Studies have shown that more than 90% of nitrogen and phosphorus, and more than 60% of mineral elements, come from litter returns (44). Research by Yahya (45) and others found that GO can increase microbial diversity, strengthen certain microorganisms, and improve their ability to degrade pollutants. The degradation rate with GO addition reached 74.1%, which is 10.7% greater than the control group without GO.
Zhao et al. (46) prepared a microorganism–GO composite material using existing environmental microbial resources and GO to strengthen Bacillus lysinidia. The results showed that the Bacillus lysinidia–GO composite material exhibited good resistance to uranium in aqueous solutions, with a removal capacity of 143.3 mg/g. Baldrian (47) and others believe that fungi are the main decomposers of complex litter. Among them, saprophytic basidiomycetes mainly decompose high-molecular compounds such as cellulose and lignin and convert them into nutrients for soil utilization, while bacteria are closely related to soil nitrogen cycling, which is consistent with the results of this study. Extracellular enzyme activity can be used to directly assess soil microbial activity and its relative contribution to nutrient cycling (48). Extracellular enzymes are active substances produced by microorganisms and are closely related to litter decomposition. In this study, soil enzyme activities varied across different periods, but all results showed that adding 25.0 mg/L GO and bacterial agents resulted in the highest soil enzyme activity, demonstrating that this treatment can enrich microorganisms in the soil, increase soil enzyme activity, and promote considerable litter decomposition.
The positive GO effects on poplar leaf litter decomposition are obvious in saline–alkali soil, but the mechanism of this action is still unclear to us. Recent research by Zhang et al. (34) revealed that the addition of nitrogen (N) and phosphorus (P) plays an important role in both litter and soil carbon decomposition. The enhanced carbon release under N addition might be attributed to increased microbial biomass, the ratio of fungi to bacteria, and carbon-degrading enzyme activities. We noted that at the beginning of litter decomposition, both nitrogen and phosphorus contents increased, which is consistent with the literature (34). This also occurs with the addition of GO, indicating that this treatment may help generate more microbial mass in the litter decomposition soil medium. Most related GO applications reported in the literature focus on the removal of pollutants, including heavy metals, from aquatic environments (45, 46, 49–51). In principle, heavy metal pollutants are very toxic to microorganisms, such as bacteria and fungi, in the natural ecological environment. The observed plant growth promotion associated with GO might be potentially linked to changes in soil heavy metal bioavailability and microbial community structure. This mechanism has been reported in aquatic environments (52), but this specific pathway was not directly measured in our soil-based system and could be a topic for future investigation.
Recent research found that few-layer graphene involuntarily released into terrestrial environments is likely oxidized by soil microflora into graphene oxide, indicating that natural soil media have the capability to produce GO (53). Meanwhile, graphene oxide can also be synthesized widely from biomass waste on a large industrial scale (54). These findings suggest that GO is becoming economical and may be used more extensively in the treatment of different soil media. Our discovery of the positive effects of GO in promoting the decomposition of poplar leaf litter is very important for upgrading soil nutrients—especially in saline–alkali soils in northern China—and will be beneficial for global agricultural food production.
4 Conclusion
In saline–alkali soil, the mass loss of litter was the greatest when 25.0 mg/L GO and bacterial agents were added. The carbon content gradually decreased, while the nitrogen and phosphorus contents were enriched in the early stages but were released later. At the same time, the cellulose and lignin contents in the litter showed different trends under the various treatments and were lowest when 25.0 mg/L GO and bacterial agents were added.
The combination of GO and bacterial agents can promote the decomposition of litter and increase soil nutrients. In saline–alkali soil, the changes in the contents of humus, total nitrogen, total phosphorus, ammonium nitrogen, available phosphorus, and available potassium can be summarized as follows: the contents of humus and available potassium gradually increased over time, while the contents of total nitrogen, total phosphorus, ammonium nitrogen, available phosphorus, and most phosphorus forms first decreased and then increased. After 120 days, all of these reached their maximum values when both 25.0 mg/L GO and microbial agents were added.
The combined presence of GO and microbial agents promoted soil enzyme activity, which further facilitated litter decomposition. The activities of soil dehydrogenase, cellulase, and urease all initially increased and then decreased. Phosphatase activity showed a gradual increase throughout the decomposition process and reached its highest level when 25.0 mg/L GO and bacterial agents were added. Overall, GO plus microbial agents accelerated poplar leaf litter decomposition in saline–alkali soil. This discovery is important for understanding the novel application of GO in soil improvement and nutrient enhancement.
Data availability statement
The raw data supporting the conclusions of this article will be made available by the authors, without undue reservation.
Author contributions
JQ: Data curation, Formal Analysis, Investigation, Methodology, Writing – original draft, Writing – review & editing. JL: Investigation, Software, Validation, Writing – original draft, Writing – review & editing. XC: Conceptualization, Supervision, Validation, Writing – original draft, Writing – review & editing. XH: Formal Analysis, Investigation, Methodology, Writing – original draft, Writing – review & editing. JZ: Conceptualization, Project administration, Supervision, Writing – original draft, Writing – review & editing. GM: Conceptualization, Writing – original draft, Writing – review & editing.
Funding
The author(s) declared financial support was received for this work and/or its publication. National Natural Science Foundation of China (52071192, 51804191), National Key Research and Development Program of China (2025YFD1700301), Shanxi 1331 Project Foundation for Graphene Industrialization Application Technology of Collaborative Innovation Center, Shanxi New Carbon Functional Materials Engineering Research Center, Open Bidding for Selecting the Best Candidates Project supported by National Forestry and Grassland Administration: Research and Development of the Key Technologies for Three-North Shelterbelt Forest Program Battle (202401-03), the Scientific and Technological Innovation Programs of Higher Education Institutions in Shanxi (2022L426), and the Major Agricultural Science and Technology Projects of Shanxi Province.
Acknowledgments
This work was mainly performed at the Engineering Research Center of Coal-Based Ecological Carbon Sequestration Technology of the Ministry of Education, Shanxi Datong University, Datong, Shanxi Province. We gratefully acknowledge the provider of the bacterial agents (Bacillus subtilis, Pseudomonas fluorescens, and yeast) from the Institute of Plant Nutrition and Environmental Resources, Liaoning Academy of Agricultural Sciences. We extend our sincere gratitude for the technical assistance provided by Library construction and sequencing by Beijing Biomarker Biotechnology Co., Ltd. The authors also thank Dr. Guy Bernard for his helpful comments.
Conflict of interest
The authors declared that this work was conducted in the absence of any commercial or financial relationships that could be construed as a potential conflict of interest.
Generative AI statement
The author(s) declare that Generative AI was not used in the creation of this manuscript.
Any alternative text (alt text) provided alongside figures in this article has been generated by Frontiers with the support of artificial intelligence and reasonable efforts have been made to ensure accuracy, including review by the authors wherever possible. If you identify any issues, please contact us.
Publisher’s note
All claims expressed in this article are solely those of the authors and do not necessarily represent those of their affiliated organizations, or those of the publisher, the editors and the reviewers. Any product that may be evaluated in this article, or claim that may be made by its manufacturer, is not guaranteed or endorsed by the publisher.
Supplementary material
The Supplementary Material for this article can be found online at: https://www.frontiersin.org/articles/10.3389/fsoil.2025.1694914/full#supplementary-material
References
1. Qu C, Ren W, Li X, Cai P, Chen W, and Huang Q. Revisit soil organic matter. Sci Bull. (2022) 67:913–22. doi: 10.1360/TB-2021-0704
2. Gortner RA. The organic matter of the soil. Soil Sci. (1916) 2:539–48. doi: 10.1097/00010694-191612000-00002
3. Page HJ. Studies on the carbon and nitrogen cycles in the soil. V. The origin of the humic matter of the soil. J Agric Sci. (1932) 22:291–6. doi: 10.1017/S0021859600053624
4. Hattenschwiler S, Tiunov AV, and Scheu S. Biodiversity and litter decomposition in terrestrial ecosystems. Annu Rev Ecol Evol Syst. (2005) 36:191–218. doi: 10.1146/annurev.ecolsys.36.112904.151932
5. Schnürer J, Clarholm M, and Rosswall T. Microbial biomass and activity in an agricultural soil with different organic matter contents. Soil Biol Biochem. (1985) 17:611–8. doi: 10.1016/0038-0717(85)90036-7
6. Waksman SA and Gerretsen FC. Influence of temperature and moisture upon the nature and extent of decomposition of plant residues by microorganisms. Ecology. (1931) 12:33–60. doi: 10.2307/1932933
7. Condron L, Stark C, O’Callaghan M, Clinton P, and Huang Z. The role of microbial communities in the formation and decomposition of soil organic matter, chapter 4. In: Dixon GR and Tilston EL, editors. Soil Microbiology and Sustainable Crop Production. Singapore: Springer Science+Business Media BV (2010). p. 81–118. doi: 10.1007/978-90-481-9479-7
8. Allison SD, Lu Y, Weihe C, Goulden ML, Martiny AC, Treseder KK, et al. Microbial abundance and composition influence litter decomposition response to environmental change. Ecology. (2013) 94:714–25. doi: 10.1890/12-1243.1
9. Purcell AM, Hayer M, Koch BJ, Mau RL, Blazewicz SJ, Dijkstra P, et al. Decreased growth of wild soil microbes after 15 years of transplant-induced warming in a montane meadow. Glob Change Biol. (2022) 28:128–39. doi: 10.1111/gcb.15911
10. DeLuca TH, Pingree MRA, and Gao S. Chapter 16 - Assessing soil biological health in forest soil. In: Developments in Soil Science, vol. 36. Netherlands: Elsevier (2019). p. 397–426. doi: 10.1016/B978-0-444-63998-1.00016-1
11. Lu Y, Xu J, Zhang X, Wang B, Xie B, and Liu Z. Effects of leachate from understory medicinal plants on litter decomposition and soil enzyme activities of Betula Albosinensis and Eucommia Ulmoides. Chin J Plant Ecol. (2017) 41:639–49. doi: 10.17521/cjpe.2016.0350
12. Lu Y, Xu J, Zhang X, Wang B, Xie B, Shi F, et al. Effects of leachates from understory medicinal plants on decomposition of Populus purdomii litters and soil enzyme activity. Acta Pedologica Sin. (2017) 54:749–58. doi: 10.11766/trxb201610270522
13. Luo X, Liu G, Xia Y, Chen L, Jiang Z, Zhang H, et al. Use of biochar-compost to improve properties and productivity of the degraded coastal soil in the Yellow River Delta, China. J Soils Sedimen. (2017) 17:780–9. doi: 10.1007/s11368-016-1361-1
14. Conant J and Fadem P. A community guide to environmental health. 1st ed. Oakland, California, USA: Hesperian (2008), ISBN: ISBN: 978-0-942364-56-9.
15. Mbayachi VBE, Ndayiragijeb E, Sammani T, Taj S, Mbuta ER, and Khan AU. Graphene synthesis, characterization and its applications: A review. Results Chem. (2021) 3:100163. doi: 10.1016/j.rechem.2021.100163
16. Jiricková A, Jankovský O, Sofer Z, and Sedmidubský D. Synthesis and applications of graphene oxide. Materials (Basel). (2022) 5:920. doi: 10.3390/ma15030920
17. Smith AT, LaChance AM, Zeng S, Liu B, and Sun L. Synthesis, properties, and applications of graphene oxide/reduced graphene oxide and their nanocomposites. Nano Mater Sci. (2019) 1:31–47. doi: 10.1016/j.nanoms.2019.02.004
18. Guo X, Zhao J, Wang R, Zhang H, Xing B, Naeem M, et al. Effects of graphene oxide on tomato growth in different stages. Plant Physiol Biochem. (2021) 162:447–55. doi: 10.1016/j.plaphy.2021.03.013
19. Zhang X, Cao H, Zhao J, Wang H, Xing B, Chen Z, et al. Graphene oxide exhibited positive effects on the growth of aloe vera. Physiol Mol Bioi. Plants. (2021) 27:815–24. doi: 10.1007/s12298-021-00979-3
20. Chen Z, Zhao J, Song J, Han S, Du Y, Qiao Y, et al. Influence of graphene on the multiple metabolic pathways of zea mays roots based on transcriptome analysis. PloS One. (2021) 16:e0244856. doi: 10.1371/journal.pone.0244856
21. Chen Z, Zhao J, Qiao J, Li W, Guan Z, Liu Z, et al. Graphene-mediated antioxidant enzyme activity and respiration in plant roots. ACS Agric Sci Technol. (2022) 2:646–60. doi: 10.1021/acsagscitech.2c00074
22. Song J, He X, Qiao J, Zhao J, Chen Z, Ren J, et al. Effects of graphene oxide composite additive on the species abundance and diversity of microorganisms in saline-alkali soil. Can J Soil Sci. (2025) 105:1–8. doi: 10.1139/cjss-2024-0072
23. Chen Z, Ren J, Qiao J, Zhao J, Li J, Liu Z, et al. Influence of functionalized graphene on the bacterial and fungal diversity of vicia faba rhizosphere soil. New Carbon Materials. (2024) 39:1227–42. doi: 10.1016/S1872-5805(24)60890-5
24. De Jesus LR, Dennis RV, Depner SW, Jaye C, Fischer DA, and Banerjee S. Inside and outside: X-ray absorption spectroscopy mapping of chemical domains in graphene oxide. J Phys Chem Lett. (2013) 4:3144–51. doi: 10.1021/jz401717j
25. Ge S, Han Y, Sun M, Zhao J, and Zhang X. Research progress of graphene oxide in agriculture and forestry farming. Plant Sci J. (2024) 42:395–403. doi: 10.11913/PSJ.2095-0837.23127
26. Lei S, Jia X, Zhao C, and Shao M. A review of saline-alkali soil improvements in China: Efforts and their impacts on soil properties. Agric Water Manage. (2025) 317:109617. doi: 10.1016/j.agwat.2025.109617
27. Zhang B and Wang N. Study on the harm of saline alkali land and its improvement technology in China. 2021 IOP Conf Ser.: Earth Environ Sci. (2021) 692:42053. doi: 10.1088/1755-1315/692/4/042053
28. Pei S, Wei Q, Huang K, Cheng H, and Ren W. Green synthesis of graphene oxide by seconds timescale water electrolytic oxidation. Nat Commun. (2018) 9:145. doi: 10.1038/s41467-017-02479-z
29. Wang Z, Yang X, Mao J, Wang Z, Xie Y, and Zhou L. Influence of exogenous microbial agents on microbial community and maturity effect during cotton straw composting. J Ecol Rural Environ. (2024) 40(10):1376–84. doi: 10.19741/j.issn.1673-4831.2023.1119
30. Bao S. Soil Agrochemical Analysis. 3rd Edition. Beijing: China Agricultural Press (2005) p. 25–108.
31. Du J, Zhang Y, Qv M, Li K, Yin X, Sorrell BK, et al. The effects of ZnO nanoparticles on leaf litter decomposition under natural sunlight. Environ science. Nano. (2019) 6:1180–8. doi: 10.1039/C8EN01353E
32. Cai R. (2019)., in: Decomposition process of three plant litters and dynamic changes of bacterial community structure in Poyang Lake wetland (Ph. D Thesis), Nanchang. China: Nanchang University.
33. Olson JS. Energy storage and the balance of producers and decomposers in ecological systems. Ecology. (1963) 44:322–31. doi: 10.2307/1932179
34. Zhang J, Zhou J, Lambers H, Li Y, Li Y, Qin G, et al. Nitrogen and phosphorus addition exerted different influences on litter and soil carbon release in a tropical forest. Sci total Environ. (2022) 832:155049. doi: 10.1016/j.scitotenv.2022.155049
35. Jin B and Guo Q. Root decomposition and nutrient dynamics of Quercus Mongolica and Betula Platyphylla. Acta Ecologica Sin. (2013) 33:2416–23. doi: 10.5846/stxb201208211180
36. Sun J, Sun J, Sun L, Xue C, and Tai P. Effect of GO on enhancing the degradation of PAHs by Pseudomonas aeruginosa in contaminated soil and its mechanism. Environ pollut Control. (2023) 45:433–42. doi: 10.15985/j.cnki.1001-3865.2023.04.001
37. Mu L, Zhou Q, Zhao Y, Liu X, and Hu X. Graphene oxide quantum dots stimulate indigenous bacteria to remove oil contamination. J Hazard. Mater. (2019) 366:694–702. doi: 10.1016/j.jhazmat.2018.12.044
38. Zhang P, Zhang X, Pei G, Sun J, Huang Y, Huang Q, et al. Responses of soil nitrogen cycling to changes in aboveground plant litter inputs: A meta-analysis. Geoderma. (2023) 439:116678. doi: 10.1016/j.geoderma.2023.116678
39. Li Q, Wu X, and Zhang X. Research progress in microbial degradation of straw lignin. Acta Microbiologica Sin. (2023) 63:4118–32. doi: 10.13343/j.cnki.wsxb.20230201
40. Seena RA and Suja G. Nutrient release pattern of organic and inorganic resources used in cassava production (manihot esculenta crantz). J Plant Nutr. (2019) 42:1301–15. doi: 10.1080/01904167.2019.1617305
41. Dedysh SN, Ricke P, and Liesack W. NifH and NifD phylogenies: an evolutionary basis for understanding nitrogen fixation capabilities of methanotrophic bacteria. Microbiology. (2004) 150:1301–13. doi: 10.1099/mic.0.26585-0
42. Wang Z and Zheng F. Impact of vegetation succession on leaf-litter-soil C:N:P stoichiometry and their intrinsic relationship in the Ziwuling Area of China’s Loess Plateau. J For Res. (2021) 32:697–711. doi: 10.1007/s11676-020-01149-z
43. Keiluweit M, Nico P, Harmon ME, Kleber M, and Affiliations AI. Long-term litter decomposition controlled by manganese redox cycling. PNAS. (2015) 112:E5253–60. doi: 10.1073/pnas.1508945112
44. Bowden RD, Wurzbacher SJ, Washko SE, Wind L, Rice AM, Coble AE, et al. Long-term nitrogen addition decreases organic matter decomposition and increases forest soil carbon. Soil Sci Soc Amer. J. (2019) 83:S82–95. doi: 10.2136/sssaj2018.08.0293
45. Yahya MS and Lau EV. Graphene oxide (GO)-coated microbubble flotation for polycyclic aromatic hydrocarbon (PAH) removal from aqueous solutions. J Environ Chem Engineer. (2021) 9:106508. doi: 10.1016/j.jece.2021.106508
46. Zhao C, Liu J, Deng Y, Tian Y, Zhang G, Liao J, et al. Uranium (VI) adsorption from aqueous solutions by microorganism-graphene oxide composites via an immobilization approach. J Clean. Produc. (2019) 236:117624. doi: 10.1016/j.jclepro.2019.117624
47. Baldrian P. Microbial activity and the dynamics of ecosystem processes in forest soils. Curr Opin Microbiol. (2017) 37:128–34. doi: 10.1016/j.mib.2017.06.008
48. Ruan C, Liu X, Lu M, Li X, Fu Z, Ren Y, et al. Effects of litter carbon, nitrogen and enzyme activity in soil under Chinese fir. Acta Pedologica Sin. (2020) 57:954–62. doi: 10.11766/trxb201808060408
49. Priyadharshini D, Manikandan S, Kiruthiga S, Rednam R, Suresh Babu U, Subbaiya P, et al. Graphene oxide-based nanomaterials for the treatment of pollutants in the aquatic environment: Recent trends and perspectives-A review. Envir. Poll. (2022) 306:119377. doi: 10.1016/j.envpol.2022.119377
50. Liu X, Ma R, Wang X, Ma Y, Yang Y, Zhuang L, et al. Graphene oxide-based materials for efficient removal of heavy metal ions from aqueous solution: A review. Envir. Poll. (2019) 252 Part A:62–73. doi: 10.1016/j.envpol.2019.05.050
51. Sun Q, Wang L, Li Y, Li L, Li S, and Zhu G. Highly efficient removal of mercury ions from aqueous solutions by thiol-functionalized graphene oxide. Water. (2023) 15:2529. doi: 10.3390/w15142529
52. Ma Y, Rajkumar M, Zhang C, and Freitas H. Beneficial role of bacterial endophytes in heavy metal phytoremediation. J Environ Manage. (2016) 174:14–25. doi: 10.1016/j.jenvman.2016.02.047
53. Carniel FC, Fortuna L, Zanelli D, Garrido M, Vázquez E, González VJ, et al. Graphene environmental biodegradation: Wood degrading and saprotrophic fungi oxidize few-layer graphene. J Haz. Mater. (2021) 414:125553. doi: 10.1016/j.jhazmat.2021.125553
Keywords: graphene oxide, litter, decomposition, poplar leaves, saline-alkali soil, external bacterial agents, microbial agents, enzyme
Citation: Qiao J, Liu J, Chen X, He X, Zhao J and Ma G (2025) Effects of graphene oxide plus external bacterial agents on accelerating poplar leaf-litter decomposition in saline–alkali soil. Front. Soil Sci. 5:1694914. doi: 10.3389/fsoil.2025.1694914
Received: 29 August 2025; Accepted: 28 November 2025; Revised: 17 November 2025;
Published: 17 December 2025.
Edited by:
Junpeng Zhang, Shandong Agricultural University, ChinaReviewed by:
Hermes Pérez Hernández, The National Institute of Forestry, Agriculture and Livestock Research (INIFAP), MexicoJazbia Shirin, Peking University, China
Copyright © 2025 Qiao, Liu, Chen, He, Zhao and Ma. This is an open-access article distributed under the terms of the Creative Commons Attribution License (CC BY). The use, distribution or reproduction in other forums is permitted, provided the original author(s) and the copyright owner(s) are credited and that the original publication in this journal is cited, in accordance with accepted academic practice. No use, distribution or reproduction is permitted which does not comply with these terms.
*Correspondence: Xiaokang Chen, Y2hlbnhpYW9rYW5nMDAxQDE2My5jb20=; Jianguo Zhao, amd6aGFvc2hpQDE2My5jb20=; Guibin Ma, Z3VpYmlubTg4QGdtYWlsLmNvbQ==
†ORCID: Jun Qiao, orcid.org/0000-0001-8542-7246
Xiaokang Chen, orcid.org/0000-0003-1921-0991
Jianguo Zhao, orcid.org/0000-0002-9432-5695
Guibin Ma, orcid.org/0000-0002-9920-7153