 Sharon Mejía Maita1
 Kenyi Quispe1
 Henry Díaz-Chuquizuta2
 Raihil Rengifo Sanchéz1
 Ruth Mercado Chinchay1
 Juan Pablo Cuevas Gimenez3
 Richard Solórzano1*
- 1Dirección de Servicios Estratégicos Agrarios, Instituto Nacional de Innovación Agraria (INIA), Lima, Peru
- 2Dirección de Servicios Estratégicos Agrarios, Estación Experimental Agraria El Porvenir, Instituto Nacional de Innovación Agraria (INIA), Yurimaguas, Alto Amazonas Loreto, Peru
- 3Dirección de Servicios Estratégicos Agrarios, Estación Experimental Agraria de Baños del Inca, Instituto Nacional de Innovación Agraria (INIA), Baños del Inca, Cajamarca, Peru
Fertilization practices in coffee plantations often overlook the spatial variability of soils, particularly in mountainous regions with acidic conditions. Although geostatistics has been used to map nutrient distributions, its integration with multivariate analysis to identify differentiated fertilization zones in coffee systems remains limited. This study evaluated the influence of soil properties, altitude, and crop age on coffee yield by combining principal component analysis (PCA) and ordinary kriging to design site-specific fertilization strategies. A total of 70 soil samples were collected from three districts of the Peruvian high jungle (San Martín and Amazonas), measuring physical and chemical properties, altitude, and crop age. The following analyses were applied: (1) Spearman correlations to assess associations with yield, (2) PCA to identify fertility gradients, and (3) geostatistical models with cross-validation. The PCA identified two main gradients: PC1 (32.41% of variance) associated with cation exchange capacity (CEC) and organic matter, and PC2 (17.88%) associated with the availability of K and P and crop age. Cross-validation confirmed high accuracy in the spatial prediction of available P and K across the three study areas. Kriging maps revealed zones with high available K (>150 mg kg−1) and P (>20 mg kg−1) associated with yields >1.5 t ha−1. The integration of PCA and geostatistics enabled the delineation of management zones with differentiated nutrient requirements, reducing fertilization needs by up to 30% in areas with high fertility potential (e.g., Alto Saposoa). Overall, the results provide a solid methodological basis for implementing precision fertilization strategies in tropical coffee systems, promoting more efficient nutrient use and greater production sustainability.
1 Introduction
Coffee production (Coffea spp.) is an agricultural activity of great economic and social importance, with a global production of approximately 11 million tons per year, mainly concentrated in the Americas (1). In Peru, coffee represents the fourth most important agro-export product (2), positioning the country among the ten largest producers worldwide. With an annual production of around 400,000 tons and an average yield of 0.9 t ha−1, coffee accounts for 7.8% of the gross agricultural production value (2) and constitutes the main source of income for approximately 223,000 families (3).
Spatial and temporal variation in soil properties and meteorological conditions significantly affects coffee growth, quality, and yield (4). Therefore, tools that enable more efficient crop management are required. In this context, digital soil mapping has become a key tool in precision agriculture, as it allows for the identification and quantification of soil spatial variability through the collection of georeferenced data, laboratory analyses, and geostatistical modeling, thereby facilitating the delineation of homogeneous management zones (5, 6). This approach makes it possible to adjust agricultural practices such as fertilization to the specific conditions of each area, optimizing input use and promoting the sustainability of the production system.
However, a critical knowledge gap remains. Although geostatistics has been widely used to map nutrient distributions, its integration with multivariate methods to identify differentiated management zones in tropical coffee systems remains limited. Most studies focus on the spatial description of nutrients without explicitly linking edaphic gradients to crop productivity or considering factors such as plantation age or altitude, which modulate nutrient dynamics.
To address this gap, the present study tests the hypothesis that spatial heterogeneity in coffee yield across Peruvian plantations is explained by the interaction between fertility gradients (CEC, organic matter, P, and K), altitude, and crop age. Accordingly, this research aims to (i) characterize the physical and chemical properties of the soil, as well as complementary variables (altitude and crop age), in high-yield coffee plantations of eastern Peru; (ii) identify the most influential soil properties on yield through multivariate analyses; (iii) and model the spatial structure of the main edaphic variables and yield using geostatistical techniques, in order to generate management maps that serve as a basis for precision fertilization strategies.
This approach seeks to overcome traditional static analyses and generate adaptive agronomic recommendations based on soil spatial variability, thus contributing to more efficient and sustainable coffee management in the tropical Andes of Peru.
2 Materials and methods
2.1 Study area
The study area is located in the Peruvian high jungle, comprising the districts of Vista Alegre (Amazonas region) and Alto Saposoa and Soritor (San Martín region), areas noted for their coffee production (Figure 1). These locations were selected for their agricultural relevance and contrasting environmental conditions, which allow for analysis of the influence of climatic, edaphic, and geological factors on crop productivity. A total of 70 soil samples were collected at a depth of 30 cm, distributed across 12 samples in Vista Alegre, 39 in Soritor, and 19 in Alto Saposoa, covering representative coffee-growing areas.

Figure 1. Location of soil sampling areas in coffee plantations at the districts of Vista Alegre, Soritor, and Alto Saposoa.
The district of Vista Alegre is located at a higher altitude, with a temperate humid climate, temperatures between 14 and 28 °C, rainfall of 1500–2200 mm, and an average relative humidity of 85%. Its geology is Cretaceous (100%), with a predominance of Cambisols (92%) and Acrisols (8%), and its life zone corresponds mainly to very humid tropical premontane forest (75%).
In Alto Saposoa, the climate is humid tropical, with temperatures between 21 and 32 °C, annual rainfall of 1700–1800 mm, and an average relative humidity of 63%. Cambisols predominate (70%), followed by Acrisols (20%) and Ferrosols (10%), on Paleogene geology and in a zone of life corresponding mainly to very humid tropical premontane forest (95%). In Soritor, conditions are similar, with temperatures between 16 and 30 °C, rainfall of 1800–2000 mm, and 80% relative humidity; the geology is mainly Paleogene (90%), with Cambisols (87%), and the biome is distributed between very humid premontane forest (39%) and low tropical montane forest (61%).
Historical averages were calculated based on information from the WorldClim v2.1—Climate Global Data climate database (7).
2.2 Sampling design
The sampling design followed the approach proposed by (8), adapted to field conditions in high-yield coffee plantations. For each selected producer, a high-yield coffee field (> 1 t ha−1) was identified, and within it, a homogeneous zone (< 10 ha) was delineated to ensure uniformity in slope, soil texture and color, coffee variety, and planting age. This delineation served as a quality criterion to minimize within-field variability and to guarantee that each soil sample represented comparable soil and crop conditions.
Within each homogeneous zone, five representative coffee trees were randomly selected, and subsamples were collected at a depth of 30 cm within the canopy projection of each tree. The subsamples were composited to obtain one representative soil sample per field. In total, 70 composite soil samples were collected across all plantations (Figure 1). The operational steps of the sampling process are illustrated in Figure 2.

Figure 2. Operational flowchart of the soil sampling design applied in high-yield coffee plantations.
2.3 Soil analysis
Soil samples were analyzed at the Soil, Water, and Foliar Laboratories Network of the National Institute for Agrarian Innovation (LABSAF-INIA). Before physicochemical analysis, samples were air-dried (<40 °C) and sieved (<2 mm) following (9).
The analyses included particle-size distribution using the hydrometer method (10); pH in a 1:1 soil-to-water suspension (11); electrical conductivity (12); organic matter by (13), total nitrogen by (14); available phosphorus by (15); and available potassium following (16). Exchangeable bases and acidity were determined according to (17).
Bulk density (BD) and cation exchange capacity at pH 7 (CEC) were obtained from the SoilGrids database (18), at 250 m resolution for the 15–30 cm soil depth.
2.4 Statistical analysis
Statistical analyses were performed in R (v4.4.1). Descriptive statistics (mean, median, standard deviation, coefficient of variation, skewness, and kurtosis) were calculated for all soil and yield variables. Differences in median coffee yield among study zones were assessed using the Kruskal–Wallis test (p< 0.05), followed by Dunn’s post-hoc test with Bonferroni adjustment for multiple comparisons.
Non-parametric Spearman correlations were used to assess relationships among soil variables, with results visualized through significant correlation matrices (p< 0.01). To identify multivariate patterns and reduce data dimensionality, a Principal Component Analysis (PCA) was conducted using FactoMineR and factoextra. Only standardized numerical variables were included, and results were visualized with biplots and confidence ellipses showing variable contributions and groupings related to soil fertility.
2.5 Geostatistical interpolation
Understanding spatial variability through the appropriate geostatistical semivariogram model is crucial for map-ping and delineating soil fertility variability, thereby enabling the optimization of fertilization programs (19). A geostatistical analysis was conducted using data from 70 georeferenced sampling points, incorporating both soil properties and crop characteristics. The variables analyzed included sand, silt, and clay percentages; pH; electrical conductivity (EC); organic matter (OM); available phosphorus (P) and potassium (K); effective cation exchange capacity (ECEC); concentrations of exchangeable cations (H+, Al3+, Ca²+, Mg²+, K+, and Na+); altitude; plantation age; and coffee crop yield. Spatial interpolations were performed using the Ordinary Kriging (OK) method. The entire process was carried out using the spatial and geostatistical tools available in the SAGA software pack-age, including variogram generation and implementation of the Kriging model, to ensure accurate and efficient estimation (20). The resulting interpolated maps were subsequently exported using QGIS software to facilitate effective visualization and analysis of the spatial data (21).
2.6 Geostatistical analyses
The nugget (C0), sill (C0 + C), and the nugget-to-sill ratio (PSV) (Equation 1) are key parameters in semivariogram analysis that describe the spatial autocorrelation of the data. These parameters are derived from fitting the semivariogram model used for geostatistical interpolation (22).
Values of PSV< 0.25 indicate weak spatial dependence, 0.25 a 0.75 moderate dependence, and > 0.75 strong dependence.
The selection of the semivariogram model is based on criteria such as root mean square error (RMSE), and the coefficient of determination (R²) (23). Ideally, the chosen model should yield RMSE values close to zero (Equation 2) and R² values close to one (Equation 3), indicating high model accuracy and quality, respectively (24). Kriging interpolations for each soil property were validated through cross-validation using the leave-one-out method (25).
Where n represents the number of samples, and ) and denote the predicted and observed values at site xi, respectively.
3 Results
3.1 Descriptive statistics of soil physicochemical properties, plantation age, altitude, and coffee crop yield
Coffee yield did not follow a normal distribution (Table 1) and is therefore better represented by the median (1.50 t·ha−1) and the interquartile range (0.11 t·ha−1). The median comparison analysis (Kruskal–Wallis, p = 0.85) showed no significant differences among the study areas, indicating statistically similar productivity across them. The negatively skewed and leptokurtic yield distribution (Figure 1), together with a low coefficient of variation (CV = 7.12%), evidences a stable productive behavior with a slight tendency toward relatively high yields in the coffee plantations of the three study zones.

Table 1. Descriptive statistics of soil physicochemical properties in the study area.
On the other hand, the results reveal pronounced heterogeneity in soil properties associated with potential fertility among the study zones, as indicated by high coefficients of variation (CV > 50%) for available phosphorus (88.55%), organic matter (53.63%), available potassium (50.20%), and effective cation exchange capacity (56.95%). Similarly, variables related to the balance and saturation of basic cations also exhibit high overall variability, with highly dispersed deviations around the mean value.
Soil pH ranged between 3.80 and 6.80, with a mean of 5.03 and a median of 4.85, indicating slight positive skewness (Skewness = 0.56) and negative kurtosis (Kurtosis = –0.99). This suggests a platykurtic distribution, which is flatter than a normal distribution, characterized by a lower frequency of extreme values. Nonetheless, this behavior indicates that most coffee plantations are cultivated on moderately to strongly acidic soils. This pH characteristic is relevant for segmentation into different management zones, due to its relatively homogeneous distribution. Exchangeable Al3+ and H+ display similar trends to pH; however, both exhibit greater positive skewness, indicating a longer tail of high values up to a maximum of 3.58 and 6.33 cmol·kg−1, respectively. This suggests the presence of localized areas with more severe degradation related to soil acidity.
Available phosphorus (P) ranged from 2.30 to 104.20 mg·kg−1. The positive skewness (Skewness = 1.71) indicates a long tail toward higher values, while the kurtosis value of 3.16 reflects a leptokurtic distribution, more peaked than a normal distribution and characterized by a higher frequency of extreme high values, typical of highly productive plantations. The coefficient of variation (CV = 88.55%) confirms pronounced heterogeneity among the 70 high-yield coffee plantations evaluated across the three study areas. This pattern suggests that some plantations still exhibit low P levels potentially limiting coffee growth, whereas others show locally high concentrations (P75 = 32.73 mg·kg−1), likely associated with site-specific fertilization practices. This variability highlights the need for zoned phosphorus fertilization to ensure efficient nutrient replenishment.
Available potassium (K) ranged from 45.59 to 517.54 mg·kg−1, with a mean of 152.82 mg·kg−1 and a median of 137.98 mg·kg−1. Although the CV = 50.20% indicates high variability, the positive skewness (Skewness = 1.76) and elevated kurtosis (5.64) reveal a strongly leptokurtic distribution, where most plots cluster around the mean. Nevertheless, some areas exhibit significantly higher levels of available K. This pattern suggests the coexistence of over-accumulated zones and areas with marginal levels (< 100 mg·kg−1), which may limit productivity. Consequently, site-specific potassium management, supported by precision agriculture techniques, is crucial for optimizing the efficiency of potassium fertilization.
3.2 Spearman correlation analysis of soil properties and their relationship with coffee crop yield
Spearman’s correlation analysis evaluated the non-parametric monotonic associations between coffee yield (t·ha−1) and 28 soil physicochemical properties (Figure 3). These results identified potential covariance patterns between yield and factors related to nutrient retention capacity, macronutrient availability, cation exchange capacity, and variations in soil texture.

Figure 3. Spearman’s non-parametric bivariate correlation matrix between coffee yield (t·ha−1) and 28 soil physicochemical variables. Only statistically significant correlations (p< 0.05) are shown. CMK, (Ca²+ + Mg²+)/K+; CM, Ca²+/Mg²+; MK, Mg²+/K+; ESP, EAP, EPP, ECP, and EMP, Exchangeable sodium, aluminum, potassium, calcium, and magnesium percentages, respectively; CEC and ECEC, Total and effective cation exchange capacity, respectively; BD, Soil bulk density; Pav and Kav are available phosphorus and potassium.
Moderate positive correlations (R > 0.30) were observed between yield and total CEC at pH 7 (R = 0.35), along with low but statistically significant positive correlations (p< 0.05) with OM, available K, and P (R = 0.27, 0.25, and 0.24, respectively). Moderate negative correlations were also identified with plantation age (R = –0.30), as well as low but significant negative correlations with silt percentage and ESP (R = –0.27 and –0.26, respectively). These associations, assessed using Spearman’s non-parametric approach, explain the systemic tendency of certain soil fertility variables to vary in conjunction with coffee crop yields. These results provide robust evidence of joint multivariate behavior, indicating that P and K availability processes, along with nutrient retention capacity, positively regulate coffee productivity. In contrast, higher levels of exchangeable sodium (Na+) and greater silt content are associated with reduced yields.
3.3 Principal component analysis
Principal Component Analysis (PCA) was conducted by selecting the variables most strongly correlated with coffee yield, reducing collinearity, and transforming variables to homogenize variances (Table 2). This resulted in 50.29% of variance explained between components 1 and 2. The first principal component (PC1), which explains 32.41% of the total variance in the edaphic system, represents an integrative axis of soil chemical fertility. This component is primarily influenced by organic matter (factor loading = 0.758), cation exchange capacity (0.643), yield (0.590) and available potassium (0.536), and is negatively associated with silt percentage (–0.654). These variables not only exhibited the highest relative contributions and cos² values within the component but also reflect interrelated soil processes that regulate the availability of essential nutrients. PC1 describes a functional gradient ranging from degraded soils with limited cation retention capacity to more balanced matrices with enhanced buffering ability, exchange capacity, and biological activity. This gradient encapsulates key conditions for the nutritional efficiency of coffee cultivation, suggesting that systems with high base retention and well-developed colloidal structures are better suited to supporting higher yields.

Table 2. Results of Principal Component Analysis (PCA) showing eigenvalues, percentage of variance, and variable loadings.
The second principal component (PC2), which accounts for 17.88% of the total variance in the edaphic system, represents a gradient in macronutrient availability and the ontogeny of coffee plants. This axis is primarily shaped by crop age (factor loading = 0.649), available potassium (0.640), and available phosphorus (0.553). Collectively, PC2 describes a trajectory from young, intensively fertilized systems with high levels of low-mobility macronutrients to older plantations, where continuous nutrient extraction results in reduced potassium and phosphorus reserves. This gradient integrates nutrient depletion processes and replenishment strategies, providing a quantitative framework for optimizing potassium and phosphorus fertilization according to the age of the coffee plantation.
Biplot analysis (Figure 4) of the first two principal components (PC1 = 32.41% and PC2 = 17.88%) reveals three differentiated soil domains by district. The Alto Saposoa district is grouped within the positive quadrant of PC1 and the positive sector of PC2, closely aligned with the vectors representing available K, available P, organic matter (OM), CEC at pH 7. This configuration indicates soils with high fertility potential and immediate availability of macronutrients. However, the oblique elongation of the ellipse suggests underlying heterogeneity, likely driven by variability in potassium and phosphorus replenishment strategies.

Figure 4. Principal Component Analysis (PCA) of soil variables, coffee plantation age, and yield in the districts of Alto Saposoa, Soritor, and Vista Alegre.
Soritor, situated in the negative region of PC1 and near the axis of PC2, is associated with variables such as coffee plantation age and silt percentage, indicating that older plantations are established on silty soils and experience a progressive decline of K and P. The extent of its ellipse suggests the coexistence of severely depleted plots alongside others with an intermediate chemical profile.
In contrast, Vista Alegre is located in the positive quadrant of PC1 and the negative quadrant of PC2, within the domain of OM, CEC, and positioned near the yield vector. This placement indicates soils with high buffering capacity and a substantial reservoir of exchangeable bases, conditions associated with higher yields. The narrow, nearly horizontal shape of the ellipse suggests a homogeneous soil composition and consistent agronomic management practices.
These multivariate trajectories provide a quantitative foundation for site-specific fertilization strategies, prioritizing K and P replenishment in Soritor, preserving buffering capacity in Vista Alegre, and monitoring cation saturation in Alto Saposoa, to enhance the sustainability and productivity of coffee cultivation in humid tropical systems.
3.4 Semivariogram models for soil properties in the Alto Saposoa locality
A total of nineteen variables were analyzed using empirical semivariograms fitted to five theoretical models: Gaussian (8 variables), cubic (4 variables), exponential (3 variables), linear (2 variables), and spherical (2 variables), as shown in Table 3. These included sixteen soil physicochemical properties, as well as altitude, planting age, and coffee yield.

Table 3. Semivariogram models for soil properties in the Alto Saposoa district.
Variables fitted to the Gaussian model (pH, available K, exchangeable Al3+, Ca²+, Na+, silt percentage, altitude, and yield) displayed a quadratic increase at the origin of the semivariogram, reflecting high spatial continuity and a gradual decay in correlation with distance. This pattern is characteristic of processes governed by diffusive gradients, leading to smooth kriging surfaces with broad transition zones. In contrast, organic matter, total nitrogen, and clay content followed exponential behavior, with abrupt increases in semivariance at short ranges, consistent with micro-topographic variability or sudden changes in management practices.
Twelve variables exhibited strong spatial dependence (PSV > 0.70), including pH, OM, available P and K, ECEC, exchangeable Al3+, K+, and Na+, sand percentage, yield, altitude and age. This indicates that more than 70% of their variability is explained by a spatially structured component, justifying the use of ordinary kriging for interpolation. Variables such as exchangeable Ca²+, silt and clay percentage, showed moderate spatial dependence (PSV = 0.40–0.70), while exchangeable Mg²+, EC, total N, and exchangeable H+ exhibited weak dependence (PSV< 0.40).
Cross-validation (leave-one-out) showed satisfactory model fits for planting age (R² = 0.51), total N (0.41), clay (0.39), exchangeable Na+ (0.37), yield (0.34), available P (0.32), exchangeable Al3+ (0.32), and available K (0.30). Although these R² values are moderate, they are acceptable for heterogeneous field conditions such as those found in Alto Saposoa, where soil and management variability introduce stochastic components not fully captured by spatial models. Model performance was also evaluated using RMSE, expressed in the original units of each variable, which confirmed low prediction errors (e.g., ± 1.28 mg·kg−1 for available P, ± 1.68 mg·kg−1 for available K, and ±2.23 kg·ha−1 for yield).
The semivariograms selected to generate the maps were those that minimized residual sum of squares (RSS), exhibited low nugget effects, high structural variance, and the highest R² among candidate models (Gaussian, exponential, spherical, cubic, and linear). The high spatial continuity and predictive reliability observed for available P, available K, total N, and clay content support the development of accurate spatial prediction maps for site-specific nutrient management in Alto Saposoa (Figure 5).

Figure 5. Spatial variability maps of soil available P, available K (mg·kg−1), N (%) and clay (%) in coffee plantations of the Alto Saposoa district, San Martín department.
3.5 Semivariogram models for soil properties at the Soritor locality
In the Soritor district, Gaussian models predominated for chemical properties such as OM, total N, available P and K, exchangeable Al3+, H+, and Ca²+, ECEC, and yield, indicating high spatial continuity consistent with diffusive gradients. In contrast, variables such as EC, exchangeable Na+, Mg²+, K+, sand percentage, and altitude were better described by exponential models, suggesting greater local heterogeneity (Table 4).

Table 4. Semivariogram models for soil properties in the Soritor district.
Strong spatial dependence (PSV > 0.70) was observed for variables including EC, total N, Mg²+, Na+, altitude, and yield, supporting the suitability of ordinary kriging for spatial interpolation. Moderate spatial dependence (PSV = 0.40–0.70) was found for OM, available K, exchangeable K+, ECEC, sand and clay percentage.
Among all variables analyzed, the best model fits were obtained for altitude (R² = 0.70, RMSE = ± 0.65 m), pH (R² = 0.64, RMSE = ± 0.40), available P (R² = 0.62, RMSE = ± 1.16 mg·kg−1), and silt percentage (R² = 0.61, RMSE = ± 0.88%), reflecting high spatial prediction accuracy. Although available K showed a slightly lower adjustment (R² = 0.50, RMSE = ± 6.58 mg·kg−1), it was retained for its agronomic relevance as an essential nutrient influencing coffee productivity and its consistent spatial continuity across the study area (Gaussian model, PSV = 0.44).
The high spatial continuity and predictive reliability observed for pH, available P, available K, and silt content support the generation of accurate spatial prediction maps for site-specific nutrient management in Soritor (Figure 6).

Figure 6. Spatial variability maps of soil pH, available P, available K (mg·kg−1) and silt (%) in coffee plantations of the Soritor district, San Martín department.
3.6 Semivariogram models for soil properties at the Vista Alegre locality
In the Vista Alegre district, Gaussian models predominated for most soil chemical properties, including pH, EC, OM, available P and K, exchangeable Al3+, H+, Ca²+, Mg²+, Na+, ECEC, and yield, indicating a predominance of high spatial continuity consistent with gradual soil variation processes. Conversely, variables such as total N, exchangeable K+, and silt percentage were better represented by linear models, suggesting limited spatial structure and higher local randomness (Table 5).

Table 5. Semivariogram models in the Vista Alegre locality.
Strong spatial dependence (PSV > 0.70) was observed for variables including pH (0.99), EC (0.71), P (0.88), K (0.90), Al3+ (0.93), H+ (0.92), Ca²+ (0.91), Mg²+ (0.79), Na+ (1.00), ECEC (0.98), and altitude (0.71), supporting the suitability of ordinary kriging for accurate spatial interpolation in this area. Moderate dependence (PSV = 0.40–0.70) was found for sand, clay, and age.
Among all variables analyzed, the best model fits were obtained for exchangeable Al3+ (R² = 0.59, RMSE = ± 0.78 cmol·kg−1), available K (R² = 0.49, RMSE = ± 0.19 mg·kg−1), available P (R² = 0.49, RMSE = ± 1.16 mg·kg−1), and Clay (R² = 0.56, RMSE = ± 4.17%), indicating high prediction reliability and low absolute errors relative to the measurement scales.
The high spatial continuity and predictive reliability observed for available P, available K, Clay, and exchangeable Al3+ support the generation of accurate spatial prediction maps for site-specific soil fertility management in Vista Alegre (Figure 7).
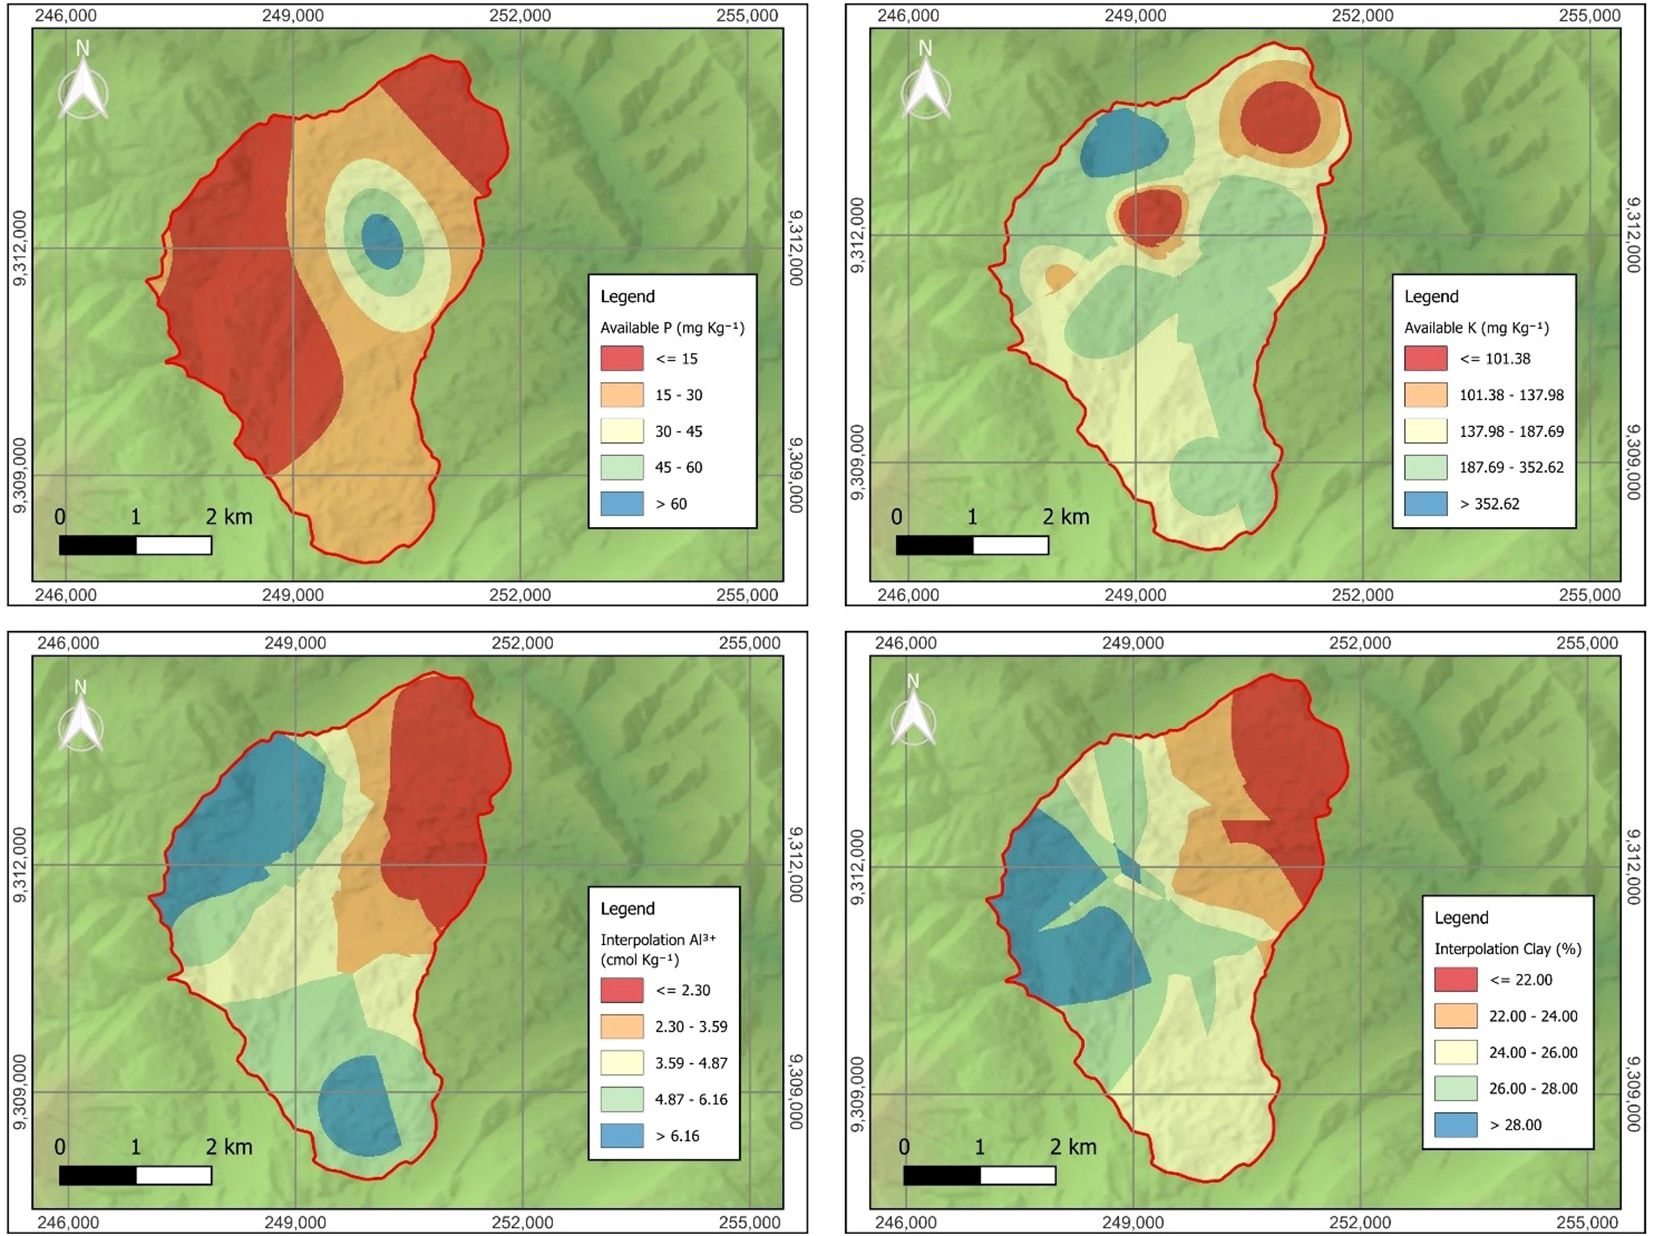
Figure 7. Spatial variability maps of soil available P, available K (mg·kg−1), Al+3 (cmol·kg−1) and clay (%) in coffee plantations of the Vista Alegre district, San Martín department.
4 Discussion
4.1 Soil conditions and their influence on coffee yield.
The results obtained for the three study zones reflect partially favorable conditions for coffee development, although specific limitations could restrict yield if not properly corrected. The mean soil pH was 5.03 ± 0.91 (CV = 18.13%), which is below the optimal range of 5.5–6.5 (26). This acidity may compromise the availability of nutrients such as phosphorus and magnesium and enhance aluminum solubility (27), an element highly toxic to plants. This condition is reflected in the mean Al3+ concentration (2.00 ± 2.69 cmol kg−1; CV = 134.54%), classified as high for coffee cultivation (>1.0 cmol kg−1) (28), representing a direct source of toxicity for the root system that hinders nutrient uptake (29).
The mean organic matter (OM) content was 6.05 ± 3.24% (CV = 53.63%), below the optimal range of 8.0–16.0% (28), suggesting the need to increase organic residue inputs or amendments to improve cation exchange capacity (CEC), soil structure, and biological activity (5, 30). Nevertheless, the mean effective cation exchange capacity (ECEC) was 21.99 ± 12.53 cmol kg−1 (CV = 56.95), a relatively high value (28) indicating good nutrient retention and supply capacity, especially in Vista Alegre, where principal component analysis (PC1) associated OM and CEC positively with higher yields.
Available phosphorus reached 23.44 ± 20.75 mg kg−1 (CV = 88.55%), a value considered high (>20 mg kg−1) (28) in some management zones, which is favorable for floral and root development (31). Similarly, exchangeable potassium averaged 0.46 ± 0.23 cmol kg−1 (CV = 50.96%), also considered high (>0.4 cmol kg−1) (28) in some zones, playing a crucial role in physiological and reproductive functions, especially during bean filling (5). However, multivariate analysis (PC2) indicated that the availability of these nutrients tends to decrease with plantation age. This pattern was particularly evident in Soritor, where the combination of silty soils and older stands was related to lower K and P levels and reduced yields. The Spearman correlation analysis showed moderate positive associations between yield and potassium (r = 0.25) and phosphorus (r = 0.24).
Calcium (mean = 14.48, median = 9.68 cmol kg−1) and magnesium (mean = 1.64, median = 1.31 cmol kg−1) levels were high, which is favorable for soil structural stability, photosynthesis, and cation balance (27). However, the Ca: Mg ratio was 8.87—an elevated value that may generate nutritional imbalances and hinder the efficient absorption of Mg²+ and K+ due to cationic antagonisms (31). This phenomenon may be particularly relevant in Alto Saposoa, where PCA biplot analysis suggests potential cation oversaturation and the need for continuous monitoring of base saturation. Total nitrogen showed a mean of 0.30 ± 0.16% (CV = 53.30%), slightly below the critical threshold of 0.34% (28), indicating the need to reinforce nitrogen supply—particularly during vegetative stages—given its fundamental role in leaf, branch, and flower node formation (32).
The Spearman analysis indicated that yield was moderately and positively correlated with CEC (r = 0.35), and weakly but positively with OM (r = 0.27), K (r = 0.25), and P (r = 0.24). These findings reaffirm that soils with greater buffering capacity and adequate macronutrient availability tend to produce higher yields (26, 33). Additionally, a moderate negative correlation was observed between yield and coffee plantation age (r = –0.30), consistent with previous studies showing a natural decline in productivity beyond the fifth year (34). This effect can be mitigated through rejuvenation practices such as pruning to restore vigor and productivity (35). Negative correlations were also found with silt content (r = –0.27) and exchangeable sodium (r = –0.26). High silt proportions can impair soil structure by promoting encapsulation and compaction, reducing aeration and root development, especially under high rainfall (36). Likewise, excess Na+ in soil solution may induce ionic toxicity and colloid dispersion, negatively affecting structural stability and nutrient absorption (37). Both factors were significant in Soritor, where they coincided with lower productivity. Overall, these results highlight substantial spatial variability in edaphic properties, particularly in OM, P, K, and Al, underscoring the need for more precise and site-specific nutrient management. Recent studies in acidic coffee soils confirm that acidity and Al3+ presence are critical yield constraints, and that spatial characterization of these parameters is essential to design localized liming and nutrient replenishment interventions (38).
4.2 Geostatistical validation of spatial patterns for soil zoning
Geostatistical analyses across the three study sites confirmed that available P and K, altitude, and yield exhibit robust spatial structures that can be leveraged to design differentiated fertilization strategies. The strong spatial dependence of these variables (PSV > 0.70) and their high predictive capacity (R² ≥ 0.49) agree with findings by Ferraz et al. (39), who reported similar patterns in Brazilian coffee fields using kriging. Likewise, Valente et al. (40) demonstrated that soil electrical conductivity strongly correlates with P and K distribution, allowing efficient delineation of management zones, as also observed in Alto Saposoa and Vista Alegre. Evidence from Molin et al. (41) supports this approach, showing up to 34% yield increases and 23% and 13% reductions in P and K use, respectively, under variable-rate fertilization schemes.
Similarly, studies by Mwendwa et al. (5) and Silva et al. (42) support the application of spatial interpolation models in topographically complex environments, using grid-based or auxiliary variables such as elevation to optimize sampling. In this regard, altitude not only acts as a physical descriptor but also modulates nutrient availability by influencing temperature, moisture, and soil activity, as reported by Ge et al. (43) who confirmed that altitudinal gradients alter K and P dynamics, affecting mineralization and root uptake—as observed in Soritor.
Our integrated approach, which combines multivariate analysis with kriging, is consistent with recent studies demonstrating substantial improvements in coffee yield prediction when covariates and outlier management strategies are incorporated. These approaches enhance the accuracy of management zone mapping and increase the practical utility of models for variable-rate fertilization decisions (6, 42).
4.3 Differentiated agronomic management based on soil zoning
The integration of the obtained results allows establishing specific soil management strategies for each of the three evaluated zones, consistent with the spatial variability of soil properties, plantation age, and yield patterns. These strategies are based on significant correlations, functional gradients identified through PCA, and spatial distribution validated by kriging.
The results described above show that precision agriculture enhances fertilizer use efficiency and reduces environmental impacts when spatial variability is transformed into management zones and variable-rate prescriptions (44). In perennial crops with architecture similar to coffee, variable-rate fertilization has demonstrated operational stability and energy savings without yield penalties, reinforcing the relevance of site-specific strategies in deep-rooted systems (45, 46). Moreover, recent studies in Coffea canephora have shown root concentration in the 0–30 cm layer, but with genotypes exploring 50–60 cm depths, whose distribution shifts under shade trees—indicating water competition and the need for depth- and distance-specific management (47, 48). By analogy, in avocado, integrating remote sensing with soil moisture sensors allows irrigation adjustment to the critical root zone, with field solutions proving useful for estimating water stress and scheduling irrigation (49, 50). Complementarily, in citrus, predictive models of soil moisture/electrical conductivity provide operational forecasts for irrigation and fertilization, while in cacao and agroforestry systems, apparent electrical conductivity and management zone delineation have proven effective for stratifying environments and guiding input application (51–53). Literature on deep-rooted crops such as sugarcane, along with recent studies on root architecture in annual crops, indicates that characterizing only the surface layer may underestimate nutrient reserves and dynamics relevant to yield. Therefore, for coffee plantations with roots exploring subsurface layers, it is recommended to complement surface sampling with subsurface cores or to incorporate auxiliary variables that capture depth and root biomass effects (6, 47).
In Alto Saposoa, the high availability of P and K, along with elevated CEC and potential cationic imbalances (Ca/Mg > 10), suggest reducing phosphate and potassic fertilizer doses by up to 30% in zones exceeding 30 mg kg−1 P and 180 mg kg−1 K. Regular monitoring of base saturation is recommended, avoiding liming where pH > 5.5 and Al3+< 1 cmol kg−1.
In Soritor, the combination of silty soils, low fertility, and aging plantations necessitates intensified nutrient replenishment, particularly in areas with P< 15 mg kg−1 and K< 120 mg kg−1. The negative correlation between plantation age and yield supports implementing rejuvenation or pruning practices in plots older than seven years. Furthermore, low OM and CEC require greater organic residue incorporation to improve soil quality.
In Vista Alegre, the good buffering capacity (OM > 6%, CEC > 20 cmol kg−1) and moderate acidity levels indicate favorable soil stability. Current management practices should be maintained, applying liming only selectively (when Al3+ > 1.5 cmol kg−1 or pH< 5.5), and reinforcing soil conservation practices to preserve long-term fertility.
Although this study provides a quantitative framework for soil zoning in coffee plantations, its limitations must be considered. Extrapolation of results to other regions requires validation, particularly where topography or agronomic management differ substantially. In line with recent reviews on precision agriculture in coffee and findings from perennial and deep-rooted crops, future research should integrate deeper soil profiles, biological indicators, and multitemporal remote sensing data to strengthen model predictability and facilitate the scalability of management zones at farm and regional levels (6, 54).
Moreover, the integration of climatic and microbiological information, as well as the use of digital decision-support platforms, represents an emerging field with high potential to enhance the sustainability and resilience of coffee production systems under environmental variability scenarios (42, 55).
5 Conclusions
This study demonstrated that the physicochemical properties of acidic soils (IQR = 4.30–5.70) in the study areas of the Alto Saposoa, Soritor, and Vista Alegre districts significantly influence coffee productivity, confirming the hypothesis that edaphic variability conditions crop yield. Multivariate analyses revealed that organic matter, cation exchange capacity (CEC), and the availability of P and K are the main positive regulators of productivity, whereas exchangeable sodium and silt content act as limiting factors.
Principal component analysis (PCA) identified functional axes of the soil system that define fertility gradients and establish contrasting edaphic domains among districts. These domains reflect soil degradation or conservation processes associated with management practices and crop age, supporting the need for differentiated strategies: liming and replenishment of P and K in Soritor, conservation of buffering capacity in Vista Alegre, and control of cation balance (Ca, Mg, Na) in Alto Saposoa.
Geostatistical modeling validated the spatial structure of soil properties and yield, confirming its usefulness for generating high-precision fertility and productivity maps. These results consolidate the applicability of multivariate and geostatistical analyses as effective tools for site-specific coffee management, fostering more efficient and sustainable agriculture.
The integration of these approaches with soil biological indicators and climatic variables could improve yield prediction at the regional scale. Likewise, field validation of fertility maps and the implementation of GIS-based decision-support systems will enable progress toward precision coffee agriculture, optimizing input use and enhancing the resilience of coffee agroecosystems in the Peruvian Amazon.
Data availability statement
The original contributions presented in the study are included in the article/Supplementary Material. Further inquiries can be directed to the corresponding author.
Author contributions
SM: Formal Analysis, Methodology, Software, Visualization, Writing – original draft. KQ: Conceptualization, Data curation, Formal Analysis, Investigation, Methodology, Software, Validation, Writing – original draft, Writing – review & editing. HD-C: Conceptualization, Data curation, Formal analysis, Investigation, Methodology, Software, Validation, Writing – original draft, Writing – review & editing. RR: Investigation, Writing – original draft, Writing – review & editing. RM: Investigation, Writing – original draft, Writing – review & editing. JC: Supervision, Validation, Visualization, Writing – review & editing. RS: Conceptualization, Supervision, Validation, Writing – review & editing.
Funding
The author(s) declared that financial support was received for this work and/or its publication. The research was funded by the Instituto Nacional de Innovación Agraria, within the framework of the project: Mejoramiento de los servicios de investigación y transferencia tecnológica en el manejo y recuperación de suelos agrícolas degradados y aguas para riego en la pequeña y mediana agricultura en los departamentos de Lima, Áncash, San Martín, Cajamarca, Lambayeque, Junín, Ayacucho, Arequipa, Puno y Ucayali” CUI 2487112.
Conflict of interest
The authors declare that the research was conducted in the absence of any commercial or financial relationships that could be construed as a potential conflict of interest.
Generative AI statement
The author(s) declare that no Generative AI was used in the creation of this manuscript.
Any alternative text (alt text) provided alongside figures in this article has been generated by Frontiers with the support of artificial intelligence and reasonable efforts have been made to ensure accuracy, including review by the authors wherever possible. If you identify any issues, please contact us.
Publisher’s note
All claims expressed in this article are solely those of the authors and do not necessarily represent those of their affiliated organizations, or those of the publisher, the editors and the reviewers. Any product that may be evaluated in this article, or claim that may be made by its manufacturer, is not guaranteed or endorsed by the publisher.
Supplementary material
The Supplementary Material for this article can be found online at: https://www.frontiersin.org/articles/10.3389/fsoil.2025.1701602/full#supplementary-material.
References
1. Food and Agriculture Organization of the United Nations. FAOSTAT: Producción de cultivos (2024). FAO. Available online at: https://www.fao.org/faostat/es/data/QCL/visualize (Accessed June 17, 2025).
2. Integrated Agricultural Statistics System. Calendario agrícola (2024). Ministerio de Desarrollo Agrario y Riego. SIEA. Available online at: https://siea.midagri.gob.pe/portal/calendario/ (Accessed June 17, 2025).
3. Gaspar Nolte. Coffee annual (2024). U.S. Department of Agriculture (USDA): Foreign Agricultural Service. Available online at: https://apps.fas.usda.gov/newgainapi/api/Report/DownloadReportByFileName?fileName=Coffee%20Annual_Lima_Peru_PE2024-0008.pdf (Accessed June 17, 2025).
4. Zhang N, Wang M, and Wang N. Precision agriculture—a worldwide overview. Comput Electron Agric. (2002) 36:113–32. doi: 10.1016/S0168-1699(02)00096-0
5. Mwendwa SM, Mbuvi JP, Kironchi G, and Gachene CKK. Assessing spatial variability of selected soil properties in Upper Kabete Campus coffee farm, University of Nairobi, Kenya. Heliyon. (2022) 8:e10190. doi: 10.1016/j.heliyon.2022.e10190
6. Silva CDOF, Grego CR, Manzione RL, Oliveira SRDM, Rodrigues GC, Rodrigues CAG, et al. Summarizing soil chemical variables into homogeneous management zones – case study in a specialty coffee crop. Smart Agric Technol. (2024) 7:100418. doi: 10.1016/j.atech.2024.100418
7. Fick SE and Hijmans RJ. WorldClim 2: new 1-km spatial resolution climate surfaces for global land areas. Intl J Climatology. (2017) 37:4302–15. doi: 10.1002/joc.5086
8. Havlin JL, Tisdale SL, Nelson WL, and Beaton JD. Soil fertility and fertilizers: an introduction to nutrient management (2016). India: Pearson Education. Available online at: https://www.researchgate.net/profile/Praveen-Kumar-521/publication/366175716_Soil_Fertility_and_Fertilizers_by_John_L_Havlin_z-liborg/links/63948fbde42faa7e75af15db/Soil-Fertility-and-Fertilizers-by-John-L-Havlin-z-liborg.pdf (Accessed June 16, 2025).
9. ISO 11464. Soil quality — Pretreatment of samples for physico-chemical analysis (2006). ISO. Available online at: https://www.iso.org/standard/37718.html (Accessed June 17, 2025).
10. Bouyoucos GJ. Hydrometer method improved for making particle size analyses of soils1. Agron J. (1962) 54:464–5. doi: 10.2134/agronj1962.00021962005400050028x
11. Mclean EO. Soil pH and lime requirement. In: Page AL, editor. Agronomy monographs. Madison, WI, USA: Wiley (1982). p. 199–224. doi: 10.2134/agronmonogr9.2.2ed.c12
12. Rhoades JD. Soluble salts. In: Page AL, editor. Agronomy monographs. Page, A L: Wiley (1982). p. 167–79. doi: 10.2134/agronmonogr9.2.2ed.c10
13. Walkley A and Black IA. AN EXAMINATION OF THE DEGTJAREFF METHOD FOR DETERMINING SOIL ORGANIC MATTER, AND A PROPOSED MODIFICATION OF THE CHROMIC ACID TITRATION METHOD. Soil Sci. (1934) 37:29–38. doi: 10.1097/00010694-193401000-00003
14. Kjeldahl J. Neue Methode zur Bestimmung des Stickstoffs in organischen Körpern. Fresenius Z f. Anal Chemie. (1883) 22:366–82. doi: 10.1007/BF01338151
15. Bray RH and Kurtz LT. DETERMINATION OF TOTAL, ORGANIC, AND AVAILABLE FORMS OF PHOSPHORUS IN SOILS. Soil Sci. (1945) 59:39–46. doi: 10.1097/00010694-194501000-00006
16. Bazán Tapia R. Manual de procedimientos de los análisis de suelos y agua con fines de riego (2017). Available online at: https://repositorio.inia.gob.pe/handle/20.500.12955/504 (Accessed June 17, 2025).
17. Thomas GW. Exchangeable cations. In: Page AL, editor. Agronomy monographs. Madison, WI, USA: Wiley (1982). p. 159–65. doi: 10.2134/agronmonogr9.2.2ed.c9
18. Hengl T, Mendes De Jesus J, Heuvelink GBM, Ruiperez Gonzalez M, Kilibarda M, Blagotić A, et al. SoilGrids250m: Global gridded soil information based on machine learning. PloS One. (2017) 12:e0169748. doi: 10.1371/journal.pone.0169748
19. Tunçay T. Comparison quality of interpolation methods to estimate spatial distribution of soil moisture content. Commun Soil Sci Plant Anal. (2021) 52:353–74. doi: 10.1080/00103624.2020.1854283
20. Bock M, Böhner J, Conrad O, Köthe R, and Ringeler A. XV. Methods for creating Functional Soil Databases and applying Digital Soil Mapping with SAGA GIS (2007). eastern Europe. Available online at: https://www.researchgate.net/profile/Ernst-Gehrt-2/publication/285449046_Automatische_Reliefanalyse_fur_geowissenschaftliche_Anwendungen-_derzeitiger_Stand_undWeiterentwicklungen_des_Programms_SARA/links/60ed7bf39541032c6d37022a/Automatische-Reliefanalyse-fuer-geowissenschaftliche-Anwendungen-derzeitiger-Stand-undWeiterentwicklungen-des-Programms-SARA.pdf (Accessed June 10, 2025).
21. Martínez CR. Modelado geoestadístico de fertilidad de un terreno agrícola mediante mapas de Kriging que interpolan los datos de análisis químico de suelos. PAyDS. (2021) 9:63–84. doi: 10.5377/payds.v9i0.11858
22. Gallardo Correa A. Geostadística. In: Geostatistics (2006). Alicante (Spain): Universidad de Alicante. Available online at: http://rua.ua.es/dspace/handle/10045/7703 (Accessed June 17, 2025).
23. Bromberg F and Pérez DS. Interpolación Espacial Mediante Aprendizaje de Máquinas en Viñedos de la Provincia de Mendoza, Argentina (2012). Available online at: http://sedici.unlp.edu.ar/handle/10915/123727 (Accessed June 17, 2025).
24. Beltrán Rodríguez A, Cebrián Guajardo AC, and Castillo-Mateo J. Estadística espacial para datos punto referenciados. Zaragoza: Universidad de Zaragoza (2023).
25. Fernández Villafañez S. Métodos de regresión y clasificación basados en árboles (2022). Available online at: https://uvadoc.uva.es/handle/10324/53822 (Accessed June 17, 2025).
26. Rekik F, Van Es H, Hernandez-Aguilera JN, and Gómez MI. Soil health assessment for coffee farms on andosols in Colombia. Geoderma Regional. (2018) 14:e00176. doi: 10.1016/j.geodrs.2018.e00176
27. Parecido RJ, Soratto RP, Perdoná MJ, Gitari HI, Dognani V, Santos AR, et al. Liming method and rate effects on soil acidity and arabica coffee nutrition, growth, and yield. J Soil Sci Plant Nutr. (2021) 21:2613–25. doi: 10.1007/s42729-021-00550-9
28. Sadeghian S. Interpretación de los resultados de análisis de suelos. mem. (2022) 71:e71142. doi: 10.38141/10795/71142
29. Méndez YR, Chacón LM, Corzo MH, and Angulo HMR. La toxicidad por aluminio (Al3+) como limitante del crecimiento y la productividad agrícola: el caso de la palma de aceite. Palmas. (2016) 37:11–23.
30. Marbun P, Nasution Z, Hanum H, and Karim A. The classification, characteristics, and assessment of soil profile fertility on Coffea arabica productivity in North Sumatra. Bulgarian J Agri Sci. (2020) 26(3):622–32.
31. Abebe Y, Juergen B, Endashaw B, Kitessa H, and Heiner G. The role of soil nutrient ratios in coffee quality: Their influence on bean size and cup quality in the natural coffee forest ecosystems of Ethiopia. Afr. J Agric Res. (2019) 14:2090–103. doi: 10.5897/AJAR2019.14332
32. Hifnalisa H, Jufri Y, Rizka F, and Rosmaiti R. Improving productivity of arabica coffee genotype G1 through potassium fertilization. IOP Conf Ser.: Earth Environ Sci. (2024) 1356:12019. doi: 10.1088/1755-1315/1356/1/012019
33. Getachew M, Tolassa K, De Frenne P, Verheyen K, Tack AJM, Hylander K, et al. The relationship between elevation, soil temperatures, soil chemical characteristics, and green coffee bean quality and biochemistry in southwest Ethiopia. Agron Sustain Dev. (2022) 42:61. doi: 10.1007/s13593-022-00801-8
34. Somarriba E and Quesada F. Modeling age and yield dynamics in Coffea arabica pruning systems. Agric Syst. (2022) 201:103450. doi: 10.1016/j.agsy.2022.103450
35. Rendón JR, Grajales AM, and Salazar HM. Efecto de la renovación por zoca y podas en la biomasa de raíces de café. Rev Cenicafé. (2023) 74:e74105. doi: 10.38141/10778/74105
36. Finch S, Samuel A, and Lane G. Lockhart and wiseman’ s crop husbandry including grassland. Madison, WI, USA: Elsevier (2023). doi: 10.1016/C2020-0-01095-9
37. Sparks DL. The chemistry of saline and sodic soils. In: Environmental soil chemistry. Madison, WI, USA: Elsevier (2003). p. 285–300. doi: 10.1016/B978-012656446-4/50010-4
38. Quispe K, Hermoza N, Mejia S, Romero-Chavez LE, Ottos E, Arce A, et al. Spatial analysis of soil acidity and available phosphorus in coffee-growing areas of pichanaqui: implications for liming and site-specific fertilization. Agriculture. (2025) 15:1632. doi: 10.3390/agriculture15151632
39. Ferraz GAES, Silva FMD, Oliveira MSD, Custódio AAP, and Ferraz PFP. Spatial variability of plant attributes in a coffee plantation. Rev Ciec Agron. (2017) 48:81–91. doi: 10.5935/1806-6690.20170009
40. Valente DSM, Queiroz DMD, Pinto F. D. A. D. C., Santos NT, and Santos FL. Definition of management zones in coffee production fields based on apparent soil electrical conductivity. Sci Agric (Piracicaba Braz.). (2012) 69:173–9. doi: 10.1590/S0103-90162012000300001
41. Molin JP, Motomiya AVDA, Frasson FR, Faulin GDC, and Tosta W. Test procedure for variable rate fertilizer on coffee. Acta Sci Agron. (2010) 32:569–75. doi: 10.4025/actasciagron.v32i4.5282
42. Silva EROD, Silva TLD, Wei MCF, Souza RAD, and Molin JP. Spatial and temporal variability management for all farmers: A cell-size approach to enhance coffee yields and optimize inputs. Plants. (2025) 14:169. doi: 10.3390/plants14020169
43. Ge Y, Zhang F, Xie C, Qu P, Jiang K, Du H, et al. Effects of different altitudes on coffea arabica rhizospheric soil chemical properties and soil microbiota. Agronomy. (2023) 13:471. doi: 10.3390/agronomy13020471
44. Cai B, Shi F, Geremew BA, Addis AK, Abate MC, Dessie W, et al. Precision agriculture techniques for optimizing chemical fertilizer use and environmental sustainability: a systematic review. Front Agron. (2025) 7:1665444. doi: 10.3389/fagro.2025.1665444
45. Barros MMD, Cunha JPB, Conceição FGD, Volpato CES, Ferraz GAES, and Silva FMD. Development and evaluation of a variable-rate fertilizer distribution system for coffee plants. AgriEngineering. (2024) 6:4064–76. doi: 10.3390/agriengineering6040229
46. Angnes G, Martello M, Faulin GDC, Molin JP, and Romanelli TL. Energy efficiency of variable rate fertilizer application in coffee production in Brazil. AgriEngineering. (2021) 3:815–26. doi: 10.3390/agriengineering3040051
47. Schmidt R, Silva LOE, Ferreira A, Rodrigues WP, Vieira HD, Tomaz MA, et al. Root system of Coffea canephora cv. Robusta genotypes cultivated in the Brazilian Amazon. Discov Agric. (2024) 2:32. doi: 10.1007/s44279-024-00049-8
48. Kobusinge J, Kagezi GH, Sseremba G, Taulya G, Nakitende A, and Arinaitwe G. Differential distribution of fine roots between Robusta coffee and shade trees influences water use. Agroforest Syst. (2025) 99:231. doi: 10.1007/s10457-025-01319-0
49. Torres-Quezada E, Fuentes-Peñailillo F, Gutter K, Rondón F, Marmolejos JM, Maurer W, et al. Remote sensing and soil moisture sensors for irrigation management in avocado orchards: A practical approach for water stress assessment in remote agricultural areas. Remote Sens. (2025) 17:708. doi: 10.3390/rs17040708
50. Medina DE, Medina JD, Zorro JA, Medina Tobon D, Gomez JJ, and Giraldo LF. A precision agriculture solution for water stress estimation in Hass avocado farms in Colombia. Sci Rep. (2024) 14:31178. doi: 10.1038/s41598-024-82344-4
51. Gao P, Xie J, Yang M, Zhou P, Chen W, Liang G, et al. Improved soil moisture and electrical conductivity prediction of citrus orchards based on ioT using deep bidirectional LSTM. Agriculture. (2021) 11:635. doi: 10.3390/agriculture11070635
52. Isong IA, Olim DM, Nwachukwu OI, Onwuka MI, Afu SM, Otie VO, et al. Delineating soil management zones for site-specific nutrient management in cocoa cultivation areas with a long history of pesticide usage. Land. (2025) 14:1366. doi: 10.3390/land14071366
53. Ylagan S, Brye KR, Ashworth AJ, Owens PR, Smith H, and Poncet AM. Using apparent electrical conductivity to delineate field variation in an agroforestry system in the ozark highlands. Remote Sens. (2022) 14:5777. doi: 10.3390/rs14225777
54. Silva CdeOF, Manzione RL, and de Oliveira SRM. Exploring 20-year applications of geostatistics in precision agriculture in Brazil: what’s next? Precis Agric. (2023) 24:2293–326. doi: 10.1007/s11119-023-10041-9
Keywords: precision agriculture, soil zoning, coffee yield, applied geostatistics, soil fertility
Citation: Maita SM, Quispe K, Díaz-Chuquizuta H, Rengifo Sanchéz R, Mercado Chinchay R, Cuevas Gimenez JP and Solórzano R (2025) Soil spatial variability in high-yield Peruvian Amazon coffee: a geostatistical approach for precision fertilization. Front. Soil Sci. 5:1701602. doi: 10.3389/fsoil.2025.1701602
Received: 09 September 2025; Accepted: 26 November 2025; Revised: 20 November 2025;
Published: 18 December 2025.
Edited by:
Francisco Bautista, Universidad Nacional Autónoma de México, MexicoReviewed by:
Vijay Singh Meena, ICAR - Mahatma Gandhi Integrated Farming Research Institute, IndiaLOPEZ-CASTAÑEDA ANTONIO, Colegio de Postgraduados - Campus Tabasco, Mexico
Ángeles Gallegos, National Council of Science and Technology (CONACYT, Mexico
Copyright © 2025 Maita, Quispe, Díaz-Chuquizuta, Rengifo Sanchéz Mercado Chinchay, Cuevas Gimenez and Solórzano. This is an open-access article distributed under the terms of the Creative Commons Attribution License (CC BY). The use, distribution or reproduction in other forums is permitted, provided the original author(s) and the copyright owner(s) are credited and that the original publication in this journal is cited, in accordance with accepted academic practice. No use, distribution or reproduction is permitted which does not comply with these terms.
*Correspondence: Richard Solórzano, aW52ZXN0aWdhY2kmI3hmMztuX2xhYnNhZkBpbmlhLmdvYi5wZQ==