 Ziming Jiang
 Ruijuan Zhang
 Liang Dong
- Department of Critical Care Medicine, Taizhou Central Hospital (Taizhou University Hospital), Taizhou, Zhejiang, China
Background: This study aimed to develop and validate a prognostic nomogram for predicting 3-month functional recovery in patients undergoing surgery for spontaneous intracerebral hemorrhage (ICH).
Methods: A retrospective cohort of 289 patients diagnosed with spontaneous intracerebral hemorrhage (ICH) underwent surgical management at the Intensive Care Unit of Taizhou Central Hospital between January 2021 and December 2024 was enrolled. Patients were randomly allocated into a training set (n = 203, 70%) and validation set (n = 86, 30%). A prognostic nomogram integrating imaging characteristics and clinical parameters was developed to predict 90-day functional recovery (modified Rankin Scale ≤2). Feature selection employed the Boruta algorithm, followed by multivariable logistic regression. Model discrimination was quantified by area under the ROC curve (AUC), while calibration curve was performed to evaluate model performance. Clinical utility was evaluated through decision curve analysis (DCA).
Results: The multivariable model retained six significant predictors: midline shift (OR:2.09, 95%CI: 1.56–2.79), hematoma volume (OR:1.10, 95%CI: 1.05–1.15), age (OR:1.03, 95%CI: 1.01–1.05), mean arterial pressure (OR:0.93, 95%CI: 0.89–0.98), body mass index (OR:0.78, 95%CI: 0.66–0.92), and Glasgow Coma Scale (GCS) score (OR:0.92, 95%CI: 0.79–1.06). Discriminative performance was robust, with area under the receiver operating characteristic curve (AUC) of 0.90 (95% CI: 0.85–0.96) in the training set and 0.83 (95% CI: 0.73–0.93) in the validation set. Calibration plots demonstrated excellent agreement between predicted and observed probabilities. DCA confirmed the clinical value of the model and its good impact on actual decision-making.
Conclusion: This study developed and validated a pragmatic prognostic nomogram for spontaneous ICH patients undergoing surgical intervention, integrating six clinically actionable predictors: midline shift, hematoma volume, age, MAP, BMI, and GCS. The model demonstrated robust discriminative capacity, calibration and clinical applicability, which provides evidence-based support for the formulation of individualized rehabilitation programs and the optimization of medical resources.
Introduction
Spontaneous intracerebral hemorrhage (ICH), defined as acute extravasation of blood into the brain parenchyma secondary to cerebrovascular rupture, is recognized as the most lethal form of acute stroke (1), carrying an early mortality rate of 30%–40% (2). In the United States, ICH accounts for approximately 10% of the estimated 795,000 annual stroke cases (3). Despite significant advancements in minimally invasive surgical techniques in recent years, postoperative functional recovery in patients demonstrates marked heterogeneity. Notably, no clinical outcome improvement was observed in preoperatively comatose patients undergoing surgical intervention (4). This prognostic uncertainty poses substantial challenges for clinical decision-making, rehabilitation resource allocation, and physician-patient communication. Current prognostic scoring systems (e.g., ICH Score, FUNC Score) incorporating parameters such as age, hematoma volume, and Glasgow Coma Scale (GCS) (5, 6), demonstrate significant limitations when applied to postoperative functional recovery prediction. Most existing models were developed using Western population datasets and have demonstrated suboptimal performance during external validation in Asian cohorts (7).
Prediction models are designed to forecast future outcomes based on a set of baseline predictors, thereby facilitating medical decision-making and improving patient prognostication (8), These models are increasingly employed in contemporary practice to assess and predict clinical endpoints. The publication of transparent reporting guidelines for prediction model studies [TRIPOD (Transparent Reporting of a Multivariable Prediction Model for Individual Prognosis or Diagnosis) Statement] (9), has established a standardized framework for developing prediction models with enhanced methodological rigor and clinical utility.
The primary objective of this retrospective study was to develop a predictive model for postoperative functional recovery in patients with spontaneous intracerebral hemorrhage (ICH). We sought to identify critical risk factors potentially influencing clinical outcomes. Utilizing clinical characteristics of ICH patients as predictors, a prognostic nomogram was constructed to facilitate individualized outcome assessment.
Methods
Data source
Patient data were retrospectively extracted from the electronic medical records of Taizhou Central Hospital. This study was approved by the Institutional Review Board (IRB) of Taizhou Central Hospital (Approval No.: 2025l-03-054). Informed consent was waived by the IRB due to the retrospective nature of the study.
We included consecutive patients meeting the following criteria:
1. Diagnosis: Spontaneous intracerebral hemorrhage (ICH) confirmed by non-contrast CT or MRI within 24 h of symptom onset.
2. Intervention: Underwent surgical management (hematoma evacuation or decompressive craniectomy) within 24 h of symptom onset.
3. Timeframe: Admitted between January 2021 and December 2024.
Exclusion criteria were:
1. Age <18 years
2. Delayed diagnosis (>24 h from symptom onset to imaging)
3. Secondary hemorrhage due to trauma, tumor
4. Palliative care-only approach per family request
5. Missing data exceeding 20% of key variables
6. Active malignancy or severe hepatic/renal insufficiency
The study flowchart detailing enrollment is provided in Figure 1.
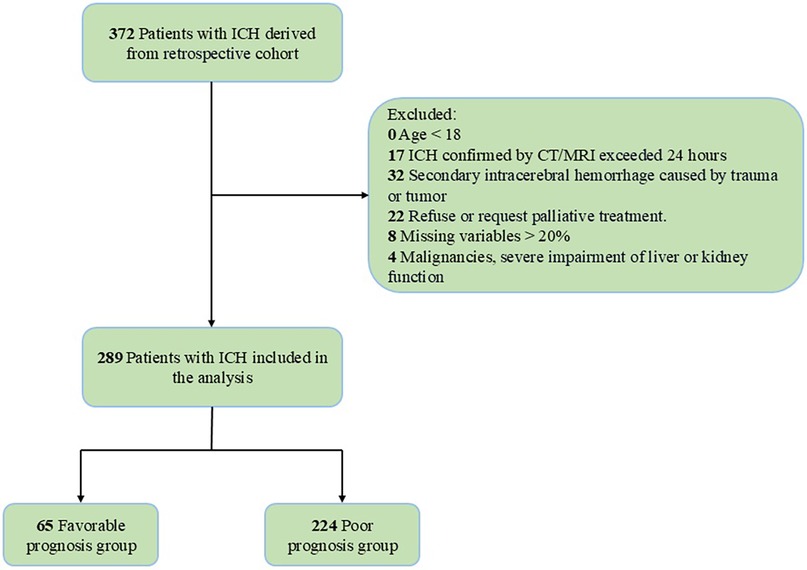
Figure 1. Flowchart of the study.
Data collection
1. Demographic Data: Age, sex, BMI, Smoking, alcohol consumption
2. Medical history: hypertension, diabetes, anticoagulant use
3. Neuroimaging Assessment: Hemorrhage location (supratentorial yes/no), Hematoma volume calculated via ABC/2 formula (10), Midline shift measurement (the greatest degree of shift, millimeters) on axial CT
4. Physiological Parameters: Glasgow Coma Scale (GCS), temperature, SBP, DBP, MAP, heart rate, respiratory rate, SpO2
5. Laboratory Profiling: pH, PaO2, PaCO2, white blood cell, hemoglobin, platelet, potassium, sodium, blood urea nitrogen, creatinine, international normalized ratio, prothrombin time
Outcome assessment
Functional outcomes were evaluated using the modified Rankin Scale (mRS) through structured telephone interviews at 3-month follow-up. Outcomes were dichotomized as favorable (mRS score ≤2) or poor (mRS score >2).
Statistical analysis
Given the retrospective design of this study, a priori sample size calculation was not performed. Continuous variables were expressed as mean ± standard deviation (SD) when normally distributed (assessed by Shapiro–Wilk test), or median with interquartile range (IQR, 25th–75th percentiles) for skewed distributions. Categorical variables were reported as percentages (counts/total counts). For continuous variables, we perform a t-test or a Mann–Whitney U-test to compare between groups. For categorical variables, we use the chi-square test or Fisher's exact test. Variables with >20% missing data were excluded from multivariable analysis. For variables with ≤20% missingness, multiple imputation was implemented via the MICE package (Multivariate Imputation by Chained Equations) (11). Collinearity among predictors was systematically evaluated visualized in a correlation heatmap (Figure 2). All analyses were performed using R Statistical Software (v4.4.2) and Python (v3.9).
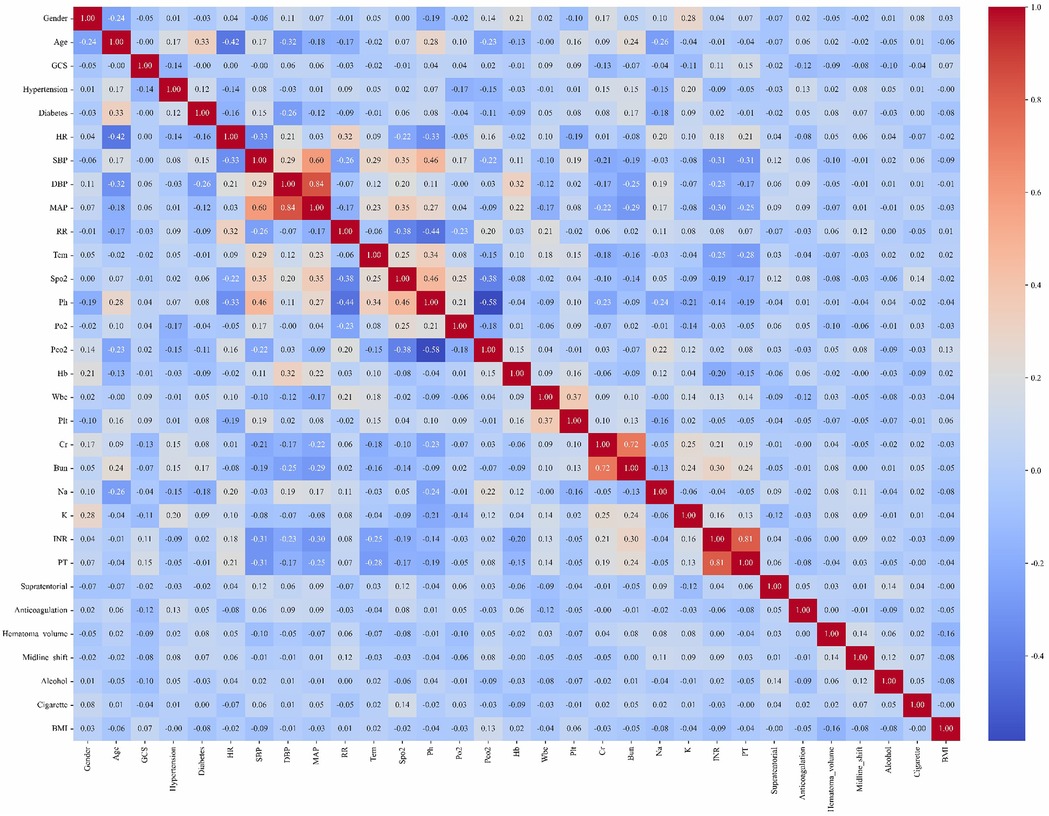
Figure 2. Correlation heatmap of variables.
Results
Baseline characteristics
This study ultimately included 289 patients with spontaneous intracerebral hemorrhage (ICH), among whom 65 patients achieved favorable outcomes (mRS ≤ 2), and 224 patients had poor outcomes (mRS > 2). Baseline characteristics such as alcohol consumption history (p = 0.069), hypertension (p = 0.051), diabetes (p = 0.091), supratentorial hemorrhage location (p = 0.57), and anticoagulant use (p = 0.69) showed no significant differences between the groups. Physiological parameters, including SBP (p = 0.723), heart rate (p = 0.38), respiratory rate (p = 0.086), pH (p = 0.765), PaCO₂ (p = 0.297), PaO₂ (p = 0.329), and laboratory markers such as white blood cell count (p = 0.219), hemoglobin (p = 0.235), and serum sodium (p = 0.065), also demonstrated no significant intergroup differences. However, the poor prognosis group exhibited statistically significant differences (p < 0.05) in multiple critical predictors compared to the favorable prognosis group. The poor prognosis group was older, had a higher proportion of females, and showed elevated smoking history prevalence; larger hematoma volume and greater midline shift; lower BMI and GCS scores, higher body temperature, and reduced mean arterial pressure, diastolic blood pressure, and oxygen saturation; lower platelet counts, elevated potassium, blood urea nitrogen, creatinine, international normalized ratio, and prothrombin time (Table 1).
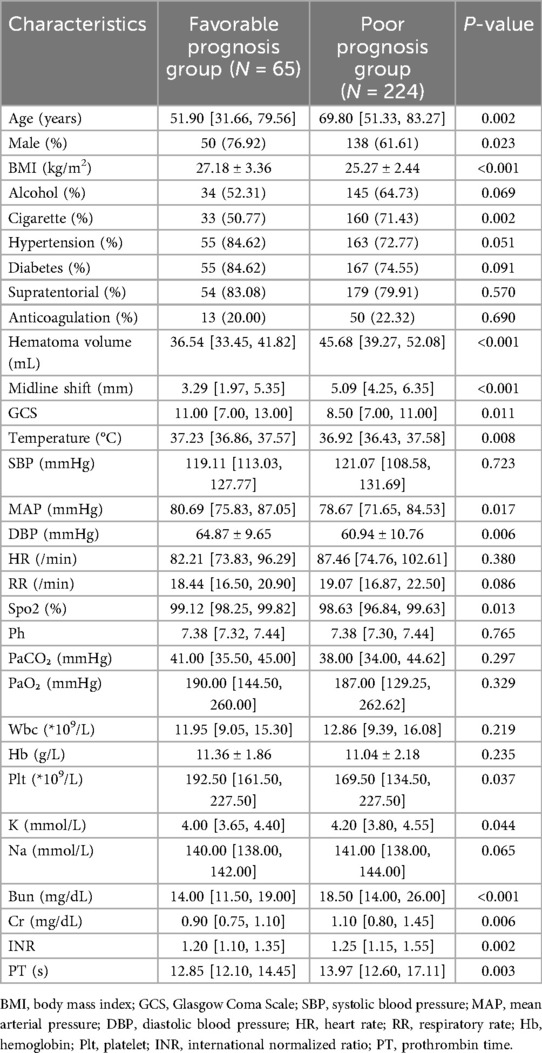
Table 1. Baseline characteristics.
Feature selection
The cohort was randomly stratified into training (70%) and validation (30%) sets. Feature selection was performed in the training set using the Boruta algorithm, a robust wrapper method based on random forest classification. Unlike conventional feature selection approaches that optimize for model-specific performance, Boruta identifies features with intrinsic relevance to the outcome variable by iteratively comparing original attributes to shadow features (random permutations) (12). From 31 candidate predictors, Boruta selected five features with permutation importance: midline shift, hematoma volume, age, MAP, BMI (Figure 3). It is well established that the GCS is a classical tool for assessing the level of consciousness in patients with brain injury and is widely used for prognostic evaluation in neurological disorders such as spontaneous intracerebral hemorrhage (13–15). Numerous clinical studies have demonstrated a close association between GCS scores and adverse outcomes in patients with cerebral hemorrhage (16–18). In clinical practice, GCS also serves as a critical reference for physicians in evaluating the severity of a patient's condition and guiding clinical decision-making. The ultimate goal of predictive modeling is not only to achieve statistical significance but also to ensure clinical interpretability and applicability (19). Therefore, despite the lack of statistical significance between GCS and prognosis in our multivariate regression analysis (p = 0.25), we have included GCS in the final model, acknowledging its established clinical relevance. In the Supplementary Material, we further compared model performance between versions incorporating and excluding the GCS. The final multivariable logistic regression model included these six predictors.
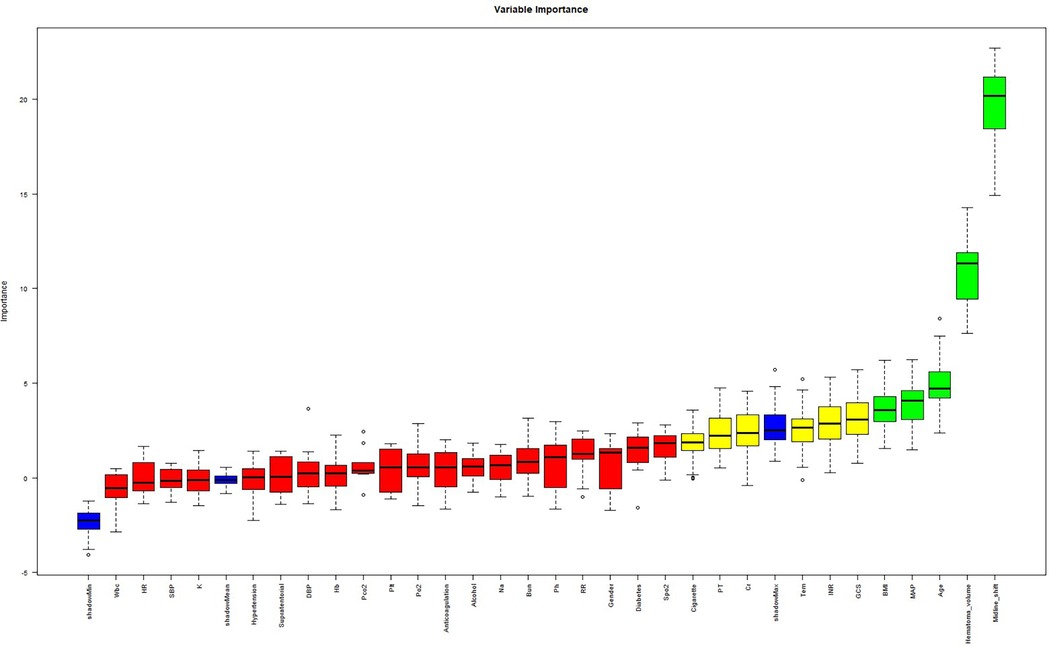
Figure 3. Boruta algorithm for feature importance analysis.
Nomogram
In the training cohort (n = 202), the six selected predictors: midline shift, hematoma volume, age, MAP, BMI, and GCS, were incorporated into a multivariable logistic regression model. The final model demonstrated the following adjusted odds ratios (aORs) with 95% confidence intervals (Table 2): BMI (OR: 0.78; 95%CI 0.66–0.92), midline shift (OR: 2.09; 95%CI 1.56–2.79), hematoma volume (OR: 1.10; 95%CI 1.05–1.15), age (OR: 1.03; 95%CI 1.01–1.05), MAP (OR: 0.93; 95%CI 0.89–0.98), GCS (OR: 0.92; 95%CI 0.79–1.06). A clinical nomogram integrating these predictors was constructed, assigning weighted points proportional to each variable's β-coefficient (Figure 4).
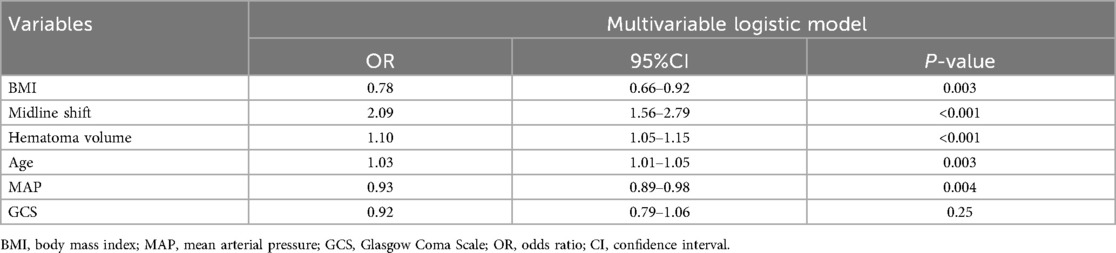
Table 2. Multivariable logistic regression model.
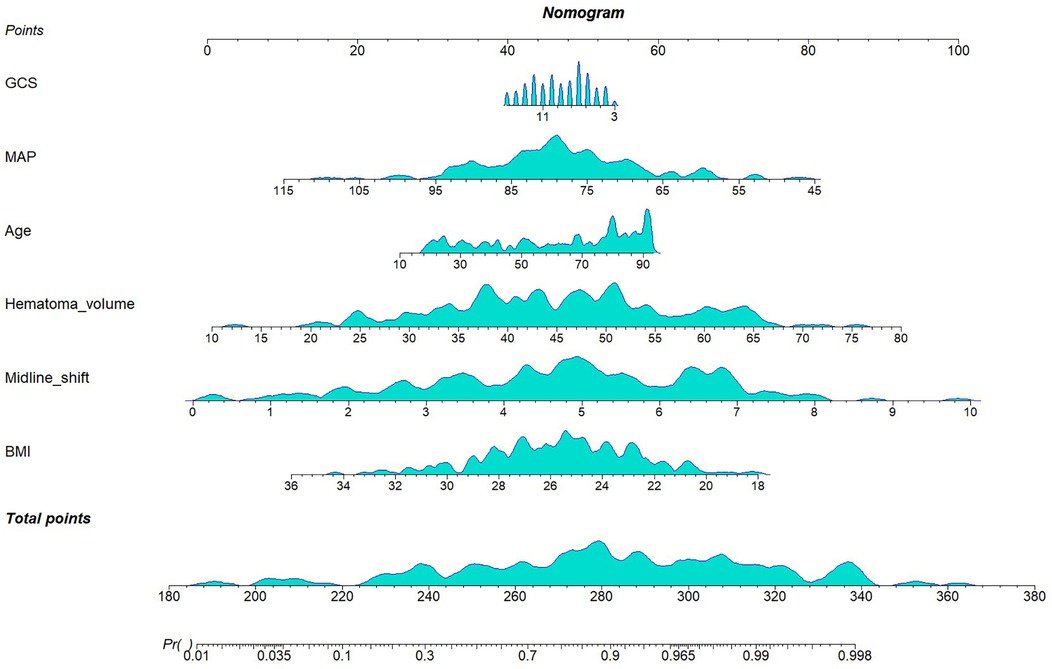
Figure 4. Nomogram for the final model.
Model performance evaluation
Discrimination
The prognostic model derived from multivariable logistic regression was rigorously evaluated using receiver operating characteristic (ROC) curve analysis. In the training cohort, the model demonstrated exceptional discriminative ability with an area under the curve (AUC) of 0.90 (95% CI: 0.85–0.96). When applied to the validation set, the AUC remained clinically significant at 0.83 (95% CI: 0.73–0.93), showing a moderate yet meaningful predictive capacity despite expected performance attenuation (Figure 5).
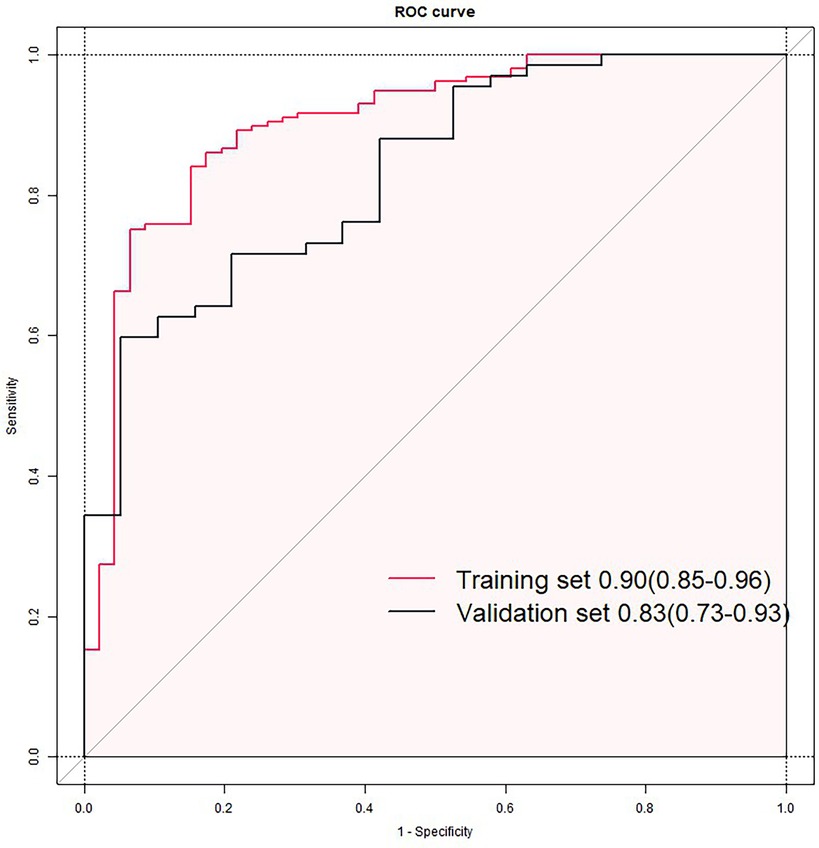
Figure 5. Receiver operating characteristic (ROC) curves of the nomogram model in training (A) and validation sets (B).
Calibration
Calibration performance was rigorously evaluated using calibration plots with 95% confidence intervals, comparing predicted probabilities of poor outcome against observed frequencies. Perfect calibration aligns with the 45-degree reference line (intercept = 0, slope = 1). Visual inspection revealed satisfactory agreement between predictions and observations in both sets (Figure 6).
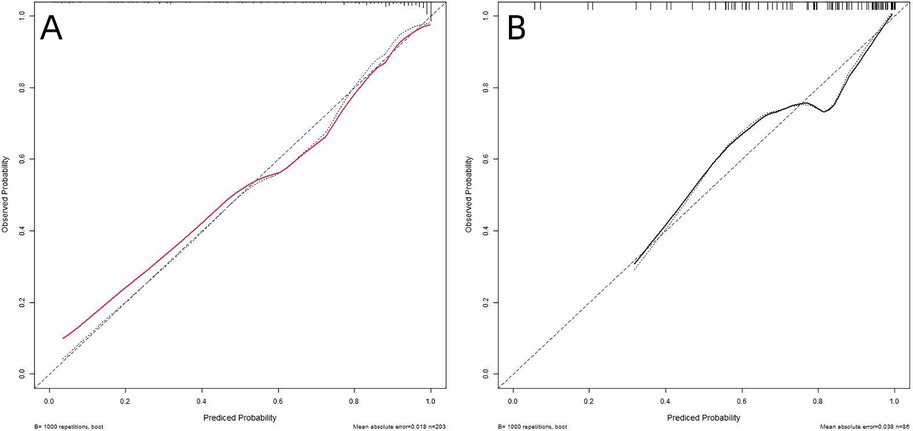
Figure 6. Calibration curves of the nomogram in training (A) and validation (B) sets. The x-axis represents the predicted probability of poor prognosis calculated by the nomogram. The y-axis indicates the observed probability of adverse outcomes. The 45-degree dashed line (y = x) corresponds to perfect prediction alignment.
Decision curve analysis
To evaluate the model's clinical practicality, decision curve analysis (DCA) was conducted by quantifying the net benefit across varying threshold probabilities, the minimum predicted risk at which intervening is deemed justified. Unlike conventional metrics (e.g., AUC), DCA directly reflects clinical utility by weighing benefits (true positives) against harms (false positives) through the formula. By plotting clinical decision curves, we found that the model exhibited a higher net benefit within threshold probability ranges of 4%–95% and 5%–94% for the training and validation sets, respectively (Figure 7). Decision curve analysis demonstrates that the use of this nomogram provides a higher net benefit than treating all or no patients, across a range of clinically relevant threshold probabilities. For example, if a clinician wishes to intensify rehabilitation for patients with a predicted risk above 30%, the nomogram can identify appropriate candidates, thereby optimizing resource allocation and improving patient outcomes.
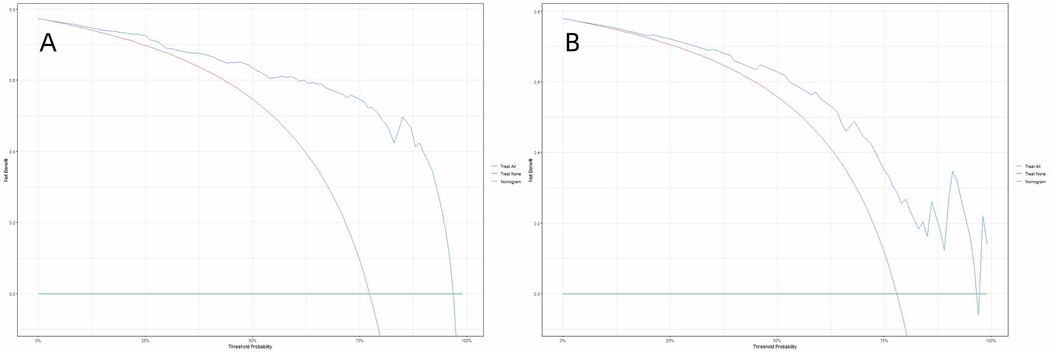
Figure 7. Decision curve analysis (DCA) of the nomogram in the training set (A) and the validation set (B) the decision curve analysis demonstrated that the nomogram provided superior net benefit compared to the “treat-all” and “treat-none” strategies across a threshold probability range of 4%–95% (A) and 5%–94% (B).
Discussion
In this study, poor functional outcome was defined as mRS score >2, while favorable outcome was defined as mRS score ≤2. Our final model identified six robust predictors of postoperative functional recovery: midline shift, hematoma volume, age, MAP, BMI, and GCS score. Notably, this prognostic tool integrating both neuroimaging features (midline shift, hematoma volume) and MAP with traditional clinical variables in spontaneous ICH surgical cohorts. This provides clinicians with a valuable tool for prognostic assessment in such patients, enhancing the precision of postoperative outcome prediction.
According to the Monro-Kellie doctrine (20), the total volume of intracranial contents (brain tissue, blood, and cerebrospinal fluid) remains constant. An increase in hematoma volume or elevated intracranial pressure may lead to brain tissue displacement (such as midline shift) and impaired neurological function (e.g., decreased GCS score). Midline shift, hematoma volume, and age have been consistently identified as key prognostic determinants in patients with intracerebral hemorrhage (5, 21, 22), primarily mediated through the mass effect resulting from the combined impact of parenchymal destruction and mechanical compression by the hematoma (4, 23). Yang et al. (24) demonstrated that a midline shift >4 mm represents the optimal cutoff value significantly associated with poor outcomes in ICH patients. Hematoma volumes exceeding 30 ml showed statistically significant correlation with adverse outcomes, while the combination of hematoma volume >60 ml and GCS score <8 predicted 30-day mortality rates exceeding 90% (5). Early-stage blood pressure control emerges as a critical therapeutic intervention to prevent hematoma expansion, with acute-phase antihypertensive therapy showing a modest but significant effect in reducing hematoma growth (25). Recent evidence (26) confirms that achieving and maintaining systolic blood pressure (SBP) within 120–130 mmHg during the initial 24-hour window demonstrates optimal safety and potential functional benefits. Given hypertension's status as a predominant etiological factor in ICH pathogenesis, our findings revealing the association between MAP and postoperative functional recovery. Notably, higher MAP levels demonstrated a significant protective correlation, aligning with conventional cerebral perfusion pressure (CPP) maintenance targets (27). Specifically, maintaining higher MAP was associated with in favorable outcomes. These results underscore the imperative for implementing dynamic hemodynamic monitoring protocols throughout the perioperative period. In our cohort, elevated body mass index (BMI) demonstrated a significant protective association with functional outcomes (OR 0.78; 95%CI 0.66–0.92). This finding aligns with the emerging concept of the “obesity paradox” in neurocritical care, where overweight status confers survival advantages in acute brain injury populations (28–30). The mechanisms underlying the obesity paradox remain incompletely elucidated, but are believed to involve multifactorial pathways including increased sympathetic nervous system activity, enhanced mitochondrial metabolic capacity, and elevated serum lipoproteins levels (31). Another plausible explanation for the protective effect of BMI observed in this study is that it may serve as a proxy for overall nutritional status. The increased metabolic reserves associated with fat or muscle mass in individuals with higher BMIs may contribute to their ability to withstand inflammatory events during the treatment period (32). Potential inconsistencies concerning the obesity paradox might stem from the higher incidence of complications associated with morbid obesity. For instance, the established link between obesity and insulin resistance (33), where diabetes can lead to poorer outcomes following ICH (34), warrants consideration. Further research, involving large-scale studies and relevant randomized controlled trials (RCTs), is necessary to elucidate the complex relationship between obesity and ICH prognosis. Previous studies (35) have identified INR as an independent risk factor for 3-month mortality in patients with spontaneous intracerebral hemorrhage, potentially due to its association with the use of oral anticoagulants such as warfarin. Additionally, early temperature changes within the first 24 h following intracerebral hemorrhage have been linked to poorer functional outcomes (36). In our cohort, however, when considered alongside other predictors, INR and body temperature did not demonstrate a strong independent association with postoperative functional recovery. This may be attributed to the limited distribution and variance of INR and temperature in our sample. For instance, most patients may have had INR values within the normal range, or temperature fluctuations may have been minimal. It is important to emphasize that the exclusion of these variables from our model does not diminish their clinical significance. Rather, it reflects the data-driven nature of the feature selection process in our specific cohort. Further studies involving larger and more diverse populations may help to clarify the prognostic value of these variables.
Despite its clinical utility, this study has limitations inherent to single-center retrospective designs, including potential selection bias and lack of a priori sample size estimation. The sample size was determined by the number of available cases. Future prospective studies with an adequate sample size are needed for further validation. External validation in diverse healthcare settings and integration of real-time biomarker dynamics could enhance predictive precision. Future implementation studies should evaluate the nomogram's impact on shared decision-making and resource allocation in neurocritical care units. The study did not compare the proposed model with existing clinical prediction models (such as the FUNC score). This limitation should be addressed in future prospective, multicenter studies through prospective collection of the necessary data.
Conclusions
This study developed and validated a pragmatic prognostic nomogram for spontaneous ICH patients undergoing surgical intervention, integrating six clinically actionable predictors: midline shift, hematoma volume, age, MAP, BMI, and GCS. The model demonstrated robust discriminative capacity, calibration and clinical applicability, which provides evidence-based support for the formulation of individualized rehabilitation programs and the optimization of medical resources.
Data availability statement
The raw data supporting the conclusions of this article will be made available by the authors, without undue reservation.
Ethics statement
The studies involving humans were approved by the Institutional Review Board (IRB) of Taizhou Central Hospital. The studies were conducted in accordance with the local legislation and institutional requirements. The ethics committee/institutional review board waived the requirement of written informed consent for participation from the participants or the participants’ legal guardians/next of kin because Informed consent was waived by the IRB due to the retrospective nature of the study.
Author contributions
ZJ: Writing – original draft, Formal analysis, Software. RZ: Data curation, Investigation, Writing – original draft. DW: Software, Writing – review & editing. YL: Writing – review & editing. LD: Resources, Writing – review & editing.
Funding
The author(s) declare that financial support was received for the research and/or publication of this article. This work was supported by the Natural Science Foundation of China (82072146), Natural Science Foundation of Zhejiang Province (LY21H150003), Medical Science and Technology Project of Zhejiang Province (2021KY401, 2023KY406, 2024KY1815), Science and Technology Plan Project of Taizhou (20ywa25, 24ywb47).
Conflict of interest
The authors declare that the research was conducted in the absence of any commercial or financial relationships that could be construed as a potential conflict of interest.
Generative AI statement
The author(s) declare that no Generative AI was used in the creation of this manuscript.
Any alternative text (alt text) provided alongside figures in this article has been generated by Frontiers with the support of artificial intelligence and reasonable efforts have been made to ensure accuracy, including review by the authors wherever possible. If you identify any issue please contact us.
Publisher's note
All claims expressed in this article are solely those of the authors and do not necessarily represent those of their affiliated organizations, or those of the publisher, the editors and the reviewers. Any product that may be evaluated in this article, or claim that may be made by its manufacturer, is not guaranteed or endorsed by the publisher.
Supplementary material
The Supplementary Material for this article can be found online at: https://www.frontiersin.org/articles/10.3389/fsurg.2025.1589876/full#supplementary-material
References
1. Greenberg SM, Ziai WC, Cordonnier C, Dowlatshahi D, Francis B, Goldstein JN, et al. 2022 Guideline for the management of patients with spontaneous intracerebral hemorrhage: a guideline from the American Heart Association/American stroke association. Stroke. (2022) 53(7):e282–361. doi: 10.1161/STR.0000000000000407
2. van Asch CJ, Luitse MJ, Rinkel GJ, van der Tweel I, Algra A, Klijn CJ. Incidence, case fatality, and functional outcome of intracerebral haemorrhage over time, according to age, sex, and ethnic origin: a systematic review and meta-analysis. Lancet Neurol. (2010) 9(2):167–76. doi: 10.1016/S1474-4422(09)70340-0
3. Tsao CW, Aday AW, Almarzooq ZI, Alonso A, Beaton AZ, Bittencourt MS, et al. Heart disease and stroke statistics-2022 update: a report from the American Heart Association. Circulation. (2022) 145(8):e153–639. doi: 10.1161/CIR.0000000000001052
4. de Oliveira Manoel AL. Surgery for spontaneous intracerebral hemorrhage. Crit Care. (2020) 24(1):45. doi: 10.1186/s13054-020-2749-2
5. Hemphill JC 3rd, Bonovich DC, Besmertis L, Manley GT, Johnston SC. The ICH score: a simple, reliable grading scale for intracerebral hemorrhage. Stroke. (2001) 32(4):891–7. doi: 10.1161/01.STR.32.4.891
6. Rost NS, Smith EE, Chang Y, Snider RW, Chanderraj R, Schwab K, et al. Prediction of functional outcome in patients with primary intracerebral hemorrhage: the FUNC score. Stroke. (2008) 39(8):2304–9. doi: 10.1161/STROKEAHA.107.512202
7. Lim JX, Han JX, See AAQ, Lew VH, Chock WT, Ban VF, et al. External validation of hematoma expansion scores in spontaneous intracerebral hemorrhage in an Asian patient cohort. Neurocrit Care. (2019) 30(2):394–404. doi: 10.1007/s12028-018-0631-8
8. Efthimiou O, Seo M, Chalkou K, Debray T, Egger M, Salanti G. Developing clinical prediction models: a step-by-step guide. Br Med J. (2024) 386:e078276. doi: 10.1136/bmj-2023-078276
9. Collins GS, Moons KGM, Dhiman P, Riley RD, Beam AL, Van Calster B, et al. TRIPOD+AI statement: updated guidance for reporting clinical prediction models that use regression or machine learning methods. Br Med J. (2024) 385:e078378. doi: 10.1136/bmj-2023-078378
10. Kothari RU, Brott T, Broderick JP, Barsan WG, Sauerbeck LR, Zuccarello M, et al. The ABCs of measuring intracerebral hemorrhage volumes. Stroke. (1996) 27(8):1304–5. doi: 10.1161/01.STR.27.8.1304
11. Zhang Z. Multiple imputation with multivariate imputation by chained equation (MICE) package. Ann Transl Med. (2016) 4(2):30. doi: 10.3978/j.issn.2305-5839.2015.12.63
12. Kursa MB, Rudnicki WR. Feature selection with the Boruta package. J Stat Softw. (2010) 36(11):1–13. doi: 10.18637/jss.v036.i11
13. Bodien YG, Barra A, Temkin NR, Barber J, Foreman B, Vassar M, et al. Diagnosing level of consciousness: the limits of the Glasgow Coma Scale total score. J Neurotrauma. (2021) 38(23):3295–305. doi: 10.1089/neu.2021.0199
14. Reith FC, Van den Brande R, Synnot A, Gruen R, Maas AI. The reliability of the Glasgow Coma Scale: a systematic review. Intensive Care Med. (2016) 42(1):3–15. doi: 10.1007/s00134-015-4124-3
15. Pisano F, Bilotta F. The predictive value of the verbal Glasgow Coma Scale in traumatic brain injury: a systematic review. J Head Trauma Rehabil. (2024) 39(4):273–83. doi: 10.1097/HTR.0000000000000938
16. He M, Lu Z, Lv Y, Cheng Z, Zhang Q, Jin X, et al. Machine learning-based prediction of 6-month functional recovery in hypertensive cerebral hemorrhage: insights from XGBoost and SHAP analysis. Front Neurol. (2025) 16:1608341. doi: 10.3389/fneur.2025.1608341
17. Qu T, Li S, Zhou X, Miao Q, Ni J, Peng B. Risk factors for early poor outcomes in in-hospital intracranial hemorrhage: a retrospective cohort study. Neurocrit Care. (2025). doi: 10.1007/s12028-025-02306-0
18. Zhang X, Zhang Y, Zhang J, Liu Y, Gao S, Zhang H, et al. Development and validation of a clinical-radiomics nomogram for predicting 180-day functional outcomes in patients with spontaneous thalamic hemorrhage. Neurosurg Rev. (2025) 48(1):496. doi: 10.1007/s10143-025-03653-4
19. Chowdhury MZI, Turin TC. Variable selection strategies and its importance in clinical prediction modelling. Fam Med Community Health. (2020) 8(1):e000262. doi: 10.1136/fmch-2019-000262
20. Mokri B. The Monro-Kellie hypothesis: applications in CSF volume depletion. Neurology. (2001) 56(12):1746–8. doi: 10.1212/WNL.56.12.1746
21. Broderick JP, Brott TG, Duldner JE, Tomsick T, Huster G. Volume of intracerebral hemorrhage. A powerful and easy-to-use predictor of 30-day mortality. Stroke. (1993) 24(7):987–93. doi: 10.1161/01.STR.24.7.987
22. Cheung RT, Zou LY. Use of the original, modified, or new intracerebral hemorrhage score to predict mortality and morbidity after intracerebral hemorrhage. Stroke. (2003) 34(7):1717–22. doi: 10.1161/01.STR.0000078657.22835.B9
23. Qureshi AI, Mendelow AD, Hanley DF. Intracerebral haemorrhage. Lancet. (2009) 373(9675):1632–44. doi: 10.1016/S0140-6736(09)60371-8
24. Yang W-S, Li Q, Li R, Liu Q-J, Wang X-C, Zhao L-B, et al. Defining the optimal midline shift threshold to predict poor outcome in patients with supratentorial spontaneous intracerebral hemorrhage. Neurocrit Care. (2017) 28(3):314–21. doi: 10.1007/s12028-017-0483-7
25. Anderson CS, Heeley E, Huang Y, Wang J, Stapf C, Delcourt C, et al. Rapid blood-pressure lowering in patients with acute intracerebral hemorrhage. N Engl J Med. (2013) 368(25):2355–65. doi: 10.1056/NEJMoa1214609
26. Moullaali TJ, Wang X, Martin RH, Shipes VB, Robinson TG, Chalmers J, et al. Blood pressure control and clinical outcomes in acute intracerebral haemorrhage: a preplanned pooled analysis of individual participant data. Lancet Neurol. (2019) 18(9):857–64. doi: 10.1016/S1474-4422(19)30196-6
27. Lindner A, Rass V, Ianosi BA, Schiefecker AJ, Kofler M, Gaasch M, et al. Individualized blood pressure targets in the postoperative care of patients with intracerebral hemorrhage. J Neurosurg. (2021) 135(6):1656–65. doi: 10.3171/2020.9.JNS201024
28. Becerril-Gaitan A, Ding D, Ironside N, Southerland AM, Worrall BB, Testai FD, et al. Association between body mass Index and functional outcomes in patients with intracerebral hemorrhage. Neurology. (2024) 102(2):e208014. doi: 10.1212/WNL.0000000000208014
29. Dangayach NS, Grewal HS, De Marchis GM, Sefcik RK, Bruce R, Chhatlani A, et al. Does the obesity paradox predict functional outcome in intracerebral hemorrhage? J Neurosurg. (2018) 129(5):1125–9. doi: 10.3171/2017.5.JNS163266
30. Sun W, Xian Y, Huang Y, Sun W, Liu R, Li F, et al. Obesity is associated with better survival and functional outcome after acute intracerebral hemorrhage. J Neurol Sci. (2016) 370:140–4. doi: 10.1016/j.jns.2016.09.029
31. Oktay AA, Lavie CJ, Kokkinos PF, Parto P, Pandey A, Ventura HO. The interaction of cardiorespiratory fitness with obesity and the obesity paradox in cardiovascular disease. Prog Cardiovasc Dis. (2017) 60(1):30–44. doi: 10.1016/j.pcad.2017.05.005
32. Wang Z, Wang J, Wang J, Liao Y, Hu X, Wang M. The obesity paradox in intracerebral hemorrhage: a systematic review and meta-analysis. Front Endocrinol (Lausanne). (2023) 14:1255538. doi: 10.3389/fendo.2023.1255538
33. Yazıcı D, Sezer H. Insulin resistance, obesity and lipotoxicity. Adv Exp Med Biol. (2017) 960:277–304. doi: 10.1007/978-3-319-48382-5_12
34. Ferrete-Araujo AM, Egea-Guerrero JJ, Vilches-Arenas Á, Godoy DA, Murillo-Cabezas F. Predictors of mortality and poor functional outcome in severe spontaneous intracerebral hemorrhage: a prospective observational study. Med Intensiva. (2015) 39(7):422–32. doi: 10.1016/j.medin.2014.10.008
35. Curtze S, Strbian D, Meretoja A, Putaala J, Eriksson H, Haapaniemi E, et al. Higher baseline international normalized ratio value correlates with higher mortality in intracerebral hemorrhage during warfarin use. Eur J Neurol. (2014) 21(4):616–22. doi: 10.1111/ene.12352
36. Laichinger K, Mengel A, Stefanou MI, Kindzierski S, Single C, Geiger LS, et al. Continuous temperature monitoring in patients with spontaneous intracerebral hemorrhage: insights into temperature patterns and variability. J Stroke Cerebrovasc Dis. (2025) 34(8):108366. doi: 10.1016/j.jstrokecerebrovasdis.2025.108366
Keywords: spontaneous intracerebral hemorrhage, predictive model, Boruta, logistic regression, nomogram
Citation: Jiang Z, Zhang R, Weng D, Lv Y and Dong L (2025) Development and validation of a predictive model for postoperative functional recovery in patients with spontaneous intracerebral hemorrhage. Front. Surg. 12:1589876. doi: 10.3389/fsurg.2025.1589876
Received: 23 April 2025; Accepted: 1 October 2025;
Published: 17 October 2025.
Edited by:
Roberto Colasanti, Maurizio Bufalini Hospital, ItalyReviewed by:
Carlos Makoto Miyauchi, Tohoku University, JapanZiyad Makoshi, El Paso Children’s Hospital, United States
Maximilian-Niklas Bonk, Technical University of Munich, Germany
Copyright: © 2025 Jiang, Zhang, Weng, Lv and Dong. This is an open-access article distributed under the terms of the Creative Commons Attribution License (CC BY). The use, distribution or reproduction in other forums is permitted, provided the original author(s) and the copyright owner(s) are credited and that the original publication in this journal is cited, in accordance with accepted academic practice. No use, distribution or reproduction is permitted which does not comply with these terms.
*Correspondence: Liang Dong, ZG9uZ2xpYW5nQHR6Yy5lZHUuY24=