 Micaela N. Sandoval
 Linda W. Moore
 Howard J. Huang
 Edward A. Graviss
- 1Department of Epidemiology, The University of Texas Health Science Center School of Public Health, Houston, TX, United States
- 2Department of Surgery, Houston Methodist Hospital, Houston, TX, United States
- 3Department of Medicine, Houston Methodist Hospital, Houston, TX, United States
- 4Department of Pathology and Genomic Medicine, Houston Methodist Research Institute, Houston, TX, United States
Background: Solid organ transplant (SOT) recipients are not only at increased risk of morbidity and mortality due to acute COVID-19 but may also experience poor long-term outcomes due to post-acute COVID-19 syndromes, including long COVID.
Methods: This retrospective, registry-based chart review evaluated graft failure and mortality among SOT recipients diagnosed with COVID-19 at a large, urban transplant center in Houston, Texas, USA. Patient populations were analyzed separately according to their long COVID status at the time of transplant to preserve the temporal relationship between the exposure (long COVID) and the outcome (graft failure or mortality).
Results: In total, 146 (5%, 146/3,202) patients were diagnosed with long COVID, 443 (14%, 443/3,202) patients expired during the study period, and 202 (6%, 202/3,202) were diagnosed with graft failure. Overall, patients with long COVID were older, had an increased comorbidity burden, and were more likely to be lung, heart, or heart–lung recipients compared with those who were not diagnosed with long COVID. Long COVID was not significantly associated with death or graft failure in this study population, though relationships varied across subpopulations.
Conclusions: The observed differences between patients diagnosed with COVID-19 and long COVID before and after transplant warrant additional studies as the proportion of people with some SARS-CoV-2 infection history approaches 90%. Future investigations may prioritize longitudinal follow-up of long COVID patients diagnosed before or after transplant to determine specific etiologies of long-term morbidity and mortality.
1 Background
Post-COVID conditions, including “long COVID,” have emerged as significant health threats, with patients experiencing debilitating symptoms and decreased quality of life, months to years following even mild COVID-19 episodes (1–5). The etiology of long COVID is still being uncovered, but possible subtypes include persistent viral infection, chronic inflammatory response, and lasting organ damage from the original SARS-CoV-2 infection (6–9). Even in the post-COVID vaccination era, long COVID is becoming an important public health issue, with studies estimating up to 1 in 10 adults in the USA have experienced at least one long COVID symptom (10).
The immune dysfunction and organ damage associated with long COVID are especially concerning in high-risk populations, such as solid organ transplant (SOT) recipients. SOT recipients, who have undergone immunosuppressive treatment and carry increased comorbidity burdens, have an increased risk of morbidity and mortality due to acute COVID-19 (11–15). Additionally, SOT recipients may produce poor humoral and cellular immune responses to SARS-CoV-2 vaccination, which could result in more severe COVID-19 infections (16–19). Investigations into the long-term outcomes associated with post-COVID conditions among SOT recipients are ongoing, but early results indicate post-acute COVID symptoms are highly prevalent in this population (20–23).
The association between acute COVID-19, long COVID, and SOT is multifaceted, as patients with severe COVID-19 may require organ transplants (24, 25), and SOT recipients may be more susceptible to morbidity and mortality in both the acute and post-acute phases of COVID-19. This complex temporal relationship is further muddled by the overlap between long COVID symptoms and conditions associated with SOT. This investigation evaluated graft failure and mortality among SOT recipients diagnosed with COVID-19 at a large, urban transplant center in Houston, Texas, USA.
2 Materials and methods
A retrospective, registry-based chart review was conducted investigating long COVID as a risk factor for all-cause mortality and graft failure among solid organ transplant (SOT) recipients diagnosed with COVID-19 in a large metropolitan healthcare system in Houston, Texas, USA. Electronic health record data and United Network for Organ Sharing (UNOS) transplant tracking data were collected from consecutive SOT recipients who received a diagnostic SARS-CoV-2 test between 1 March 2020 and 15 December 2024. The UNOS system, which collects active follow-up data from all patients transplanted within this healthcare system, is the most complete death and graft failure dataset available; patients lost to UNOS are considered lost to follow-up and censored or excluded as appropriate. An additional reference population of patients who received SOT within the same healthcare system but did not have a reported COVID-19 episode during the study period was analyzed using the site-specific UNOS dataset. Patients who received only bone marrow, corneal, or stem cell transplants and those who received only autograft transplants were excluded from all analyses. The date of transplant for patients transplanted before the study period was recorded as the date of the most recently transplanted organ still active at the beginning of the study period, 1 March 2020. For patients who received their first eligible transplant during the study period, the first transplant date was used. Each patient contributed only one transplant episode; re-transplants were not considered in this analysis. Patients who were no longer being followed by UNOS at the study start and who did not receive any subsequent transplants within the study period were excluded from all analyses.
2.1 Study exposures
The primary exposure was long COVID status determined by the presence of the ICD-10 code U09.9, which was initiated on 1 October 2021 (26). Centers for Disease Control and Prevention (CDC) defines long COVID as “a chronic condition that occurs after SARS-CoV-2 infection and is present for at least 3 months” (27). Demographic and clinical data were collected via the COVID-19 Surveillance and Outcomes Registry (CURATOR), a COVID-19-specific electronic health records (EHR) research, surveillance, and analysis project (28). All-cause hospitalization and intensive care admissions within 30 days of COVID-19 diagnosis were recorded. SOT details, including date of transplant, organ, donor type (deceased vs. living), and dates of follow-up, were retrieved from the UNOS dataset. Clinical history was characterized using diagnosis codes (ICD-10); the Charlson comorbidity index was additionally calculated as a measure of overall comorbidity burden (29–31). Patients were classified as COVID-19 cases if they received a positive diagnostic result from a SARS-CoV-2 RNA polymerase chain reaction (PCR) assay or a viral antigen assay at Houston Methodist during the study period. COVID-19 case status was recorded on the date of the first reported positive SARS-CoV-2 result. The date of the first recorded COVID-19 episode was categorized according to waves in COVID-19 incidence across Texas to reflect local epidemic dynamics and approximate exposure across variants (32). The area deprivation index (ADI), which measures relative deprivation between all census block groups by state (33, 34), was calculated from the geocoded patient-provided home addresses at the time of the first COVID-19 episode. We were not able to include COVID-19 vaccination status in this analysis due to poor data capture. Transplant patients in the study setting became eligible for COVID-19 mRNA vaccines in December 2020, and transplant-specific vaccination programs utilizing the NT162b2 (Pfizer-BioNTech) or the mRNA-1273 (Moderna) began in January 2021. The specific vaccine each patient received was based on health care and public health procurement.
2.2 Outcomes
A composite outcome of all-cause mortality or graft failure was the primary endpoint; the date of the first recorded event was used as the outcome date. Patients were considered lost to follow-up if they were no longer being followed by UNOS for any reason other than death or graft failure. The primary cause of death was extracted from the UNOS dataset.
2.3 Analysis
The temporal relationships between COVID-19 episodes, long COVID diagnoses, and transplants in this cohort were complex; to facilitate analyses, sub-cohorts were formed according to the temporal relationship between patients' first recorded COVID-19 episodes and their transplant date. The four sub-cohorts (Figure 1) are defined as follows: (1) patients who were diagnosed with long COVID before transplant; (2) patients whose first COVID-19 episode was recorded >30 days before transplant and who did not have a long COVID diagnosis recorded before transplant; (3) patients whose first COVID-19 episode was recorded within 30 days +/− of transplant; and (4) patients whose first COVID-19 episode was recorded > 30 days posttransplant. Patients were divided according to their long COVID status at the time of transplant to preserve the temporal relationship between the exposure (long COVID) and the outcome (graft failure or mortality). Further separation by COVID-19 status at the time of transplant was intended to segregate the competing risks of death due to acute COVID-19, acute transplant complications, and other causes in this highly comorbid population. Due to small cell values for the primary exposure, long COVID diagnoses, within each sub-cohort, additional statistical analyses such as multivariable logistic regression or Cox proportional hazard models incorporating time-varying exposure were not possible.
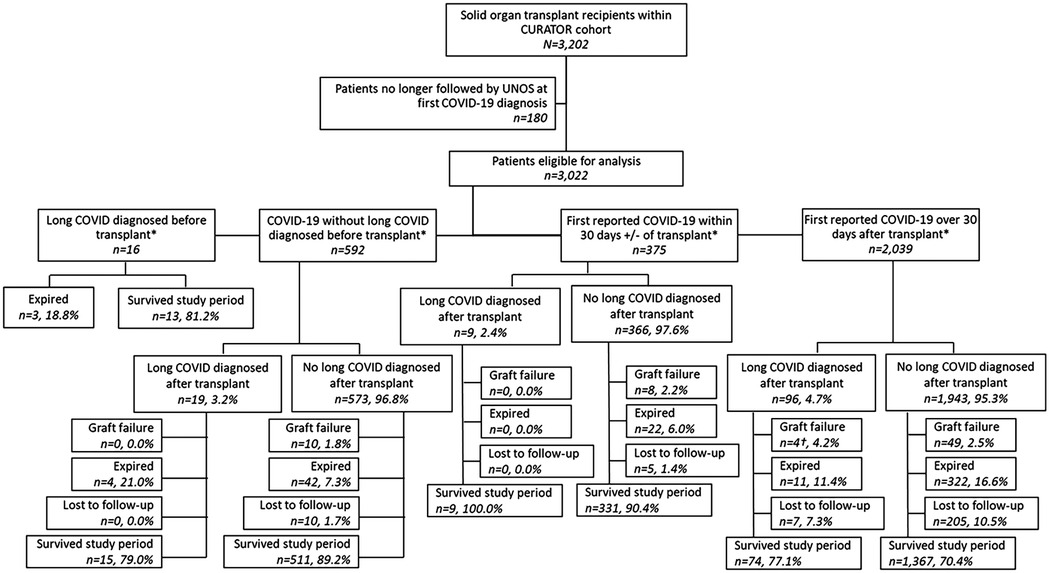
Figure 1. Study flow chart. *Transplant date recorded as date of most recent transplant. †Includes one patient diagnosed with long COVID after experiencing graft failure.
2.4 Post-COVID-19 transplant recipients
This sub-cohort consisted of patients whose first COVID-19 episode was recorded <30 days before transplant. For descriptive analyses, the observation window began at the date of transplant and ended at either 1 year (Outcome A) or 2 years (Outcome B). The primary exposure was long COVID diagnosed before the transplant date. Patients who were not followed for the entire observation window due to study end (15 December 2024) or loss to follow-up were excluded from descriptive analyses. For Kaplan–Meier analyses, time zero was the date of transplant, and composite events were recorded as the date of death or graft failure; patients were right-censored at study end or date of loss to follow-up.
2.5 COVID-19 within 30 days of transplant
This sub-cohort consists of patients whose first COVID-19 episode was recorded within 30 days plus or minus the transplant date. For descriptive analyses, the observation window began at the date of transplant and ended at either 90 days (Outcome A) or 1 year (Outcome B). The 90-day observation window was chosen to capture the risk of poor outcomes associated with acute COVID-19. Patients who received transplants within 90 days (Outcome A) or 1 year (Outcome B) of the study end date and those lost to follow-up were excluded from descriptive analyses. In this analysis of the acute COVID/transplant period, long COVID was not included. For Kaplan–Meier analyses, time zero was the date of transplant, and composite events were recorded as the date of death or graft failure; patients were right-censored at study end or date of loss to follow-up.
2.6 Post-SOT COVID-19
This sub-cohort consists of patients whose first COVID-19 episode was recorded <30 days after their transplant date. Two descriptive analyses were conducted in this sub-cohort, to differentiate between risk in the acute COVID-19 infection period (0–90 days post diagnosis; Outcome A) and risk in the post-acute period (6–18 months post period; Outcome B). For descriptive analyses of Outcome A, the observation window began at the date of the first recorded COVID-19 laboratory test positive and ended at either 90 days or at death/graft failure. Patients who were not followed for the entire observation window due to study end or loss to follow-up were excluded from descriptive analyses. In this analysis of the acute COVID/transplant period, long COVID was not included. For Kaplan–Meier analyses, time zero was the date of the first recorded COVID-19 laboratory test positive, and composite events were recorded as the date of death or graft failure; patients were right-censored at study end or date of loss to follow-up.
For descriptive analyses of Outcome B, the observation window began at 6 months (180 days) after the date of the first recorded COVID-19 laboratory test positive and ended at 18 months (545 days). The primary exposure was long COVID diagnosed in the 6 months following initial COVID-19 diagnosis. Patients who expired or experienced graft failure in the 6 months following COVID-19 diagnosis were excluded from descriptive analyses. Patients who were not followed for the entire observation window due to study end or loss to follow-up were excluded from descriptive analyses. Patients with a first recorded COVID-19 diagnosis date before 1 April 2021 were excluded, as they could not have received a long COVID diagnosis prior to the observation period.
For all descriptive analyses, differences across exposure groups were compared using Fisher's exact tests (categorical variables) or Kruskal–Wallis tests (continuous variables). All analyses were performed on Stata SE version 17.0 (StataCorp LLC, College Station, TX, USA). This retrospective registry-based study was approved by the Houston Methodist Institutional Review Board (PRO00025320) and granted a waiver of informed consent.
3 Results
3.1 Study population
The total patient cohort (n = 3,202) with a history of SOT had been diagnosed with COVID-19 at the Houston Methodist Hospital system between 1 March 2020 and 15 December 2024 (Figure 1). Of these, 3,022 (94%, 3,022/3,202) were still being followed by UNOS at the time of their first COVID-19 diagnosis and were eligible for analysis. Within the study population, 608 patients were diagnosed with COVID-19, prior to their most recent transplant. Thirty-five (6%, 35/608) of these patients were further diagnosed with long COVID: 16 (46%, 16/35) had long COVID before their transplant, and 19 (54%, 19/35) were diagnosed after transplantation. An additional 375 patients' first recorded COVID-19 diagnoses occurred within 30 days plus or minus their transplant date, of whom 9 (2%, 9/375) were eventually diagnosed with long COVID. Finally, 2,039 patients were first diagnosed with COVID-19 >30 days after receiving SOT, of whom 96 (5%, 96/2,039) received a long COVID diagnosis. Histograms depict the first recorded COVID-19 diagnosis and the first recorded long COVID diagnosis by date (Figure 2).
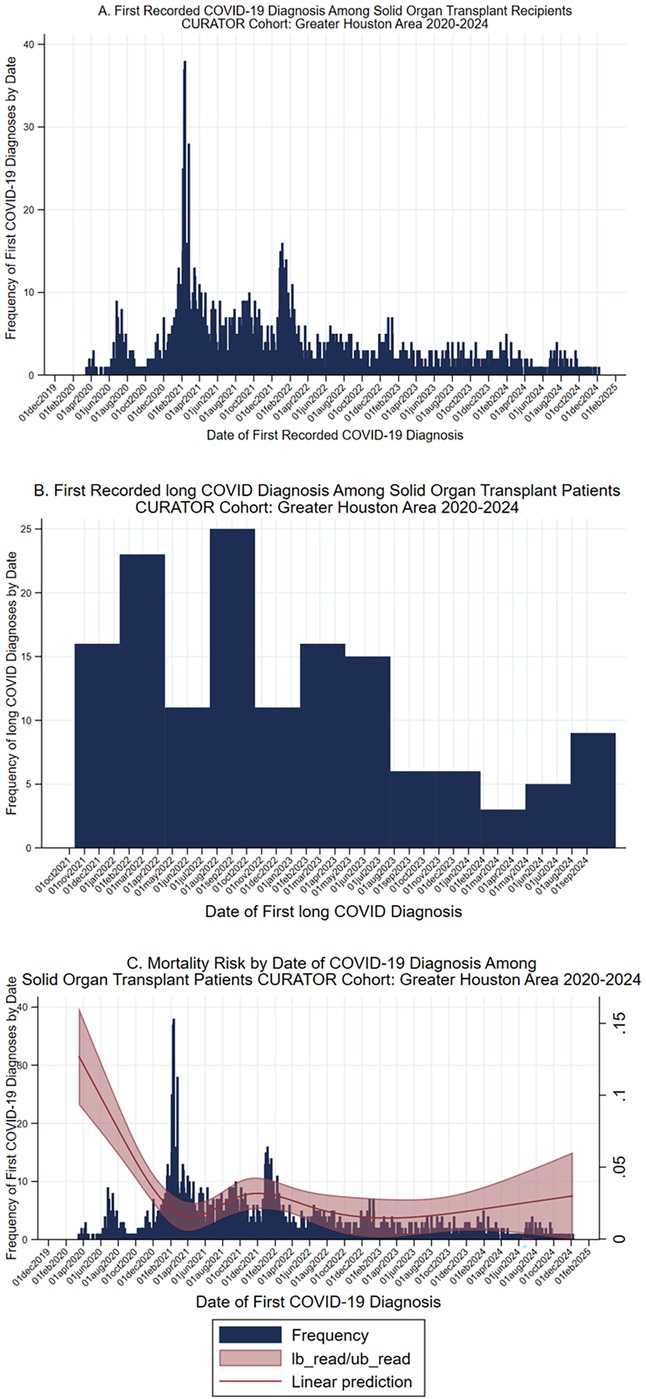
Figure 2. COVID-19, long COVID, and mortality risk over time. (A) Histogram, date of first recorded COVID-19 diagnosis among solid organ transplant recipients within the CURATOR cohort, 2020–2024. (B) First recorded long COVID diagnosis among solid organ transplant recipients within the CURATOR cohort, 2020–2024. Long COVID diagnosis determined by the presence of the ICD-10 code U09.9, which was instantiated on 1 October 2021. (C) Histogram, date of first recorded COVID-19 diagnosis among solid organ transplant recipients within the CURATOR cohort, 2020–2024, with natural spline of mortality risk in the 30 days post first COVID-19 diagnosis. CI, Confidence interval.
In total, 443 (14%, 443/3,202) of the patients expired during the study period, 202 (6%, 202/3,202) were diagnosed with graft failure, and 272 (9%, 272/3,202) were lost to follow-up (Table 1). Of the 202 graft failure patients, 36 (18%, 36/202) eventually expired. The overall proportion of patients who died or experienced graft failure did not vary by long COVID status. Among patients who were not diagnosed with long COVID, 12.5% (218/1,738) died and 2.8% (49/1,738) experienced graft failure, while among patients who were diagnosed with long COVID, 11.7% (11/94) died and 4.3% (4/94) experienced graft failure. The most common cause of death was an infectious disease (n = 98, 22%), followed by cardiovascular disease (n = 47, 11%; Table 2). Notably, 83 (19%, 83/443) deaths were within 30 days of the patients' first recorded COVID-19 diagnosis.
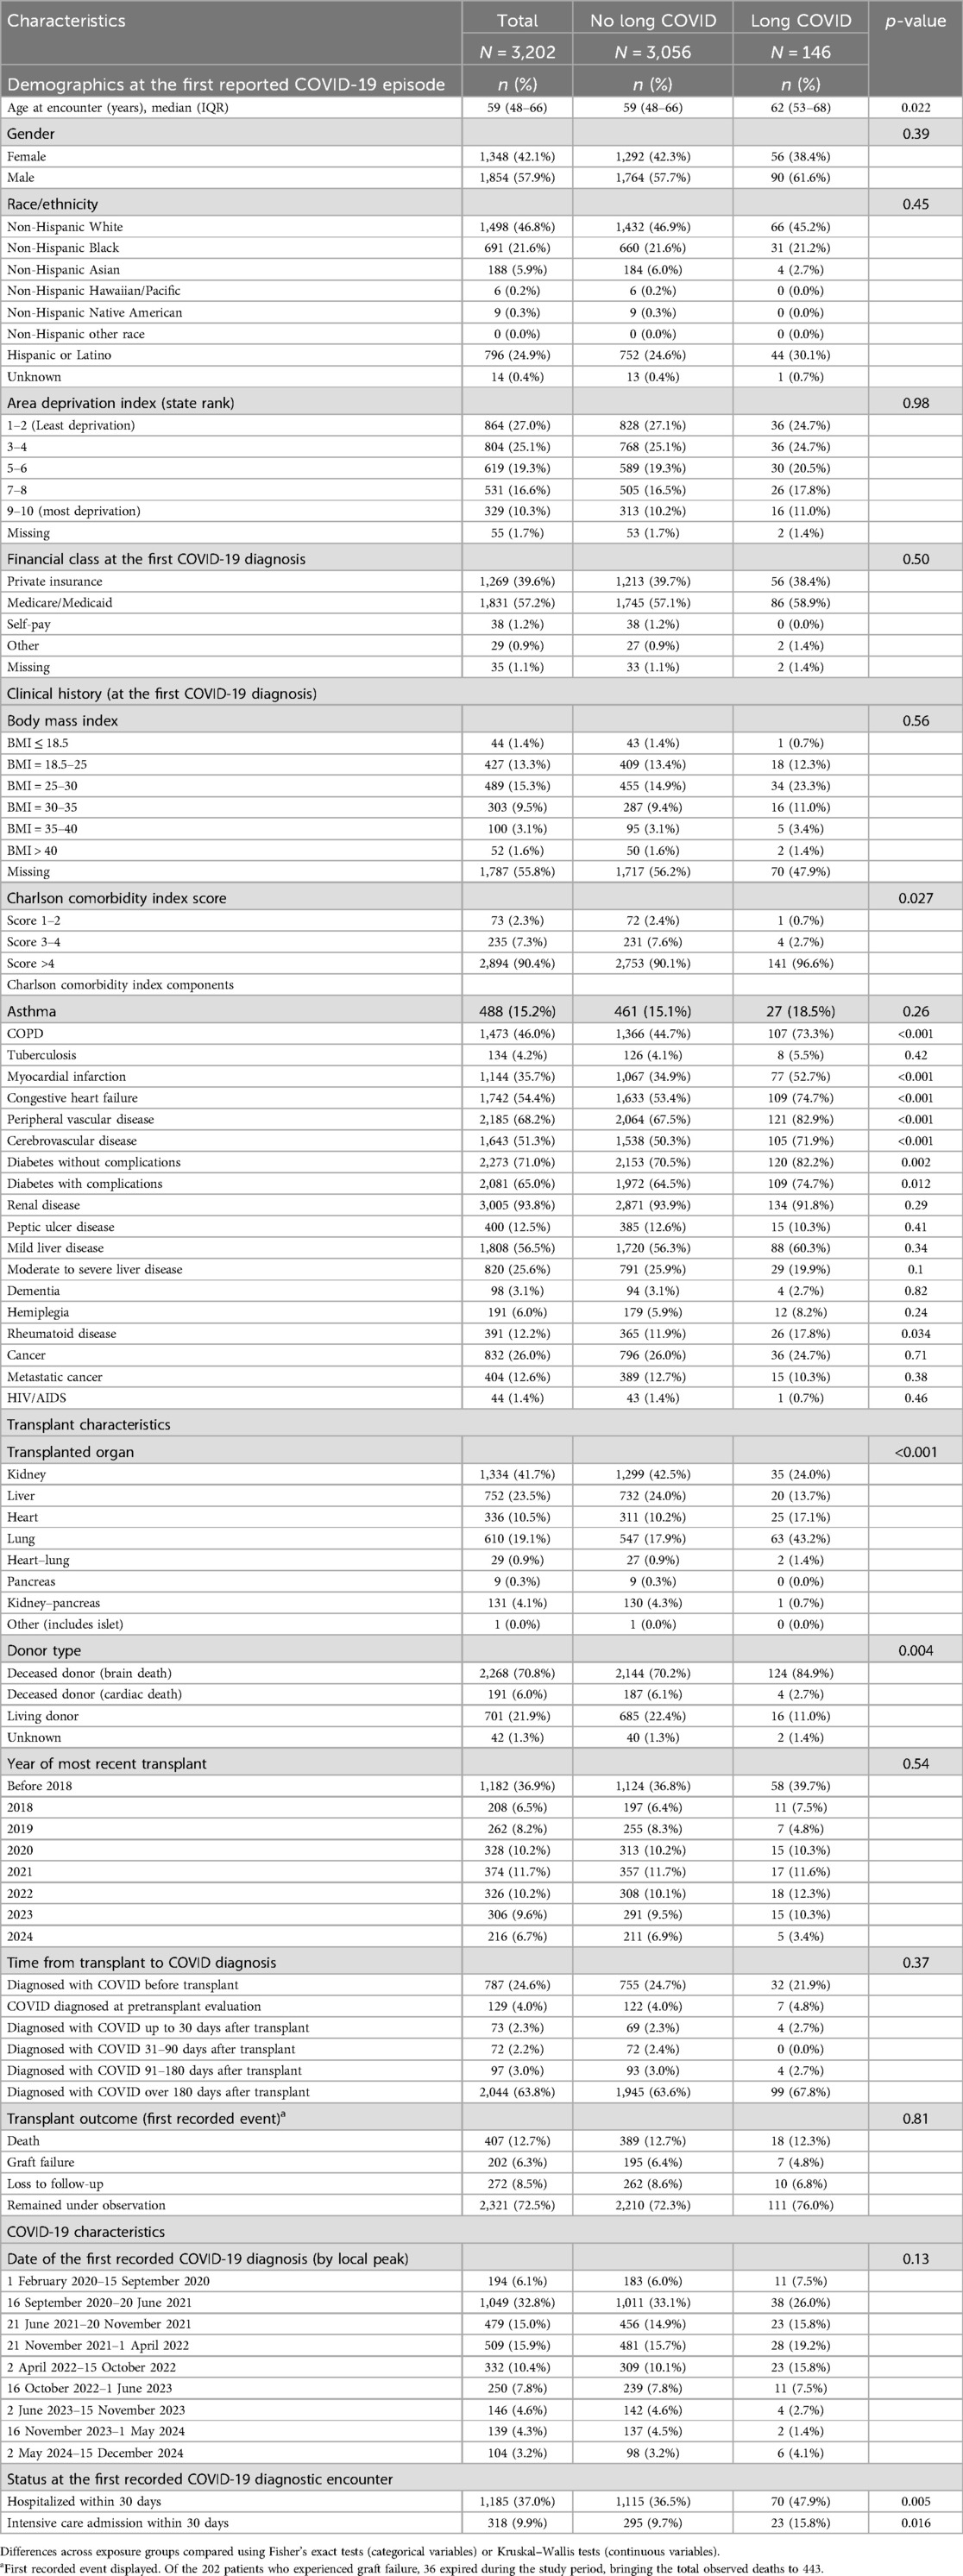
Table 1. Demographics and clinical characteristics of solid organ transplant recipients diagnosed with COVID-19 by long COVID status.
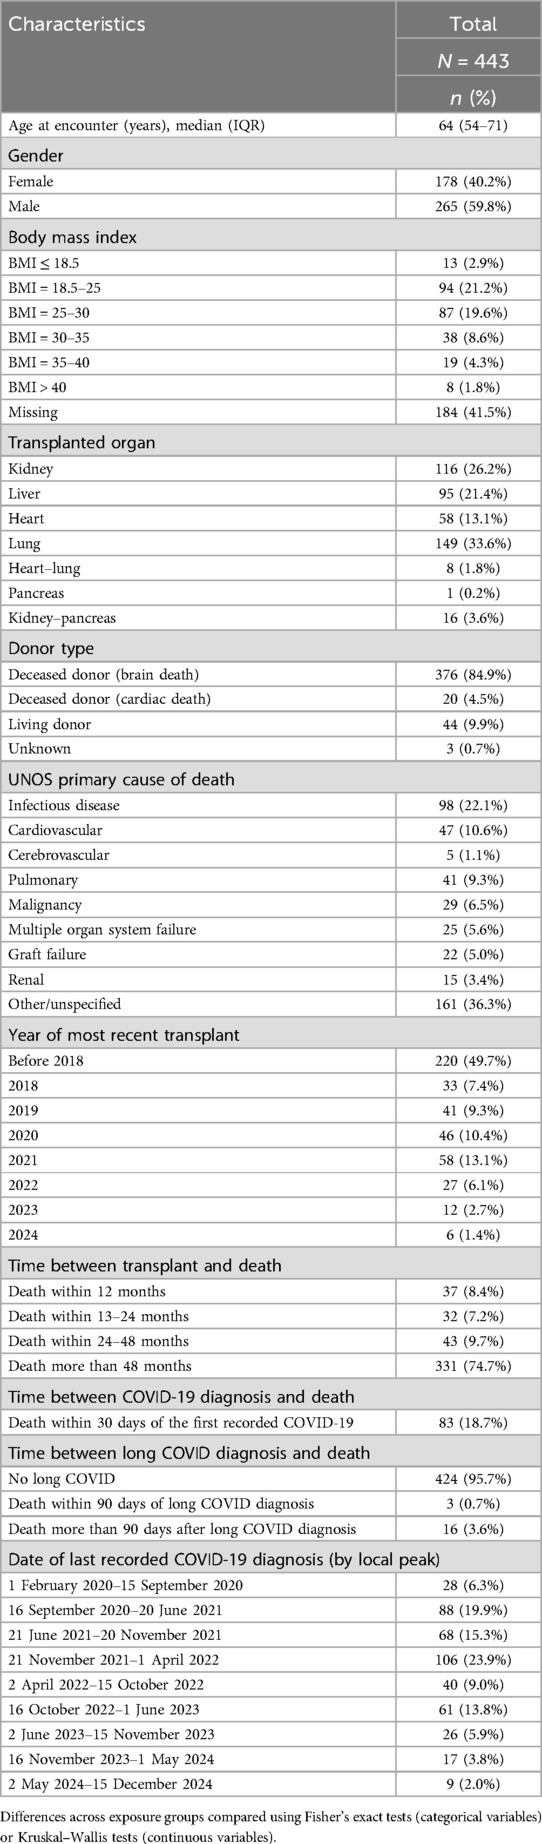
Table 2. Characteristics of deceased solid organ transplant recipients diagnosed with COVID-19.
3.2 Long COVID
Overall, patients who were diagnosed with long COVID were older, had an increased comorbidity burden, and were more likely to be lung, heart, or heart–lung recipients compared with those who were not diagnosed with long COVID (Table 1). Patients with long COVID were additionally more likely to have chronic obstructive pulmonary disease, a history of myocardial infarction, congestive heart failure, peripheral vascular disease, cerebrovascular disease, diabetes, and rheumatoid disease than those without long COVID diagnoses. Patients who were hospitalized within 30 days of their first recorded COVID-19 episode were additionally more likely to receive a long COVID diagnosis. Of note, among the 16 patients who received transplants after being diagnosed with long COVID, 14 (88%, 14/16) were lung transplant recipients.
To explore factors associated with long COVID diagnosed after transplant, SOT recipients who survived at least 90 days following their first COVID-19 episode were evaluated (Table 3). A parallel analysis, presented in Supplementary Table S1, is limited to patients diagnosed with COVID-19 between October 2021 and August 2024, since long COVID was not recognized as an ICD-10 diagnosis code until 1 October 2021 (27). The clinical risk factors associated with long COVID in this population of COVID-19 survivors were similar to the overall cohort (Table 1), with notable exceptions: liver patients were less likely to be diagnosed with long COVID, and rheumatoid disease was not significantly associated with long COVID diagnosis.
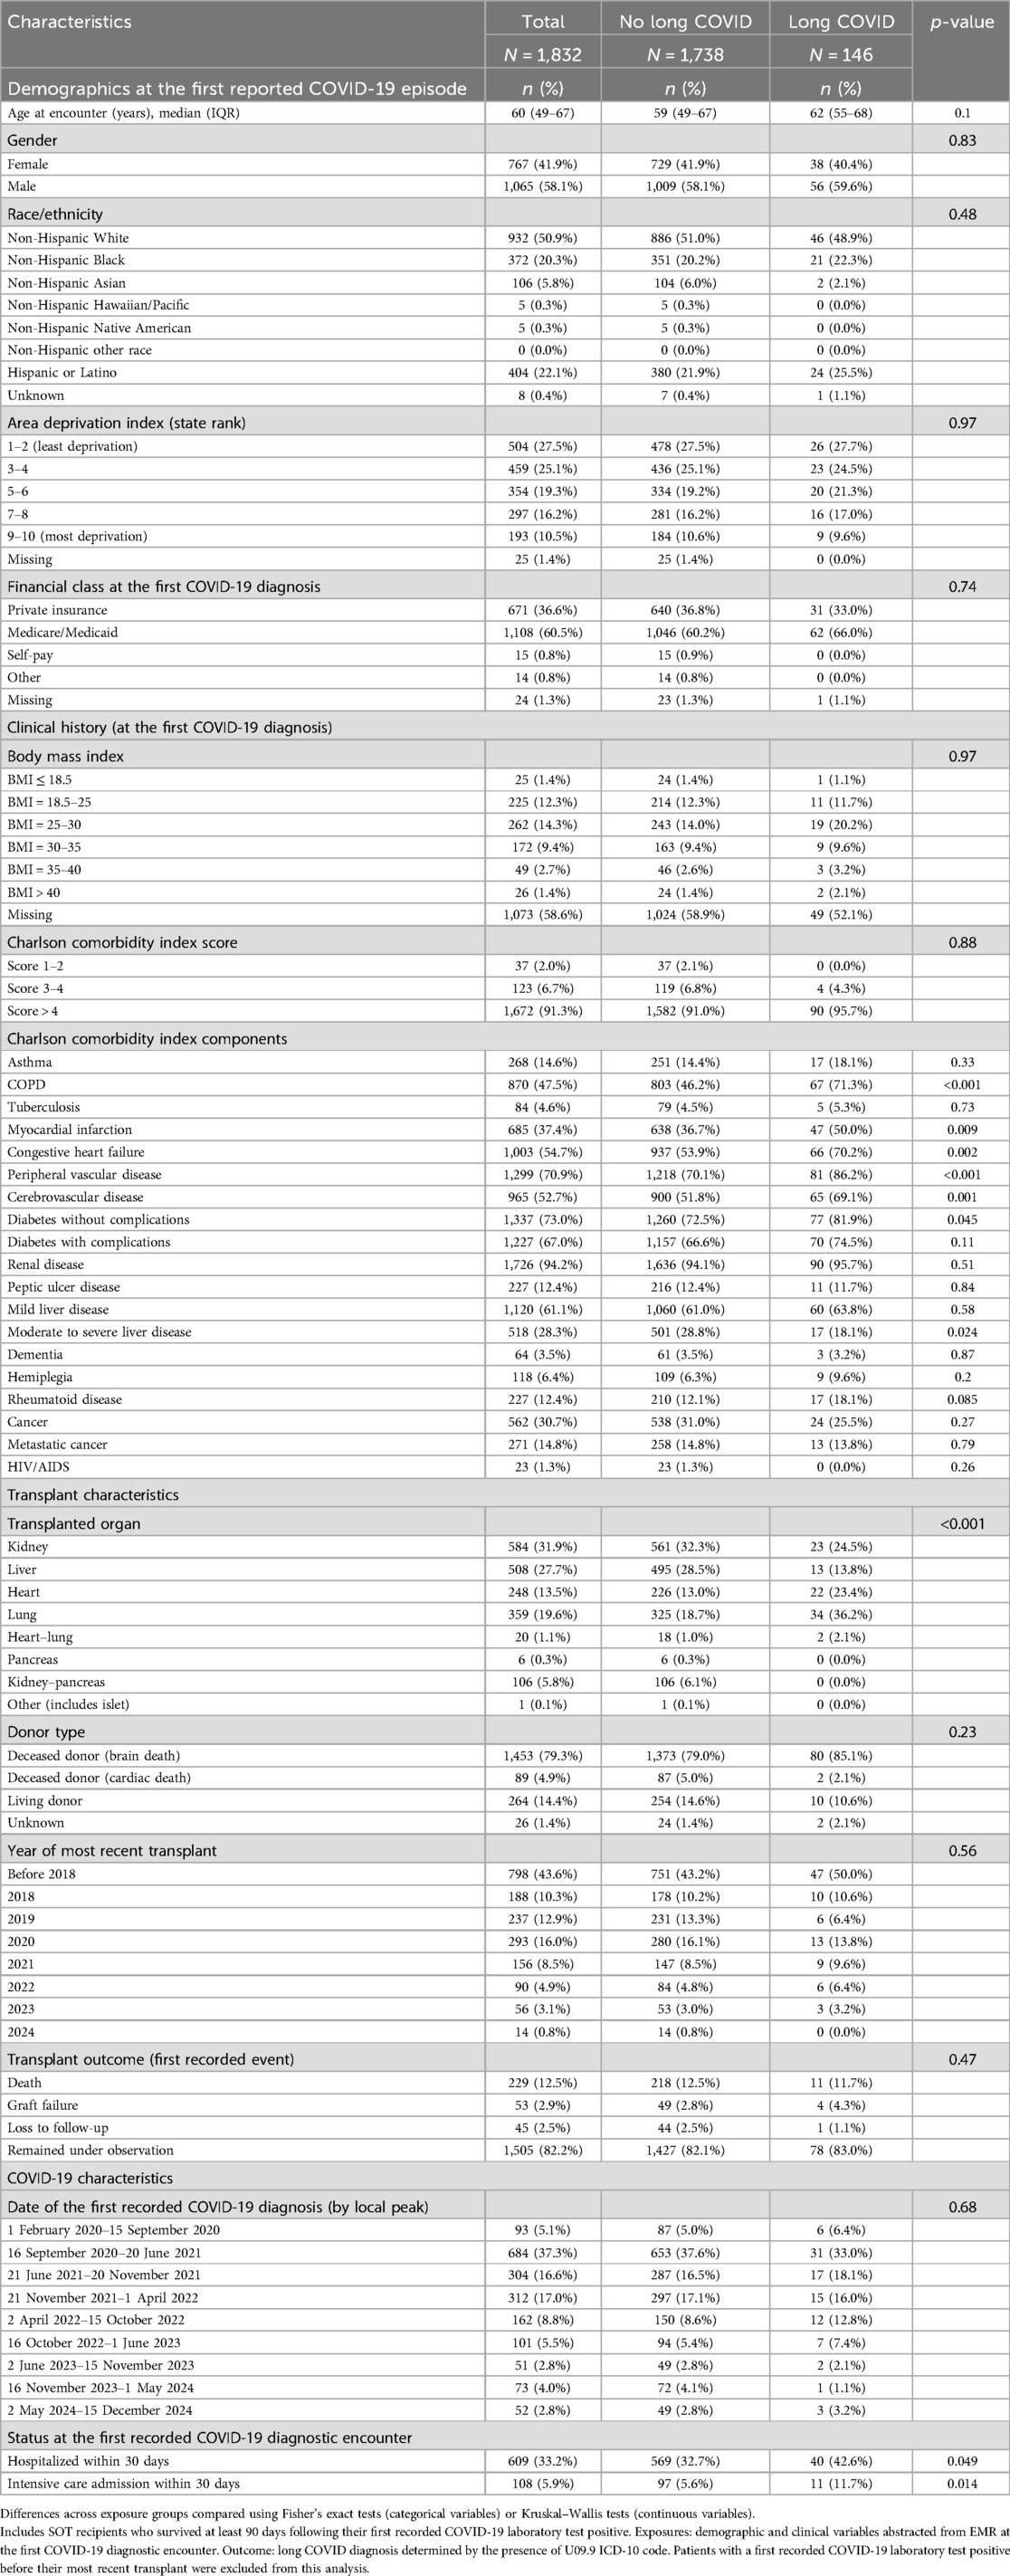
Table 3. Ninety-day COVID survivor solid organ transplant recipients by long COVID status, 2020–2024.
3.3 Post-COVID-19 transplant recipients
Table 4 compares the composite outcome of death or graft failure at 1 or 2 years posttransplant among patients whose first COVID-19 episode was recorded >30 days before transplant (1 year, N = 421, 25 events; 2 years, N = 261, 33 events). While being diagnosed with long COVID before transplant was not associated with the composite outcome (1-year outcomes, p = 0.58; 2-year outcomes, p = 0.44), a history of myocardial infarction, congestive heart failure, and peptic ulcer disease were associated with 1-year mortality/graft failure while rheumatoid disease and metastatic cancer were associated with 2-year mortality/graft failure.
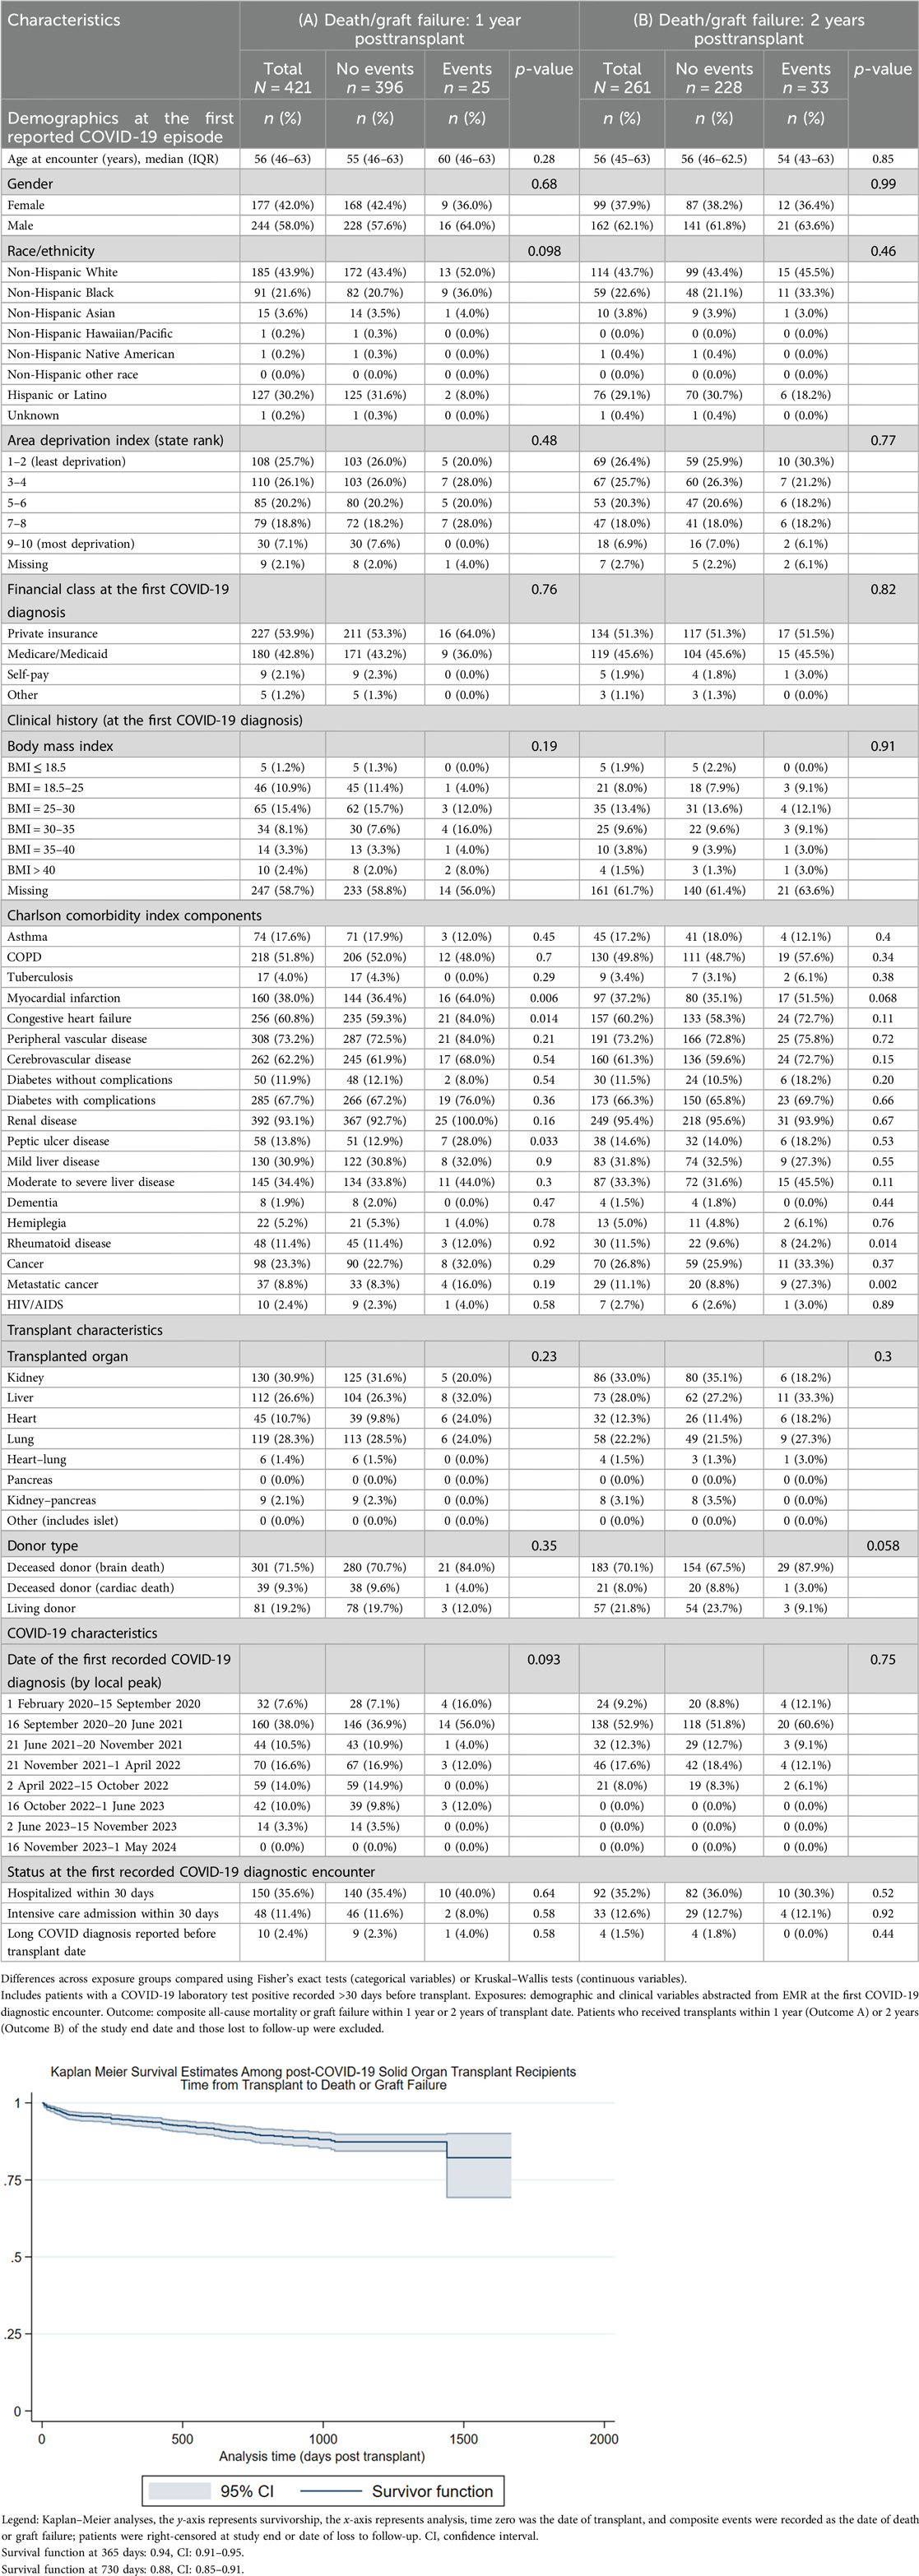
Table 4. One- and 2-year death/graft failure among post-COVID-19 solid organ transplant recipients.
3.4 COVID-19 within 30 days of transplant
Table 5 compares the composite outcome of death or graft failure at 90 days or 1 year posttransplant among patients whose first COVID-19 episode was recorded within 30 days plus or minus the transplant date (90 days, N = 369, 14 events; 1 year, N = 326, 20 events). Diabetes was the only risk factor associated with the 90-day composite outcome, while myocardial infarction history and being a liver patient were associated with 1-year death/graft failure.
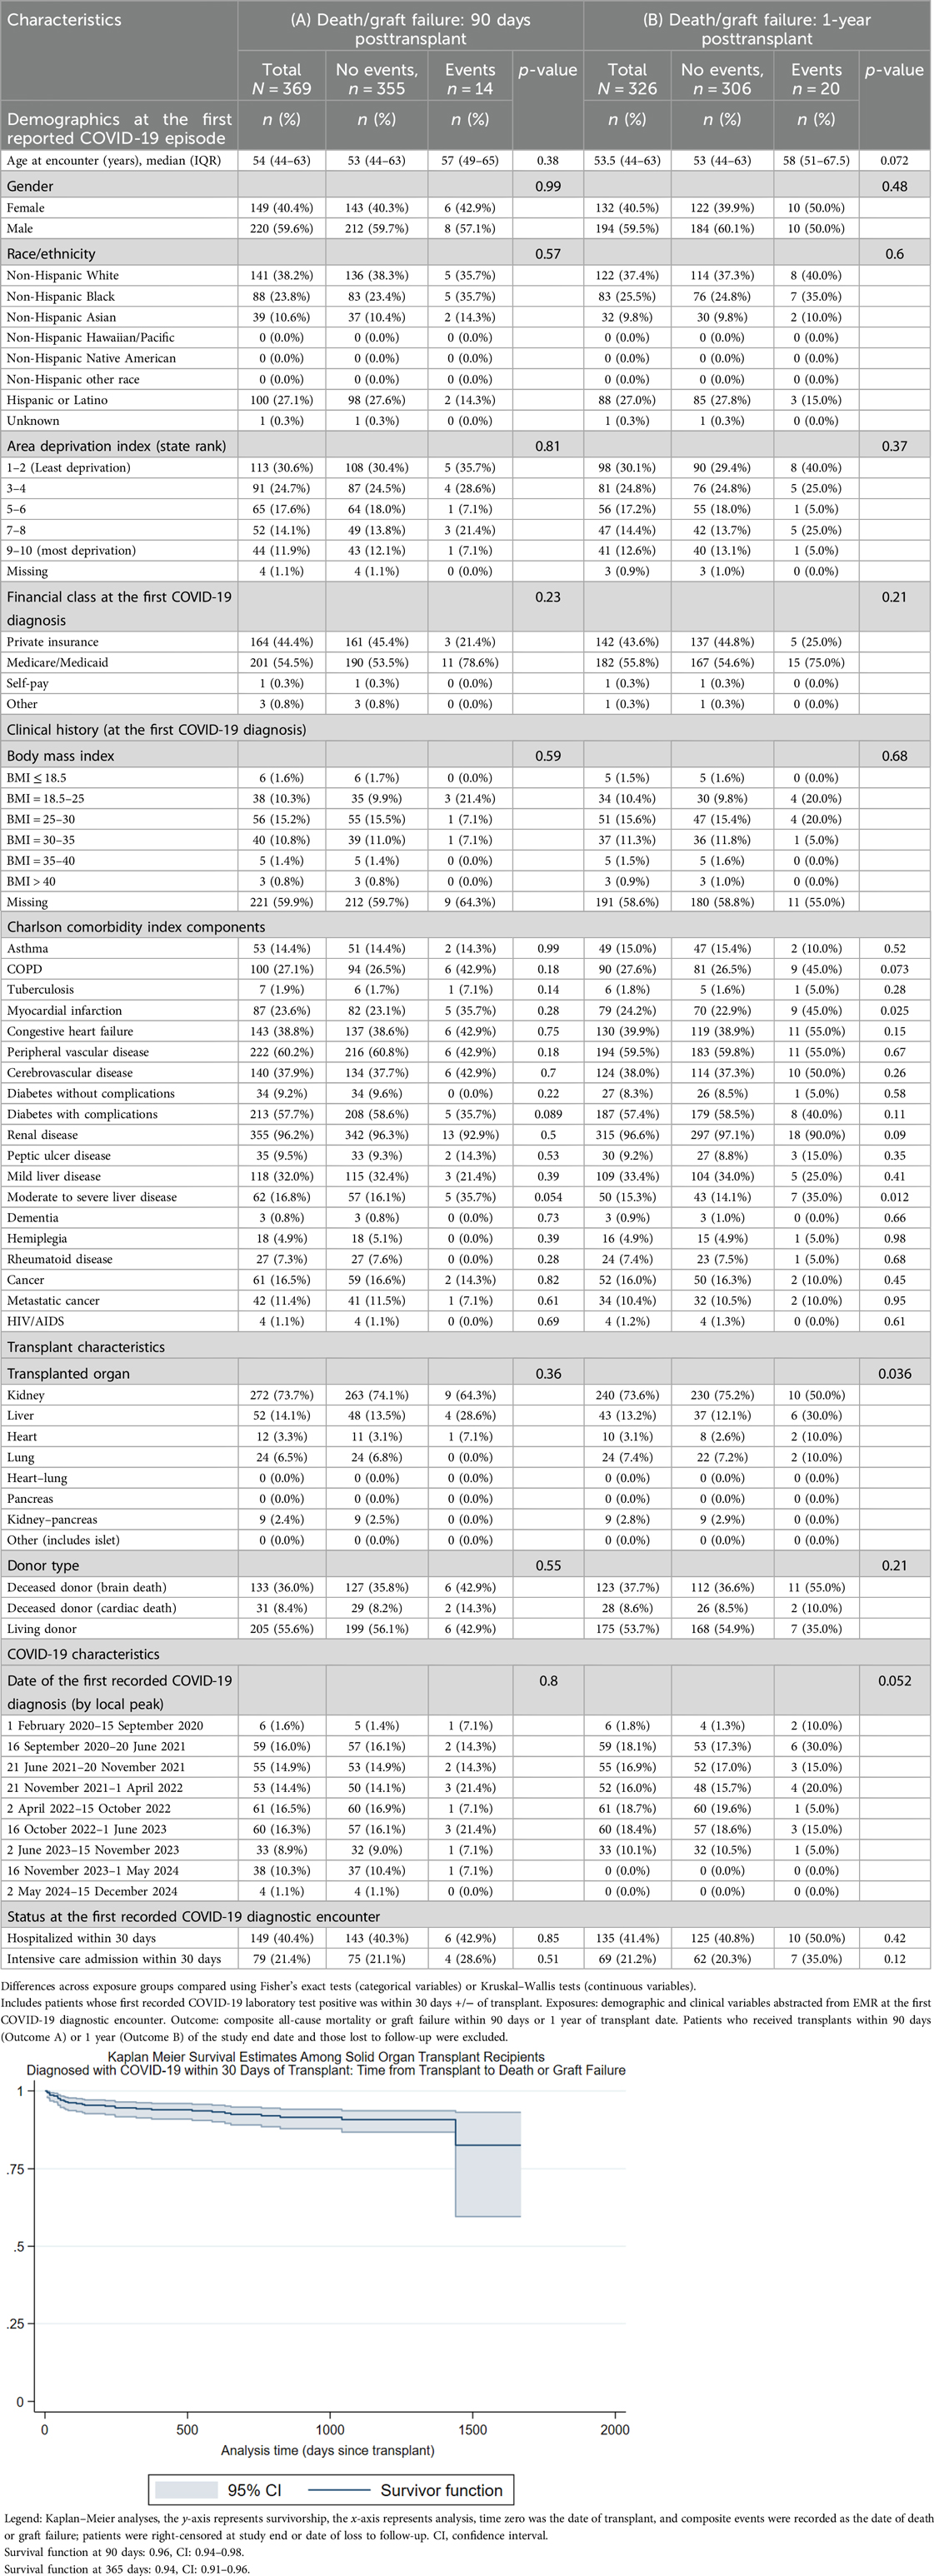
Table 5. Ninety-day and 1-year death/graft failure among solid organ transplant recipients diagnosed with COVID-19 within 30 days of transplant.
3.5 Post-SOT COVID-19
Table 6 compares the composite outcome of death or graft failure post COVID-19 diagnosis among patients whose first COVID-19 episode was recorded >30 days after their transplant date (90 days post COVID-19, N = 2,029, 122 events; 6–18 months post COVID-19, N = 1,065, 73 events). Increasing age, Medicare/Medicaid payor, myocardial infarction history, congestive heart failure, peripheral vascular disease, severe diabetes, renal disease, COVID-19 diagnosed in the first wave (1 February 2020 to 15 September 2020), and hospitalization within 30 days of COVID-19 diagnosis were associated with composite outcomes in the 90 days post COVID-19 diagnosis. Among patients who survived at least 6 months post initial COVID-19 diagnosis, increasing age, chronic obstructive pulmonary disease, myocardial infarction history, congestive heart failure, peripheral vascular disease, cerebrovascular disease, and severe diabetes were associated with death or graft failure in the 6–18 months post COVID-19. Lung transplant, COVID-19 diagnosed in the period 16 October 2022 to 1 June 2023, and hospitalization within 30 days of COVID-19 diagnosis were additionally associated with composite outcomes in the 6–18 months post COVID-19 diagnosis. Long COVID was not associated with death/graft failure, 6–18 months post COVID-19.
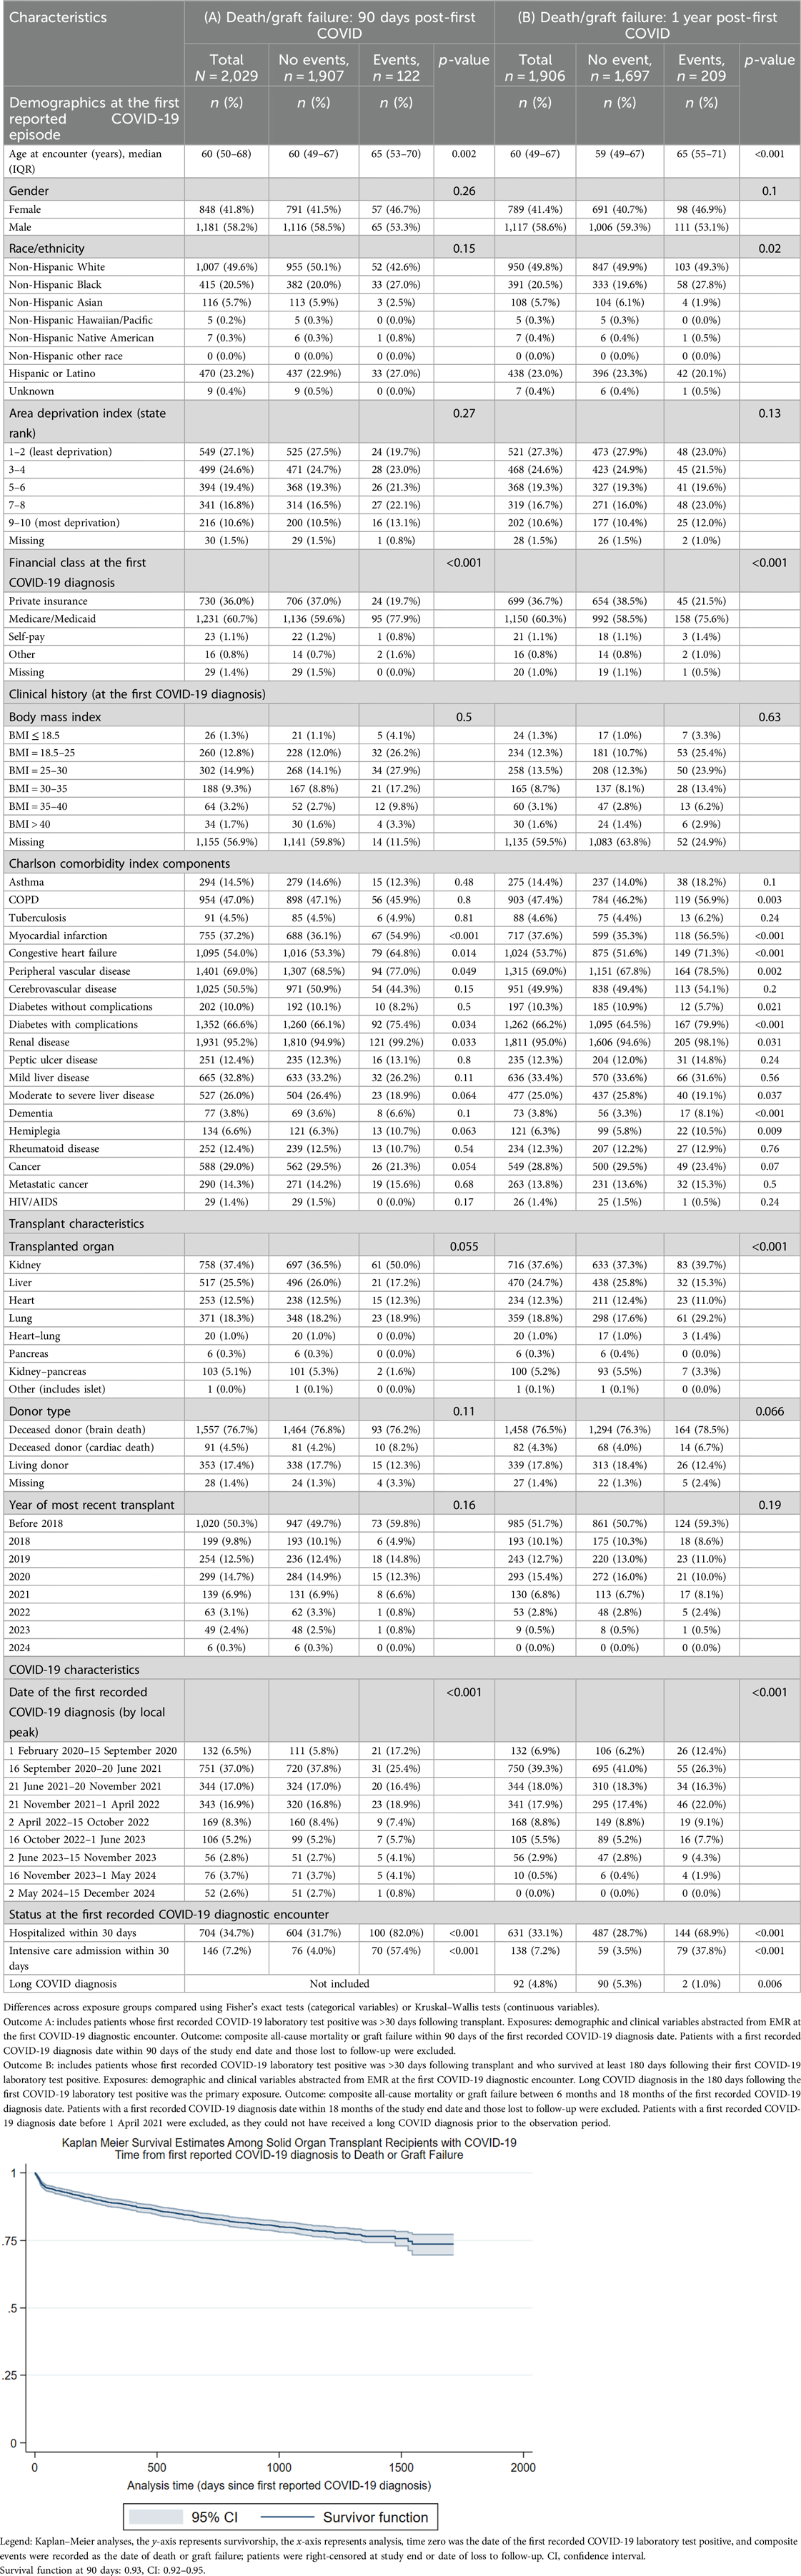
Table 6. Ninety-day and 1-year post COVID-19 diagnosis death/graft failure among solid organ transplant recipients diagnosed with COVID-19 >30 days posttransplant.
3.6 Supplementary analyses
In supplementary analyses, patients who received SOT between 2020 and 2024 but who did not have a recorded COVID-19 diagnosis were examined as a baseline population (Supplementary Table S2). Deceased donor type vs. brain death donor type and lung transplant vs. other organ transplant were associated with the 1-year death/graft failure composite outcome (N = 1,082, 94 events). Characteristics of SOT recipients diagnosed with long COVID are presented in Supplementary Table S3.
4 Discussion
Our findings add to the growing body of literature demonstrating the multifaceted risk profile of both acute COVID-19 and long COVID among solid organ transplant recipients. We identified distinct subpopulations of patients who had COVID-19 before their transplants, those whose COVID-19 occurred around the time of their transplant, and those who contracted COVID-19 after receiving SOT; these sub-cohorts exhibit discrete clinical trajectories and provide specific insights for future epidemiologic studies. Among patients diagnosed with COVID-19 before their transplants, overall mortality was ∼8%, but mortality among those who were eventually diagnosed with long COVID was 20%, suggesting that poor recovery from COVID-19 may impact subsequent transplant outcomes (Figure 1). COVID-19 in the immediate transplant period, which was likely captured at a pretransplant screening or during recovery, did not appear to increase baseline mortality. However, in the group of patients who were diagnosed with COVID-19 posttransplant, the mortality rate due to acute COVID-19 was high (5.4% expired within 90 days of COVID-19 diagnosis, 110/2,029) and associated with an increased comorbidity burden, consistent with extant literature (12–14). The role of long COVID in extended morbidity and mortality in this population is more difficult to interpret, as acute COVID-19 and transplant complications act as competing risks. Notably, long COVID diagnoses were most common among lung transplant recipients: 40% (49/122) of patients diagnosed with long COVID after transplant had received lung transplants. Long COVID may act as a mediator or moderator of mortality risk in this population with increased vulnerability to infectious disease and high comorbidity burden (35).
This investigation was limited to descriptive analyses of clinical and demographic risk factors, so causal relationships cannot be demonstrated. However, the findings are relevant in shaping future investigations into long COVID as both a risk factor and an outcome among solid organ transplant recipients. As with all electronic health record-based studies, some clinical parameters were not available in our dataset, including vaccination history, COVID-19 episodes undetected by the health system, and detailed pharmacology records. Our primary exposure was long COVID diagnosis, determined by the diagnostic code U09.9, which was introduced by the World Health Organization (WHO) in October 2021 to specifically identify long COVID cases; some patients who exhibited symptoms associated with long COVID before the fall of 2021 may therefore have been misclassified as long COVID-negative. The diagnosis of long COVID may be influenced by multiple factors, including access to healthcare, clinical history, and specific symptom presentation. We were not able to independently ascertain long COVID status outside of the presence or absence of the diagnostic code, and indeed, the most appropriate strategy to determine long COVID status would include prospective, longitudinal, active follow-up via survey or study-specific clinical encounters. However, the population of SOT recipients is universally subject to extended clinical follow-up as part of their posttransplant care, which likely reduced the proportion of unobserved long COVID symptomology in this cohort. An additional limitation was our inability to incorporate multiple COVID-19 episodes per patient, which could have allowed us to construct composite risk profiles integrating SARS-CoV-2 variants of concern and recurrent vs. persistent viral infections. Missingness in BMI was high; however, given the extensive clinical follow-up in SOT recipients, this missingness is most likely due to challenges in data extraction, rather than systematic bias, though poor coverage may limit interpretation of this result. Our study's strengths are a robust sample size, a diverse, heterogeneous population, and significant longitudinal follow-up of SOT patients. This investigation was a single-center, registry-based chart review, so patients could have unobserved COVID-19 or long COVID diagnoses from other health systems; however, the SOT recipient population is closely monitored by the transplant team, including SARS-CoV-2 testing for surveillance purposes, regardless of symptoms. Importantly, the outcomes of death and graft failure were abstracted directly from the national UNOS registry, mitigating information loss between health systems.
The observed differences between patients diagnosed with COVID-19 and long COVID before and after transplant warrant additional studies as the proportion of people with some SARS-CoV-2 infection history approaches 90% (36). Future investigations may prioritize longitudinal follow-up of long COVID patients diagnosed before or after transplant to determine specific etiologies of long-term morbidity and mortality.
Data availability statement
Data cannot be shared publicly because of patient confidentiality and intellectual property concerns as imposed by the Houston Methodist Research Institute. Access to de-identified data can be made to the Director of the Center for Health Data Science and Analytics at Houston Methodist Research Institute (chdsa@houstonmethodist.org). Each request will be evaluated on a case-by-case basis in line with institutional policies.
Ethics statement
The studies involving humans were approved by the Houston Methodist Institutional Review Board (PRO00025320) and granted a waiver of informed consent. The studies were conducted in accordance with the local legislation and institutional requirements. Written informed consent for participation was not required from the participants or the participants' legal guardians/next of kin in accordance with the national legislation and institutional requirements.
Author contributions
MS: Conceptualization, Writing – review & editing, Data curation, Writing – original draft, Visualization, Formal analysis. LM: Writing – review & editing, Data curation. HH: Writing – review & editing. EG: Project administration, Writing – review & editing, Supervision, Data curation, Conceptualization.
Funding
The authors declare that no financial support was received for the research and/or publication of this article.
Conflict of interest
The authors declare that the research was conducted in the absence of any commercial or financial relationships that could be construed as a potential conflict of interest.
Generative AI statement
The authors declare that no Generative AI was used in the creation of this manuscript.
Any alternative text (alt text) provided alongside figures in this article has been generated by Frontiers with the support of artificial intelligence and reasonable efforts have been made to ensure accuracy, including review by the authors wherever possible. If you identify any issues, please contact us.
Publisher's note
All claims expressed in this article are solely those of the authors and do not necessarily represent those of their affiliated organizations, or those of the publisher, the editors and the reviewers. Any product that may be evaluated in this article, or claim that may be made by its manufacturer, is not guaranteed or endorsed by the publisher.
Supplementary material
The Supplementary Material for this article can be found online at: https://www.frontiersin.org/articles/10.3389/fsurg.2025.1602167/full#supplementary-material
References
1. Van Kessel SA, Olde Hartman TC, Lucassen PL, van Jaarsveld CH. Post-acute and long-COVID-19 symptoms in patients with mild diseases: a systematic review. Fam Pract. (2022) 39(1):159–67. doi: 10.1093/fampra/cmab076
2. Lim RK, Rosentreter R, Chen Y, Mehta R, McLeod G, Wan M, et al. Quality of life, respiratory symptoms, and health care utilization 1 year following outpatient management of COVID-19: a prospective cohort study. Sci Rep. (2022) 12(1):12988. doi: 10.1038/s41598-022-17243-7
3. Proal AD, VanElzakker MB. Long COVID or post-acute sequelae of COVID-19 (PASC): an overview of biological factors that may contribute to persistent symptoms. Front Microbiol. (2021) 12:1494. doi: 10.3389/fmicb.2021.698169
4. Castanares-Zapatero D, Chalon P, Kohn L, Dauvrin M, Detollenaere J, Maertens de Noordhout C, et al. Pathophysiology and mechanism of long COVID: a comprehensive review. Ann Med. (2022) 54(1):1473–87. doi: 10.1080/07853890.2022.2076901
5. Sotoodeh Ghorbani S, Taherpour N, Bayat S, Ghajari H, Mohseni P, Hashemi Nazari SS. Epidemiologic characteristics of cases with reinfection, recurrence, and hospital readmission due to COVID-19: a systematic review and meta-analysis. J Med Virol. (2022) 94:44–53. doi: 10.1002/jmv.27281
6. Raveendran AV, Jayadevan R, Sashidharan S. Long COVID: an overview. Diabetes Metab Syndr. (2021) 15(3):869–75. doi: 10.1016/j.dsx.2021.04.007
7. Koc HC, Xiao J, Liu W, Li Y, Chen G. Long COVID and its management. Int J Biol Sci. (2022) 18(12):4768. doi: 10.7150/ijbs.75056
8. Crook H, Raza S, Nowell J, Young M, Edison P. Long covid—mechanisms, risk factors, and management. Br Med J. (2021) 374:n1648. doi: 10.1136/bmj.n1648
9. Prusinski C, Yan D, Klasova J, McVeigh KH, Shah SZ, Fermo OP, et al. Multidisciplinary management strategies for long COVID: a narrative review. Cureus. (2024) 16(5):e59478. doi: 10.7759/cureus.59478
10. Vahratian A, Saydah S, Bertolli J, Unger ER, Gregory CO. Prevalence of post–COVID-19 condition and activity-limiting post–COVID-19 condition among adults. JAMA Network Open. (2024) 7(12):e2451151. doi: 10.1001/jamanetworkopen.2024.51151
11. Sandoval MN, Mikhail JL, Fink MK, Tortolero GA, Cao T, Ramphul R, et al. Social determinants of health predict readmission following COVID-19 hospitalization: a health information exchange-based retrospective cohort study. Front Public Health. (2024) 12:1352240. doi: 10.3389/fpubh.2024.1352240
12. Sandoval M, Nguyen DT, Huang HJ, Yi SG, Ghobrial RM, Gaber AO, et al. COVID-19 mortality may be reduced among fully vaccinated solid organ transplant recipients. PLoS One. (2022) 17(12):e0279222. doi: 10.1371/journal.pone.0279222
13. Solera JT, Árbol BG, Mittal A, Hall V, Marinelli T, Bahinskaya I, et al. Longitudinal outcomes of COVID-19 in solid organ transplant recipients from 2020 to 2023. Am J Transplant. (2024) 24(7):1303–16. doi: 10.1016/j.ajt.2024.03.011
14. Yamanaga S, Shimata K, Ohfuji S, Yoshikawa M, Natori Y, Hibi T, et al. Excess mortality in COVID-19-affected solid organ transplant recipients across the pandemic. Am J Transplant. (2024) 24(8):1495–508. doi: 10.1016/j.ajt.2024.03.016
15. Inayat F, Patel P, Ali H, Afzal A, Tahir H, Chaudhry A, et al. Impact of COVID-19 on liver transplant recipients: a nationwide cohort study evaluating hospitalization, transplant rejection, and inpatient mortality. World J Transplant. (2024) 14(2):90866. doi: 10.5500/wjt.v14.i2.90866
16. Murray SM, Pose E, Wittner M, Londoño MC, Schaub G, Cook J, et al. Immune responses and clinical outcomes after COVID-19 vaccination in patients with liver disease and liver transplant recipients. J Hepatol. (2024) 80(1):109–23. doi: 10.1016/j.jhep.2023.10.009
17. Bytyci J, Ying Y, Lee LY. Immunocompromised individuals are at increased risk of COVID-19 breakthrough infection, hospitalization, and death in the post-vaccination era: a systematic review. Immun Inflamm Dis. (2024) 12(4):e1259. doi: 10.1002/iid3.1259
18. Dhand A, Okumura K, Nishida S. Severe COVID-19 in solid organ transplant recipients in the post-vaccination era: persistence in the burden of disease and in disparities of care. Transpl Infect Dis. (2024) 26(1):1. doi: 10.1111/tid.14205
19. Chen DT, Copland E, Hirst JA, Mi E, Dixon S, Coupland C, et al. Uptake, effectiveness and safety of COVID-19 vaccines in individuals at clinical risk due to immunosuppressive drug therapy or transplantation procedures: a population-based cohort study in England. BMC Med. (2024) 22(1):237. doi: 10.1186/s12916-024-03457-1
20. Morená L, Al Jurdi A, El Mouhayyar C, Verhoeff R, Alzahrani N, Kotton CN, et al. Post–acute sequelae of COVID-19 among solid organ transplant recipients: insights from the omicron period. Transplant Direct. (2024) 10(9):e1690. doi: 10.1097/TXD.0000000000001690
21. Vinson AJ, Schissel M, Anzalone AJ, Dai R, French ET, Olex AL, et al. The prevalence of postacute sequelae of coronavirus disease 2019 in solid organ transplant recipients: evaluation of risk in the National COVID Cohort Collaborative. Am J Transplant. (2024) 24(9):1675–89. doi: 10.1016/j.ajt.2024.06.001
22. Amorim CE, Cazetta GS, Cristelli MP, Requião-Moura LR, da Silva ER, Vale LP, et al. Long COVID among kidney transplant recipients appears to be attenuated during the omicron predominance. Transplantation. (2024 ) 108(4):963–9. doi: 10.1097/TP.0000000000004858
23. Bouwmans P, Malahe SR, Messchendorp AL, Vart P, Imhof C, Sanders JS, et al. Post COVID-19 condition imposes significant burden in patients with advanced chronic kidney disease: a nested case-control study. Int J Infect Dis. (2024) 142:106990. doi: 10.1016/j.ijid.2024.106990
24. Bermudez C, Bermudez F, Courtwright A, Richards T, Diamond J, Cevasco M, et al. Lung transplantation for COVID-2019 respiratory failure in the United States: outcomes 1-year posttransplant and the impact of preoperative extracorporeal membrane oxygenation support. J Thorac Cardiovasc Surg. (2024) 167(1):384–95. doi: 10.1016/j.jtcvs.2023.04.016
25. D’Cunha M, Jenkins JA, Wilson R, Farina JM, Omar A, Langlais B, et al. Lung transplantation in the United States for COVID-19 related lung disease during the pandemic. Lung. (2024) 202(5):723–37. doi: 10.1007/s00408-024-00724-z
26. Soriano JB, Murthy S, Marshall JC, Relan P, Diaz JV, WHO clinical case definition working group on post-COVID-19 condition. A clinical case definition of post-COVID-19 condition by a Delphi consensus. Lancet Infect Dis. (2022) 22(4):e102–7. doi: 10.1016/S1473-3099(21)00703-9
27. Pfaff ER, Madlock-Brown C, Baratta JM, Bhatia A, Davis H, Girvin A, et al. Coding long COVID: characterizing a new disease through an ICD-10 lens. BMC Med. (2023) 21(1):58. doi: 10.1186/s12916-023-02737-6
28. Vahidy F, Jones SL, Tano ME, Nicolas JC, Khan OA, Meeks JR, et al. Rapid response to drive COVID-19 research in a learning health care system: rationale and design of the Houston Methodist COVID-19 surveillance and outcomes registry (curator). JMIR Med Inform. (2021) 9(2):e26773. doi: 10.2196/26773
29. Charlson ME, Pompei P, Ales KL, MacKenzie CR. A new method of classifying prognostic comorbidity in longitudinal studies: development and validation. J Chronic Dis. (1987) 40:373–83. doi: 10.1016/0021-9681(87)90171-8
30. Charlson ME, Carrozzino D, Guidi J, Patierno C. Charlson comorbidity index: a critical review of clinimetric properties. Psychother Psychosom. (2022) 91:8–35. doi: 10.1159/000521288
31. Huang Y-q, Gou R, Diao Y-s, Yin Q-h, Fan W-x, Liang Y-p, et al. Charlson comorbidity index helps predict the risk of mortality for patients with type 2 diabetic nephropathy. J Zhejiang Univ Sci B. (2014) 15:58–66. doi: 10.1631/jzus.B1300109
32. Texas Department of State Health Services Center for Health Statistics. Texas COVID-19 Data. Available online at: https://www.dshs.texas.gov/coronavirus/additionaldata (Accessed December 1, 2024).
33. Kind AJ, Buckingham WR. Making neighborhood-disadvantage metrics accessible—the neighborhood atlas. N Engl J Med. (2018) 378:2456–8. doi: 10.1056/NEJMp1802313
34. University of Wisconsin School of Medicine and Public Health. Area Deprivation Index, Texas. Available online at: https://www.neighborhoodatlas.medicine.wisc.edu/ (Accessed March 3, 2023).
35. Syed U, Subramanian A, Wraith DC, Lord JM, McGee K, Ghokale K, et al. Incidence of immune-mediated inflammatory diseases following COVID-19: a matched cohort study in UK primary care. BMC Med. (2023) 21(1):363. doi: 10.1186/s12916-023-03049-5
36. Centers for Disease Control and Prevention (CDC), 2022-2023 Nationwide COVID-19 Infection-and Vaccination-Induced Antibody Seroprevalence (Blood donations). CDC COVID Data Tracker (2024). Available online at: https://covid.cdc.gov/covid-data-tracker/# nationwide-blood-donor-seroprevalence-2022 (Accessed March 20, 2025).
Keywords: COVID-19, long COVID, solid organ transplant (SOT), epidemiology, infectious diseases
Citation: Sandoval MN, Moore LW, Huang HJ and Graviss EA (2025) Long COVID risk factors and outcomes among solid organ transplant recipients: a retrospective cohort study. Front. Surg. 12:1602167. doi: 10.3389/fsurg.2025.1602167
Received: 28 March 2025; Accepted: 4 August 2025;
Published: 25 August 2025.
Edited by:
Chengliang Yang, University of British Columbia, CanadaReviewed by:
Adriana Colovai, Albert Einstein College of Medicine, United StatesPo-Yu Chiang, New York University, United States
Copyright: © 2025 Sandoval, Moore, Huang and Graviss. This is an open-access article distributed under the terms of the Creative Commons Attribution License (CC BY). The use, distribution or reproduction in other forums is permitted, provided the original author(s) and the copyright owner(s) are credited and that the original publication in this journal is cited, in accordance with accepted academic practice. No use, distribution or reproduction is permitted which does not comply with these terms.
*Correspondence: Edward A. Graviss, ZWFncmF2aXNzQGhvdXN0b25tZXRob2Rpc3Qub3Jn