 Jing Xu1
 Qian Wu1Xiaofeng Xu1,2,3Feihong Weng1,2Tao Lv1Jian Yang1Shouping Wang1Rui Li1,2Chengbo Ai4,5
 Gang Xu1*Lvnan Yan1
 Jiayin Yang1*
- 1Center for Organ Transplantation and Liver Transplantation, West China Hospital, Sichuan University, Chengdu, China
- 2West China School of Nursing, Sichuan University, Chengdu, China
- 3West China School of Clinical Medicine, Sichuan University, Chengdu, China
- 4Department of Pediatric Surgery, Children’s Hospital of Fudan University, Shanghai, China
- 5Department of Pediatric Surgery, West China Hospital/West China School of Medicine, Sichuan University, Chengdu, China
Background: Low preoperative appendicular skeletal muscle mass (ASM) is common in liver transplantation (LT) recipients and may be linked to adverse postoperative outcomes. This study explored the relationship between preoperative ASM and short-term postoperative outcomes, including perioperative inflammation.
Methods: We retrospectively analyzed 653 LT patients at West China Hospital from 2015 to 2022. ASM index (ASM/H2) was calculated using Asian Working Group for Sarcopenia (AWGS) standards. Patients were classified into low and non-low ASM groups by sex-specific cutoffs. Propensity score matching (PSM, 1:1) was used to control for confounding. Associations with complications, inflammatory markers, and survival were evaluated using multivariate logistic and Cox regression. The predictive performance was evaluated using receiver operating characteristic (ROC) curves.
Results: After PSM, 84 matched pairs were analyzed. On postoperative days 1 and 3, the low ASM group had significantly higher neutrophils, NLR, MLR, and NMR (P < 0.05), and lower lymphocyte and platelet counts. This group also showed increased early complications, including pulmonary infection, pleural effusion, and intra-abdominal bleeding (in-hospital mortality: 9.52% vs. 1.19%, P = 0.040). Low ASM independently predicted complications (OR = 6.61, 95% CI: 3.08–14.21) and worse overall survival (HR = 2.25, 95% CI: 1.41–3.57). Predictive models including ASM achieved high accuracy (AUC = 0.80 for complications; AUC = 0.75 for survival).
Conclusions: Low preoperative ASM is an independent risk factor for inflammation, complications, and poorer survival after LT. ASM screening may improve early risk stratification and guide perioperative care.
1 Introduction
Muscle wasting, marked by a gradual loss of skeletal muscle and a corresponding decline in function, is a common pathological condition affecting both the elderly and those with chronic illnesses (1). Several international bodies have proposed the definitions and diagnostic criteria for this condition (2–4). Given the anatomical and metabolic variations across different ethnic groups, the assessment of muscle mass in Asian populations typically adheres to the guidelines established by the Asian Working Group for Sarcopenia (AWGS) (5). The AWGS advocates the use of appendicular skeletal muscle mass adjusted for height (ASM/Height2), a metric that has demonstrated a superior ability to predict functional deterioration and adverse clinical outcomes associated with low muscle mass (6).
Although sarcopenia has been extensively investigated in the general population, research concerning its impact on patients with chronic liver disease and those awaiting liver transplantation (LT) remains limited. Existing evidence suggests that a combination of factors, including reduced nutrient intake, increased metabolism, altered amino acid profiles, endotoxemia, prolonged immobility, and physical deconditioning, contribute to diminished skeletal muscle synthesis and increased breakdown, thereby accelerating muscle loss (7). In individuals awaiting LT, the presence of widespread nutritional, metabolic, and biochemical disturbances further exacerbates the imbalance between protein synthesis and degradation, ultimately leading to secondary sarcopenia (8, 9). A recent meta-analysis highlighted that the prevalence of muscle wasting among patients with chronic liver disease ranges from 40% to 70%, with significant variations observed across different ethnicities (10).
Previous studies have established a strong association between reduced muscle mass and increased mortality during the waiting period, intraoperative phase, and postoperative course of LT (11–13). Consequently, systematic preoperative evaluation of skeletal muscle mass has been increasingly incorporated into perioperative management recommendations. The North American expert consensus on sarcopenia in LT strongly advocates routine muscle status assessment in patients with cirrhosis prior to transplantation and recommends individualized preoperative interventions involving exercise and nutritional support to reduce postoperative infection rates, shorten hospital stays, and improve overall outcomes (14). Various techniques are currently available to assess muscle mass prior to LT, including magnetic resonance imaging (MRI), dual-energy x-ray absorptiometry (DXA), ultrasonography, bioelectrical impedance analysis (BIA), and the D3-creatine dilution method (15–22). However, many of these methods are complex or limited by the unique pathophysiological conditions of liver disease. By contrast, the AWGS-recommended prediction equation for ASM, which incorporates body weight, height, sex, and age, is a practical and scalable tool suitable for large-scale epidemiological studies.
Although preliminary studies have explored the association between sarcopenia and the postoperative outcomes in LT, large-scale cohort studies employing clinically applicable predictive equations are still scarce. Moreover, the potential relationship between preoperative muscle wasting and the postoperative inflammatory response in transplant recipients is yet to be fully clarified. Our center boasts an established LT program with one of the highest patient volumes in China, ensuring data consistency and minimal heterogeneity. Leveraging these clinical gaps and our institutional strengths, this study aimed to: (1) ascertain the impact of preoperative muscle mass on postoperative outcomes in liver transplant recipients and (2) investigate whether changes in inflammatory status occur in sarcopenic patients undergoing LT.
2 Methods
2.1 Data source and study population
Data were obtained from the Clinical Big Data Search Engine Database of the West China Hospital, Sichuan University (http://hxdmc.cn). A total of 653 patients who underwent LT between January 2015 and December 2022 were retrospectively analyzed. The exclusion criteria were as follows: (1) patients under 18 years of age, (2) substantial missing data that prevented the calculation of muscle mass or determination of outcomes, (3) the presence of other malignant solid tumors (e.g., extrahepatic metastasis), and (4) patients who received combined organ transplantation (e.g., liver-kidney transplantation).
This was a retrospective study. All procedures were performed in accordance with the ethical standards set forth by the Ethics Committee of West China Hospital and national regulations as well as the 1964 Declaration of Helsinki and its subsequent amendments. The requirement for informed consent was waived by the ethics committee because the study did not involve direct patient intervention.
2.2 Measurement of muscle mass
The appendicular skeletal muscle mass (ASM) was estimated using the following formula proposed by the Asian Working Group for Sarcopenia (2019): ASM/Ht2 = 0.193 × weight (kg) + 0.107 × height (cm) − 4.157 × sex (male = 1, female = 2) − 0.037 × age (years) − 2.631. The ASM index was subsequently calculated as ASM divided by the height squared (ASM/Ht2). Using threshold values of 6.88 kg/m2 for men and 5.69 kg/m2 for women, patients were categorized into either the low muscle mass or normal muscle mass groups.
2.3 Study outcomes
The clinical outcomes were divided into short-term and long-term categories. The short-term outcomes included early postoperative complications (primary endpoint), length of hospital stay, need for respiratory support, unplanned ICU admission, in-hospital mortality, and reoperation. The length of stay was defined as the number of days between the date of surgery and discharge. Unplanned ICU admission was defined as clinical deterioration after surgery necessitating transfer from the ward to the ICU. Respiratory support was indicated by either failure to extubate postoperatively or reintubation because of clinical worsening. In-hospital mortality was defined as death prior to hospital discharge.
Overall survival (OS) was defined as the time elapsed from LT until death from disease or the date of the last follow-up. All patients underwent standardized postoperative follow-up, which included review of outpatient records, inpatient revisit records, and telephone interviews. The follow-up period was December 31, 2024, with a minimum follow-up window of 12 months. Survival outcome assessments adhered to the guidelines published by the Chinese Society of Clinical Oncology (CSCO) to maintain consistency and data completeness.
2.4 Clinical and pathological parameters
The clinical variables assessed included preoperative characteristics [sex, age, body mass index (BMI), history of hypertension, history of diabetes, prior retransplantation, primary diagnosis, surgical technique, MELD score, Child–Pugh score, biliary complications, and alpha-fetoprotein (AFP) level]. Intraoperative variables (graft weight, cold ischemia time, intraoperative blood loss, volume of intraoperative transfusion, and duration of surgery).
Peripheral blood samples were collected preoperatively and on days 1, 3, and 7 postoperatively. Laboratory data included neutrophil, monocyte, lymphocyte, white blood cell, and platelet counts. The following inflammatory indices were subsequently calculated: neutrophil-to-lymphocyte ratio (NLR), platelet-to-lymphocyte ratio (PLR), monocyte-to-lymphocyte ratio (MLR), neutrophil-to-monocyte ratio (NMR), and systemic immune-inflammation index (SII), calculated as the product of platelet and neutrophil counts divided by lymphocyte count.
2.5 Statistical analysis
Statistical analyses were performed using the R software (version 4.2.0). The Shapiro–Wilk test was used to ascertain the normality of continuous variables. Variables exhibiting a normal distribution were reported as mean ± standard deviation (SD) and compared using independent-samples t-tests. Conversely, non-normally distributed variables are presented as medians (interquartile range, IQR) and analyzed using the Mann–Whitney U test. Categorical variables are summarized as frequencies and percentages, and group comparisons were made using the chi-square test or Fisher's exact test, depending on the suitability of each.
To mitigate potential confounding, 1:1 nearest-neighbor propensity score matching (PSM) was implemented using a caliper width of 0.02. The covariates included in the matching process were age, sex, BMI, comorbidities, etiology of liver disease, surgical type, MELD score, and Child–Pugh classification. An adequate covariate balance was deemed to be achieved when the standardized mean difference (SMD) between the groups was less than 0.1. Univariate and multivariate logistic regression analyses were performed to examine the relationship between low preoperative muscle mass and early postoperative complications. Kaplan–Meier curves were used to estimate cumulative overall survival (OS), and differences between groups were assessed using the log-rank test. Cox proportional hazards regression analysis was conducted to identify predictors of OS with hazard ratios (HRs) and their corresponding 95% confidence intervals (CIs). The predictive accuracy of the models was evaluated using receiver operating characteristic (ROC) curves and the associated area under the curve (AUC). All statistical tests were two-sided, and statistical significance was set at P < 0.05.
3 Results
3.1 Baseline characteristics of patients
A total of 653 patients who underwent LT at West China Hospital, Sichuan University, between January 2015 and December 2022 were included in this study. The patient selection process is illustrated in Figure 1. The mean age of the cohort was 50 ± 10.23 years, with 78.7% male and 21.3% female patients. Based on the ASM evaluation, 84 patients (12.7%) were classified as having low preoperative muscle mass. Compared with patients in the normal muscle mass group, those in the low muscle mass group had a higher prevalence of liver malignancy (38.1% vs. 32.1%, P < 0.001), and exhibited significantly elevated levels of peripheral blood inflammatory markers prior to transplantation, including neutrophil count (10.78 ± 6.24 vs. 7.13 ± 4.25, P < 0.001), white blood cell count (1,059.34 ± 1,542.43 vs. 862.81 ± 1,037.72, P < 0.001), NLR (39.72 ± 27.83 vs. 15.98 ± 13.47, P < 0.001), MLR (1.52 ± 1.45 vs. 1.01 ± 0.83, P = 0.002), NMR (31.88 ± 19.26 vs. 18.04 ± 13.21, P < 0.001), and SII (2,355.02 ± 4,309.20 vs. 912.42 ± 1,045.32, P < 0.001). Conversely, lymphocyte count (0.33 ± 0.21 vs. 0.55 ± 0.36, P < 0.001) and PLR (167.60 ± 162.28 vs. 211.96 ± 132.92, P = 0.006) were significantly lower in the low muscle mass group. To account for potential confounders, propensity score matching (PSM) was applied using a 1:1 nearest-neighbor approach, yielding 84 matched pairs. Post-matching analysis confirmed balanced baseline characteristics—age, sex, BMI, comorbidities, liver disease etiology, and surgical procedure—between groups, with no statistically significant disparities (see Table 1).
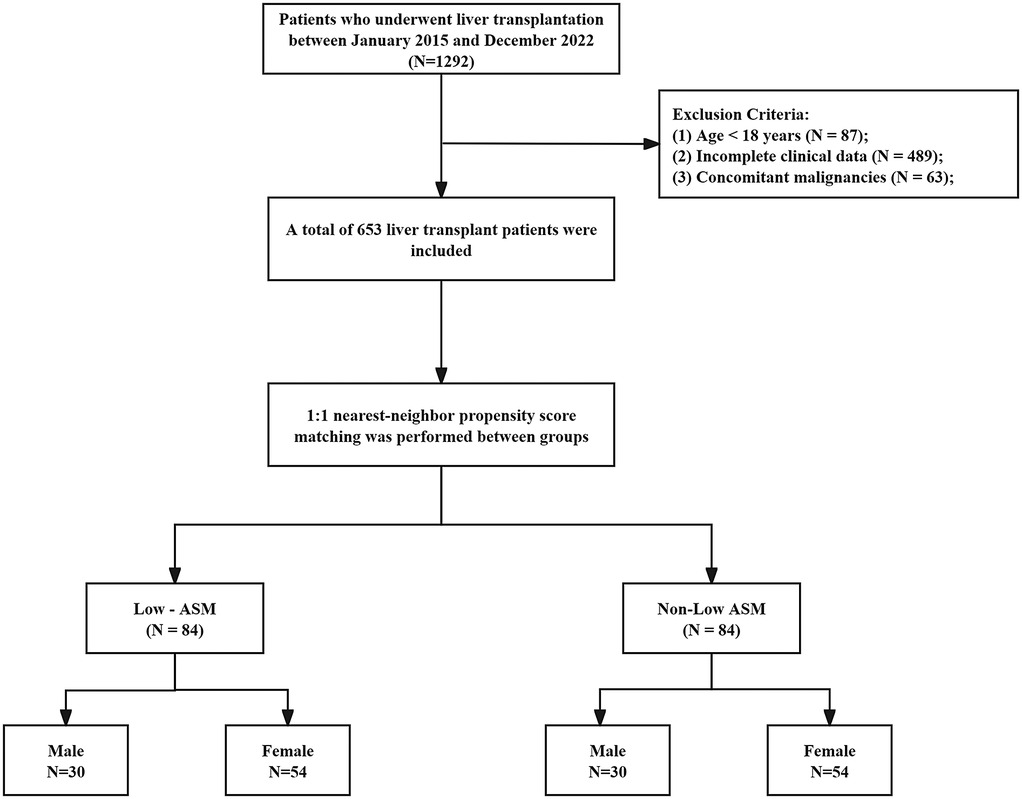
Figure 1. Flowchart of inclusion and exclusion of study population.
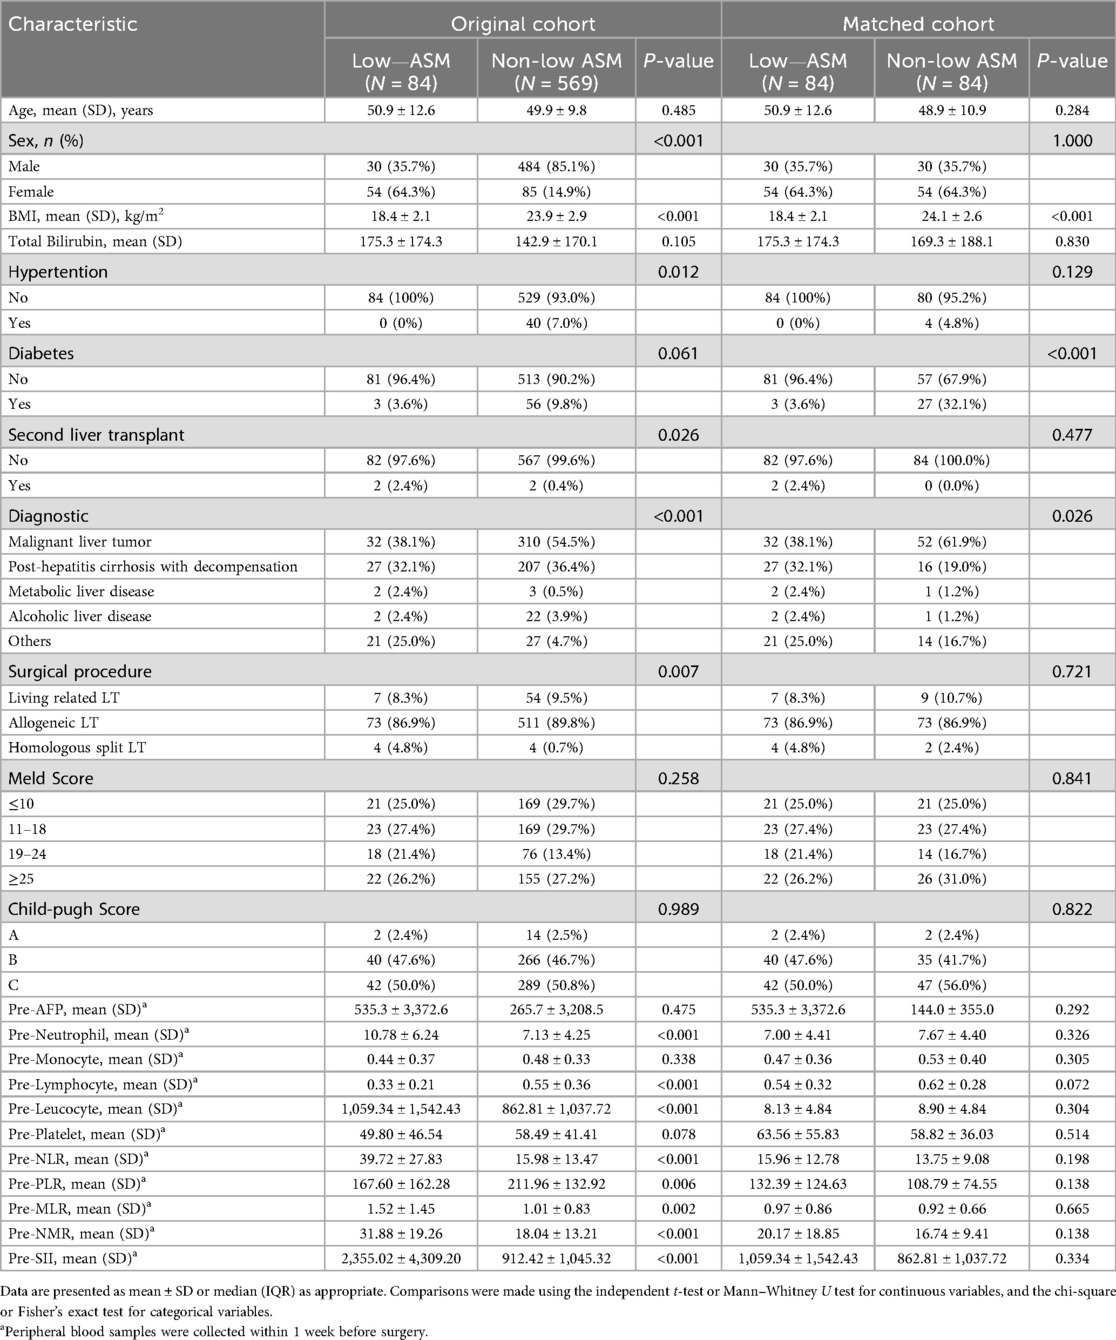
Table 1. Baseline characteristics before and after PSM.
3.2 Correlation between preoperative low muscle mass and postoperative inflammatory markers
After PSM, there were no statistically significant differences in preoperative peripheral blood inflammatory markers, including neutrophil count, monocyte count, lymphocyte count, NLR, MLR, NMR, PLR, and SIIbetween, between the two groups.
However, dynamic postoperative hematological monitoring indicated that patients classified in the low ASM group exhibited markedly elevated levels of neutrophils, NLR, MLR, and NMR on postoperative days 1 and 3 compared with those in the non-ASM group. This finding suggests a robust inflammatory response in patients with reduced muscle mass. Conversely, lymphocyte and platelet counts were considerably lower in the low muscle mass group, potentially indicating a diminished immune capacity (see Figure 2).
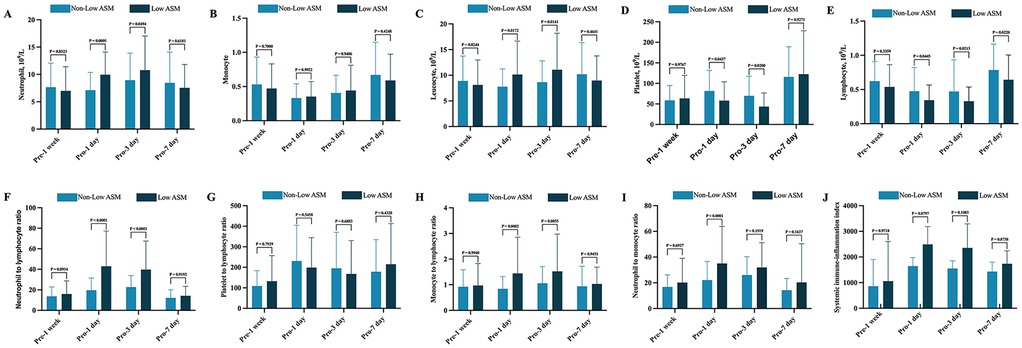
Figure 2. Dynamic perioperative changes in peripheral blood inflammatory markers between patients with and without Low preoperative ASM. (A) Neutrophil; (B) Monocyte; (C) Lymphocyte; (D) Leukocyte; (E) Platelet; (F) NLR (neutrophil-to-lymphocyte ratio); (G) PLR (platelet-to-lymphocyte ratio); (H) MLR (monocyte-to-lymphocyte ratio); (I) NMR (neutrophil-to-monocyte ratio); (J) SII (product of platelet count and neutrophil count divided by lymphocyte count). All results were analyzed using the following statistical methods. Normally distributed data were expressed as mean ± standard deviation (SD) and compared using the independent samples t-test. Non-normally distributed data are expressed as median and interquartile range (IQR) and analyzed using the Mann–Whitney U test.
3.3 Correlation between low preoperative ASM and short-term clinical outcomes
Of the 653 liver transplant recipients involved in the study, 180 experienced early postoperative complications. After PSM, the frequency of these early complications was notably higher in the group with low preoperative appendicular skeletal muscle mass than that in the control group. These complications encompassed the requirement for respiratory support, unplanned intensive care unit (ICU) admission, and in-hospital mortality (Table 2). Specifically, in-hospital mortality was significantly higher in the low muscle mass group (9.52% vs. 1.19%, P = 0.040). Examining specific complications, the low muscle mass group presented with a significantly higher incidence of pulmonary infection (16.67% vs. 2.38%, P = 0.002), pleural effusion (13.10% vs. 3.57%, P = 0.026), and intra-abdominal bleeding (11.90% vs. 1.19%, P = 0.005). Furthermore, other complications, such as biliary stricture, urinary tract infection, and gastrointestinal bleeding, were observed more frequently in the low muscle mass group, while some of these did not achieve statistical significance; they demonstrated a discernible upward trend.
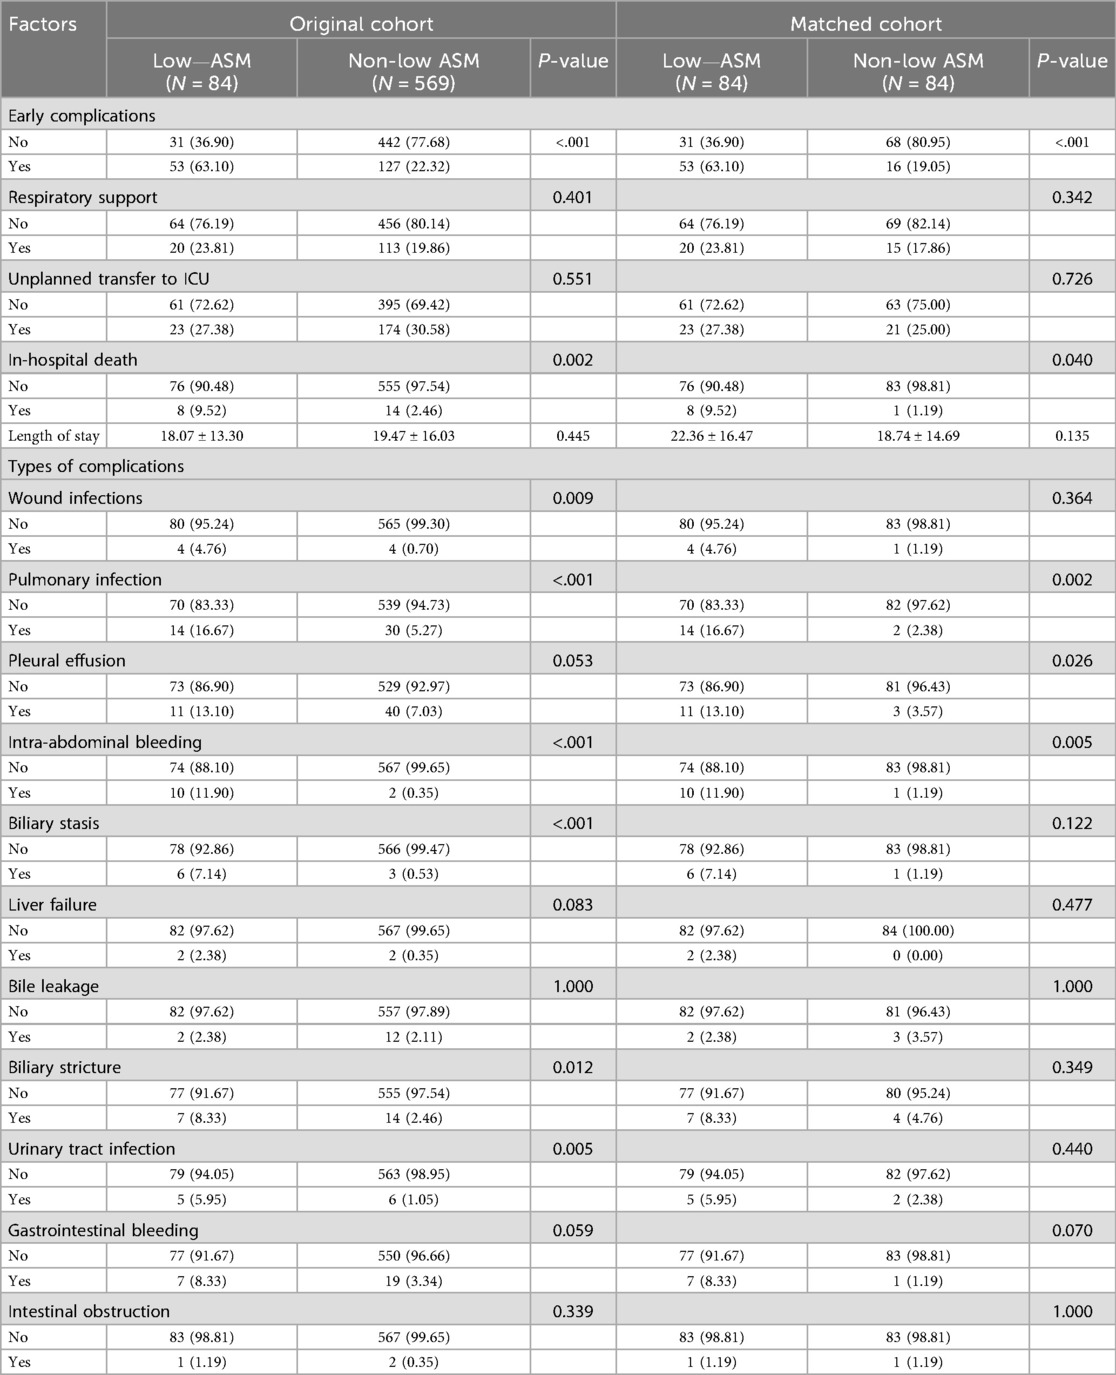
Table 2. Comparison of postoperative complications and outcomes between patients with and without low preoperative ASM before and after PSM.
Multivariate logistic regression analysis confirmed that low preoperative appendicular skeletal muscle mass was an independent risk factor for early postoperative complications (OR = 6.61, 95% CI: 3.08–14.21, P < 0.001). This association persisted even after accounting for potential confounding variables including sex, age, and baseline comorbidities. In addition to ASM, decompensated cirrhosis (OR = 1.55, P = 0.031) and intraoperative blood loss >1,000 ml (OR = 1.54, P = 0.027) were also identified as significant predictors of postoperative complications (Table 3).
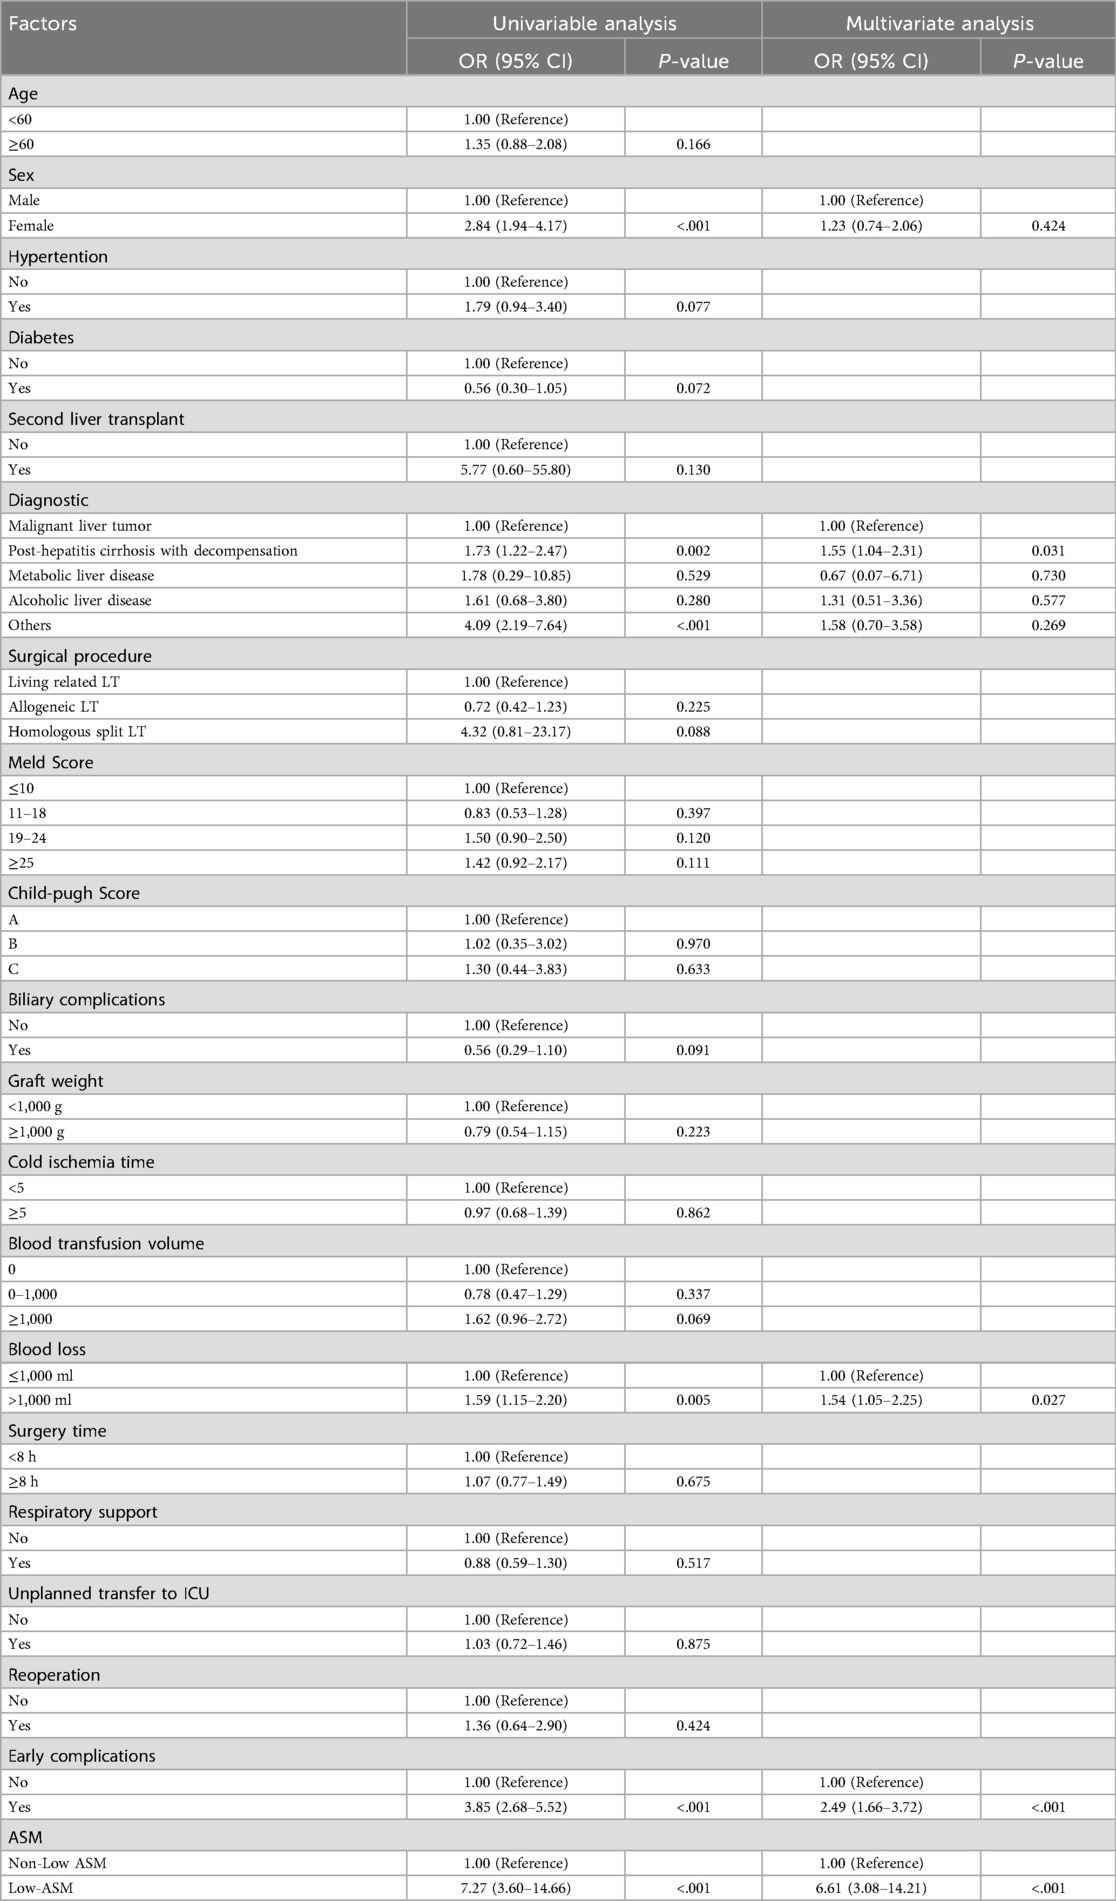
Table 3. Univariate and multivariate logistic regression for early postoperative complications after PSM.
Receiver operating characteristic (ROC) curve analysis demonstrated that incorporating ASM into the predictive model significantly improved its performance, with an AUC of 0.80 (95% CI: 0.76–0.85) in the full cohort and 0.75 (95% CI: 0.66–0.83) after PSM. Conversely, the exclusion of the ASM variable diminished the AUC to 0.74 and 0.61, respectively (see Figure 3), underscoring the value of preoperative muscle mass as a predictive marker for postoperative complications.
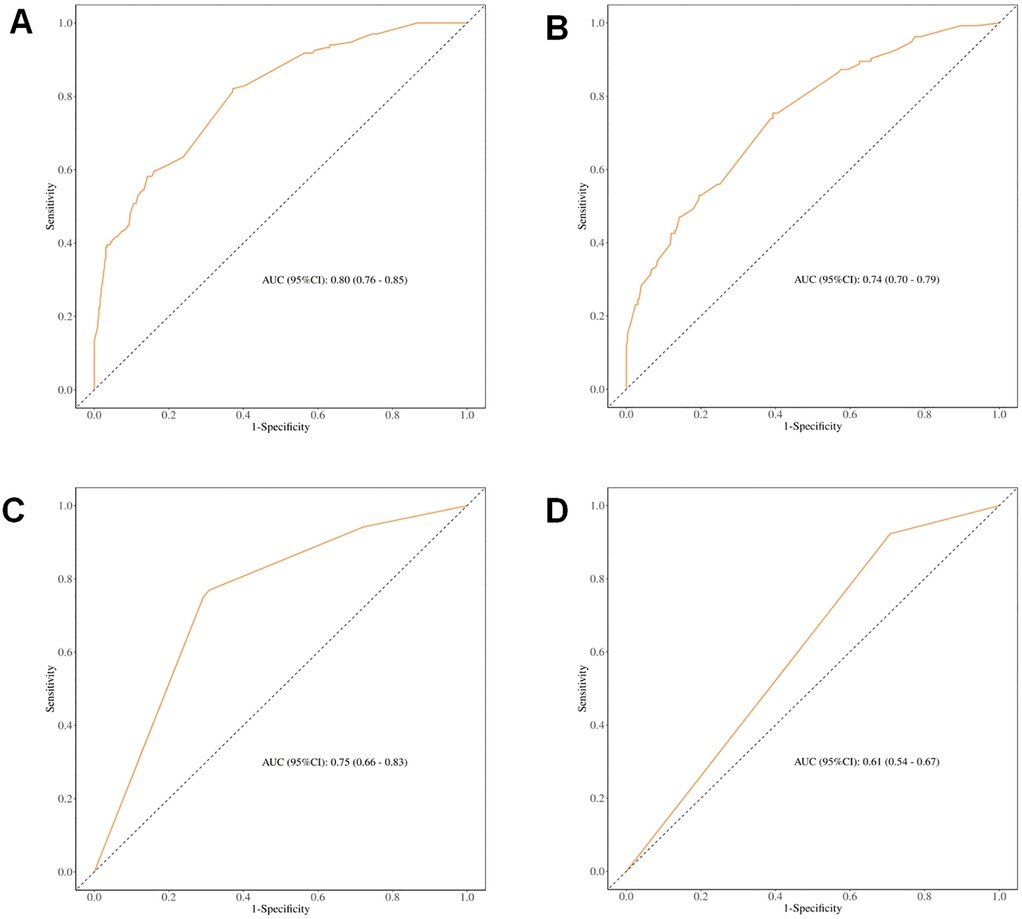
Figure 3. ROC curves for predicting different clinical outcomes. (A) ROC curve for early postoperative complications before PSM (including muscle mass); (B) ROC curve for early postoperative complications before PSM (excluding muscle mass); (C) ROC curve for early postoperative complications after PSM (including muscle mass); (D) ROC curve for early postoperative complications after PSM (excluding muscle mass).
3.4 Correlation between low preoperative ASM and long-term outcomes
A total of 631 patients were enrolled in the follow-up cohort, with an average follow-up period of 14.57 ± 9.55 months. Kaplan–Meier survival analysis revealed that, prior to PSM, patients exhibiting low preoperative appendicular skeletal muscle mass had significantly poorer overall survival (OS) than their counterparts without this condition. This difference in survival remained statistically significant even after PSM (Figure 4).
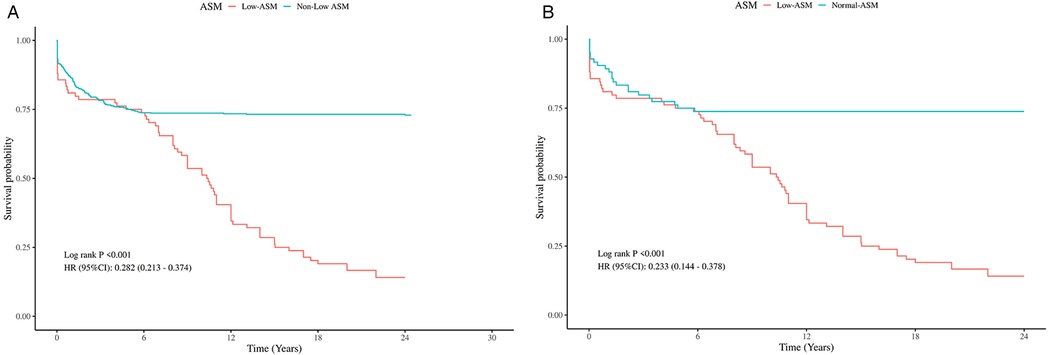
Figure 4. Kaplan–Meier analysis of OS by preoperative ASM Status, Pre- and post-PSM. (A) Comparison of OS between patients with and without low preoperative ASM before PSM. (B) Comparison of OS between patients with and without low preoperative ASM after PSM.
Further analysis using a Cox proportional hazards model demonstrated that a low preoperative ASM was an independent predictor of poor overall survival (HR = 2.25, 95% CI: 1.41–3.57, P < 0.001). In addition, intraoperative blood loss greater than 1,000 ml (HR = 1.53, P = 0.018) and the presence of early postoperative complications (HR = 2.33, P < 0.001) were also significantly associated with worse long-term outcomes (Table 4).
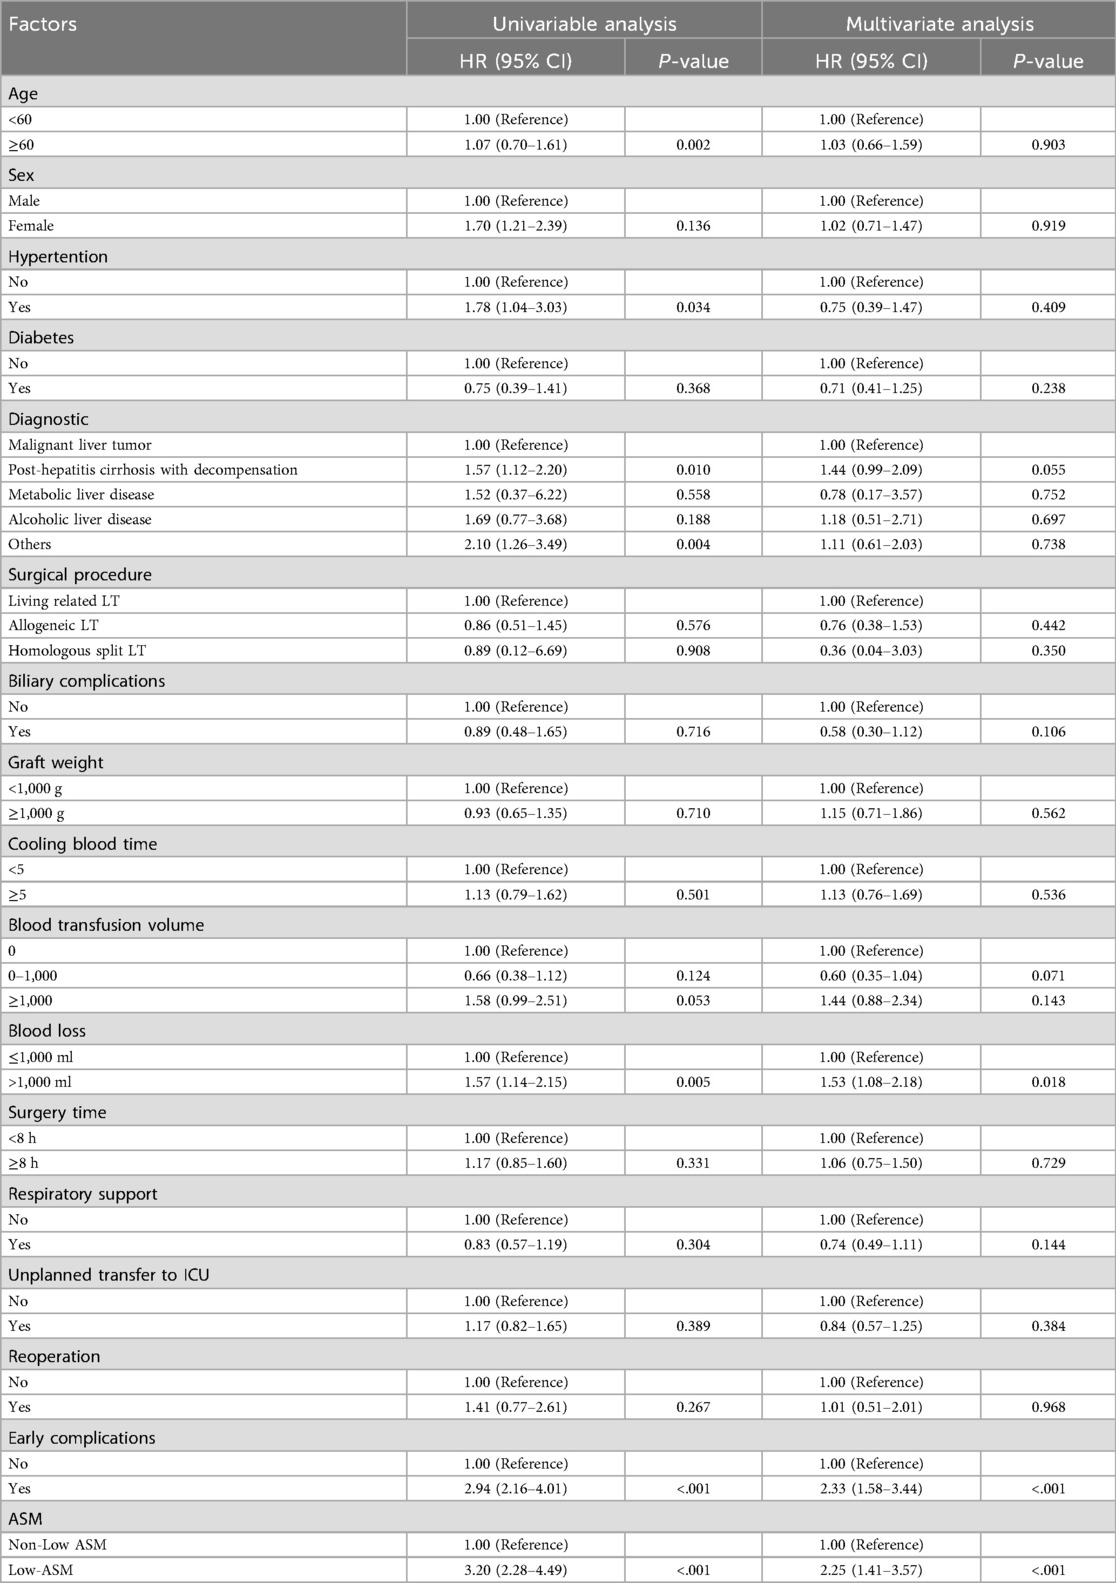
Table 4. Univariate and multivariate Cox regression analyses of OS after PSM.
ROC curve analysis of various models for OS prediction illustrated an improved predictive capability when ASM was incorporated (see Figure 5), thereby further substantiating the role of skeletal muscle mass as a crucial parameter in preoperative risk assessment.
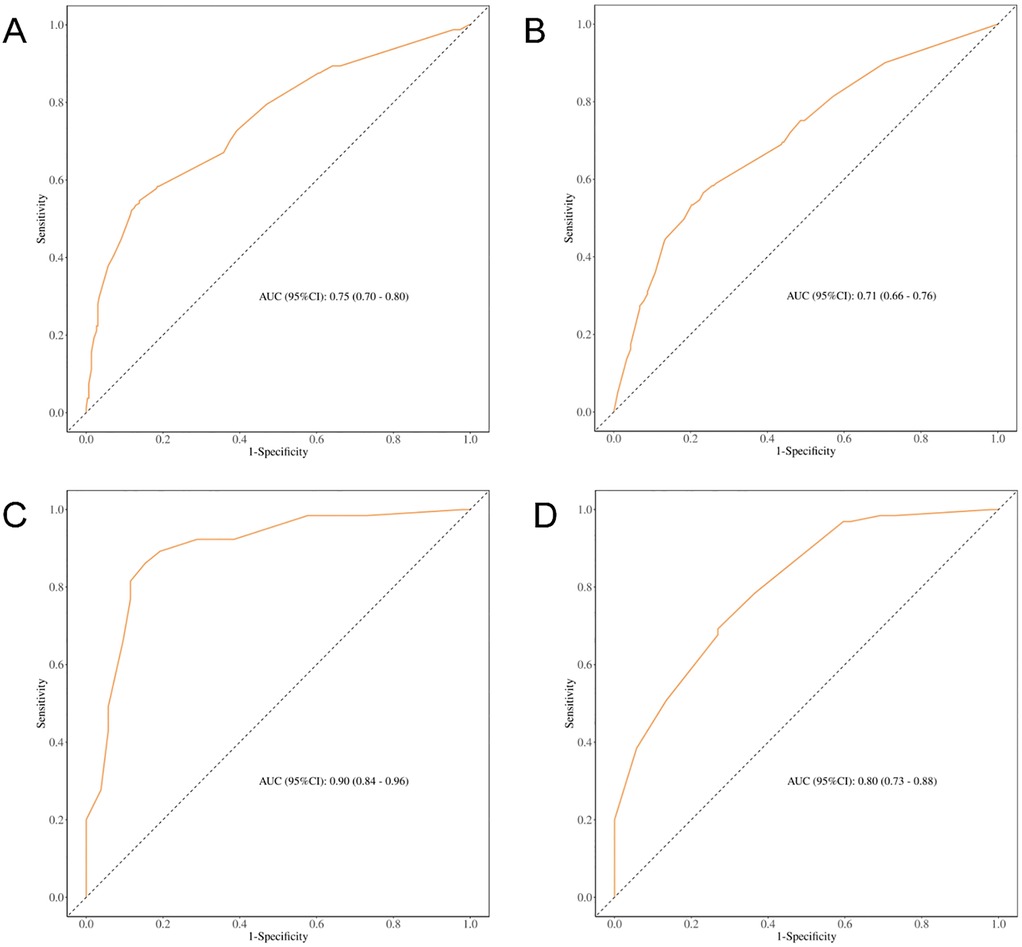
Figure 5. ROC curves for predicting OS based on different clinical models. (A) ROC curve for predicting OS before PSM (including ASM); (B) ROC curve for predicting OS before PSM (excluding ASM); (C) ROC curve for predicting OS after PSM (including ASM); (D) ROC curve for predicting OS after PSM (excluding ASM).
4 Discussion
This study found that among patients who underwent LT between 2015 and 2022, the incidence of a low preoperative ASM was 12.8%. A single-center cohort study from the United States reported a higher incidence of 22%–50% (23), while a Turkish cohort study found a rate of 26% (24), suggesting that the incidence in China is relatively lower but still clinically significant.
Our findings underscore that low preoperative ASM is an independent risk factor contributing to early postoperative complications in liver transplant recipients. After PSM, the incidence of early complications was significantly higher in patients with a low ASM (63.10% vs. 19.05%). These patients are more prone to pulmonary infections, intra-abdominal bleeding, and pleural effusion. Previous studies suggested that postoperative pulmonary infections may be linked to impaired mobility, increased fatigue, and immunosuppression (25–27). The increased incidence of pleural effusion may be secondary to pulmonary infection or associated with hypoalbuminemia caused by malnutrition (28, 29). However, owing to the lack of pleural effusion sample data, it remains unclear whether infection or reduced oncotic pressure is the primary cause, and further investigation is warranted. Postoperative bleeding risk was also notably higher in patients with reduced muscle mass, possibly because of increased portal pressure in patients with sarcopenia (30–32). Overall, these findings suggest that patients with low preoperative ASM are more vulnerable to infections, complications, and delayed recovery following LT. Previous evidence has highlighted the importance of intraoperative blood loss control and nutritional evaluation in improving long-term outcomes (33, 34). Additionally, the study found that patients diagnosed with decompensated cirrhosis before surgery experienced a higher incidence of early complications. Literature has shown that Decompensated cirrhosis is closely associated with muscle wasting, which is driven by impaired nutrient absorption, chronic inflammation, and reduced protein synthesis. In turn, muscle wasting exacerbates liver failure and immunosuppression, creating a vicious cycle (35–37). A meta-analysis by Markakis et al. further confirmed the relationship between preoperative sarcopenia and adverse outcomes (33).
Survival analysis also confirmed that low preoperative ASM was an independent predictor of poor overall ratio [HR] = 2.25, P < 0.001). In addition to the increased risk of complications, patients with low ASM have significantly reduced survival benefits. Kalafateli et al. found an association between preoperative sarcopenia and 1-year mortality in 232 liver transplant recipients (38). Esser et al. also showed that patients with low muscle density had higher postoperative mortality (39).
In our cohort of over 600 liver transplant recipients, patients with a low preoperative ASM exhibited a significantly heightened inflammatory response postoperatively. On postoperative days 1 and 3, the neutrophil count, NLR, MLR, and NMR were all significantly higher than those in the non-low ASM group, indicating systemic inflammatory activation. In contrast, lymphocyte and platelet levels were significantly lower, suggesting a weakened immune function. This finding is consistent with the results of previous studies. A retrospective study in Japan reported that preoperative sarcopenia led to an elevated postoperative NLR, both of which are independent predictors of poor prognosis (40). Ding et al. observed increased white blood cells, neutrophils, and SII in patients with low muscle mass (41), whereas Lee et al. showed that combining muscle mass and NLR provided superior prognostic value (42). It is believed that patients with low ASM may exist in a chronic low-grade inflammatory state, with impaired physiological reserves, reduced stress tolerance, and compromised immune function (43, 44). Other studies have proposed that postoperative inflammatory activation may result from aseptic inflammation due to metabolic disturbances or gut microbiota translocation (45, 46). Proinflammatory cytokines such as TNF-u03b1 may also play a role in the pathogenesis of sarcopenia (47). Evidence further indicates that sarcopenia is a potent predictor of sepsis following living donor LT (48). Our findings indicate that both living and deceased donor liver transplant recipients with low ASM exhibit postoperative inflammatory activation, filling a gap in our understanding of systemic inflammation in sarcopenic liver transplant recipients and providing a theoretical basis for postoperative management.
Taken together with the existing literature, ASM appears to be an effective and practical indicator of muscle mass decline. Low preoperative ASM is a strong predictor of postoperative inflammatory activation, increased complications, and reduced survival in liver transplant recipients. Therefore, early identification and management of sarcopenia, including preoperative nutritional interventions, are crucial for improving postoperative recovery.
5 Limitations and future directions
This study had several limitations. First, due to its retrospective nature and single-center design, although PSM was used to control for potential confounders, selection bias may still exist. While ASM was shown to have good predictive value for outcomes, sarcopenia is a multifactorial condition also involving physical frailty, fat infiltration, and functional capacity, which were not assessed in this study (8, 49). Furthermore, the presence of ascites and the nutritional condition of patients with liver disease can influence body weight, potentially causing inaccuracies in estimating ASM. Additionally, the unavailability of reliable dry weight measurements or imaging tools like CT or MRI poses a significant limitation to this study. Because of limited data, this study could not thoroughly analyze the link between cold ischemia time and graft function.
The outcome criteria relied on medical record documentation, which might not always align with global standards, indicating that future studies should implement uniform definitions to improve consistency between different centers. We also observed that patients with different liver disease etiologies (e.g., hepatocellular carcinoma, HBV-related cirrhosis, alcoholic liver disease, and autoimmune liver disease) exhibited varying degrees of decompensation and postoperative prognosis. Future studies should investigate whether ASM-based thresholds can be tailored to specific liver disease etiologies.
In addition, future research should consider integrating artificial intelligence (AI) and data lake approaches for liver transplantation research. By leveraging large-scale datasets and advanced AI-driven analytics, it may be possible to generate more comprehensive insights into how different disease conditions and preoperative factors, including ASM, affect post-transplant outcomes. Such approaches could go beyond traditional statistical methods, improving predictive accuracy and facilitating more personalized patient care (50–52).
In essence, ASM serves as a straightforward and effective tool for preoperative risk stratification in LT, potentially aiding intervention strategies. Nevertheless, larger-scale, multicenter prospective studies are indispensable to rigorously validate its predictive accuracy and clinical utility in the liver transplant evaluation process.
Data availability statement
The raw data supporting the conclusions of this article will be made available by the authors, without undue reservation.
Ethics statement
The studies involving humans were approved by the Ethics Committee of West China Hospital, Sichuan University. The studies were conducted in accordance with the local legislation and institutional requirements. The ethics committee/institutional review board waived the requirement of written informed consent for participation from the participants or the participants’ legal guardians/next of kin because this study is a retrospective analysis and does not require informed consent.
Author contributions
JX: Formal analysis, Investigation, Writing – original draft, Data curation. QW: Resources, Methodology, Writing – original draft. XX: Writing – original draft, Supervision. FW: Writing – original draft, Project administration. TL: Validation, Writing – review & editing. JianY: Resources, Writing – review & editing. SW: Project administration, Writing – review & editing. RL: Writing – review & editing, Visualization. CA: Data curation, Writing – review & editing. GX: Funding acquisition, Supervision, Writing – review & editing. LY: Conceptualization, Supervision, Writing – review & editing. JiayY: Project administration, Writing – review & editing.
Funding
The author(s) declare that financial support was received for the research and/or publication of this article. This study was supported by the National Key Research and Development Program of China (Grant No. 2022YFC2304705) and the Major Project on Prevention and Control of Four Major Chronic Diseases (Grant No. 2023ZD0502400).
Conflict of interest
The authors declare that the research was conducted in the absence of any commercial or financial relationships that could be construed as a potential conflict of interest.
Generative AI statement
The author(s) declare that no Generative AI was used in the creation of this manuscript.
Any alternative text (alt text) provided alongside figures in this article has been generated by Frontiers with the support of artificial intelligence and reasonable efforts have been made to ensure accuracy, including review by the authors wherever possible. If you identify any issues, please contact us.
Publisher's note
All claims expressed in this article are solely those of the authors and do not necessarily represent those of their affiliated organizations, or those of the publisher, the editors and the reviewers. Any product that may be evaluated in this article, or claim that may be made by its manufacturer, is not guaranteed or endorsed by the publisher.
References
1. Gielen E, Dupont J, Dejaeger M, Laurent MR. Sarcopenia, osteoporosis and frailty. Metab Clin Exp. (2023) 145:155638. doi: 10.1016/j.metabol.2023.155638
2. Fielding RA, Vellas B, Evans WJ, Bhasin S, Morley JE, Newman AB, et al. Sarcopenia: an undiagnosed condition in older adults. Current consensus definition: prevalence, etiology, and consequences. International working group on sarcopenia. J Am Med Dir Assoc. (2011) 12(4):249–56. doi: 10.1016/j.jamda.2011.01.003
3. Cruz-Jentoft AJ, Bahat G, Bauer J, Boirie Y, Bruyère O, Cederholm T, et al. Sarcopenia: revised European consensus on definition and diagnosis. Age Ageing. (2019) 48(1):16–31. doi: 10.1093/ageing/afy169
4. Studenski SA, Peters KW, Alley DE, Cawthon PM, McLean RR, Harris TB, et al. The FNIH sarcopenia project: rationale, study description, conference recommendations, and final estimates. J Gerontol A Biol Sci Med Sci. (2014) 69(5):547–58. doi: 10.1093/gerona/glu010
5. Chen LK, Woo J, Assantachai P, Auyeung T-W, Chou M-Y, Iijima K, et al. Asian working group for sarcopenia: 2019 consensus update on sarcopenia diagnosis and treatment. J Am Med Dir Assoc. (2020) 21(3):300–7.e2. doi: 10.1016/j.jamda.2019.12.012
6. Wen X, Wang M, Jiang CM, Zhang YM. Anthropometric equation for estimation of appendicular skeletal muscle mass in Chinese adults. Asia Pac J Clin Nutr. (2011) 20(4):551–6. doi: 10.6133/apjcn.2011.20.4.08
7. Dasarathy S, Merli M. Sarcopenia from mechanism to diagnosis and treatment in liver disease. J Hepatol. (2016) 65(6):1232–44. doi: 10.1016/j.jhep.2016.07.040
8. Tandon P, Zanetto A, Piano S, Heimbach JK, Dasarathy S. LT in the patient with physical frailty. J Hepatol. (2023) 78(6):1105–17. doi: 10.1016/j.jhep.2023.03.025
9. Ebadi M, Bhanji RA, Mazurak VC, Montano-Loza AJ. Sarcopenia in cirrhosis: from pathogenesis to interventions. J Gastroenterol. (2019) 54(10):845–59. doi: 10.1007/s00535-019-01605-6
10. Kim G, Kang SH, Kim MY, Baik SK. Prognostic value of sarcopenia in patients with liver cirrhosis: a systematic review and meta-analysis. PLoS One. (2017) 12(10):e0186990. doi: 10.1371/journal.pone.0186990
11. Haugen CE, McAdams-DeMarco M, Verna EC, Rahimi RS, Kappus MR, Dunn MA, et al. Association between liver transplant wait-list mortality and frailty based on body mass index. JAMA Surg. (2019) 154(12):1103–9. doi: 10.1001/jamasurg.2019.2845
12. Van Son J, Stam SP, Gomes-Neto AW, Osté MCJ, Blokzijl H, van den Berg AP, et al. Post-transplant obesity impacts long-term survival after LT. Metabolism. (2020) 106:154204. doi: 10.1016/j.metabol.2020.154204
13. Montano-Loza AJ, Meza-Junco J, Prado CM, Lieffers JR, Baracos VE, Bain VG, et al. Muscle wasting is associated with mortality in patients with cirrhosis. Clin Gastroenterol Hepatol. (2012) 10(2):166–73; 173.e1. doi: 10.1016/j.cgh.2011.08.028
14. Carey EJ, Lai JC, Sonnenday C, Tapper EB, Tandon P, Duarte-Rojo A, et al. A north American expert opinion statement on sarcopenia in LT. Hepatology. (2019) 70(5):1816–29. doi: 10.1002/hep.30828
15. Walowski CO, Braun W, Maisch MJ, Jensen B, Peine S, Norman K, et al. Reference values for skeletal muscle mass - current concepts and methodological considerations. Nutrients. (2020) 12(3):755. doi: 10.3390/nu12030755
16. Schweitzer L, Geisler C, Pourhassan M, Braun W, Glüer C-C, Bosy-Westphal A, et al. What is the best reference site for a single MRI slice to assess whole-body skeletal muscle and adipose tissue volumes in healthy adults? Am J Clin Nutr. (2015) 102(1):58–65. doi: 10.3945/ajcn.115.111203
17. Imboden MT, Swartz AM, Finch HW, Harber MP, Kaminsky LA. Reference standards for lean mass measures using GE dual energy x-ray absorptiometry in Caucasian adults. PLoS One. (2017) 12(4):e0176161. doi: 10.1371/journal.pone.0176161
18. Tavoian D, Ampomah K, Amano S, Law TD, Clark BC. Changes in DXA-derived lean mass and MRI-derived cross-sectional area of the thigh are modestly associated. Sci Rep. (2019) 9(1):10028. doi: 10.1038/s41598-019-46428-w
19. Madden KM, Feldman B, Arishenkoff S, Meneilly GS. A rapid point-of-care ultrasound marker for muscle mass and muscle strength in older adults. Age Ageing. (2021) 50(2):505–10. doi: 10.1093/ageing/afaa163
20. Yamada Y, Yamada M, Yoshida T, Miyachi M, Arai H. Validating muscle mass cutoffs of four international sarcopenia-working groups in Japanese people using DXA and BIA. J Cachexia Sarcopenia Muscle. (2021) 12(4):1000–10. doi: 10.1002/jcsm.12732
21. Aleixo GFP, Shachar SS, Nyrop KA, Muss HB, Battaglini CL, Williams GR. Bioelectrical impedance analysis for the assessment of sarcopenia in patients with cancer: a systematic review. Oncologist. (2020) 25(2):170–82. doi: 10.1634/theoncologist.2019-0600
22. Clark RV, Walker AC, O'Connor-Semmes RL, Leonard MS, Miller RR, Stimpson SA, et al. Total body skeletal muscle mass: estimation by creatine (methyl-d3) dilution in humans. J Appl Physiol. (2014) 116(12):1605–13. doi: 10.1152/japplphysiol.00045.2014
23. Olson SL, Polineni P, Schwartz WAH, Thuluvath AJ, Duarte-Rojo A, Ladner DP. Comparing functional frailty and radiographic sarcopenia as predictors of outcomes after liver transplant. Clin Transplant. (2024) 38(7):e15412. doi: 10.1111/ctr.15412
24. Demirel AO, Topal U, Yavuz B, Kaycı Y, Atar C, Sarıtaş AG, et al. Retrospective analysis of the effect of sarcopenia on mortality and morbidity in liver transplant patients. Transplant Proc. (2025) 57(5):833–40. doi: 10.1016/j.transproceed.2025.03.016
25. Su Y, Zhang Y, Zhang D, Xu J. Exploring the relationship between sarcopenia and 11 respiratory diseases: a comprehensive mendelian randomization analysis. Aging Clin Exp Res. (2024) 36(1):205. doi: 10.1007/s40520-024-02855-y
26. Kelly B, Pearce EL. Amino assets: how amino acids support immunity. Cell Metab. (2020) 32(2):154–75. doi: 10.1016/j.cmet.2020.06.010
27. So HK, Kim S, Kang JS, Lee SJ. Role of protein arginine methyltransferases and inflammation in muscle pathophysiology. Front Physiol. (2021) 12:712389. doi: 10.3389/fphys.2021.712389
28. Clouse JW, Mangus RS, Vega CA, Cabrales AE, Bush WJ, Clouse IT, et al. Pleural effusion and malnutrition are associated with worse early outcomes after liver transplant. Am Surg. (2023) 89(12):5881–90. doi: 10.1177/00031348221126962
29. Xiao HJ, Ye Q, Zhang M, Qi YM, Han T, Wang X, et al. Risk factors of cirrhosis combined with sarcopenia and their impact on clinical outcomes. Zhonghua Gan Zang Bing Za Zhi. (2020) 28(1):53–7. doi: 10.3760/cma.j.issn.1007-3418.2020.01.013
30. Liu Y, Chang H, Zeng Y, Liu Y, Li J, Chen Y, et al. Impact of sarcopenia on variceal rebleeding in patients after endoscopic therapy: a multicenter retrospective cohort study based on propensity score matching. Ann Med. (2024) 56(1):2349180. doi: 10.1080/07853890.2024.2349180
31. Yang J, Wang D, Ma L, An X, Hu Z, Zhu H, et al. Sarcopenia negatively affects postoperative short-term outcomes of patients with non-cirrhosis liver cancer. BMC Cancer. (2023) 23(1):212. doi: 10.1186/s12885-023-10643-6
32. Ebadi M, Bhanji RA, Tandon P, Mazurak V, Baracos VE, Montano-Loza AJ, et al. Review article: prognostic significance of body composition abnormalities in patients with cirrhosis. Aliment Pharmacol Ther. (2020) 52(4):600–18. doi: 10.1111/apt.15927
33. Markakis GE, Lai JC, Karakousis ND, Papatheodoridis GV, Psaltopoulou T, Merli M, et al. Sarcopenia as a predictor of survival and complications of patients with cirrhosis after LT: a systematic review and meta-analysis. Clin Transplant. (2025) 39(2):e70088. doi: 10.1111/ctr.70088
34. Nam NH, Kaido T, Uemoto S. Assessment and significance of sarcopenia in liver transplantation. Clin Transplant. (2019) 33:e13741. doi: 10.1111/ctr.13741
35. Tandon P, Montano-Loza AJ, Lai JC, Dasarathy S, Merli M. Sarcopenia and frailty in decompensated cirrhosis. J Hepatol. (2021) 75(Suppl 1):S147–62. doi: 10.1016/j.jhep.2021.01.025
36. Lai JC, Tandon P, Bernal W, Tapper EB, Ekong U, Dasarathy S, et al. Malnutrition, frailty, and sarcopenia in patients with cirrhosis: 2021 practice guidance by the American association for the study of liver diseases. Hepatology. (2021) 74(3):1611–44. doi: 10.1002/hep.32049
37. Di Cola S, D’Amico G, Caraceni P, Schepis F, Loredana S, Lampertico P, et al. Myosteatosis is closely associated with sarcopenia and significantly worse outcomes in patients with cirrhosis. J Hepatol. (2024) 81(4):641–50. doi: 10.1016/j.jhep.2024.05.020
38. Kalafateli M, Mantzoukis K, Choi Yau Y, Mohammad AO, Arora S, Rodrigues S, et al. Malnutrition and sarcopenia predict post-LT outcomes independently of the model for end-stage liver disease score. J Cachexia Sarcopenia Muscle. (2017) 8(1):113–21. doi: 10.1002/jcsm.12095
39. Esser H, Resch T, Pamminger M, Mutschlechner B, Troppmair J, Riedmann M, et al. Preoperative assessment of muscle mass using computerized tomography scans to predict outcomes following orthotopic LT. Transplantation. (2019) 103(12):2506–14. doi: 10.1097/TP.0000000000002759
40. Tsukioka T, Izumi N, Mizuguchi S, Kyukwang C, Komatsu H, Toda M, et al. Positive correlation between sarcopenia and elevation of neutrophil/lymphocyte ratio in pathological stage IIIA (N2-positive) non-small cell lung cancer patients. Gen Thorac Cardiovasc Surg. (2018) 66(12):716–22. doi: 10.1007/s11748-018-0985-z
41. Ding P, Wu H, Li T, Wu J, Yang L, Yang J, et al. Impact of preoperative sarcopenia on postoperative complications and prognosis in patients undergoing robotic gastric cancer surgery: a propensity score matching study. Nutrition. (2024) 123:112408. doi: 10.1016/j.nut.2024.112408
42. Lee SY, Chung E, Cho ES, Lee JH, Park EJ, Shin SJ, et al. The clinical impact of combining neutrophil-to-lymphocyte ratio with sarcopenia for improved discrimination of progression-free survival in patients with colorectal cancer. J Clin Med. (2022) 11(2):431. doi: 10.3390/jcm11020431
43. Antuña E, Cachán-Vega C, Bermejo-Millo JC, Potes Y, Caballero B, Vega-Naredo I, et al. Inflammaging: implications in sarcopenia. Int J Mol Sci. (2022) 23(23):15039. doi: 10.3390/ijms232315039
44. Zhou D, Zhang Y, Mamtawla G, Wan S, Gao X, Zhang L, et al. Iron overload is related to muscle wasting in patients with cachexia of gastric cancer: using quantitative proteome analysis. Med Oncol. (2020) 37(12):113. doi: 10.1007/s12032-020-01439-w
45. Kitada M, Koya D. Autophagy in metabolic disease and ageing. Nat Rev Endocrinol. (2021) 17(11):647–61. doi: 10.1038/s41574-021-00551-9
46. Maslennikov R, Alieva A, Poluektova E, Zharikov Y, Suslov A, Letyagina Y, et al. Sarcopenia in cirrhosis: prospects for therapy targeted to gut microbiota. World J Gastroenterol. (2023) 29(27):4236–51. doi: 10.3748/wjg.v29.i27.4236
47. Han JW, Kim DI, Nam HC, Chang UI, Yang JM, Song DS, et al. Association between serum tumor necrosis factor-α and sarcopenia in liver cirrhosis. Clin Mol Hepatol. (2022) 28(2):219–31. doi: 10.3350/cmh.2021.0082
48. Masuda T, Shirabe K, Ikegami T, Harimoto N, Yoshizumi T, Soejima Y, et al. Sarcopenia is a prognostic factor in living donor LT. Liver Transpl. (2014) 20(4):401–7. doi: 10.1002/lt.23811
49. Bhanji RA, Takahashi N, Moynagh MR, Narayanan P, Angirekula M, Mara KC, et al. The evolution and impact of sarcopenia pre- and post-LT. Aliment Pharmacol Ther. (2019) 49(6):807–13. doi: 10.1111/apt.15161
50. Sepulveda A, Pravisani R. Artificial intelligence and liver transplantation: looking inside the Pandora’s box. Art Int Surg. (2024) 4(3):170–9. doi: 10.20517/ais.2024.11
51. Patel K, Connor AA, Kodali S, Mobley CM, Victor D, Hobeika MJ, et al. From prediction to practice: a narrative review of recent artificial intelligence applications in liver transplantation. Art Int Surg. (2025) 5(2):298–321. doi: 10.20517/ais.2024.103
Keywords: low appendicular skeletal muscle mass, liver transplant, postoperative complications, short-term prognosis, propensity score matching
Citation: Xu J, Wu Q, Xu X, Weng F, Lv T, Yang J, Wang S, Li R, Ai C, Xu G, Yan L and Yang J (2025) Impact of low preoperative appendicular skeletal muscle mass on postoperative complications and short-term outcomes in liver transplant recipients: a propensity score-matched retrospective study. Front. Surg. 12:1671709. doi: 10.3389/fsurg.2025.1671709
Received: 23 July 2025; Accepted: 9 September 2025;
Published: 26 September 2025.
Edited by:
Derek DuBay, Prisma Health, United StatesCopyright: © 2025 Xu, Wu, Xu, Weng, Lv, Yang, Wang, Li, Ai, Xu, Yan and Yang. This is an open-access article distributed under the terms of the Creative Commons Attribution License (CC BY). The use, distribution or reproduction in other forums is permitted, provided the original author(s) and the copyright owner(s) are credited and that the original publication in this journal is cited, in accordance with accepted academic practice. No use, distribution or reproduction is permitted which does not comply with these terms.
*Correspondence: Gang Xu, Z2FuZ3h1QHdjaHNjdS5jbg==; Jiayin Yang, ZG9jdG9yeWp5QHNjdS5lZHUuY24=