 Weihua Yang
 Jing Chen2,†
- 1Department of Arthrosis Surgery, Fujian Medical University Union Hospital, Fuzhou, China
- 2Department of Rehabilitation Medicine, Anxi County Hospital, Quanzhou, China
Purpose: This study aimed to analyze the biomechanical effects of two bone cement injection techniques by establishing a finite element model of osteoporotic vertebral compression fractures.
Methods: CT data from a healthy male volunteer were used to construct a three-dimensional finite element model of the L1–L3 vertebrae. A simulated vertebral compression fracture was created at L2, followed by virtual vertebroplasty using two cement distribution patterns: the vertical group (VG) and the inclined group (IG). Stress distribution, maximum von Mises stress in the vertebrae and intervertebral discs, and the maximum displacement of L2 were compared between the two groups.
Results: In the L2 vertebra, the maximum stress in the VG is reduced under all six loading conditions. VG showed reduced maximum stress in the L1 vertebra during extension, left bending, and left/right rotation. For the L3 vertebra, VG achieved the lowest maximum stress under all loading conditions. In the L1–L2 intervertebral disc, VG resulted in lower maximum stress than IG during flexion, extension, and lateral bending. while in the L2–L3 disc, VG produced the lowest maximum stress under all six conditions. Furthermore, under flexion and extension, the maximum displacement of L2 was smaller in VG compared with IG.
Conclusions: The vertical cement distribution pattern effectively reduces vertebral and intervertebral disc stress and provides greater stability of the fractured vertebra compared with the inclined distribution pattern.
Introduction
Osteoporosis (OP) is a systemic skeletal disorder characterized by decreased bone mass and deterioration of bone microarchitecture, leading to increased bone fragility and susceptibility to fractures (1). Globally, approximately 200 million individuals are affected by osteoporosis, presenting with varying degrees of pain, spinal deformity, fragility fractures, and reduced muscle strength (2, 3). The decline in bone mass significantly elevates fracture risk, particularly in the vertebrae, hip, and wrist. Among these, osteoporotic vertebral compression fractures (OVCFs) are the most prevalent (4). With the continuing aging of the global population, an estimated 1.4 million OVCF cases occur annually, and the incidence among individuals aged over 50 years ranges from 10% to 25% (5, 6). OVCF has thus emerged as a major public health concern, imposing a substantial healthcare burden, impairing the quality of life of elderly individuals, and increasing mortality rates (7).
In the early stages following OVCF, conservative management involving bed rest is typically adopted. Once the fracture site stabilizes after 4–6 weeks of immobilization, gradual ambulation may be initiated (8). However, conservative treatment is often associated with complications such as bone loss, pressure ulcers, hypostatic pneumonia, and muscle atrophy (6, 9). Moreover, it is unsuitable for patients with severe comorbidities, unstable fractures, or nonunion (10, 11). In recent years, percutaneous vertebroplasty (PVP) has gained wide clinical acceptance for the management of OVCF due to its advantages of broad applicability, minimal invasiveness, and procedural simplicity (12). During PVP, a puncture needle is inserted into the affected vertebra under imaging guidance, and bone cement is injected into the vertebral body. The cement rapidly polymerizes within the vertebra, thereby stabilizing the fracture, restoring vertebral height, and alleviating pain. PVP has demonstrated substantial efficacy in treating painful osteoporotic fractures, with 80%–90% of patients experiencing rapid pain relief and functional improvement postoperatively (10, 13).
The intravertebral distribution of bone cement has been shown to affect the stress profile of both the treated and adjacent vertebrae (14). Several studies have indicated that bilateral cement distribution more effectively relieves pain and restores vertebral height compared with unilateral distribution (15). However, on the sagittal plane, variations in cement distribution arise due to differences in injection trajectory and volume. Zhang et al. (16) classified cement distribution into four types based on endplate contact and found that these patterns influenced intervertebral disc degeneration. Building upon this, we categorized cement distribution into two major sagittal configurations based on postoperative imaging analyses: (1) a vertical distribution, in which the cement spreads evenly and remains parallel to the vertebral endplate, and (2) an inclined distribution, in which the cement extends obliquely from the anteroinferior to the posterosuperior portion of the vertebral body. Cement distribution is influenced by both the orientation of the fracture line and the puncture angle during injection (17). Uniform cement spread parallel to the vertebral axis ensures even mechanical support, whereas cement aligned along the puncture needle tends to create an angular, asymmetric distribution. Previous studies have suggested that such asymmetry may lead to insufficient mechanical support and abnormal stress transmission to adjacent segments, thereby predisposing to refracture or adjacent vertebral fractures (18).
Although existing clinical studies have identified cement distribution as a key determinant of postoperative outcomes (19), most rely on cohort analyses and lack biomechanical validation. Since the 1970s, finite element analysis (FEA) has become a cornerstone of spinal biomechanics research owing to its precision, individualization, and cost-effectiveness (20). Prior investigations have demonstrated that bilateral vertebroplasty achieves superior stress balance across vertebrae (21). However, under bilateral injection conditions, the specific biomechanical impact of different cement distribution patterns—particularly vertical (symmetric) vs. inclined (oblique) configurations—remains poorly understood.
Therefore, the present study systematically compared the biomechanical characteristics of vertical and inclined cement distribution patterns in bilateral PVP using the finite element method. By analyzing stress distribution and vertebral stability, this study aims to elucidate the mechanical implications of these configurations and provide a theoretical foundation for optimizing clinical injection techniques.
Materials and methods
Spinal data acquisition and construction of L1–L3 finite element model
A healthy adult male volunteer with no history of spinal disease or surgery was selected. Computed tomography (CT) scans of the L1–L3 vertebrae were obtained with a slice thickness of 0.5 mm. The data were imported into Mimics 21.0 (Materialise, Leuven, Belgium) in Digital Imaging and Communications in Medicine (DICOM) format to reconstruct a three-dimensional lumbar spine model through grayscale adjustment and threshold segmentation.
Subsequently, Geomagic Wrap 2021 (Geomagic, USA) was used for noise reduction, surface smoothing, contour editing, mesh optimization, and surface fitting. The processed model was further segmented and assembled in SolidWorks 2021 (Dassault Systèmes, USA), where the upper and lower endplates, articular cartilage, and intervertebral disc structures were established. The cortical bone thickness was set at 1.5 mm (22). The intervertebral disc was modeled as consisting of a nucleus pulposus and an annulus fibrosus, with the nucleus pulposus occupying 40% of the total disc area (23). The completed model was saved in SLDPRT format for subsequent analysis.
Construction of compression fracture model
To simulate osteoporotic bone, the elastic modulus was reduced based on previously published data (23, 24). The L2 vertebral compression fracture model was created by introducing a 0.5 mm horizontal fracture line through the anterior cortex of the vertebral body, extending posteriorly to the middle column (25). The approximate depth, width, and height of the fracture line were 22.5 mm, 42.5 mm, and 0.5 mm, respectively (26) (Figure 1).
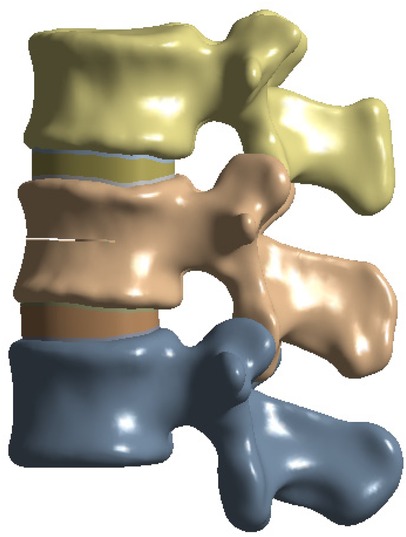
Figure 1. L2 vertebral fracture model.
Establishment of bone cement model
Two cylindrical regions were used to simulate bone cement distribution within the fractured vertebra. Based on previous studies, the total cement volume was set to 4 ml (1). For the vertical group (VG), two equal-volume cylinders were positioned vertically and symmetrically on both sides of the fracture (Figure 2A). For the inclined group (IG), two equal-volume cylinders were placed obliquely on both sides of the vertebral body (Figure 2B).
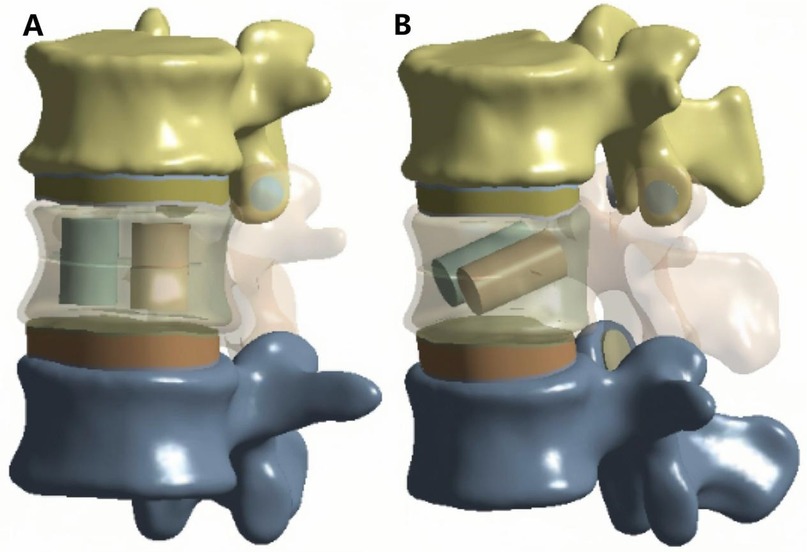
Figure 2. Bone cement distribution map. (A) VG, vertical group. (B) IG, incline group.
Construction of PEA model
Finite element analysis (FEA) was performed using ANSYS 19.0 (ANSYS Inc., USA). The complete three-dimensional model consisted of cortical bone, cancellous bone, bone cement, upper and lower endplates, annulus fibrosus, nucleus pulposus, and articular cartilage. Ligamentous structures, including the anterior longitudinal ligament (ALL), posterior longitudinal ligament (PLL), ligamentum flavum (LF), interspinous ligament (ISL), supraspinous ligament (SSL), capsular ligament (CL), and intertransverse ligament (ITL), were also incorporated.
The cortical bone, cancellous bone, bone cement, endplates, intervertebral discs, and articular cartilage were defined as linear elastic isotropic materials, while the ligaments were modeled as hyperelastic elements that bear only tensile loads (27, 28) (Figure 3A; Table 1).
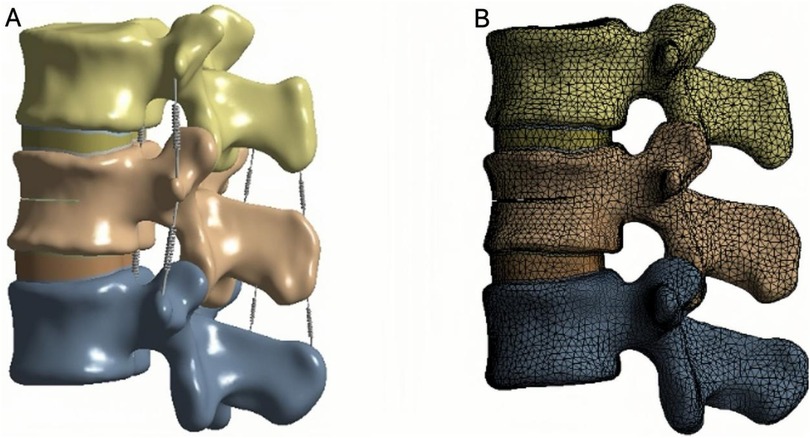
Figure 3. (A) L1–L3 finite element analysis model. (B) Mesh division of finite element model.
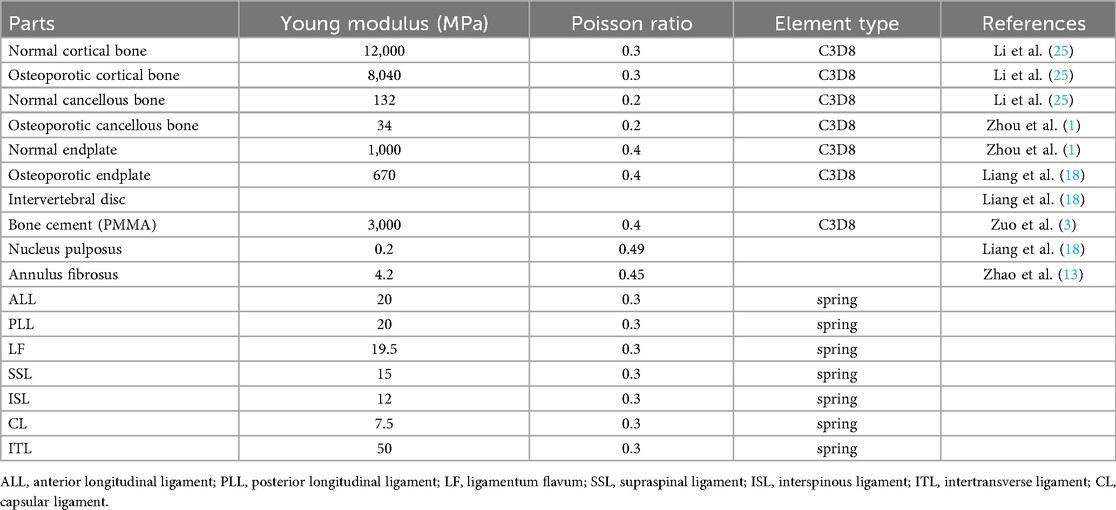
Table 1. Material properties of finite element analysis models.
The endplates, cancellous bone, and bone cement were meshed with an element size of 2 mm; the cortical bone with 3 mm; the intervertebral disc (nucleus pulposus and annulus fibrosus) with 1.2 mm; and the articular cartilage with 0.8 mm (13, 29). Meshes, nodes, and elements were automatically generated by the software. The interfaces between the endplates and vertebral bodies, between endplates and discs, and between articular cartilage and bone were bonded to prevent relative motion (Figure 3B).
Finite element analysis
To ensure boundary stability, the inferior surface of the L3 vertebra was fixed in all directions. A vertical compressive load of 500 N was applied to the superior surface of L1 to simulate the physiological load during upright posture (Figure 4A). In addition, a moment of 7.5 N·m was applied to reproduce six loading conditions of the lumbar spine: flexion, extension, left and right lateral bending, and left and right axial rotation (21) (Figure 4B).According to the three-column spinal load theory, 85% of the load was distributed to the anterior and middle columns, and 15% to the posterior column (25).
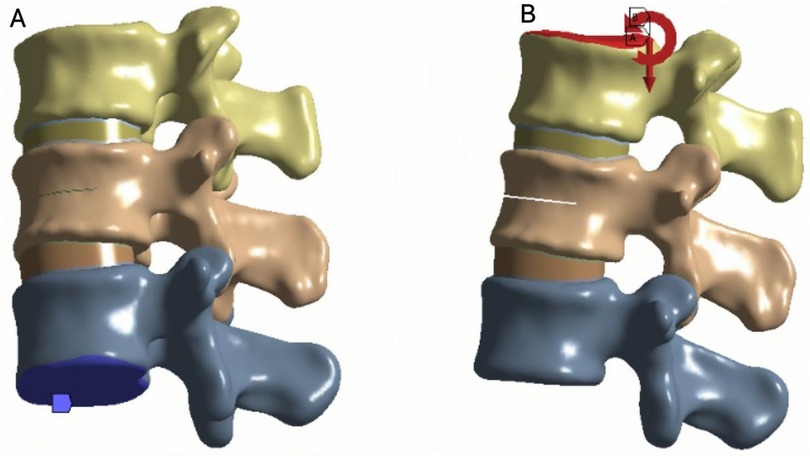
Figure 4. (A) Fix the lower surface of L3. (B) Apply a downward force of 500 N to the upper surface of L1 while applying a torque of 7.5 N.m.
Observation indicators
The magnitude and distribution of von Mises stress within each vertebra and intervertebral disc were calculated. The maximum displacement of the L2 vertebra was also measured. Von Mises stress was used to evaluate localized stress concentration and potential damage risk, whereas maximum displacement reflected the overall stability and deformation behavior of the spinal segment.
Mesh convergence verification of finite element models
A mesh convergence study was conducted to verify the numerical results. Four models with progressively coarser element sizes in the L1–L3 segments (element sizes of 2.0, 2.5, 3.0, and 3.3 mm) were generated, and the maximum stress was evaluated for each. The analysis showed that the difference in maximum stress between the 2.5 mm and 3.0 mm meshes was less than 5%, meeting the convergence criterion. Considering that the 3.0 mm mesh ensures acceptable accuracy while substantially improving computational efficiency, it was selected as the final mesh size for the vertebral region (Table 2).
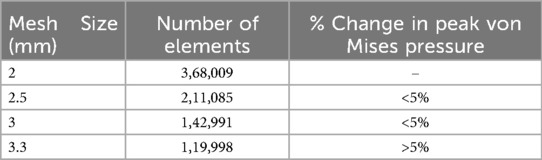
Table 2. The mesh convergence test.
Model verification
The L1–L3 finite element model was validated under the same loading conditions by comparing the predicted range of motion (ROM) with data reported in previous biomechanical studies (30, 31). The simulated ROM values were consistent with those from prior experimental investigations (Figure 5), confirming the rationality, accuracy, and applicability of the constructed model for subsequent biomechanical simulations.
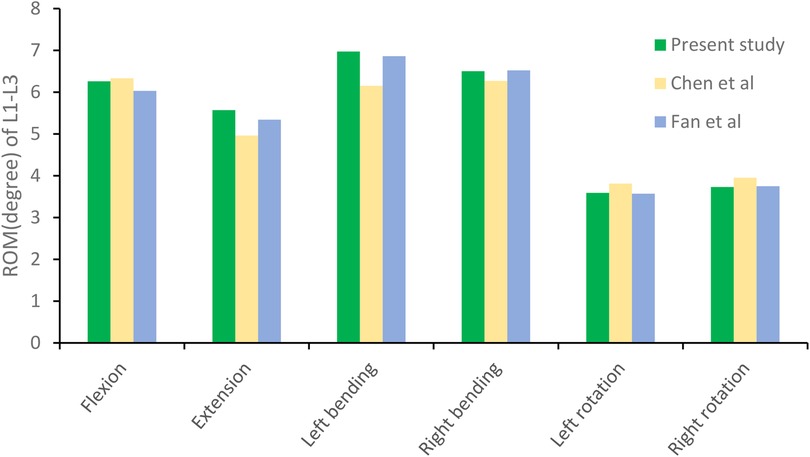
Figure 5. The range of motion (ROM) of the lumbar spine model in this study was compared with previously reported values.
Results
The magnitude of von Mises stress of the L2 vertebral body
In the L2 vertebra, the vertical group (VG) demonstrated a consistent reduction in maximum von Mises stress compared with the inclined group (IG) and fracture group (FG) under all six loading conditions. The maximum stresses in the IG were 99.99, 37.47, 72.80, 95.01, 68.57, and 58.14 MPa, respectively, whereas those in the VG were reduced to 88.21, 35.83, 60.15, 87.27, 52.81, and 54.05 MPa (Figures 6, 7).
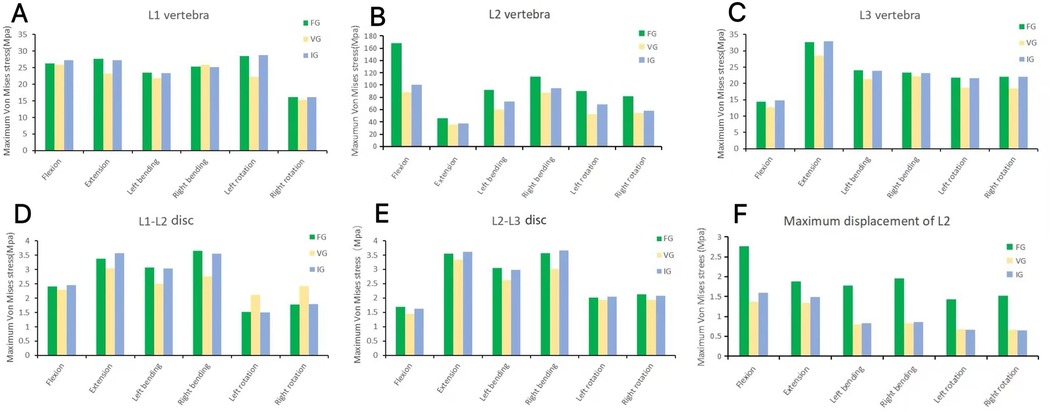
Figure 6. The maximum von Mises stress in the vertebrae (A–C) and intervertebral discs (D,E), and the displacement of L2 (F). FG, fracture group; IG, incline group; VG, vertical group.
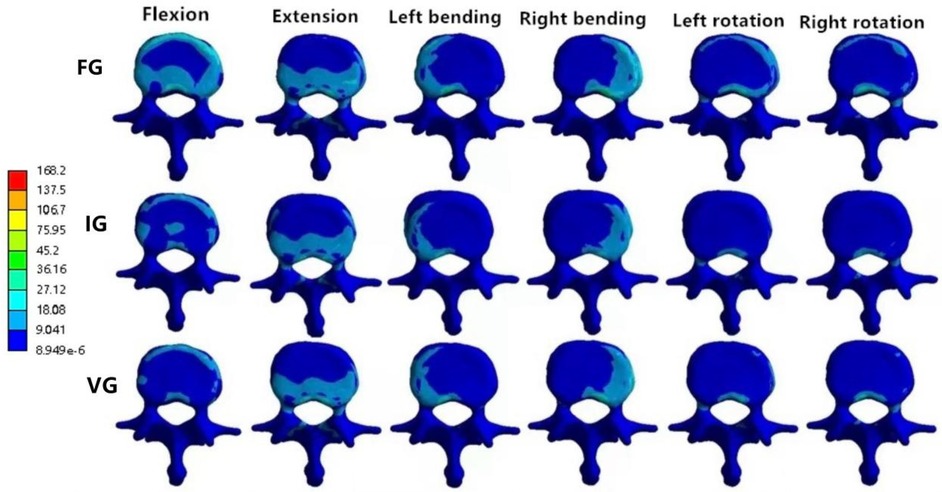
Figure 7. The distributions of the von Mises stress on L2. The distributions of the von Mises stress on L2 in FG, IG, and VG under flexion, extension, left/right bending, and left/right torsion.
The magnitude of von Mises stress of L1 and L3 vertebral bodies
In the L1 vertebra, the VG exhibited lower maximum stress than both the FG and IG during extension, left lateral bending, and left/right axial rotation, whereas the values during flexion and right bending were comparable among the three groups. Under the six loading conditions, the maximum stresses in the IG were 27.23, 27.28, 23.40, 25.19, 28.73, and 16.08 MPa, respectively; in contrast, the VG showed reduced values of 25.81, 23.24, 21.83, 25.83, 22.19, and 15.33 MPa.In the L3 vertebra, the VG demonstrated a marked decrease in maximum stress compared with both the FG and IG under all loading conditions (Figures 6, 8, 9).
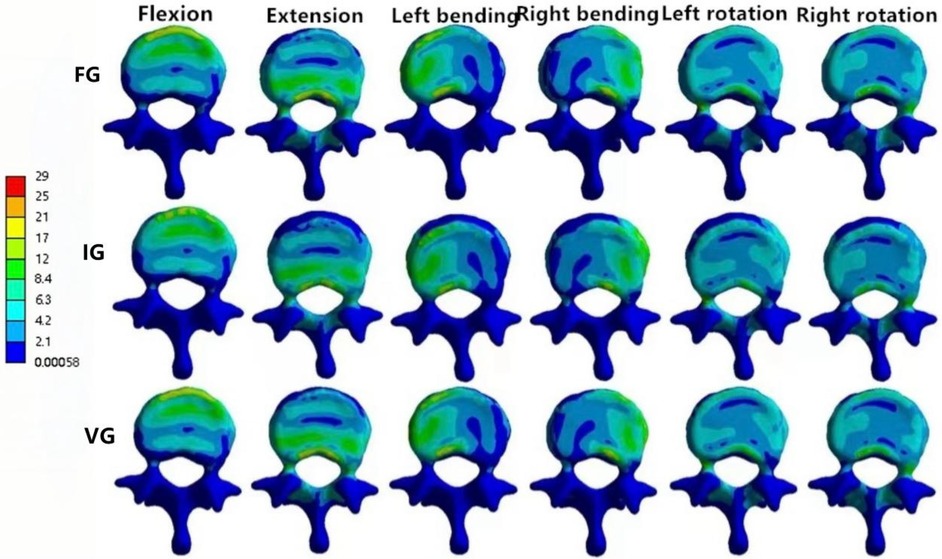
Figure 8. The distributions of the von Mises stress on L1. The distributions of the von Mises stress on L1 in FG, IG, and VG under flexion, extension, left/right bending, and left/right torsion.
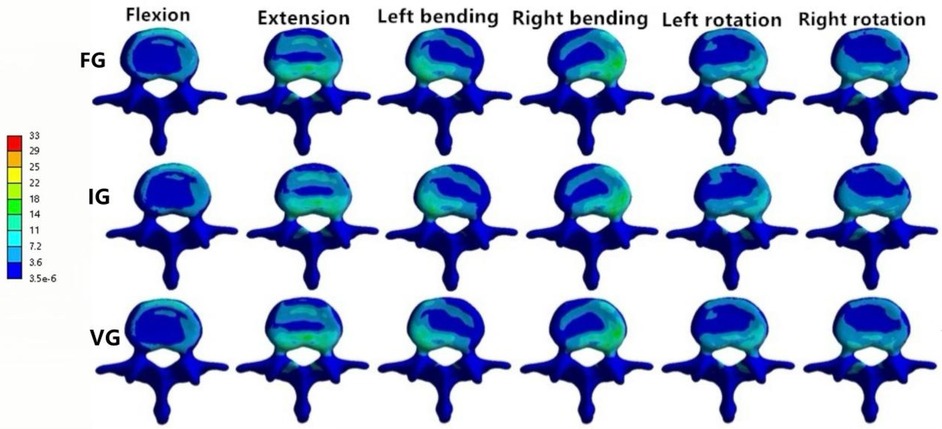
Figure 9. The distributions of the von Mises stress on L3. The distributions of the von Mises stress on L3 in FG, IG, and VG under flexion, extension, left/right bending, and left/right torsion.
Magnitude of von Mises stress of intervertebral discs
In the L1–L2 intervertebral disc, the VG exhibited lower maximum von Mises stress than the FG and IG during flexion, extension, and left/right bending, while slightly higher stress values were observed during left/right axial rotation (Figure 10).
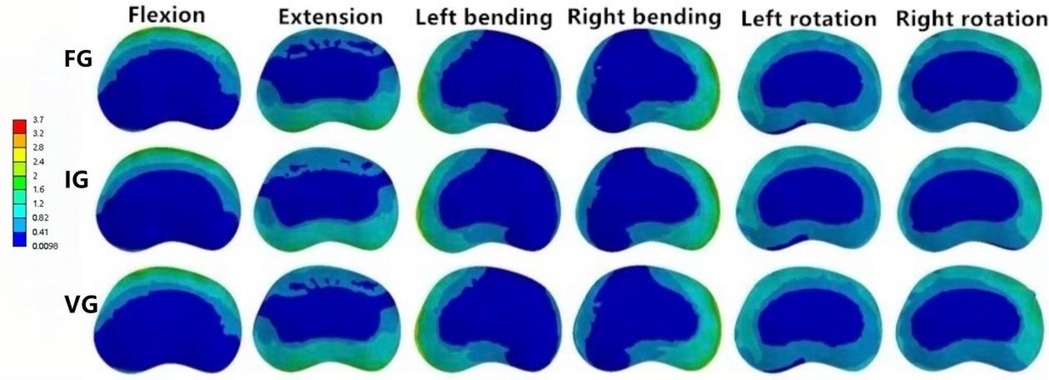
Figure 10. The distributions of the von Mises stress on the L1–L2 disc. The distributions of the von Mises stress on the L1–L2 disc in FG, IG, and VG under flexion, extension, left/right bending, and left/right torsion.
In the L2–L3 intervertebral disc, the VG model exhibited lower disc stress than the FG and IG models under all conditions (Figure 11).
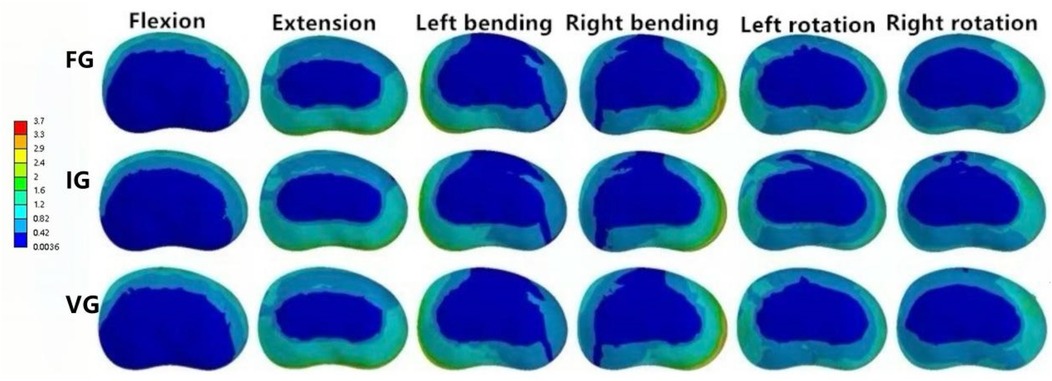
Figure 11. The distributions of the von Mises stress on the L2–L3 disc. The distributions of the von Mises stress on the L2–L3 disc in FG, IG, and VG under flexion, extension, left/right bending, and left/right torsion.
The maximum displacement of L2
Compared with the FG, both the IG and VG models demonstrated reduced maximum displacement of the L2 vertebra under all loading conditions. Under flexion and extension, the VG exhibited lower displacement values than the IG, indicating improved stability. During left/right bending and left/right rotation, the displacements of the VG and IG were approximately equivalent (Figure 12).
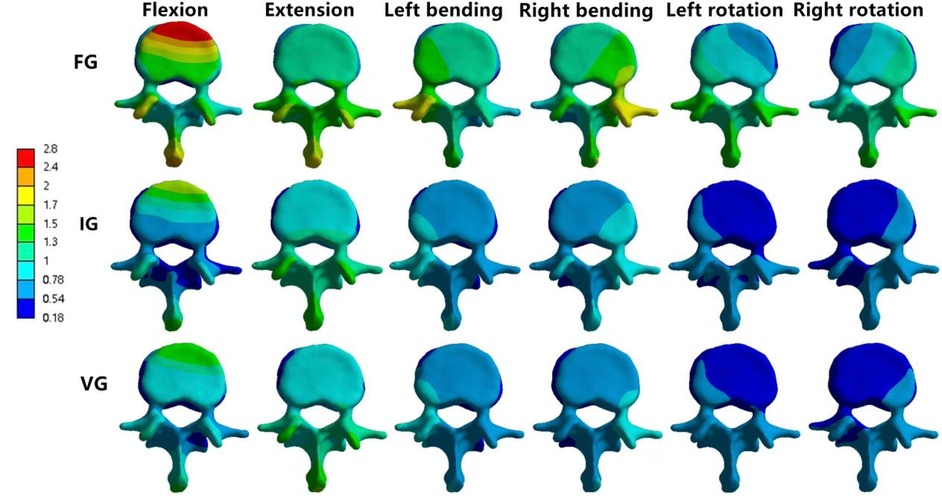
Figure 12. The maximum displacement of L2. The maximum Displacement of L2 in FG, IG, and VG under flexion, extension, left/right bending, and left/right torsion.
Discussion
Percutaneous vertebroplasty (PVP) has become one of the primary treatment options for osteoporotic vertebral compression fractures (OVCFs) owing to its proven clinical efficacy (32). However, as the procedure has gained popularity, reports of complications such as residual pain, secondary fractures, and loss of vertebral height have also increased (9, 33). Previous studies have indicated that both the distribution pattern and the volume of bone cement are key biomechanical factors associated with these complications (34). Accordingly, this study investigated the biomechanical effects of bone cement distribution using finite element analysis.
Several studies have demonstrated that the distribution pattern and injection volume of bone cement significantly influence the risk of refracture following PVP (35). In the present study, the maximum von Mises stress of the L2 vertebral body was markedly lower in the vertical group (VG) than in the other two models, suggesting that a uniform and symmetric cement distribution more effectively balances stress within the vertebra. In contrast, an inclined cement distribution results in asymmetric load transmission and stress concentration. Zhou et al. (36) reported that asymmetric cement distribution increases the likelihood of refracture in the augmented vertebra, while Wu et al. (34) found that symmetric cement distribution provides better stabilization of the fractured vertebra and reduces micromotion of the trabeculae, thereby alleviating pain and preserving vertebral height.
It is worth noting that cement volume is another critical determinant of postoperative biomechanics. To isolate the independent effect of distribution morphology, the cement volume in this study was standardized at 4 ml based on prior research (1, 34). Nonetheless, a potential interaction between cement volume and distribution pattern must be considered. Rohlmann et al. (37) demonstrated that cement volume strongly influences the maximum stress borne by the vertebrae. We speculate that at smaller volumes, the cement may fail to form an adequate internal support structure, thereby diminishing the benefits of favorable distribution patterns such as the symmetry seen in VG. Conversely, excessive cement volumes may increase vertebral stiffness, potentially leading to stress shielding and overloading of adjacent vertebrae. Future studies should therefore explore a broader range of cement volumes (e.g., 2–6 ml) in combination with different distribution patterns to identify optimal biomechanical parameters for specific clinical situations.
The displacement of the injured vertebra reflects the stability of the augmented segment (1). In this study, both the VG and IG models exhibited substantially reduced displacement compared with the fracture model (FG) under all six loading conditions, indicating that cement augmentation effectively enhances vertebral stability. Furthermore, the VG exhibited lower displacement values than the IG under flexion, extension, and lateral bending, suggesting that vertical cement distribution more effectively limits spinal micromotion and restores segmental stability.
An increased load on adjacent vertebrae following augmentation is a major cause of subsequent fractures (38). Nagaraja et al. (39) reported that bone cement reinforcement can double the incidence of fractures in the vertebra immediately superior to the treated segment. In the current study, the VG exhibited reduced maximum stress in the L1 vertebra during flexion, extension, and rotation compared with the other groups. Similarly, in the L3 vertebra, the VG showed the lowest maximum stress across all loading conditions. These findings suggest that vertically distributed bone cement restores the load-bearing capacity of the treated vertebra while reducing axial load transmission to adjacent levels, thereby potentially lowering the risk of refracture. However, the VG demonstrated slightly higher stress values during lateral bending than the IG, implying that excessive lateral bending movements should be avoided during postoperative rehabilitation to minimize stress transfer to adjacent segments.
Rohlmann et al. (37) found that bone cement infiltration can increase intradiscal pressure by approximately 20%. Zhao et al. (40) further reported that elevated intradiscal pressure impairs nutrient diffusion and reduces the metabolic activity of intervertebral disc cells, potentially leading to cell death. In this study, the VG exhibited lower maximum stress in the L1–L2 disc during flexion, extension, and lateral bending but higher stress during rotation. This may be attributable to the mechanical interaction between the posterior spinal elements, particularly the facet joints. During rotation, the facet joints bear the majority of the torsional load and restrict motion. When bone cement is distributed symmetrically in a vertical configuration, it most effectively restores the stiffness and load-bearing capacity of the anterior and middle columns. Consequently, a greater portion of the rotational torque is transferred to and absorbed by the posterior elements, including the facet joints. In contrast, an inclined cement distribution may partially disrupt uniform load transfer in the anterior column, thereby altering torque transmission across the motion segment. This redistribution may reduce the load borne by the facet joints and subsequently decrease the shear stress transmitted to the posterior annulus fibrosus during rotation.In the L2–L3 disc, the VG exhibited lower maximum stress than both the FG and IG, suggesting that vertical cement distribution can alleviate intervertebral disc stress. Nevertheless, it is advisable to limit rotational activities during postoperative rehabilitation to mitigate the risk of accelerated disc degeneration.
This study has several limitations. First, in assessing vertebral stability after cement augmentation, the material properties of cortical bone, cancellous bone, and soft tissues were simplified as isotropic linear elastic materials. Although this assumption may influence absolute stress and displacement values, it has been widely adopted and validated in comparative biomechanical analyses of spinal implants. For example, Zhou et al. (1) applied a similar linear elasticity model to evaluate cement distribution patterns and successfully identified biomechanical distinctions between surgical strategies. Second, the trabecular bone exhibits heterogeneous density and irregular fracture propagation, resulting in variable cement morphologies in clinical practice. To standardize model construction and ensure reproducibility, this study adopted a simplified cylindrical representation of cement, a method commonly used in finite element modeling. Dai et al. (26) reported that variations in cement morphology may slightly affect localized stress fields but do not alter the overall comparative conclusions regarding different filling techniques. This finding is consistent with Rohlmann et al. (41), who demonstrated that cement volume is the dominant factor affecting maximum vertebral stress, whereas cement morphology exerts a relatively minor influenceFirst, in assessing vertebral stability after cement augmentation, the material properties of cortical bone, cancellous bone, and soft tissues were simplified as isotropic linear elastic materials. Although this assumption may influence absolute stress and displacement values, it has been widely adopted and validated in comparative biomechanical analyses of spinal implants. For example, Zhou et al. (1) applied a similar linear elasticity model to evaluate cement distribution patterns and successfully identified biomechanical distinctions between surgical strategies. Second, the trabecular bone exhibits heterogeneous density and irregular fracture propagation, resulting in variable cement morphologies in clinical practice. To standardize model construction and ensure reproducibility, this study adopted a simplified cylindrical representation of cement, a method commonly used in finite element modeling. Dai et al. (26) reported that variations in cement morphology may slightly affect localized stress fields but do not alter the overall comparative conclusions regarding different filling techniques. This finding is consistent with Rohlmann et al. (41), who demonstrated that cement volume is the dominant factor affecting maximum vertebral stress, whereas cement morphology exerts a relatively minor influence. Finally, finite element analysis inherently simplifies physiological conditions, as vertebrae are subjected to complex, multidirectional forces during daily activities. Therefore, while the model offers valuable biomechanical insights, it cannot fully replicate the multifactorial loading environment experienced in vivo, which may limit the precision of clinical extrapolation.
Conclusion
Using finite element analysis, this study compared the biomechanical behavior of vertical (VG) and inclined (IG) bone cement distribution patterns. The results demonstrated that the VG configuration provides superior stabilization of fractured vertebrae and achieves a more balanced distribution of stress across the vertebrae and intervertebral discs. These findings suggest that vertical cement distribution offers a biomechanically advantageous strategy for vertebral augmentation and may serve as a valuable reference for optimizing surgical techniques in clinical practice.
Data availability statement
The original contributions presented in the study are included in the article/Supplementary Material, further inquiries can be directed to the corresponding author.
Ethics statement
The studies involving humans were approved by the Ethics Committee of Fujian Medical University Union Hospital (No. 20240109). The studies were conducted in accordance with the local legislation and institutional requirements. The participants provided their written informed consent to participate in this study.
Author contributions
WY: Writing – original draft, Formal analysis. JC: Software, Writing – original draft. BL: Project administration, Writing – review & editing. EF: Writing – review & editing, Conceptualization.
Funding
The author(s) declare that no financial support was received for the research and/or publication of this article.
Conflict of interest
The authors declare that the research was conducted in the absence of any commercial or financial relationships that could be construed as a potential conflict of interest.
Generative AI statement
The author(s) declare that no Generative AI was used in the creation of this manuscript.
Any alternative text (alt text) provided alongside figures in this article has been generated by Frontiers with the support of artificial intelligence and reasonable efforts have been made to ensure accuracy, including review by the authors wherever possible. If you identify any issues, please contact us.
Publisher's note
All claims expressed in this article are solely those of the authors and do not necessarily represent those of their affiliated organizations, or those of the publisher, the editors and the reviewers. Any product that may be evaluated in this article, or claim that may be made by its manufacturer, is not guaranteed or endorsed by the publisher.
Abbreviations
PVP, percutaneous vertebroplasty; PKP, percutaneous kyphoplasty; OVCF, osteoporotic vertebral compression fracture; ROM, range of motion; PEA, finite element analysis; SSL, supraspinous ligament; ISL, interspinous ligamen; CL, capsular ligaments; TTL, intertransverse ligament; PLL, posterior longitudinal ligament; ALL, anterior longitudinal ligament; LF, ligamentum flavum.
References
1. Zhou C, Meng X, Huang S, Chen H, Zhou H, Liao Y, et al. Biomechanical study of different bone cement distribution on osteoporotic vertebral compression fracture: a finite element analysis. Heliyon. (2024) 10(5):e26726. doi: 10.1016/j.heliyon.2024.e26726
2. Johnston CB, Dagar M. Osteoporosis in older adults. Med Clin North Am. (2020) 104(5):873–84. doi: 10.1016/j.mcna.2020.06.004
3. Zuo X-H, Chen Y-B, Xie P, Zhang W-D, Xue X-Y, Zhang Q-X, et al. Finite element analysis of wedge and biconcave deformity in four different height restoration after augmentation of osteoporotic vertebral compression fractures. J Orthop Surg Res. (2021) 16(1):138. doi: 10.1186/s13018-021-02225-8
4. Bandeira L, Silva BC, Bilezikian JP. Male osteoporosis. Arch Endocrinol Metab. (2022) 66(5):739–47. doi: 10.20945/2359-3997000000563
5. Harris K, Zagar CA, Lawrence KV. Osteoporosis: common questions and answers. Am Fam Physician. (2023) 107(3):238–46.36920813
6. Luo Y, Jiang T, Guo H, Lv F, Hu Y, Zhang L. Osteoporotic vertebral compression fracture accompanied with thoracolumbar fascial injury: risk factors and the association with residual pain after percutaneous vertebroplasty. BMC Musculoskelet Disord. (2022) 23(1):343. doi: 10.1186/s12891-022-05308-7
7. Dai C, Liang G, Zhang Y, Dong Y, Zhou X. Risk factors of vertebral re-fracture after PVP or PKP for osteoporotic vertebral compression fractures, especially in Eastern Asia: a systematic review and meta-analysis. J Orthop Surg Res. (2022) 17(1):161. doi: 10.1186/s13018-022-03038-z
8. Chandra RV, Maingard J, Asadi H, Slater L-A, Mazwi T-L, Marcia S, et al. Vertebroplasty and kyphoplasty for osteoporotic vertebral fractures: what are the latest data? AJNR Am J Neuroradiol. (2018) 39(5):798–806. doi: 10.3174/ajnr.A5458
9. Noguchi T, Yamashita K, Kamei R, Maehara J. Current status and challenges of percutaneous vertebroplasty (PVP). Jpn J Radiol. (2023) 41(1):1–13. doi: 10.1007/s11604-022-01322-w
10. Clark W, Diamond T. Early vertebroplasty for severely painful acute osteoporotic compression fractures: a critical review of the literature. Cardiovasc Intervent Radiol. (2023) 46(11):1439–46. doi: 10.1007/s00270-022-03348-z
11. Sørensen ST, Kirkegaard AO, Carreon L, Rousing R, Andersen MØ. Vertebroplasty or kyphoplasty as palliative treatment for cancer-related vertebral compression fractures: a systematic review. Spine J. (2019) 19(6):1067–75. doi: 10.1016/j.spinee.2019.02.012
12. Park S, Choi SS, Kim H, Byun SY, Lee CH. Risk factors for new vertebral compression fracture after vertebroplasty and efficacy of osteoporosis treatment: a STROBE-compliant retrospective study. Medicine. (2023) 102(47):e35042. doi: 10.1097/MD.0000000000035042
13. Zhao WT, Qin DP, Zhang XG, Wang ZP, Tong Z. Biomechanical effects of different vertebral heights after augmentation of osteoporotic vertebral compression fracture: a three-dimensional finite element analysis. J Orthop Surg Res. (2018) 13(1):32. doi: 10.1186/s13018-018-0733-1
14. Liebschner MA, Rosenberg WS, Keaveny TM. Effects of bone cement volume and distribution on vertebral stiffness after vertebroplasty. Spine. (2001) 26(14):1547–54. doi: 10.1097/00007632-200107150-00009
15. Lu J, Huang L, Chen W, Luo Z, Yang H, Liu T. Bilateral percutaneous kyphoplasty achieves more satisfactory outcomes compared to unilateral percutaneous kyphoplasty in osteoporotic vertebral compression fractures: a comprehensive comparative study. J Back Musculoskelet Rehabil. (2023) 36(1):97–105. doi: 10.3233/BMR-210225
16. Zhang L, Wang Q, Wang L, Shen J, Zhang Q, Sun C. Bone cement distribution in the vertebral body affects chances of recompression after percutaneous vertebroplasty treatment in elderly patients with osteoporotic vertebral compression fractures. Clin Interv Aging. (2017) 12:431–6. doi: 10.2147/CIA.S113240
17. Lin J, Zuo W, Wu P, Li X, Meng H, Li J, et al. Nine-grid area division method: a new ideal bone puncture region for percutaneous vertebroplasty in lumbar spine. J Vis Exp. (2024) 210:e66906. doi: 10.3791/66906
18. Liang D, Ye L-Q, Jiang X-B, Yang P, Zhou G-Q, Yao Z-S, et al. Biomechanical effects of cement distribution in the fractured area on osteoporotic vertebral compression fractures: a three-dimensional finite element analysis. J Surg Res. (2015) 195(1):246–56. doi: 10.1016/j.jss.2014.12.053
19. Tan L, Wen B, Guo Z, Chen Z. The effect of bone cement distribution on the outcome of percutaneous vertebroplasty: a case cohort study. BMC Musculoskelet Disord. (2020) 21(1):541. doi: 10.1186/s12891-020-03568-9
20. Carpenter RD, Klosterhoff BS, Torstrick FB, Foley KT, Burkus JK, Lee CSD, et al. Effect of porous orthopaedic implant material and structure on load sharing with simulated bone ingrowth: a finite element analysis comparing titanium and PEEK. J Mech Behav Biomed Mater. (2018) 80:68–76. doi: 10.1016/j.jmbbm.2018.01.017
21. Zhang X, Chen T, Meng F, Li S, Xu G, Yan J, et al. A finite element analysis on different bone cement forms and injection volumes injected into lumbar vertebral body in percutaneous kyphoplasty. BMC Musculoskelet Disord. (2022) 23(1):621. doi: 10.1186/s12891-022-05522-3
22. Polikeit A, Ferguson SJ, Nolte LP, Orr TE. Factors influencing stresses in the lumbar spine after the insertion of intervertebral cages: finite element analysis. Eur Spine J. (2003) 12(4):413–20. doi: 10.1007/s00586-002-0505-8
23. Cho AR, Cho SB, Lee JH, Kim KH. Effect of augmentation material stiffness on adjacent vertebrae after osteoporotic vertebroplasty using finite element analysis with different loading methods. Pain Physician. (2015) 18(6):E1101–10. doi: 10.36076/ppj.2015/18/E1101
24. Zhou Q, Wan Y, Ma L, Dong L, Yuan W. Percutaneous curved vertebroplasty decrease the risk of cemented vertebra refracture compared with bilateral percutaneous kyphoplasty in the treatment of osteoporotic vertebral compression fractures. Clin Interv Aging. (2024) 19:289–301. doi: 10.2147/CIA.S438036
25. Li H, Xiao C, Pan H, Lei Y, Wang H, Li S. Biomechanical study between percutaneous vertebroplasty combined with cement pedicle plasty improves vertebral biomechanical stability: a finite element analysis. BMC Musculoskelet Disord. (2024) 25(1):597. doi: 10.1186/s12891-024-07689-3
26. Dai H, Liu Y, Han Q, Zhang A, Chen H, Qu Y, et al. Biomechanical comparison between unilateral and bilateral percutaneous vertebroplasty for osteoporotic vertebral compression fractures: a finite element analysis. Front Bioeng Biotechnol. (2022) 10:978917. doi: 10.3389/fbioe.2022.978917
27. Peng Y, Du X, Huang L, Li J, Zhan R, Wang W, et al. Optimizing bone cement stiffness for vertebroplasty through biomechanical effects analysis based on patient-specific three-dimensional finite element modeling. Med Biol Eng Comput. (2018) 56(11):2137–50. doi: 10.1007/s11517-018-1844-x
28. Mondal S, MacManus DB, Banche-Niclot F, Vitale-Brovarone C, Fiorilli S, McCarthy HO, et al. Finite element analysis of vertebroplasty in the osteoporotic T11-L1 vertebral body: effects of bone cement formulation. J Biomed Mater Res B Appl Biomater. (2024) 112(1):e35359. doi: 10.1002/jbm.b.35359
29. Pan H, Li H, Liu T, Xiao C, Li S. Finite element analysis of precise puncture vertebral augmentation in the treatment of different types of osteoporotic vertebral compression fractures. BMC Musculoskelet Disord. (2024) 25(1):599. doi: 10.1186/s12891-024-07735-0
30. Fan Z, Huang H, Lin Y, Zhou J, Lin F, Chen B, et al. Do we have to pursue complete reduction after PVA in osteoporotic vertebral compression fractures: a finite element analysis. Injury. (2022) 53(8):2754–62. doi: 10.1016/j.injury.2022.06.013
31. Chen CS, Cheng CK, Liu CL, Lo WH. Stress analysis of the disc adjacent to interbody fusion in lumbar spine. Med Eng Phys. (2001) 23(7):483–91. doi: 10.1016/s1350-4533(01)00076-5
32. Song Q, Zhao Y, Li D, Liu Z, Zhang Y, Shang D, et al. Effect of different bone cement distributions in percutaneous kyphoplasty on clinical outcomes for osteoporotic vertebral compression fractures: a retrospective study. Medicine. (2023) 102(12):e33309. doi: 10.1097/MD.0000000000033309
33. Zhang Z, Zhang J, He B, Dong Q, Hao D. Effect of bone cement distribution on adjacent disc degeneration after vertebral augmentation for osteoporotic vertebral compression fractures in aging patients. Front Surg. (2023) 10:1256401. doi: 10.3389/fsurg.2023.1256401
34. Wu W, Zhang X, Li X, Yu S. The influence of diverse bone cement distribution patterns for metastatic vertebral lesions after bilateral percutaneous kyphoplasty. BMC Musculoskelet Disord. (2022) 23(1):713. doi: 10.1186/s12891-022-05680-4
35. Yu W, Xiao X, Zhang J, Li Z, Wang X, Tang F, et al. Cement distribution patterns in osteoporotic vertebral compression fractures with intravertebral cleft: effect on therapeutic efficacy. World Neurosurg. (2019) 123:e408–15. doi: 10.1016/j.wneu.2018.11.181
36. Zhou C, Liao Y, Huang S, Li H, Zhu Z, Zheng L, et al. Effect of cement distribution type on clinical outcome after percutaneous vertebroplasty for osteoporotic vertebral compression fractures in the aging population. Front Surg. (2022) 9:975832. doi: 10.3389/fsurg.2022.975832
37. Rohlmann A, Zander T, Bergmann G. Spinal loads after osteoporotic vertebral fractures treated by vertebroplasty or kyphoplasty. Eur Spine J. (2006) 15(8):1255–64. doi: 10.1007/s00586-005-0018-3
38. Chiang CK, Wang YH, Yang CY, Yang BD, Wang JL. Prophylactic vertebroplasty may reduce the risk of adjacent intact vertebra from fatigue injury: an ex vivo biomechanical study. Spine. (2009) 34(4):356–64. doi: 10.1097/BRS.0b013e31819481b1
39. Nagaraja S, Awada HK, Dreher ML. Vertebroplasty increases trabecular microfractures in elderly female cadaver spines. Osteoporos Int. (2015) 26(7):2029–34. doi: 10.1007/s00198-015-3105-2
40. Zhao H, Ni CF, Huang J, Zhao S-M, Gu W-W, Jiang H, et al. Effects of bone cement on intervertebral disc degeneration. Exp Ther Med. (2014) 7(4):963–9. doi: 10.3892/etm.2014.1531
Keywords: osteoporosis, vertebral compression fracture, vertebroplasty, finite element analysis, bone cement distribution
Citation: Yang W, Chen J, Lin B and Feng E (2025) Biomechanical comparison of different bilateral percutaneous vertebroplasty in treating osteoporotic vertebral compression fractures: finite element analysis. Front. Surg. 12:1691126. doi: 10.3389/fsurg.2025.1691126
Received: 22 August 2025; Accepted: 17 October 2025;
Published: 6 November 2025.
Edited by:
Wenqi Song, Shanghai Jiao Tong University, ChinaReviewed by:
Mingzheng Zhang, Jishou University, ChinaDonghui Cao, Ningxia Medical University, China
Copyright: © 2025 Yang, Chen, Lin and Feng. This is an open-access article distributed under the terms of the Creative Commons Attribution License (CC BY). The use, distribution or reproduction in other forums is permitted, provided the original author(s) and the copyright owner(s) are credited and that the original publication in this journal is cited, in accordance with accepted academic practice. No use, distribution or reproduction is permitted which does not comply with these terms.
*Correspondence: Eryou Feng, ZmV5OTAwMUAxMjYuY29t
†These authors share first authorship