 Vera Colombo
 Marta Mondellini
 Andrea Aliverti
 Marco Sacco
- 1Istituto di Sistemi e Tecnologie Industriali Intelligenti per il Manifatturiero Avanzato, Consiglio Nazionale delle Ricerche, Lecco, Italy
- 2Dipartimento di Psicologia, Università Cattolica del Sacro Cuore, Milano, Italy
- 3Dipartimento di Elettronica Informazione e Bioingegneria, Politecnico di Milano, Milano, Italy
Introduction: Virtual Reality (VR) is a powerful tool for creating engaging and dynamic exercise environments that have the potential to change individuals' perception of effort during exercise. Despite its implications, especially in the rehabilitation field, a consensus on the factors related to VR that are most effective has not yet been reached in the literature.
Methods: The present study investigates how immersion and interaction influence perceived effort and subjective experience during exercise. Thirty-five young adults (age = 25.86 ± 4.96 y) participated in a single 40-min cycling session across four conditions: no VR, VR on a TV, VR with a headset, and VR with a headset plus an interactive task, all simulating a ride in a park.
Methods: A comprehensive literature search was conducted across PubMed, Embase, Scopus, and the Cochrane Library, resulting in 46 eligible peer-reviewed studies published between 2014 and 2024. These studies included randomized controlled trials, quasi-experimental designs, and observational studies, with an average sample size of approximately 35 participants. The inclusion criteria focused on studies utilizing VR as a therapeutic modality for motor or executive function recovery in post-stroke populations.
Results: Despite a direct influence on the rate of perceived effort could not be observed, participants reported higher physical effort, represented by higher breathing rate, and higher attention, when immersion and interaction were combined. Despite slight side effects, people enjoyed and felt more present in most immersive VR conditions, making it their preferred way to exercise.
Discussion: Future works should continue in two directions: extending the protocol by including other target groups, e.g., patients, and exploring other VR features.
1 Introduction
Physical activity is beneficial for physical and mental wellbeing of the whole population, regardless of age, gender, and health status (Bull et al., 2020). Moreover, for certain groups of individuals, such as people with chronic respiratory diseases or neurological disorders, regular exercise is pivotal in slowing disease progression and maintaining a high quality of life (Billinger et al., 2014; Xiang et al., 2022). Physical activity plays a fundamental role in rehabilitation programs across a wide range of medical conditions, contributing to improved functional capacity, quality of life, and overall health outcomes. Among various forms of exercise, cycling has gained particular relevance in rehabilitation settings, including respiratory diseases and neurorehabilitation.Its low-impact and rhythmic nature makes it well-tolerated by patients, while the symmetrical and repetitive movement pattern closely mimics aspects of gait, thereby supporting neuromotor recovery and facilitating the re-learning of walking. In respiratory rehabilitation, cycling also promotes cardiovascular fitness and enhances ventilatory efficiency, making it a valuable component of comprehensive therapeutic interventions (Barbosa et al., 2015; Laczko et al., 2016; Rodríguez and Rodríguez-Jaime, 2025). Despite this, the World Health Organization reports that over a quarter of the global adult population fails to engage in sufficient physical activity (Bull et al., 2020). Numerous factors, including low exercise tolerance, which is strictly related and ultimately limited by perception of effort, hinder many individuals from participating in physical activities (Marcora and Staiano, 2010). For instance, individuals with chronic respiratory diseases often experience breathlessness and fatigue even with minimal exercise intensity or during routine daily tasks (Spruit et al., 2013; Griffiths et al., 2000; Meyerbröker and Morina, 2021).
Virtual Reality (VR) is emerging as a powerful tool to offer engaging and motivating physical exercise scenarios that can modify one’s perception of effort. The immersive nature of VR environments, coupled with interactive elements, plays a pivotal role in shaping the user experience (Rose et al., 2018). Therefore, understanding the impact of immersion and interaction on different facets of exercise response and user experience is essential for harnessing the full potential of VR in promoting physical activity and improving overall wellbeing.
Immersion refers to the ability of VR to engage users in multisensory stimulation, effectively blocking out the physical reality, and is influenced by the extent to which the virtual environment fills the user’s field of view and the fidelity of the virtual representation (Slater and Wilbur, 1997). In experiential psychology, immersion is closely connected to the concept of flow, where participants enter into an extreme version of immersion, losing self-consciousness and experiencing a modified sense of time (Csikszentmihalyi and Csikzentmihaly, 1990). Immersion involves becoming deeply absorbed in an activity, while flow represents a peak state within immersion where individuals lose track of time and self-awareness (Jennett et al., 2008; Brown and Cairns, 2004). Unlike immersion, flow is consistently associated with positive emotions (Hudson et al., 2019). Interaction pertains to how users engage with the virtual content to navigate within the scenario and manipulate the virtual objects.
The literature presents diverse examples of studies investigating how VR can modify user experience during exercise and its consequences on perceived effort, performance and exercise tolerance. Focusing on cycling, the literature suggests that introducing a higher level of immersion through a virtual environment (VE) enhances enjoyment (Zeng et al., 2017; Plante et al., 2003; Mestre et al., 2011b), leading to a more satisfying and engaging workout experience. Few studies have also assessed the effects of cycling in VR and specific VR-related factors on perceived effort, exercise tolerance and performance. However, while the impact of immersion on enjoyment is apparent, its influence on perceived effort is less straightforward (Monedero et al., 2015). It has been suggested that VR promotes a shift in attentional focus, acting as a “distractor” from bodily sensations. Yet, further investigations are needed to fully grasp the relationship and causality chains between perceived exertion and enjoyment (Daniel et al., 2011). Concerning the performance, Yao and colleagues found that the same VE experienced in fully immersive VR induced participants to travel longer distances than when in non-immersive conditions (Yao and Kim, 2019). In addition, the characteristics of the virtual environment and the way of interaction can influence the individuals’ expectations of effort. If the visual stimuli represent a less strenuous effort induced by a discrepancy between the actual exercise workload and the visual representation of uphills that the user must overcome, higher exercise tolerance (Finnegan et al., 2023), lower perceived exertion and breathlessness may be achieved (Runswick et al., 2023). Finally, a study considered the type and number of virtual objects with which the user can interact, concluding that cycling in immersive VR while performing an interactive task, i.e., item detection task, induces participants to perform at a higher intensity despite feeling more significant pain. Conversely, participants who performed a more challenging item detection task did not change their exercise intensity. Still, they reported higher perceived quadriceps pain, likely due to the increased mental effort and energy requirement (Wender et al., 2022).
The existing studies offer indeed different perspectives with heterogeneous methodologies. Despite a consensus has not been reached yet, the potential effects of immersion and interaction on the user’s perception and experience during exercise emerge.
Within this scenario, our work primarily focuses on perceived effort, as a result of a clinical experience in which the potential of VR on perception during exercise has emerged. Our research group has developed a VR cycling system for endurance training for rehabilitation of individuals with chronic respiratory diseases that can be experienced in both semi and full-immersive modality (Colombo et al., 2024; Mondellini et al., 2023). In addition to high acceptability and satisfaction, patients reported through spontaneous comments that VR helped distract them from fatigue and breathlessness, with benefits, although only qualitative, on perceived effort. We developed an experimental protocol for quantitatively measuring such an effect. Our final goal is, therefore, to understand which key factors, specifically immersion and interaction, influence perceived effort the most. A preliminary study allowed the definition and validation of the protocol for quantitative measurements. It provided initial insights into the main research question, revealing no significant influence on perceived effort but suggesting an impact on the performance, represented by the cycling cadence, and the actual effort, expressed in terms of breathing rate, performed by the person (Colombo et al., 2022). The present work describes the results of a second study with a larger sample to enrich the objective evaluation with subjective assessments related to user experience, specifically enjoyment, spatial presence, and cybersickness. Including the evaluation of such subjective measures in the protocol is crucial especially before performing the study with patients. It allows understanding the potential effect on user experience including both positive (e.g., enjoyment, flow) and negative (i.e., cybersickness) potential effects.
2 Materials and methods
2.1 Study design
The study was designed as a within-subjects with four experimental conditions.
This experimental design was conceived to explore the impact of an increasingly engaging experience on physical exercise responses and subjective experience. Condition A provides a traditional activity without additional stimuli. Condition B involves a limited level of visual engagement, which is made more immersive in condition C. Finally, the interaction factor is added in condition D.
The experiment foresaw a single session, during which all participants performed the four conditions subsequently. The exposure to each condition was randomized. This randomization ensures that each participant was exposed to the experimental conditions in a different order, thus minimizing the risk of order effects such as learning, fatigue, or familiarity with the task. By randomizing the order, we aim to isolate the effects of each condition, while controlling for any confounding influence of exposure sequence. No formal rest periods were scheduled between conditions. While this means that residual effects, such as cybersickness or fatigue, cannot be fully excluded, the randomized order of conditions was intended to minimize systematic bias across participants.
2.2 Participants
Eligible participants were healthy young adults 18–40 years old, in good health condition, as they self-reported no known medical conditions at the time of the experiment and confirmed their ability to engage in mild/moderate physical activity for 30–60 min without any limitations or impairments. Participants were recruited between 1st September 2021 and 31st July 2022. Participants were excluded if they could not maintain the sitting position long, had severe visual impairment preventing a correct visualization of the virtual environment, or had a history of significant motion sickness or epilepsy. The study has been approved by the National Research Council institutional review board, i.e., the Research Ethics and Integrity Committee, with the Ethical Clearance protocol nr. 0,052,420/2021 [EC EVEREST] of 22nd July 2021. All participants signed a written informed consent before participating in the study and consented to data treatment in compliance with GDPR.
2.3 Procedure
The experimenter introduced the procedure and invited the participants to familiarize themselves with the setup. The height of the ergometer seat, the size of the HMD, and the chest strap were adjusted to fit with the individual anthropometric features. We then randomly generated the sequence of experimental conditions, gave the participants instructions on the experiment procedure, and introduced the questionnaires that would be administered at the end of each condition. The experiment consisted of five subsequent phases described in Figure 1.
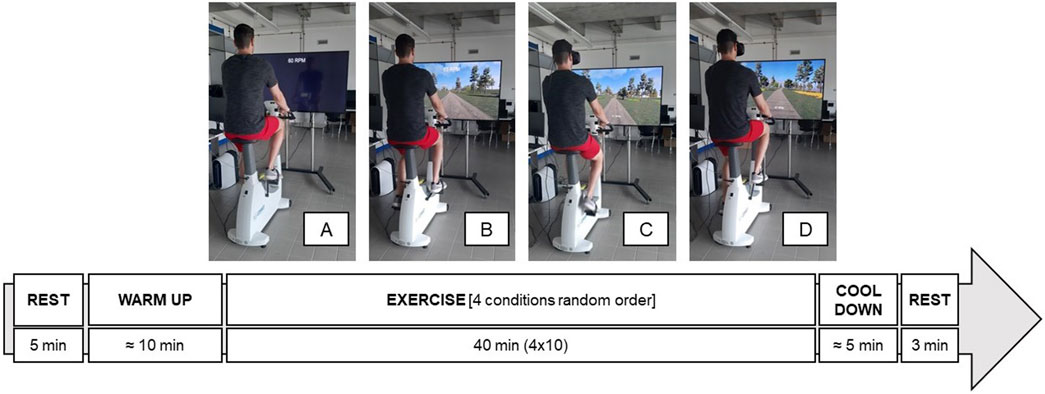
Figure 1. Experimental session procedure ((A), cycle only, (B), TV, (C), HMD, (D), HMD + interaction).
The session started with 5 minutes of rest, during which the participant was asked to stay relaxed and quiet while sitting on the ergometer without cycling. Heart rate and breathing rate were measured to obtain baseline physiological values prior to the experimental conditions. After 5 minutes, the participant was asked to take two breaths with maximum inspiration/expiration by inhaling/exhaling the maximum amount of air possible. Such baseline assessment was followed by a warm-up phase to identify the exercise intensity. The exercise intensity, represented by the workload (WL) of the ergometer, is kept constant during the four exercise conditions. The exercise WL, expressed in Watt, is defined as the one eliciting a heart rate within 57% and 76% of the maximum value of the heart rate of the subject (HRmax). To ensure that the heart rate would not exceed the range for the subsequent 40 min of exercise, we considered a heart rate value equal to 65% to start the experiment. The value of HRmax is derived from the subject’s age according to Fox’s equation (Fox et al., 1971). The range of %HRmax corresponds to a light to moderate intensity, according to the definition provided by the American College of Sports Medicine (Garber et al., 2011). The participant was asked to maintain a cycling cadence of 60 RPM while the experimenter gradually increased the workload starting from 30 W until the HR reached the target value. In the following four phases, lasting 10 min each, the participant cycled in the four experimental conditions, trying to keep a cycling speed corresponding to 60 RPM. The session ended with a cool-down phase and a final 3 minutes of rest.
2.4 Equipment
The experimental setup represented in Figure 2 is based on the Virtual Park system used by patients in our clinical studies (Colombo et al., 2024; Mondellini et al., 2023). Considering that they are the final target users of our investigation, such a choice would facilitate transferring our results to rehabilitation settings.
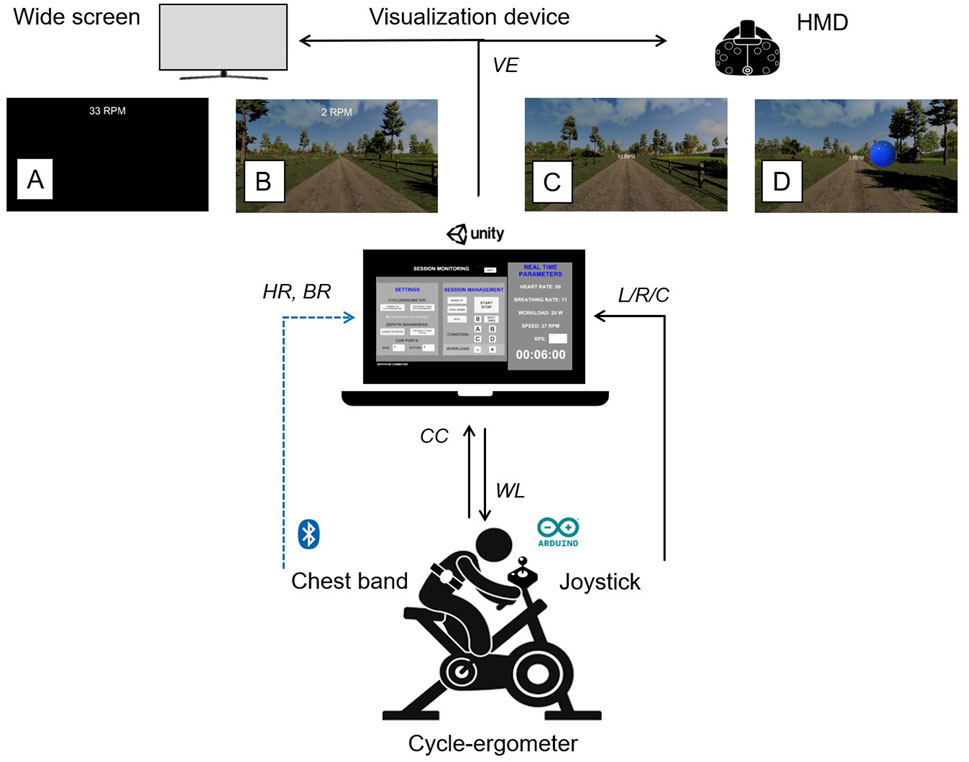
Figure 2. Experimental setup diagram. (VE, virtual environment; HMD, head mounted display; (A) cycle only, (B) TV, (C) HMD, (D) HMD + interaction; HR, heart rate; BR, breathing rate; CC, cycling cadence; L, left; R, right, C, center).
The equipment mainly included a stationary bike, a visualization device, a chest strap, and a VR application. The bike was the ergometer COSMED E100, a medical device that can be interfaced with third-party applications. The ergometer is connected via cable to a USB serial port for exchanging data with the VR application, namely, workload and cycling cadence. We used a Zephyr Bioharness 3.0 device that allows real-time recording of several physiological parameters, e.g., heart rate, respiratory rate, breathing waveform, core temperature, activity levels, and posture. The monitoring system comprises a Bluetooth module handling the data exchange and recording and an adjustable chest strap, available in three sizes and embedding different sensors. These include passive conductive ECG sensors, a pressure sensor pad for detecting breathing action, a thermistor, and a 3-axis accelerometer to estimate subject activity level and posture. The equipment also includes a joystick for the interaction with the VE (in condition D), which is connected through an Arduino DUE board programmed to send a signal indicating the position of the joystick among the three possible ones: neutral (joystick is in the center), left or right. As a visualization device, we used a 65″ Philips LCD TV monitor for TV condition and an HTC Vive first generation headset for HMD and HMD + interaction. Finally, we used a VR-ready laptop (Alienware 15 R4 with NVIDIA GeForce GTX 1080) to connect all the devices and display the VE. The VR application, developed in Unity, is organized into different modules, each implementing a specific functionality. The experimenter GUI module has two panels: one for creating the user profile and another for controlling the session. The first panel gathers user information, while the second manages device connections, experiment phases, and real-time physiological feedback. The virtual environment module consists of the virtual park and the UI panel shown to the participant. The 3D environment represents a park that can be explored by riding along a predefined circular path with a virtual bicycle, which is controlled by the user’s cycling movement. The path is flat with no hills and no abrupt changes of direction. For a more detailed description of the VE and its development, we refer the reader to our previous studies (Colombo et al., 2019; 2024). The UI panel is superimposed to the VE and shows textual information on the cycling cadence and the current phase of the experiment during rest, warm-up, and cool-down. The SteamVR plugin has also been imported to allow the application to be deployed for the HTC Vive. For condition D, we added an interactive task that can be performed using a joystick. The task is a simple Go/No-Go task, i.e., the user must act when the Go stimulus appears, while no action must be done when the No-Go stimulus is on. In our application, the stimuli are colored spheres appearing on both sides of the path at random intervals between 1 and 4 s. The participant has to “collect” the blue spheres while avoiding the red ones. To collect a sphere, they have to move the joystick to the right or left, depending on the sphere’s position relative to the path. The cycling module includes communication with the real ergometer and navigation within the VE through the movement of a virtual bicycle. The communication protocol allows retrieving the value of cycling cadence, which is used to control the movement in the VE, and changing the workload, during the first phase of the experiment in which the experimenter gradually increases the workload directly from the GUI of the Unity application. The navigation is controlled by the user him/herself: the cycle-ergometer cadence value expressed in revolutions per minute (RPM) is converted into the virtual speed value, corresponding to the visual representation’s flowing velocity. An empirical estimation has been made to identify the optimal conversion factor. As it happens in reality, if the rider stops pedaling, the VE continues to slide until the cycle-ergometer wheel stops rotating because of its inertia. The navigation occurs along a predefined circular route, which simulates a path in a park. The route has been created by placing subsequent nodes in predefined positions. Navigation occurs by interpolating these nodes in real-time through quaternion spherical interpolation (slerp). This module also communicates with the GUI module to visualize the updated parameters and control the workload during the warm-up phase. The physiological sensor module handles the communication with the Zephyr BioHarness chest strap, and the retrieval of the physiological data needed for controlling the experiment. To integrate the data in Unity at runtime, we developed two ad hoc libraries starting from the SDK provided by the producer. In such a way, the heart rate and breathing rate are integrated in the Unity application, can be visualized in the GUI, and are directly sent to the report module to save the session data. The report module generates the report file containing the data needed for the subsequent analysis. The file, in CSV format, is organized into four sections. The first includes the participant’s personal data (ID, age, weight, height) that the experimenter inserts in the GUI fields. The second part comprises raw data saved with a frequency of 1 Hz. The saved parameters are: heart rate, breathing rate, cycling cadence, workload, and a string identifier indicating the protocol phase (rest, warm-up, condition A, etc.). In the third part of the report file, the values of RPE for each condition are saved. The final part of the file includes the performance metrics of the additional task: number of collected and missed target items and number of errors).
2.5 Measurements
A demographic questionnaire was administered to collect information about participants: gender, age, usual weight and height, and habits related to physical activity and tobacco consumption. Objective and subjective outcomes were measured to investigate the effects of the experimental conditions. Objective data were recorded continuously during each experimental session. At the same time, the subjective evaluation consisted of a short questionnaire, administered at the end of each condition, that was made specifically for this study to fit the experiment procedure. In addition, we administered a preference questionnaire at the end of the experimental session.
2.5.1 Perceived effort
Perceived effort was the primary outcome, assessed through the Rate of Perceived Exertion (RPE). At the end of each experimental condition, the experimenter showed the participants the 6–20 Borg scale and asked them to rate the degree of perceived effort they felt at that moment.
2.5.2 Breathing rate
The breathing rate (BR), representing the actual physical effort performed by the participant, was measured through the Zephyr sensor with a sampling frequency of 25 Hz.
2.5.3 Heart rate
The Zephyr sensor measured the heart rate (HR) sampled at 250 Hz. The value of HR was used to control the intensity of exercise, which should not exceed the expected range (i.e., 57%–76% of HRmax).
2.5.4 Cycling cadence
The cycling cadence was measured by the cycle-ergometer and expressed in revolutions per minute (RPM).
2.5.5 Enjoyment
The enjoyment was assessed by asking participants to rate the agreement on a five-point Likert scale with the following sentence: “I enjoyed doing this activity”. The item is taken from the interest/enjoyment sub-scale of the Intrinsic Motivation Inventory (IMI) questionnaire (McAuley et al., 1989) and slightly modified.
2.5.6 Self-perceived attention
Similarly, the self-perceived attention assessment, taken from the IMI questionnaire, consisted of a rating on a scale from one to five in agreement with the following statement: “This activity held my attention”.
2.5.7 Flow
The state of flow assessment focused on the transformation of time and investigated how long, in the participants’ opinion, the exercise lasted in minutes. This question takes inspiration from the transformation of time dimension of the flow state (Jackson and Marsh, 1996). Although flow is a multifaceted construct, we decided to focus on time perception as a proxy for flow because it has been shown in prior literature to be a robust and sensitive indicator of immersive engagement, particularly in physical activity contexts and virtual environments. Several studies have found that subjective time distortion - typically, time underestimation - strongly correlates with deep involvement and flow states Block and Zakay (1997).
2.5.8 Spatial presence
The spatial presence was measured only after conditions B, C, and D, based on the questionnaire proposed by Hendrix and Barfield (Hendrix and Barfield, 1995); this item asked to indicate from 0 to 100 the level of presence experienced.
2.5.9 Cybersickness
Finally, the subjects were asked if they had experienced any form of discomfort, even slight, during the experience, to assess any side effects related to cybersickness (only for immersive conditions C and D). We decided to evaluate cybersickness only in the most immersive modalities based on previous studies in which the reported sickness was low or absent during pedaling while viewing a screen (Mittelstaedt et al., 2018; Mondellini et al., 2018). If the participant answered affirmatively, the type of side-effect was investigated to be able to trace it to one of the three subscales of the Simulator Sickness Questionnaire (SSQ) (Kennedy et al., 1993), namely,: Nausea, Oculomotor, or Disorientation. We did not include a standardized test like the SSQ for two main reasons: the low risk of cybersickness and specific protocol constraints. Previous studies — conducted both by our research group and by others — using a setup similar to ours, did not report any notable issues related to cybersickness (Mondellini et al., 2018; Matviienko et al., 2023). Additionally, the protocol, which involved subsequent phases of cycling, required a short and efficient questionnaire to minimize interruptions and participant burden. In addition, cybersickness was mitigated through the VE design: the movement of the bicycle was synchronized with that in the VE and no abrupt changes of direction were present. Nevertheless, we incorporated a control question to monitor participants’ health status throughout the study.
2.5.10 Preference questionnaire
At the end of the experiment, we collected opinions about the experiment by asking the participants to put in order the four conditions for each of the following statements:
1. I enjoyed doing the activity;
2. I found the activity enjoyable;
3. I think that the activity was an interesting experience;
4. I was focused on the activity;
5. The activity was tiring;
6. I felt like I was really in the digital/virtual environment;
7. I would use it to perform physical activity at home.
The condition indicated as preferred corresponded to a score of four points, the second of 3, the third of 2, and the last of 1. In item 5, the scoring was reversed.
In addition, we gathered comments regarding the experimental conditions from the participants.
2.6 Statistical analysis
The IBM SPSS software v.29 was used for statistical analyses. First, we performed normality check to calculate if the scores were distributed on the normal curve. Descriptive analyses were performed for all objective and subjective data acquired. In particular, mean, standard deviation, minor, and major values were obtained for variables with normal distribution, and median and interquartile range for variables with non-normal distribution. One-way repeated measures ANOVA was performed to evaluate the differences in the scores of each variable in the four experimental conditions, except for the spatial presence scores where the comparison was made between three conditions (B-C-D). When the variable had a non-normal distribution, the Friedman test was performed to observe differences between conditions. The effect size (
3 Results
Thirty-five healthy young adults (mean age = 25.86
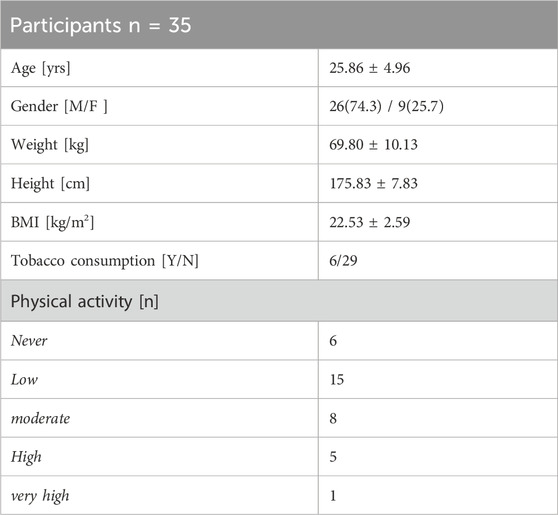
Table 1. Characteristics of participants.
The sequence of experimental conditions has been randomly assigned to each participant. A good balance between the sequence of experimental conditions and time order has been reached. The number of times each condition has occurred as the first, second, third, or fourth condition, respectively, is reported in Table 2.
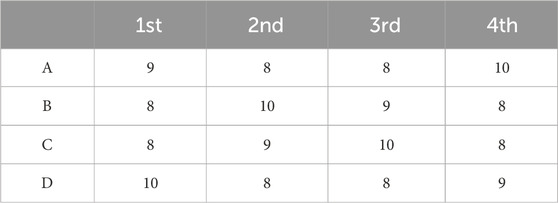
Table 2. Frequency of experimental condition (A = cycle only, B = TV, C = HMD, D = HMD + interaction) for each sequence position (first/second/third/fourth).
We excluded one participant from the analysis because the heart rate value during the exercise far exceeded the expected range, i.e., between 57% and 76% of the (HRmax). Results presented hereinafter are, therefore, relative to a sample of 34 participants (8 F/26 M; age 25.85
Results of the perceived effort (RPE), heart rate (HR), cycling cadence (CC), and breathing rate (BR) are reported in Figure 3.
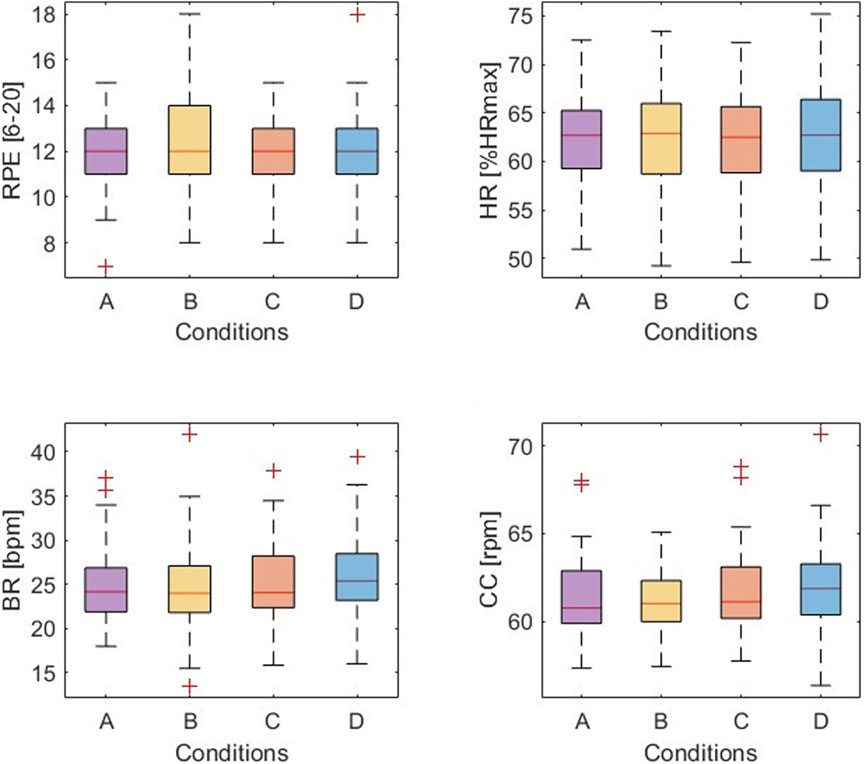
Figure 3. Exercise-related measures: perceived effort (RPE), heart rate (HR), cycling cadence (CC), and breathing rate (BR) results in the four conditions: A = cycle only, B = TV, C = HMD, D = HMD + interaction.
Results of the four dimensions of user experience, namely, enjoyment (ENJ), self-perceived attention (ATT), state of flow (FLOW), and spatial presence (SP), are represented in Figure 4.
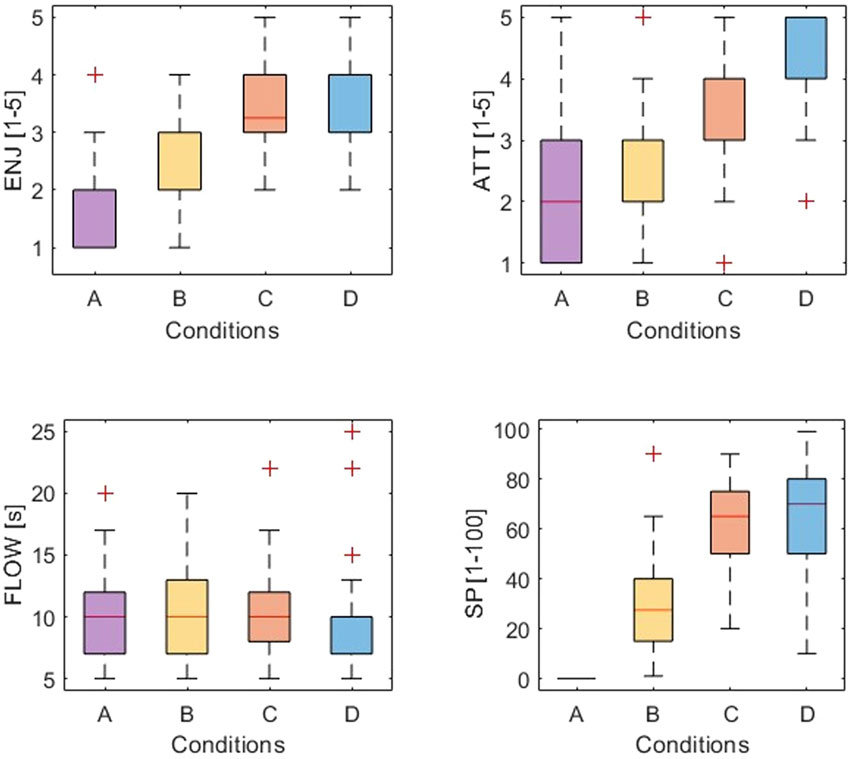
Figure 4. User experience measures: enjoyment (ENJ), self-perceived attention (ATT), flow (FLOW), and spatial presence SP in the four conditions: A = cycle only, B = TV, C = HMD, D = HMD + interaction.
3.1 Exercise-related measures
3.1.1 Perceived effort
The perceived effort did not change across experimental conditions. Median and interquartile range for each condition were: 12 (11-13) for condition A, 12 (11-14) for B, 12 (11-13) for condition C, and 12 (11-13) for condition D. The RPE median values, equal to 12, fall in the somewhat hard category for all conditions. The Friedman’s test revealed no statistically significant differences in RPE values across the four conditions (
3.1.2 Heart rate
The mean values of HR% are within the expected range for all the experimental conditions, with an average value of 62.56
3.1.3 Cycling cadence
Participants maintained an average cycling cadence of 61.55
3.1.4 Breathing rate
Breathing rate values, expressed in breaths per minute (bpm) were equal to 24.99
3.2 User experience measures
3.2.1 Enjoyment
Enjoyment was equal to 1.76
3.2.2 Self-perceived attention
Self-perceived attention was equal to 2.24
3.2.3 Flow
Regarding the flow dimension related to the perception of the passage of time, the variable has a non-normal distribution in condition D. Median and interquartile range for each condition were: 10 (7-12) minutes for condition A, 10 (7-13.25) for B, 10 (8-12.75) for condition C, and 10 (6.75–10) for condition D. Running the Friedman test, no difference in flow scores between the four experimental conditions emerges (
3.2.4 Spatial presence
Sense of presence was equal to 30.29
3.2.5 Cybersickness
Finally, regarding the side effects of the immersive experience, 26 subjects out of 34 (76.47%) reported no discomfort in condition C. Among those who reported unpleasant situations, three subjects experienced disorientation (8.82%), and two of them reported visual discomfort (5.88%). Finally, three participants complained of excessive sweating (8.82%). In condition D, 26 (76.47%) participants reported no side effects, while 5 (14.71%) and 2 (5.88%) participants suffered disorientation and nausea symptoms, respectively; one participant (2.94%) complained of sweating.
3.2.6 Preference questionnaire
As previously reported, the purpose of the last seven questions was to obtain a ranking on the preferred experimental condition. Participants had to rank conditions A, B, C, and D for each question in order of their liking; it was also possible to evaluate two or more conditions equally. Therefore, it was possible to obtain both a general preference, given by the sum of the scores obtained on each item from each experimental condition. Figure 5 illustrates the scores obtained by each item and the total score for the four experimental conditions. Overall preference score was equal to 9.21
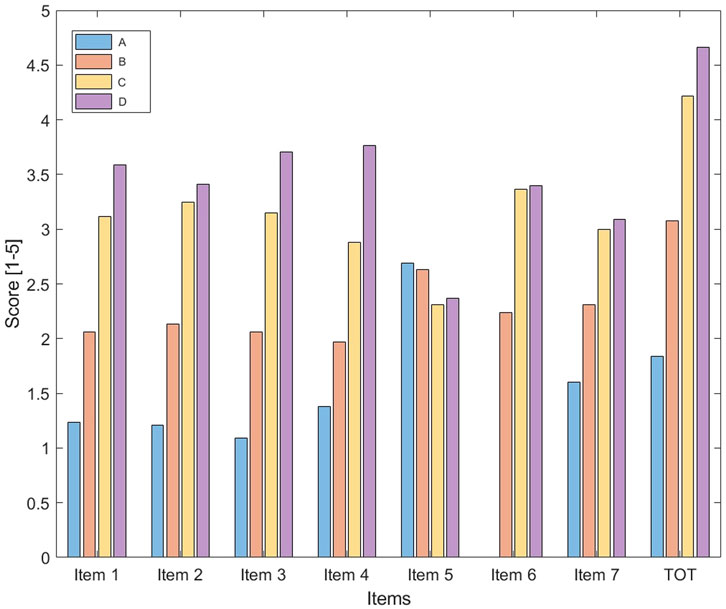
Figure 5. Preference questionnaire scores for each of the seven items and total score in the four conditions: A = cycle only, B = TV, C = HMD, D = HMD + interaction.
4 Discussion
Our study aimed at evaluating how immersion and interaction influence perceived exertion and user experience during cycling by using a methodological approach that combines quantitative and qualitative evaluation. First, the proposed protocol proved again suitable for the intended objectives, as already demonstrated in our preliminary work (Colombo et al., 2022). All participants could maintain the cycling cadence around the expected value of 60 RPM, disregarding how physically active they were. Only for one participant out of 35, the workload selection method was not adequate for ensuring an exercise heart rate within the desired range. This may be due to the characteristics of the participant, who was underweight (BMI = 17.26), with a very low physical activity level (i.e., not performing any regular physical activity), and showing an average resting heart rate equal to 105.46 bpm, higher than the other age-matched participants and corresponding to 54.35% of the maximum heart rate.
4.1 Exercise-related measures
Concerning our primary outcome, our results indicate that virtual reality, disregarding the level of immersion and the addition of interaction, does not directly influence perceived effort measured by the RPE scale. Such a result seems in contrast to what we expected based on the scientific literature. Generally, when the procedure allows the participant to control the workload, individuals tend to work harder or longer while perceiving the same level of effort (Runswick et al., 2023). When the workload is controlled as in our case, e.g., increased to simulate hills, VR could help participants to perceive a lower exertion (Finnegan et al., 2023). Similarly, in a study by Matsangidou et al., participants rated their RPE lower when performing a strength exercise in VR than when performing the exercise without feedback. RPE was assessed every 60 s, and the work rate was constant and equal to 20% of each participant’s 1RM (i.e., the heaviest weight they were able to lit). The duration of the task was determined by the participant, and corresponded to time to exhaustion (Matsangidou et al., 2019). Huang and colleagues compared four conditions of exercise on a stationary bike: a PC desktop, a projection, an HMD, and without any screen. The workload was controlled and started at 30 W with a gradual increase every 1 min until the anaerobic threshold was reached. They found a significantly lower perceived exertion in the immersive - wearing the HMD - and semi-immersive - using a projector - condition with respect to the control condition - during which no feedback was displayed - (Huang et al., 2008). The presence of a virtual environment, displayed on a semi-immersive projection, was also associated with lower perceived effort in the study by Mestre et al., in which the effort feedback was controlled through a pad fixed on the rear wheel and the participants were asked to maintain a moderate exercise intensity level for an average duration of 15 min (Mestre et al., 2011a). Our study’s findings align with other studies in which the workload or the expected work rate was controlled and fixed to a given value. Monedero et al. did not observe any differences in RPE between cycling while playing a videogame and without feedback (Monedero et al., 2015). Participants cycled for 30 min at a matched workload of 55% of their peak power output, and RPE was assessed every 10 min. Born and colleagues examined the impact of three factors, one being the level of immersion of a VR exergame where the user is required to perform different full-body movements to get into different poses (e.g., squat) represented by a given shape appearing on the wall placed in front of him/her. The exercise intensity, represented by the number of walls and poses, was the same for all participants and across all conditions. No differences were observed in perceived exertion between using a screen monitor and an HMD (Born et al., 2019).
Although a direct influence on RPE was not found, our study indicates that coupling immersion and interaction might induce a discrepancy between actual and perceived effort. Participants perceived the same level of effort, i.e., RPE, during all experimental conditions, while the actual physical effort was higher in condition D, as indicated by the significantly higher breathing rate values. Studies suggest that BR is a strong marker of actual physical effort showing a strong association to the time course of RPE with a variety of experimental interventions and high sensitivity to different fatigue states (Nicolò et al., 2017). According to this definition, our findings may suggest that participants perceived a lower effort than the actual one. To the best of our knowledge, there are no studies in which VR has influenced physical effort expressed through BR. However, some studies with a different experimental design, and not measuring BR, observe a similar tendency. Czub and colleagues found an indirect influence of VR on perceived effort in their study. No change in the self-reported effort was observed. However, participants performed a greater number of repetitions of the exercise, i.e., greater actual effort, when the task was performed in VR than when it was performed without immersive feedback (Czub and Janeta, 2021). Focusing on interaction, the additional interactive task in our study seemed to have a positive influence on the physical effort and induced higher self-perceived attention. Although a direct comparison cannot be made, a study by Wender et al. found that a more difficult item detection task induces higher mental effort and, as a consequence, greater pain. Such an increase in the perceived pain, in turn, made the participants perform worse in the cycling exercise, showing lower exercise tolerance (Wender et al., 2022). In our study, the additional task did not negatively influence either the perception of effort not the attention. Although preliminary, BR values, which were significantly higher in the HMD + interaction condition, suggest that our participants did not perceive greater effort while they were actually doing it. This may indicate that our task was simple enough to catch participants’ attention, which was significantly higher than in other conditions, without stressing them too much. Future investigations should include other tasks characterized by different difficulty levels and mental demands to confirm or mediate such a finding.
4.2 User experience measures
Concerning the participants’ subjective experience, condition D was the most enjoyable, even if not significantly compared to condition C. This result aligns with findings from other research where participants rated exercise in fully immersive mode as more enjoyable than non-immersive mode, but only when the execution of a task was present (Plante et al., 2003). Condition D is also the one in which participants felt more concentrated, significantly more than other conditions. On the other hand, no difference emerges among the four conditions as regards the perception of the passage of time. This result is not consistent with findings from other similar studies (Pallavicini and Pepe, 2019). However, the flow is typically measured as a multidimensional experience, while in our study, only the perception of time passage was measured. HMD conditions (C and D) are the ones eliciting the highest sense of spatial presence. The effect of interaction within a virtual environment on spatial presence, and sense of presence in general, is still a relatively young topic. As reported by Riches and colleagues, interaction with elements (i.e., avatars) within the VR environment increases the sense of presence (Riches et al., 2019). Therefore, indications suggest that the level of interaction in an environment enhances the experienced presence. However, our experimental design involved interaction tied to a cognitive task somewhat disconnected from the virtual environment, and this may explain why conditions C and D do not differ in the perceived sense of presence. Nevertheless, in condition D, a greater variability of answers (i.e., a greater standard deviation) can be observed. Moreover, while plausibility and place illusion are important aspects of the sense of presence in VEs, due to time and protocol constraints we could not perform an extensive evaluation of these dimensions by focusing on spatial presence. Future studies could investigate these factors in more detail to further understand their impact on VR experience.
In both immersive conditions (C and D), the number of participants reporting no side effects was the same (76.47% of the total). In condition C, more people complained of excessive sweating (3 vs. one of “D″) and visual problems. Although sweating is traditionally classified in the nausea category, it emerged that this discomfort was due to the temperature inside the laboratory and to the heat of wearing the headset, therefore for different reasons from those usually identified in the literature (Kennedy et al., 1993). While no participants specifically mentioned the weight as a problem, this discomfort may also partly reflect the additional weight of the device, although newer, lighter headsets could help limit this issue. In condition D, no subject reported visual difficulties; unlike condition C, however, nausea and greater disorientation symptoms emerged. This could be because participants - who had to concentrate on the Go-No Go task - felt lower freedom of possibility and, therefore, lower accommodation by the vestibular system. As reported in Ramaseri et al., movement in a virtual environment should be realistic to match sensory expectations (Ramaseri Chandra et al., 2022). Results on the subjective experience go hand in hand with the preferences expressed by the participants during the final questionnaire. In fact, the most preferred condition was D, followed by the other immersive condition, i.e., C.
4.3 Limitations and future works
Our study is not without limitations. The main limitation is about the population, which is unbalanced in terms of gender, with a percentage of females lower than 30%. One study indicates that gender may influence user experience in VR, hypothesizing that gaming habits may favor males by better evaluating their performance and ability to act in VR (Sagnier et al., 2020). On the other hand, other studies reported no gender differences in sense of presence, performance, enjoyment, and interest (Khashe et al., 2018; Rangelova and Marsden, 2018). A study reports that females are generally more susceptible to cybersickness because the distance between the headset’s lenses cannot fit female users’ interpupillary distance (Stanney et al., 2020). In our study, all participants were invited to adjust such a distance before starting the training until they were satisfied with the visualization of the virtual environment. Future studies should aim for a more balanced and representative sample to enhance generalizability and contribute to a clearer understanding of gender influences on user experience and perceived effort during exergames. Moreover, in a future study we aim to increase the sample size; this would help provide more robust and reliable conclusions also reducing the risk of Type II error. Moreover, there are limitations and potential improvements regarding the design of the experiment and of the conditions. Our study lacks a screen-based condition without a HMD but with interaction. This absence makes it challenging to conclude whether immersion alone impacts exercise responses or if interaction alone is responsible for observed effects. By including a screen-based with interaction condition, future studies could provide clearer insights into the relative importance of immersion versus interaction in virtual reality-based exercise interventions. With respect to the experimental setup, participants in the Cycle only condition could see the reflection of their bodies, which may have influenced their experience and represents a potential limitation of this condition. Moreover, a newer version of HMD for fully immersive conditions could influence the overall experience and results.
Our protocol focused on assessing perceived exertion in a condition in which the workload, and in an indirect way the HR, was controlled. Therefore, we cannot completely exclude that controlling the HR had influenced BR too and future investigations, e.g., through different study design, are recommended. Moreover, a future study could include the possibility of measuring exercise tolerance, which is a key aspect for our target users. For this purpose, the design of the experiment could be modified in self-paced exercise bouts in which participants are encouraged to go as hard, i.e., by directly controlling the workload through a button, as they could. Another potential limitation of our study design could be the cycling prescription, i.e., short bouts at a moderate intensity and cycling speed around 60 RPM may be too easy for this sample and not sufficiently challenging to enable changes in performance across conditions. Finally, our interaction task was a simple Go-no-go task with a single difficulty level and one type of stimuli (red or blue sphere) that did not change across the 10-min session. Higher complexity in terms of visual representation and characteristics of the task could enhance the effect on perceived effort and subjective experience and, therefore, deserves further investigation.
There are also some limitations that can be overcome in future studies with regard to measurements and statistical analysis. Single-item measures were used for flow and presence to minimize interruptions during the exercise bouts. Future studies could consider using multi-item validated scales to improve reliability and construct validity. Moreover, our study lacks a formal validity assessment for subjective measurements, such as self-perceived attention and flow, by participants who could have provided an additional indicator of the perceived clarity and relevance of the single item used. Future studies could include an evaluation of validity by asking participants to express their opinions on the clarity and relevance of the item, in order to enhance the understanding and reliability of the short questionnaire. Lastly, our study was exploratory and an a priori power analysis was not conducted. With N = 34,
Finally, the population included in our study represents a limited part of those who could benefit from modification of perception of effort during exercise. The characteristics of the users, e.g., their age and health status, could influence the experience and, therefore, the effects of VR on perception. Indeed, although several studies have explored the acceptability and attitudes of older adults towards cycling in virtual reality, yielding positive results comparable to those of younger individuals, it is crucial to consider the influence of age on their experience and engagement Ortet et al. (2022); Tegegne et al. (2025); Hibbs et al. (2024). The way older adults engage and respond to virtual cycling experiences, as factors such as cognitive decline, physical limitations, and varying levels of familiarity with technology may affect their comfort, enjoyment, and overall perception of activity in virtual environments. One of our final goals is to transfer the results to the rehabilitation field. To do so, the same study protocol should be replicated with older adults with respiratory diseases. A future study with patients should take into account other potential influencing factors that may alter the results in terms of perceived exertion. The most critical one is the fact that patients with respiratory diseases may experience breathlessness at even low level of physical activity intensity.
5 Conclusion
This study aimed at evaluating how immersion and interaction influence perception and subjective experience during cycling in a virtual environment. Our findings indicates that, despite a direct mediation of perceived effort could not be observed, participants sustained higher physical effort, represented by higher breathing rate, when they were fully immersed in the VE and performing an additional interactive task. Further investigations are needed to understand better the relationship between VR features, including additional aspects such as embodiment, audio feedback, etc., and perceived and physical effort. Furthermore, our study confirms that the combination of cycling and immersive VR can cause side effects in a very small proportion of people, although these have been shown to be negligible. Moreover, the higher spatial presence and enjoyment make immersive VR the preferred one by our participants. Finally, given the final goal of our work, which falls in the rehabilitation field, such an experimental protocol should be replicated with target users, i.e., the elderly with respiratory diseases. Only in this way will it be possible to understand how to design virtual reality-based interventions able to improve the perception and experience of patients while performing physical activity, and, as a result, enhance rehabilitation outcomes.
Data availability statement
The raw data supporting the conclusions of this article will be made available by the authors, without undue reservation.
Ethics statement
The studies involving humans were approved by Research Ethics and Integrity Committee of the National Research Council. The studies were conducted in accordance with the local legislation and institutional requirements. The participants provided their written informed consent to participate in this study.
Author contributions
VC: Conceptualization, Formal Analysis, Investigation, Methodology, Project administration, Software, Writing – original draft, Writing – review and editing. MM: Formal Analysis, Investigation, Methodology, Writing – original draft, Writing – review and editing. AA: Conceptualization, Methodology, Supervision, Writing – review and editing. MS: Supervision, Writing – review and editing.
Funding
The author(s) declare that no financial support was received for the research and/or publication of this article.
Acknowledgments
The authors would like to thank Giorgio Bocca for his valuable contribution, especially in the acquisition and analysis of data.
Conflict of interest
The authors declare that the research was conducted in the absence of any commercial or financial relationships that could be construed as a potential conflict of interest.
Publisher’s note
All claims expressed in this article are solely those of the authors and do not necessarily represent those of their affiliated organizations, or those of the publisher, the editors and the reviewers. Any product that may be evaluated in this article, or claim that may be made by its manufacturer, is not guaranteed or endorsed by the publisher.
References
Barbosa, D., Santos, C. P., and Martins, M. (2015). The application of cycling and cycling combined with feedback in the rehabilitation of stroke patients: a review. J. Stroke and Cerebrovasc. Dis. 24, 253–273. doi:10.1016/j.jstrokecerebrovasdis.2014.09.006
Billinger, S. A., Arena, R., Bernhardt, J., Eng, J. J., Franklin, B. A., Johnson, C. M., et al. (2014). Physical activity and exercise recommendations for stroke survivors: a statement for healthcare professionals from the American heart association/american stroke association. Stroke 45, 2532–2553. doi:10.1161/str.0000000000000022
Block, R. A., and Zakay, D. (1997). Prospective and retrospective duration judgments: a meta-analytic review. Psychonomic Bull. and Rev. 4, 184–197. doi:10.3758/bf03209393
Born, F., Abramowski, S., and Masuch, M. (2019). “Exergaming in vr: the impact of immersive embodiment on motivation, performance, and perceived exertion,” in 2019 11th international conference on virtual worlds and games for serious applications (VS-Games) (IEEE), 1–8.
Brown, E., and Cairns, P. (2004). “A grounded investigation of game immersion,” in CHI’04 extended abstracts on human factors in computing systems, 1297–1300.
Bull, F. C., Al-Ansari, S. S., Biddle, S., Borodulin, K., Buman, M. P., Cardon, G., et al. (2020). World health organization 2020 guidelines on physical activity and sedentary behaviour. Br. J. sports Med. 54, 1451–1462. doi:10.1136/bjsports-2020-102955
Cohen, J. (1988). Set correlation and contingency tables. Appl. Psychol. Meas. 12, 425–434. doi:10.1177/014662168801200410
Colombo, V., Mondellini, M., Gandolfo, A., Fumagalli, A., and Sacco, M. (2019). “Usability and acceptability of a virtual reality-based system for endurance training in elderly with chronic respiratory diseases,” in Virtual reality and augmented Reality: 16th EuroVR International Conference, EuroVR 2019, Tallinn, Estonia, October 23–25, 2019, proceedings 16 (Springer), 87–96.
Colombo, V., Bocca, G., Mondellini, M., Sacco, M., and Aliverti, A. (2022). “Evaluating the effects of virtual reality on perceived effort during cycling: preliminary results on healthy young adults,” in 2022 IEEE international symposium on medical measurements and applications (MeMeA) (IEEE), 1–6.
Colombo, V., Mondellini, M., Fumagalli, A., Aliverti, A., and Sacco, M. (2024). A virtual reality-based endurance training program for copd patients: acceptability and user experience. Disability and Rehabilitation: Assistive Technology. 19 (4), 1590–1599. doi:10.1080/17483107.2023.2219699
Csikszentmihalyi, M., and Csikzentmihaly, M. (1990). “Flow: the psychology of optimal experience,”, 1990. New York: Harper and Row.
Czub, M., and Janeta, P. (2021). Exercise in virtual reality with a muscular avatar influences performance on a weightlifting exercise. Cyberpsychology J. Psychosoc. Res. Cybersp. 15. doi:10.5817/cp2021-3-10
Daniel, R., Ewald, M., and Maiano, C. (2011). Virtual reality and exercise: behavioral and psychological effects of visual feedback. Annu. Rev. Cybertherapy Telemed. 99, 2011. doi:10.3233/978-1-60750-766-6-122
Faul, F., Erdfelder, E., Lang, A.-G., and Buchner, A. (2007). G* power 3: a flexible statistical power analysis program for the social, behavioral, and biomedical sciences. Behav. Res. methods 39, 175–191. doi:10.3758/bf03193146
Finnegan, S. L., Dearlove, D. J., Morris, P., Freeman, D., Sergeant, M., Taylor, S., et al. (2023). Breathlessness in a virtual world: an experimental paradigm testing how discrepancy between vr visual gradients and pedal resistance during stationary cycling affects breathlessness perception. Plos one 18, e0270721. doi:10.1371/journal.pone.0270721
Fox, S., Naughton, J. P., and Haskell, W. (1971). Physical activity and the prevention of coronary heart disease. Ann. Clin. Res. 3, 404–432.
Garber, C. E., Blissmer, B., Deschenes, M. R., Franklin, B. A., Lamonte, M. J., Lee, I.-M., et al. (2011). Quantity and quality of exercise for developing and maintaining cardiorespiratory, musculoskeletal, and neuromotor fitness in apparently healthy adults: guidance for prescribing exercise. American Coll. sports Med. 43, 1334–1359. doi:10.1249/mss.0b013e318213fefb
Griffiths, T. L., Burr, M. L., Campbell, I. A., Lewis-Jenkins, V., Mullins, J., Shiels, K., et al. (2000). Results at 1 year of outpatient multidisciplinary pulmonary rehabilitation: a randomised controlled trial. Lancet 355, 362–368. doi:10.1016/s0140-6736(99)07042-7
Hendrix, C., and Barfield, W. (1995). “Presence in virtual environments as a function of visual and auditory cues,” in Proceedings virtual reality annual international Symposium’95 (IEEE), 74–82.
Hibbs, A., Tempest, G., Hettinga, F., and Barry, G. (2024). Impact of virtual reality immersion on exercise performance and perceptions in young, middle-aged and older adults. Plos one 19, e0307683. doi:10.1371/journal.pone.0307683
Huang, S.-F., Tsai, P.-Y., Sung, W.-H., Lin, C.-Y., and Chuang, T.-Y. (2008). The comparisons of heart rate variability and perceived exertion during simulated cycling with various viewing devices. Presence 17, 575–583. doi:10.1162/pres.17.6.575
Hudson, S., Matson-Barkat, S., Pallamin, N., and Jegou, G. (2019). With or without you? Interaction and immersion in a virtual reality experience. J. Bus. Res. 100, 459–468. doi:10.1016/j.jbusres.2018.10.062
Jackson, S. A., and Marsh, H. W. (1996). Development and validation of a scale to measure optimal experience: the flow state scale. J. sport and Exerc. Psychol. 18, 17–35. doi:10.1123/jsep.18.1.17
Jennett, C., Cox, A. L., Cairns, P., Dhoparee, S., Epps, A., Tijs, T., et al. (2008). Measuring and defining the experience of immersion in games. Int. J. human-computer Stud. 66, 641–661. doi:10.1016/j.ijhcs.2008.04.004
Kennedy, R. S., Lane, N. E., Berbaum, K. S., and Lilienthal, M. G. (1993). Simulator sickness questionnaire: an enhanced method for quantifying simulator sickness. Int. J. Aviat. Psychol. 3, 203–220. doi:10.1207/s15327108ijap0303_3
Khashe, S., Becerik-Gerber, B., Lucas, G., and Gratch, J. (2018). Persuasive effects of immersion in virtual environments for measuring pro-environmental behaviors. In ISARC. Proceedings of the international symposium on automation and robotics in construction. 35. IAARC Publications, 1–7.
Laczko, J., Mravcsik, M., and Katona, P. (2016). “Control of cycling limb movements: aspects for rehabilitation,” in Progress in motor control: theories and translations, 273–289.
Marcora, S. M., and Staiano, W. (2010). The limit to exercise tolerance in humans: mind over muscle? Eur. J. Appl. physiology 109, 763–770. doi:10.1007/s00421-010-1418-6
Matsangidou, M., Ang, C. S., Mauger, A. R., Intarasirisawat, J., Otkhmezuri, B., and Avraamides, M. N. (2019). Is your virtual self as sensational as your real? Virtual reality: the effect of body consciousness on the experience of exercise sensations. Psychol. sport and Exerc. 41, 218–224. doi:10.1016/j.psychsport.2018.07.004
Matviienko, A., Hoxha, H., and Mühlhäuser, M. (2023). “What does it mean to cycle in virtual reality? Exploring cycling fidelity and control of vr bicycle simulators,” in Proceedings of the 2023 CHI conference on human factors in computing systems, 1–15.
McAuley, E., Duncan, T., and Tammen, V. V. (1989). Psychometric properties of the intrinsic motivation inventory in a competitive sport setting: a confirmatory factor analysis. Res. Q. Exerc. and sport 60, 48–58. doi:10.1080/02701367.1989.10607413
Mestre, D. R., Ewald, M., and Maiano, C. (2011a). Virtual reality and exercise: behavioral and psychological effects of visual feedback. Annu. Rev. Cybertherapy and Telemedicine 2011, 122–127. doi:10.3233/978-1-60750-766-6-122
Mestre, D. R., Maïano, C., Dagonneau, V., and Mercier, C.-S. (2011b). Does virtual reality enhance exercise performance, enjoyment, and dissociation? An exploratory study on a stationary bike apparatus. Presence Teleoperators and Virtual Environ. 20, 1–14. doi:10.1162/pres_a_00031
Meyerbröker, K., and Morina, N. (2021). The use of virtual reality in assessment and treatment of anxiety and related disorders. Clin. Psychol. and Psychotherapy 28, 466–476. doi:10.1002/cpp.2623
Mittelstaedt, J., Wacker, J., and Stelling, D. (2018). Effects of display type and motion control on cybersickness in a virtual bike simulator. Displays 51, 43–50. doi:10.1016/j.displa.2018.01.002
Mondellini, M., Arlati, S., Greci, L., Ferrigno, G., and Sacco, M. (2018). “Sense of presence and cybersickness while cycling in virtual environments: their contribution to subjective experience,” in Augmented reality, virtual reality, and computer graphics: 5th international conference, AVR 2018, Otranto, Italy, June 24–27, 2018, proceedings, part I 5 (Springer), 3–20.
Mondellini, M., Rutkowski, S., and Colombo, V. (2023). “Cycling in immersive vr: motivation and affects in post-covid patients,” in International conference on extended reality (Springer), 353–366.
Monedero, J., Lyons, E. J., and O’Gorman, D. J. (2015). Interactive video game cycling leads to higher energy expenditure and is more enjoyable than conventional exercise in adults. PloS one 10, e0118470. doi:10.1371/journal.pone.0118470
Nicolò, A., Massaroni, C., and Passfield, L. (2017). Respiratory frequency during exercise: the neglected physiological measure. Front. physiology 8, 922. doi:10.3389/fphys.2017.00922
Norman, G. (2010). Likert scales, levels of measurement and the “laws” of statistics. Adv. health Sci. Educ. 15, 625–632. doi:10.1007/s10459-010-9222-y
Ortet, C. P., Veloso, A. I., and Vale Costa, L. (2022). Cycling through 360 virtual reality tourism for senior citizens: empirical analysis of an assistive technology. Sensors 22, 6169. doi:10.3390/s22166169
Pallavicini, F., and Pepe, A. (2019). “Comparing player experience in video games played in virtual reality or on desktop displays: immersion, flow, and positive emotions,” in Extended abstracts of the annual symposium on computer-human interaction in play companion extended abstracts, 195–210.
Plante, T. G., Aldridge, A., Bogden, R., and Hanelin, C. (2003). Might virtual reality promote the mood benefits of exercise? Comput. Hum. Behav. 19, 495–509. doi:10.1016/s0747-5632(02)00074-2
Ramaseri Chandra, A. N., El Jamiy, F., and Reza, H. (2022). A systematic survey on cybersickness in virtual environments. Computers 11, 51. doi:10.3390/computers11040051
Rangelova, S., and Marsden, N. (2018). “Gender differences affect enjoyment in hmd virtual reality simulation,” in Proceedings of the 17th driving simulation conference, 209–2010.
Riches, S., Elghany, S., Garety, P., Rus-Calafell, M., and Valmaggia, L. (2019). Factors affecting sense of presence in a virtual reality social environment: a qualitative study. Cyberpsychology, Behav. and Soc. Netw. 22, 288–292. doi:10.1089/cyber.2018.0128
Rodríguez, S., and Rodríguez-Jaime, M. (2025). Effects of eccentric cycling training on the physical performance of patients with chronic obstructive pulmonary disease: a systematic review of randomized clinical trials. Sci. and Sports. doi:10.1016/j.scispo.2024.09.006
Rose, T., Nam, C. S., and Chen, K. B. (2018). Immersion of virtual reality for rehabilitation-review. Appl. Ergon. 69, 153–161. doi:10.1016/j.apergo.2018.01.009
Runswick, O. R., Siegel, L., Rafferty, G. F., Knudsen, H. S., Sefton, L., Taylor, S., et al. (2023). The effects of congruent and incongruent immersive virtual reality modulated exercise environments in healthy individuals: a pilot study. Int. J. Human–Computer Interact. 40, 7864–7874. doi:10.1080/10447318.2023.2276524
Sagnier, C., Loup-Escande, E., and Valléry, G. (2020). “Effects of gender and prior experience in immersive user experience with virtual reality,” in Advances in usability and user experience: proceedings of the AHFE 2019 international conferences on usability and user experience, and human factors and assistive technology (Springer), 305–314.
Slater, M., and Wilbur, S. (1997). A framework for immersive virtual environments (five): speculations on the role of presence in virtual environments. Presence Teleoperators and Virtual Environ. 6, 603–616. doi:10.1162/pres.1997.6.6.603
Spruit, M. A., Singh, S. J., Garvey, C., ZuWallack, R., Nici, L., Rochester, C., et al. (2013). An official american thoracic society/european respiratory society statement: key concepts and advances in pulmonary rehabilitation. American J. Respir. and Crit. care Med. 188, e13–e64. doi:10.1164/rccm.201309-1634st
Stanney, K., Fidopiastis, C., and Foster, L. (2020). Virtual reality is sexist: but it does not have to be. Front. Robotics and AI 7 (4), 4. doi:10.3389/frobt.2020.00004
Sullivan, G. M., and Artino Jr, A. R. (2013). Analyzing and interpreting data from likert-type scales. J. graduate Med. Educ. 5, 541–542. doi:10.4300/jgme-5-4-18
Tegegne, T. K., Rawstorn, J. C., Skärsäter, I., Hertz, A.-C., and Maddison, R. (2025). Acceptability of cycling with virtual reality among older adults living independently in a retirement village: an observational study. J. Aging and Phys. Activity 1, 1–9. doi:10.1123/japa.2024-0122
Wender, C. L., Tomporowski, P. D., Ahn, S. J. G., and O’Connor, P. J. (2022). Virtual reality-based distraction on pain, performance, and anxiety during and after moderate-vigorous intensity cycling. Physiology and Behav. 250, 113779. doi:10.1016/j.physbeh.2022.113779
Xiang, X., Huang, L., Fang, Y., Cai, S., and Zhang, M. (2022). Physical activity and chronic obstructive pulmonary disease: a scoping review. BMC Pulm. Med. 22, 301. doi:10.1186/s12890-022-02099-4
Yao, S., and Kim, G. (2019). “The effects of immersion in a virtual reality game: presence and physical activity,” in HCI in Games: first International Conference, HCI-Games 2019, held as part of the 21st HCI international conference, HCII 2019, Orlando, FL, USA, July 26–31, 2019, proceedings 21 (Springer), 234–242.
Keywords: immersion, interaction, cycling, perceived effort, user experience, virtual reality
Citation: Colombo V, Mondellini M, Aliverti A and Sacco M (2025) Immersion and interaction during cycling in virtual reality: the influence on perceived effort and subjective experience. Front. Virtual Real. 6:1490588. doi: 10.3389/frvir.2025.1490588
Received: 03 September 2024; Accepted: 03 October 2025;
Published: 15 October 2025.
Edited by:
Domna Banakou, New York University Abu Dhabi, United Arab EmiratesReviewed by:
Justin Maximilian Mittelstädt, German Aerospace Center (DLR), GermanyOmar Janeh, University of Technology, Iraq, Iraq
Copyright © 2025 Colombo, Mondellini, Aliverti and Sacco. This is an open-access article distributed under the terms of the Creative Commons Attribution License (CC BY). The use, distribution or reproduction in other forums is permitted, provided the original author(s) and the copyright owner(s) are credited and that the original publication in this journal is cited, in accordance with accepted academic practice. No use, distribution or reproduction is permitted which does not comply with these terms.
*Correspondence: Vera Colombo, dmVyYS5jb2xvbWJvQHN0aWltYS5jbnIuaXQ=