 Attila Bekkvik Szentirmai
 Ole Andreas Alsos
 Anne Britt Torkildsby1
 Yavuz Inal
- 1Department of Design, Faculty of Architecture and Design, Norwegian University of Science and Technology (NTNU), Gjøvik, Norway
- 2Department of Design, Faculty of Architecture and Design, Norwegian University of Science and Technology (NTNU), Trondheim, Norway
Introduction: The recent paradigm shift in Augmented Reality (AR) technology features the integration of Pass-Through Augmented Reality (PT-AR) into flagship Extended Reality (XR) devices. PT-AR, from a technological standpoint is Virtual Reality (VR) and significantly differs from AR technologies that used in devices like Google Glass, Magic Leap, or HoloLens, which utilize Optical-See-Through AR. PT-AR renders the user’s physical environment on digital displays, as opposed to providing a direct, natural view of the physical world. This “virtual” digital representation of reality is an unexplored area. What makes AR distinct from other technologies, including VR, is its “reality” aspect. AR overlays, projects, and enhances the user’s physical environment with digital information. Accordingly, the primary scene of interaction in AR is the real world. This study takes a novel approach by focusing on the “reality” aspect of AR. It compares two commercially available PT-AR systems: a low-end smartphone-based device and a high-end dedicated headset. The study examines how each affects users’ comfort, orientation, and task performance during everyday activities in the physical world.
Methods: We employed a mixed-method approach, involving 20 participants with diverse backgrounds in terms of age, gender, and VR/AR experience. We evaluated the impact of PT-AR across three foundational real-world task domains, such as walking, dexterity, and full-body coordination, via NASA Task Load Index (NASA-TLX) and Simulator Sickness Questionnaire (SSQ) assessments, observations, and interviews.
Results: Our findings suggest that current PT-AR solutions negatively affect user comfort, orientation, wellbeing, and task performance. Both systems fall short of AR’s promise of seamless engagement and integration of reality. Participants exhibited symptoms similar to those of intoxication, including loss of body coordination, general discomfort, and difficulties in focusing and concentrating.
Discussion: We argue that PT-AR may introduce a new form of discomfort that differs from well-known issues like cybersickness or motion sickness, which require further research on XR’s “reality” aspects to understand the interaction between human and technological factors comprehensively.
1 Introduction
Augmented Reality (AR) is an immersive multisensory technology that simultaneously blends digital content with the user’s physical environment (Aukstakalnis, 2016; Billinghurst et al., 2015; Furht, 2011; Azuma, 1997). ARs added value compared to other technologies including VR, relies on its reality aspect. While VR replaces reality with an artificial, simulated one, AR enhances and extends the user’s reality with digital means. These novel features promise to revolutionize our daily lives, activities, and information consumption by enhancing our reality with digital content (Xiong et al., 2021). However, the core prerequisite for realizing this promise is to perceive and safely engage and interact with the physical world. To achieve this, AR underwent evolutionary and revolutionary maturing in the past decades, seeking its place in the digital world. The maturing process delivered many shapes and forms of AR, such as head-mounded (HMD) and hand-held (mobile) AR (Goh et al., 2019; Billinghurst et al., 2015). AR also adopted different display technologies, including Optical See-Through (OST) and Video-see-Through, or as we refer to it in this paper, Pass-Trough (PT) AR devices as shown in Figure 1. High-end and low-end AR offerings also have a cost and convenience gap. High-end, high-cost AR, as we refer to it in this paper, relies on proprietary hardware and features. In contrast, Low-end, low-cost AR is a more universal, cost-effective solution that takes advantage of smartphone hardware capabilities (Szentirmai, 2024; Goh et al., 2019; Höllerer and Feiner, 2004).

Figure 1. OST-AR (HoloLense2) at the left, PT-AR (Meta Quest 3) at the right.
Typical high-end AR offerings are Google Glass, Magic Leap, and HoloLens, which use OST displays, while recent high-end devices are the MetaQuest3, Pro and Apple VisionPro which use PT display technology. Meanwhile, low-end mobile AR (MAR) offerings utilize a smartphone display (PT) to deliver AR experiences.
Meta and Apple recently committed to establishing their High-end AR devices (Quest3, VisionPro) on pass-through AR technology, which indicates the rapid evolution of this tech. The commitment to Pass-Through AR (PT-AR) is interesting, as PT displays in AR was not the ideal choice but became necessary for low-end, smartphone-based AR solutions, where the smartphone’s screen provides the PT display in head-mounted mode.
Consequently, the PT approach raises several questions, as visual perception through PT displays differs significantly from that of OST. In OST, users perceive the physical world through transparent glass, with digital content projected onto it simultaneously (Ballestin et al., 2018). On the contrary, PT users do not directly view the physical world but perceive it through a high-resolution digital display. The device’s camera sensors convert the analog visual stimuli into digital representation as a live video stream (Ballestin et al., 2018; Rolland and Fuchs, 2000). In other words, in OST, users can naturally view the real world without any interference or digital “middlemen,” while in PT, users are looking at a live video stream. Accordingly, interaction with the physical world and physical objects in OST is natural and “free” from technical limitations such as latency, image quality, field of view and depth perception unlike in using PT-displays.
1.1 Pass-through AR: more VR than AR
Virtual Reality (VR) is an immersive multisensory technology where the users are “closed in” a fully digital environment through a headset (Wohlgenannt et al., 2020; Attaran and Morfn-Manibo, 2018; Martirosov and Kopecek, 2017). Strictly from a technological point of view, PT-AR is VR. The users are “closed” into a headset, viewing a digital display and a digital representation (video stream) of the physical surroundings. One of the benefits of PT display is the smooth transition between the realities (VR and AR) in Extended Reality (XR) which offers both VR and AR functionalities (Chuah, 2018; Andrews et al., 2019).
However, there is a reason why, until recently, high-end AR solutions have all been based on OST displays. The key value of AR, compared to VR or other technologies, lies in its “reality” and context aware aspect, allowing users to remain present in the physical world while extending, manipulating, and enhancing it with digital content. With OST, the sense of “reality” is seamless and natural since the users perceive “reality” directly through their own senses. PT-AR, however, deliver this illusion using VR display technology. Consequently, PT-AR could hypothetically inherit the well-known drawbacks of VR perception, such as cybersickness, along with additional, yet-to-be-discovered issues and challenges related to camera vision and the simultaneous video rendering of the physical world (See Figure 2).
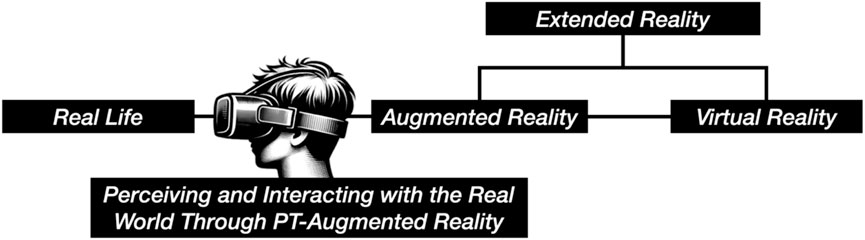
Figure 2. Placement of our research approach on Milgram and Kishino’s Reality-Virtuality Continuum (1994).
1.2 The research gap in PT-AR
AR’s key value and novel feature compared to VR is that the users can interact with their digitally enhanced reality. Therefore, the problem free presence in the physical environment, along with smooth interaction with both physical and digital objects, is essential and should be safe, reliable, and free from discomfort and disorientation. However, even in a fully controlled digital environment like VR, achieving seamless, problem-free interaction remains an unresolved challenge. Arguing that PT-AR is technologically closer to VR than AR, it also introduces additional uncontrolled variables, such as the dynamic nature of the physical world (e.g., changing environments, physical objects, obstacles, and mobility). This can potentially lead to discomfort, disorientation, and cybersickness for its users. However, these issues have not yet been widely examined in the context of interacting with the physical world using PT-AR.
VR research has a large body of literature studying the users’ well-being, concerning motion, simulation, and cybersickness in VR environments. However, only a few studies measured similar factors concerning AR mainly because High-end AR–until recently–utilized OST-Displays, where users perceiving “reality” and the physical surroundings naturally.
To the best of our knowledge, existing AR research largely overlooks users’ experiences, emotions, and attitudes when performing everyday tasks in the physical world using PT-AR. Most studies focus on digital augmentation or spatial interface design, often neglecting the reality component, including its quality and its influence on users. While this aspect may be less critical in OST-displays, where users naturally perceive the physical world, it remains an underexplored area in the context of PT displays.
This reveals a significant research gap in understanding how PT displays affect user experience and wellbeing during daily activities in the physical world. As these technologies are to become mainstream, as daily companions in the future, it is crucial to study and understand their effects on users. When the perception of the physical world through a PT-AR inherits the well-known negative effects of VR, it can potentially lead to accidents, discomfort, disorientation, and feelings of illness, which is not the reality most users would experience.
This study, therefore, explores how current PT-AR solutions challenge AR’s core strength, which is the ability to remain present in and interact with the real world. We compare two commercially available PT-AR solutions: one high-end and one low-end. The study focuses on how PT displays influence users’ performance, emotions, and attitudes while they are present in the physical world, interacting with physical objects and simulating potential future scenarios where such technologies become integral to daily life and activities.
We seek to answer the research question: How do PT-Displays impact performance, comfort, orientation, and interaction with the physical world? Understanding this impact is essential, as the adoption of PT-AR could introduce risks that could deter widespread acceptance if not addressed properly.
2 Related work
A thorough and in-depth review of immersive technologies’ impact and unwanted side effects on users is beyond the scope of this paper. This section provides an overview of previous work that inspired our research investigating the presence and interaction with the real world through PT displays.
2.1 Discomfort using immersive technologies
Multiple studies report discomfort using immersive technologies across various domains, including entertainment, education, and training simulations. One of the first comprehensive studies of LaViola Jr (2000) raised awareness of motion sickness-like symptoms such as nausea, dizziness, and general discomfort in virtual environments. The study established the term cybersickness and argued that causing effects differ from motion sickness regardless, resulting in similar symptoms. In motion sickness, e.g., sitting in a car watching a mobile screen, the body senses movements through the vestibular system, while the visual sensors perceive stationary position, creating a mismatch and conflict in cognition, triggering a safety mechanism that alarms the body falsely suspect of poison. Cybersickness, however, is the opposite. Our visuals sense self-movement in a virtual environment while the body is usually stationary, e.g., we run around with our virtual character while sitting on our chairs. LaViola argues that cybersickness is challenging to predict because of the complex technological (e.g., display refresh rate, field of view, latency, inaccurate tracking) and biological factors (e.g., vestibular sensitivity, neurological differences, age, and gender) that can lead to it.
2.1.1 Head-mounted displays’ effect on immersion and discomfort
HMDs directly engage the user’s visual senses and track the user’s head movements, creating immersion and a feeling of presence in VR. The study of Martirosov et al. (2022) discovered that the level of immersion and the display technology play a significant role in causing cybersickness. The study claims that HMDs have a higher occurrence of cybersickness than other systems, such as large screens or CAVE systems. One of the most comprehensive studies on VR sickness in HMDs, conducted by Saredakis et al. (2020), identified several key factors responsible for VR sickness. These factors include the type of content, such as gaming and 360-degree videos being more likely to induce symptoms, and the level of visual stimulation, where rapid or dynamic visuals tend to increase sickness. Furthermore, the research indicates that locomotion significantly influences VR sickness, with controller-based movement causing more severe symptoms compared to natural walking in virtual environments. Additionally, prolonged exposure to VR environments is associated with an increase in the severity of symptoms. User characteristics, such as age, also play a role, with individuals under the age of 35 experiencing higher levels of VR sickness. One of the few studies investigating AR in the context of motion sickness is done by Kaufeld et al. (2022). The study presents scientific evidence that visually induced motion sickness symptoms such as nausea, disorientation, and oculomotor disorders and their causes are not VR-specific but can also be present in AR environments. The gap-filling study by Ballestin et al. (2018) compared OST and PT displays in AR. The research investigated the perception and action in the users’ peripersonal space by comparing the users’ precision and comfort in reaching tasks performed via OST-AR and PT-AR displays. The study found that OST-AR provides better depth estimation, more precise interaction, and a lower impact on eye strain and fatigue than PT-AR.
2.2 Mitigation techniques reducing discomfort
The study by Park et al. (2017) investigated the possibility of reducing cybersickness through oculomotor exercises before using VR. The study showcased that eye exercises benefit the ocular muscles and carnival nerve functions and can significantly reduce cybersickness symptoms such as nausea, disorientation, and oculomotor among the participants. Giri and Agrawal (2020) successfully mitigated motion sickness symptoms by exposing participants to recurring VR training. Their motion sickness-prone participants were exposed to VR training for 2 weeks. The study discovered that some users, e.g., females, are more prone to motion sickness than others. The training showed slightly reduced dizziness from day 1 to day 11, claiming training to mitigate motion sickness symptoms could work. Pöhlmann et al. (2023) found that motion sickness in VR has negative effects on presence and task performance and proposed multisensory, i.e., audiovisual clues, as a mitigation technique. Porcino et al. (2017) proposed design guidelines and applications to minimize cybersickness in PT-systems through software advancements by implementing a dynamic focus solution. Another approach was proposed by Szentirmai and Murano (2023), suggesting design considerations so Mobile Augmented Reality (MAR) applications do not require the user to do extensive movements whilst using the app to achieve their goals, reducing the side effects of mismatching sensory inputs by operation at reach.
2.3 Measurements and Frameworks
There is no definitive answer to what causes discomfort in immersive technologies; most research describes similar symptoms, such as nausea, dizziness, headaches, and eyestrain, as the mismatch between the vestibular (inner ear) and sensory systems is the root of the problem. The standard framework for measuring the severity of these symptoms is the Simulator Sickness Questionnaire (SSQ) developed by Kennedy et al. (1993). The questionnaire is a tool to measure and quantify the symptoms of simulator sickness during exposure. The application of this framework has since been expanded and applied to measure various immersive technologies, including VR, AR, or other virtual environments. Users of the SSQ are required to answer a series of questions, self-reporting their feelings about task execution. The questionnaire then scores these responses and quantifies them based on the severity of the symptoms. Regardless of its legacy, critical voices and proposals exist for new, more modern framework iterations. Kim et al. (2018) argues that the standard SSQ requires specific adjustments, as it was originally developed as a motion sickness questionnaire for simulation environments rather than for fully immersive technologies like modern VR. The authors claim that VR-cybersickness is a subset of simulator sickness, with distinct characteristics and triggers. Similarly, Josupeit (2023) criticizes the SSQ for its outdated factors, lack of generalizability, and limited adaptability to various environments, highlighting the need for more up-to-date, technologically relevant cybersickness frameworks.
All found studies have a consensus that cybersickness symptoms are a barrier to the broader adoption of safe and comfortable immersive technologies. Understanding its causes, symptoms, and mitigation strategies is crucial for developing more comfortable and safe immersive solutions.
3 Methodology
This section details the approach taken in this study, covering participant selection, apparatus used, and experimental design. It outlines the procedure and tasks involved, along with data collection, analysis methods and ethical considerations employed to ensure reliable findings.
3.1 Participants
Twenty participants (10 males, 10 females), aged 18 to 77, were randomly assigned to two groups: Group A (Low-end PT-AR) and Group B (High-end PT-AR). The overall sample skewed younger, with 60% aged 18–34. Group A had a younger profile overall, while Group B included a broader age range, including older adults up to age 77. Most participants reported little to no experience with motion sickness; 50% rarely experienced it, and 35% had never experienced it.
Minor to moderate visual impairments corrected with glasses (e.g., myopia, hyperopia) were present in 60% (n = 6) of participants in both groups. In Group B, these co-occurred with a mild cognitive impairment (dementia) in 10% (n = 1) and a mild motor impairment (rheumatism) in another 10% (n = 1). No participants reported any difficulties during the initial task walkthroughs (Tasks 1–3) preceding the main experiment. Although no analyses were conducted based on impairment status, these characteristics were noted during observational sessions. For full demographic details, see Supplementary Appendix Table SA1.
Before beginning the tasks, all participants were informed of the study’s objectives, tasks, data collection, ethical considerations, and confidentiality measures, ensuring they fully understood their rights and involvement. After providing oral consent and completing the tasks, participants submitted an online form with their demographic details, self-reported experiences, and consent confirmation.
3.2 Apparatus
Participants were equipped with two representative Low-end and High-end AR headsets utilizing PT display technology. The Low-end group utilized MAR combining the MergeAR/VR headset (Merge Education, 2024) with a Google Pixel 6 smartphone functioned as a PT display. This headset provides a field of view of 96° (FOV), a comfortable, soft, lightweight cardboard with adjustable lenses and a flexible strap. The Pixel 6 features a 6.4-inch AMOLED display with a 2,400 × 1,080 pixels resolution and a 90 Hz refresh rate. The High-end group used the Meta Quest 3 (OS version 59), a standalone XR headset (Meta, 2024). The device is equipped with a Quest pro strap, a 120 Hz, 2064 × 2,208 pixels LCD PT display per eye, 110° FOV, and advanced active depth sensing. Strap and lens adjustments were made to maximize comfort and optimal functionality in both devices.
3.3 Experiment design
We designed the experiment to understand PT’s impact on users’ performance, feelings, and attitudes. We adopted a mixed-method approach to collect quantitative, self-reporting, and qualitative insights (observation and interviews with the participants).
The quantitative data collection consisted of the following sections, presented in the following order:
1. User Questionnaire: collecting user demographics such as age, sex, education, impairment/dysfunctionalities (visual, cognitive, motor), and known issues related to motion sickness.
2. NASA Task Load Index (NASA-TLX): collecting information about participant’s subjective workload evaluation to gain insights about PT Displays impact on (1) mental demand, (2) physical demand, (3) temporal demand, (4) performance, (5) effort, and (6) frustration level (Hart and Staveland, 1988).
3. Simulator Sickness Questionnaire (SSQ): collecting insights about simulator sickness symptoms (Kennedy et al., 1993). The surveys were administered after the completion of all experimental tasks. To evaluate the effects of the PT display on participants, dizziness experienced with eyes open, and dizziness experienced with eyes closed were combined into a single category: “dizziness experienced with eyes open or closed.” This unified approach focused on dizziness as a phenomenon without dividing it into separate categories, ultimately reducing the total number of SSQ symptoms from 16 to 15. This method was essential for accurately identifying device-specific symptoms and their severity levels.
To complement the quantitative data, qualitative insights were gathered through direct observations and semi-structured interviews, both of which are detailed in Supplementary Appendix SD, E.
1. Observation Protocols: During task execution, the researcher recorded observations using structured protocols. These observations included general notes about participants’ initial reactions and overall behaviors when interacting with the headset and task-specific notes on participants’ confidence, accuracy, movement, orientation, and actions (see Supplementary Appendix SD).
2. Semi-structured Interviews: After participants completed all tasks and the post-test questionnaire, brief semi-structured interviews (approximately 5–7 min each) were conducted as an additional validation step. These interviews provided deeper qualitative insights into participants’ experiences, emotions, and well-being. The semi-structured format enabled flexibility, allowing the researcher to ask individualized follow-up questions based on observations made during the experiment (see Supplementary Appendix SE)
All observations and interview responses were manually analyzed using an inductive approach. This method involved identifying patterns directly from participant responses without relying on predetermined theories or assumptions. The resulting qualitative patterns were then compared with quantitative results from the NASA-TLX and SSQ to identify points of convergence and divergence between the two methods.
3.4 Procedure and task design
The complete procedure, including researcher guidelines, is presented in Supplementary Appendix SB, C. The procedure and task designs were informed by our pilot explorations and underwent multiple iterations involving redesigns and adjustments to prioritize participants’ safety and wellbeing. Certain compromises were necessary during this process. For example, we excluded outdoor tasks due to uneven flooring, potential physical obstacles, and inconsistent lighting conditions. Similarly, stair-based navigation (moving between floors via stairs A and B) was removed from the task list, as it posed safety risks when using low-end PT-AR headsets.
The final task design contains three main categories: (1) walking, (2) dexterity, and (3) full-body coordination. Walking and dexterity were chosen as they represent foundational ecological challenges commonly encountered in everyday physical interaction with the physical, environment, objects and devices. Full-body coordination was included based on established assessment tools, particularly field sobriety tests (FST) (Burns and Moskowitz, 1977). Given prior research highlighting how motion sickness and cybersickness can arise from mismatches between the visual and vestibular systems (LaViola Jr, 2000), we adapted the FST to explicitly challenge the communication between these sensory systems through the body coordination tasks. The following section provides an overview of the task designs and explains the rationale behind their selection.
The study utilized a between-group setup to gain insights into the impact of low-end and high-end PT-AR headsets.
Each challenge and task measured the participants’ executive functioning, comfort, coordination, and performance to execute foundational everyday tasks while interacting with the world using PT-AR headsets. A 15-min duration was allocated for task completion to ensure that the activities remain manageable and minimize the risk of fatigue. This time frame was chosen to keep exposure below the typical threshold for cybersickness, which tends to increase with prolonged periods in virtual environments (Saredakis et al., 2020). These adjustments were implemented to prioritize participant safety and well-being while enabling us to examine the immediate effects of PT displays on users. Nevertheless, participants took between five and 8 minutes to complete them.
3.4.1 Task 1 – walking exercise
Was a warm-up exercise that helped participants get accustomed to perceiving the world through PT-AR. In this task, participants must walk from point A to point B, passing through a door frame. Once point B is reached, they must turn 180° and return to the starting point. The task challenges motor skills, balance, and spatial awareness. It incorporates a fundamental interaction with the world, challenging the ability to navigate and move in a controlled manner wearing a PT-AR headset, as shown in Figure 3.
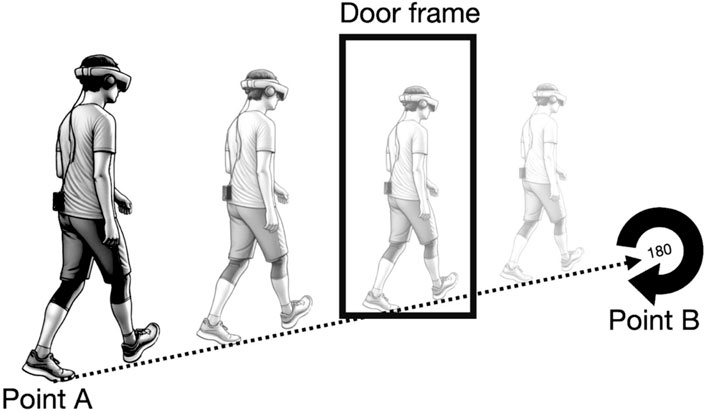
Figure 3. Walking exercise in the real world.
3.4.2 Task 2: dexterity
Was designed to challenge the interaction with physical and digital objects. Dexterity in AR usually means the precision, effort, and ease of use in interacting and manipulating virtual objects in an augmented environment. In our challenge, we measure participants’ skills and abilities in interacting with “real” everyday objects to solely measure PT displays’ effect on dexterity.
In Task 2.1, Pouring and Placement, the participants must find a jug of water to fill the given cup on the desk half full, transport it without spilling it to another desk, and place it in the highlighted area, as shown in Figure 4.
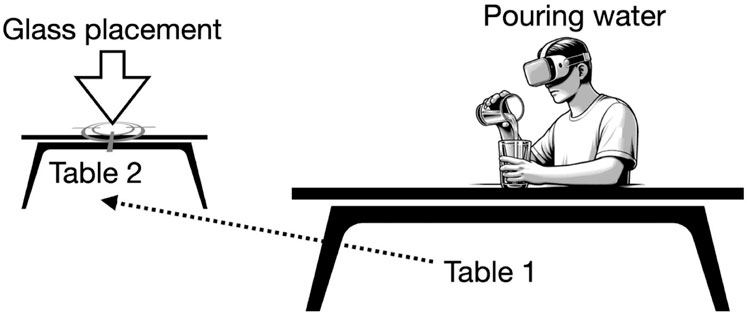
Figure 4. Pouring and Placement exercise.
Task 2.2, Text Searching and Writing, challenges the participants’ visual perception, eye-hand coordination, information processing, short-term memory, and dexterity while wearing a PT-AR headset. In this task, participants must locate the provided sheet on a desk full of names printed in different sizes. They must localize the given name, use a given pen, and mark it. After completion, participants must find, remember, and write the name into a separate name sheet, as shown in Figure 5.
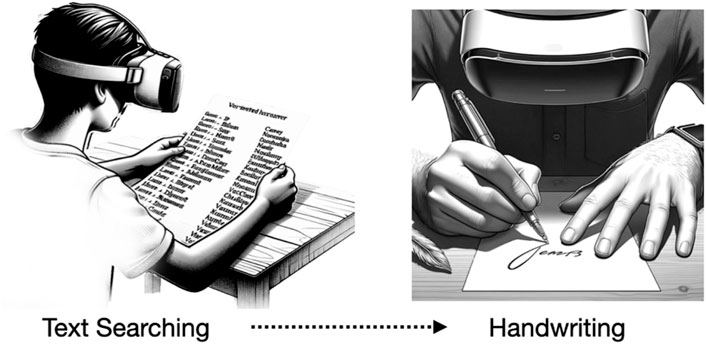
Figure 5. Text Searching and Writing exercise.
Task 2.3., Time Management challenges the user’s perception, navigation, eye-hand coordination, information processing (cognitive load), and short-term memory in interacting with their smartphone, a physical, digital object to read current time, say it out aloud, and set an alarm 4 h from their current time, as shown in Figure 6.
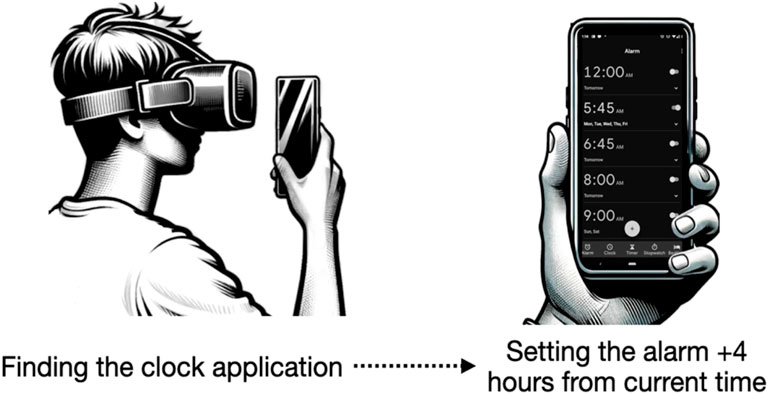
Figure 6. Time Management exercise.
3.4.3 Task 3: full body coordination and balance
This was the final and most physically demanding exercise. All cybersickness studies mention the mismatch between the visual and vestibular system as a reason for discomfort and disorientation. Naturally, balance is where the visual and vestibular system plays a significant role in our lives. Accordingly, we designed balance and body coordination tasks inspired by FST. FSTs are a series of tests and tasks used by law enforcement officers to determine if a person shows visible signs of impairment or intoxication at a level that can impact communication between the visual and vestibular systems, becoming dangerous for oneself and others (Burns and Moskowitz, 1977). We used FSTs task 3.1 Walk-and-Turn (WAT) and task 3.2 Balance (One-Leg Stand) to challenge and observe the participants’ ability while using PT-displays. The participants must stand on the marked starting point and walk in a straight line, placing their toes against their heels each step nine times. After the last step, the subject must turn around (180°) and perform the same toe-against-heel movement back to the marked starting point (see Figure 7A). On the marked floor, participants should maintain their balance for 30 s (administrators counting) while standing on one foot they chose (see Figure 7B). After completing the time limit, participants should approach the administrators and shake hands with them to signal the end of the test.
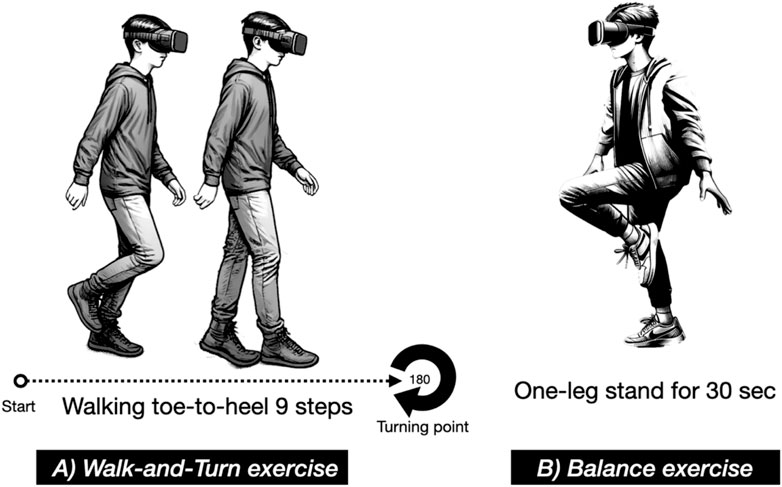
Figure 7. Full body coordination and balance tasks, including (A) Walk-and-Turn exercise and (B) Balance (One-Leg Stand) exercise.
3.5 Data collection and analysis
After the exercises and brief interviews, participants were asked to complete surveys, including the NASA-TLX and SSQ questionnaires. These questionnaires were submitted online, allowing for rapid data collection and participant convenience. Anonymity was maintained by using system-assigned ID numbers instead of collecting personal identifiers such as names or e-mail addresses. The collected data were analyzed to quantify the impact of PT displays on the user’s performance in each task.
With NASA Task Load Index (NASA-TLX), we collected information within six domains to measure their perceived workload during each exercise. We collected each participant’s answer on a scale of 1–10, calculated mean values, and conducted standard deviation (SD) focusing on the population to identify the variability of individual answers among the group members. This data showed us the agreement (SD) and the average responses within each category. In comparison between the Low-end PT-AR and the High-end group, we conducted a t-test with a significance level of α = 0.05 to assess statistically significant differences.
A similar approach was adopted using the Simulator Sickness Questionnaire (SSQ) to identify side effects of PT during and shortly after the experiment. We collected information on simulator sickness symptoms through a modified SSQ framework. Additionally, we modified the weighting of symptoms. The original SSQ groups symptoms into three categories: Nausea, Oculomotor, and Disorientation, with certain symptoms (such as general discomfort, difficulty focusing, and nausea) contributing to multiple categories. To provide a more detailed and cleaner overview without weighting bias of the severity of the symptoms, particularly given our novel test environment, we adopted a linear severity scale: “None” = 0, “Slight” = 1, “Moderate” = 2, and “Severe” = 3. This scale was selected to measure the severity of the 15 symptoms equally. We then calculated the mean and standard deviation to assess variance in participant responses. To compare results between the Low-end PT-AR group and the High-end PT-AR group, we conducted t-tests with a significance level of α = 0.05 to assess statistically significant differences.
In addition, the facilitators’ subjective observations and semi-structured interview findings were noted on the corresponding protocols for searching for correspondence with the qualitative data and recurring patterns within the participants’ answers.
3.6 Ethical considerations
The study was designed and conducted in strict accordance with the guidelines of the National Committee for Research Ethics (NESH, 2021) for research involving human participants. Participation was voluntary, and all participants were fully informed about the study. Personal identifiers were removed, and the data was collected anonymously to prevent any future tracking or identification, thereby respecting participant privacy and confidentiality in line with the European Commission’s (2018) General Data Protection Regulation.
4 Results
The following section presents the results, incorporating data from the NASA Task Load Index (NASA-TLX) and the Simulator Sickness Questionnaire (SSQ), as well as insights from post-test interviews and observations.
4.1 Pass-through displays impact on task execution
4.1.1 Task 1 – walking exercise
Despite its simplicity, the task influenced participant behavior and performance in both groups (see Figure 8). Low-end PT-AR users reported low mental (M = 2.0, SD = 1.00) and physical demand (M = 2.2, SD = 0.75), and only mild temporal pressure (M = 2.6, SD = 1.11). However, frustration levels were notably higher (M = 5.4, SD = 1.91), despite moderate effort (M = 2.7, SD = 0.64) and generally high performance ratings (M = 7.7, SD = 1.62), suggesting some dissatisfaction, as shown in Figure 8.
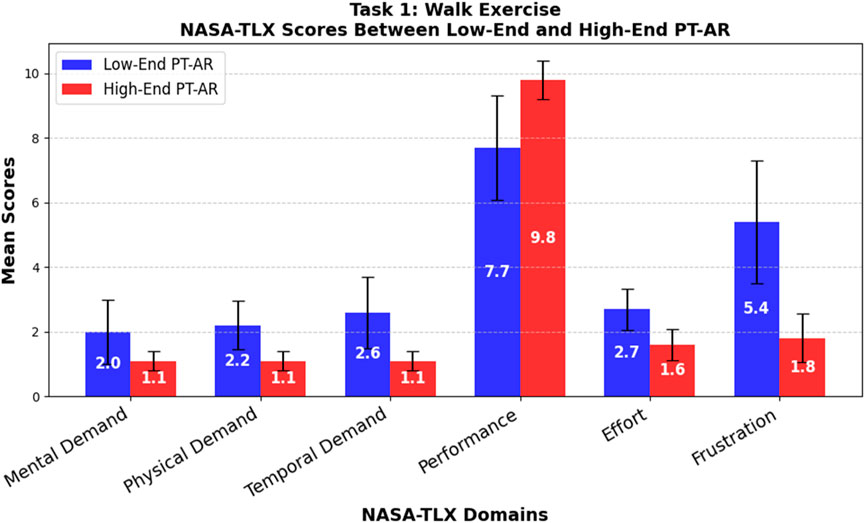
Figure 8. Task 1 – walking exercise.
High-end PT-AR users showed consistently low scores across all NASA-TLX domains: mental, physical, and temporal demand were minimal (all M = 1.1, SD = 0.30), effort was low (M = 1.6, SD = 0.49), and frustration was low (M = 1.8, SD = 0.75). Performance was rated very high (M = 9.8, SD = 0.60) with minimal variation across participants, as shown in Figure 8.
Statistical comparisons revealed the Low-end PT-AR was significantly more demanding mentally (t = 2.73, p = 0.014), physically (t = 4.31, p < 0.001), and temporally (t = 4.13, p < 0.001). It also required more effort (t = 4.32, p < 0.001), caused greater frustration (t = 5.55, p < 0.001), and resulted in lower perceived success (t = −3.84, p = 0.0012). These results highlight the High-end PT-AR’s advantage in reducing workload and enhancing user experience during basic mobility tasks.
4.1.2 Task 2 – dexterity and spatial coordination
4.1.2.1 Task 2.1 – pouring and placement
Low-end PT-AR participants reported low mental (M = 2.4, SD = 1.36) and physical demand (M = 2.8, SD = 1.25) but experienced moderate temporal pressure (M = 4.3, SD = 1.79). Performance was moderate (M = 6.2, SD = 1.47), though effort (M = 6.0, SD = 1.95) and frustration (M = 5.8, SD = 2.23) were notably high and variable, as shown in Figure 9.
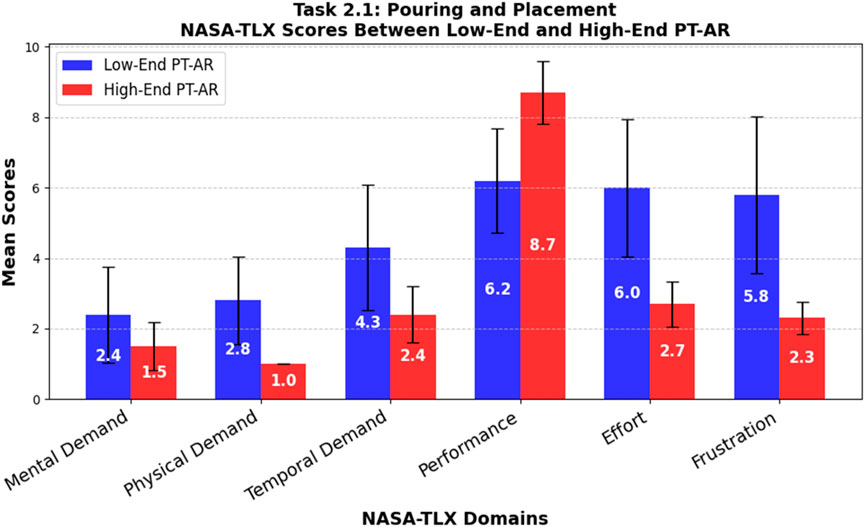
Figure 9. Task 2.1 – pouring and placement.
In contrast, high-end PT-AR participants experienced minimal mental (M = 1.5, SD = 0.67) and physical (M = 1.0, SD = 0.0) demand. Temporal demand was low to moderate (M = 2.4, SD = 0.8), with high perceived performance (M = 8.7, SD = 0.9), moderate effort (M = 2.7, SD = 0.64), and low frustration (M = 2.3, SD = 0.46), as shown in Figure 9.
Statistical comparisons revealed no significant difference in mental demand (t = 1.88, p = 0.077). However, the low-end PT-AR was significantly more physically demanding (t = 4.55, p < 0.001) and imposed greater temporal demand (t = 3.06, p = 0.0067). Participants performed significantly better with the high-end system (t = −4.59, p < 0.001), while the low-end device required more effort (t = 5.08, p < 0.001) and caused more frustration (t = 4.86, p < 0.001). These findings suggest that the low-end system’s lower technical fidelity increased physical strain and task stress.
4.1.2.2 Task 2.2 – text searching and handwriting
The low-end PT-AR system was rated as highly mentally demanding (M = 7.3, SD = 1.27) but physically undemanding (M = 1.9, SD = 0.94). Participants reported high temporal pressure (M = 6.9, SD = 1.37) and moderately high performance (M = 7.5, SD = 1.36), but this was achieved with considerable effort (M = 7.8, SD = 1.66) and frustration (M = 7.1, SD = 2.07), as shown in Figure 10.
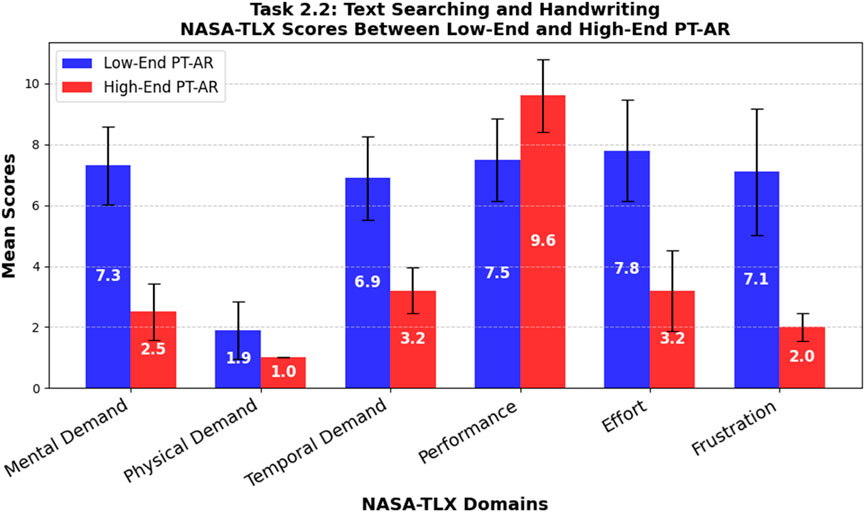
Figure 10. Task 2.2 – text searching and handwriting.
Participants using the high-end PT-AR reported lower mental (M = 2.5, SD = 0.92) and physical (M = 1.0, SD = 0.0) demands. Temporal demand was mild (M = 3.2, SD = 0.75), and performance was rated highly (M = 9.6, SD = 1.2). Effort (M = 3.2, SD = 1.33) and frustration (M = 2.0, SD = 0.45) were both low, as shown in Figure 10.
Comparative analysis confirmed that the low-end PT-AR was significantly more mentally (t = 9.68, p < 0.001) and physically (t = 3.03, p = 0.007) demanding. Temporal pressure was also significantly higher (t = 7.49, p < 0.001). Participants felt more successful with the high-end device (t = −3.66, p < 0.002), while the low-end required significantly more effort (t = 6.84, p < 0.001) and caused greater frustration (t = 7.61, p < 0.001). These results highlight a substantial difference in workload and experience between systems during fine-motor interaction tasks.
4.1.2.3 Task 2.3 – time management
Low-end PT-AR participants reported low mental (M = 2.1, SD = 0.83) and physical (M = 1.8, SD = 0.60) demand, with slightly higher but variable temporal demand (M = 2.8, SD = 1.40). Performance ratings were high (M = 7.7, SD = 1.10), though effort (M = 5.9, SD = 2.12) and frustration (M = 5.0, SD = 2.10) levels were elevated, as shown in Figure 11.
The high-end PT-AR group reported similarly low mental (M = 1.9, SD = 2.12) and physical (M = 1.0, SD = 0.0) demand. Temporal demand was low (M = 2.1, SD = 1.45). Participants reported high performance (M = 9.1, SD = 2.39), moderate effort (M = 3.4, SD = 2.33), and low frustration (M = 2.7, SD = 2.19), as shown in Figure 11.
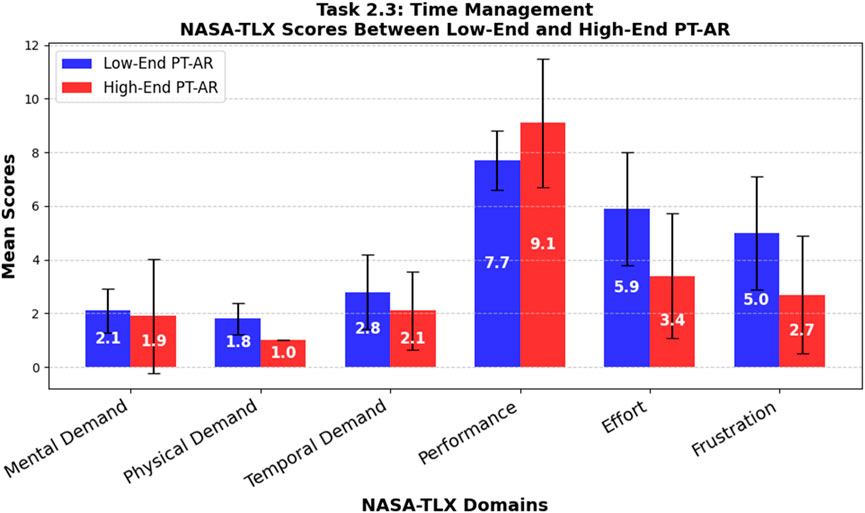
Figure 11. Task 2.3 – time management.
No significant difference was found in mental demand (t = 0.28, p = 0.79) or temporal demand (t = 1.10, p = 0.29). Physical demand was significantly higher in the low-end condition (t = 4.22, p = 0.002). While performance differences were not statistically significant (t = −1.68, p = 0.12), the low-end system required more effort (t = 2.51, p = 0.022) and led to greater frustration (t = 2.40, p = 0.028). These findings indicate that even in simple, stationary tasks, PT-AR quality impacts user comfort and perceived efficiency.
4.1.3 Task 3 – body coordination and balance
4.1.3.1 Task 3.1 – walk-and-turn
Participants using the low-end PT-AR system reported very high mental (M = 8.2, SD = 1.60) and physical (M = 8.8, SD = 0.87) demand, along with moderate temporal pressure (M = 5.8, SD = 1.08). Performance was rated low (M = 4.3, SD = 2.41), while effort (M = 9.5, SD = 0.67) and frustration (M = 9.3, SD = 0.78) were extremely high, as shown in Figure 12.
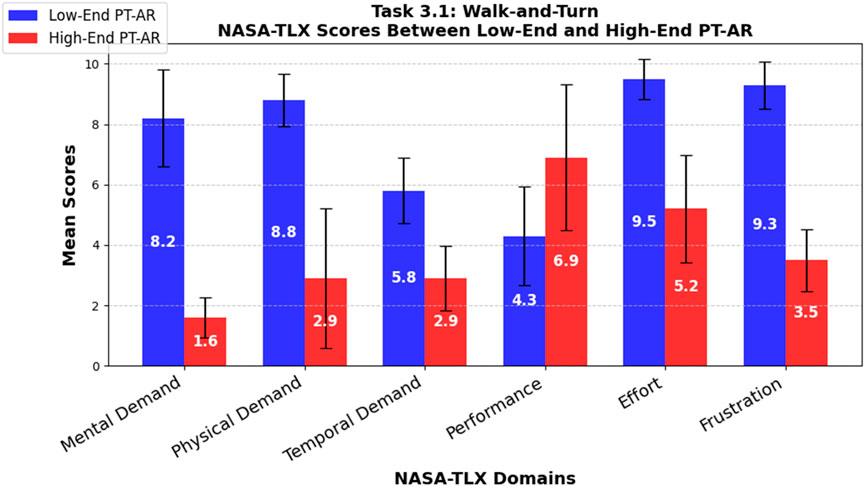
Figure 12. Task 3.1 – walk-and-turn.
In contrast, high-end PT-AR participants reported low mental demand (M = 1.6, SD = 0.66) and moderate physical demand (M = 2.9, SD = 2.30). Temporal demand was modest (M = 2.9, SD = 1.64), with participants generally feeling successful (M = 6.9, SD = 1.97). Effort was moderate (M = 5.2, SD = 1.78), and frustration levels were relatively low (M = 3.5, SD = 1.02), as shown in Figure 12.
Statistical analysis confirmed the low-end PT-AR system was significantly more mentally (t = 12.06, p < 0.001), physically (t = 7.59, p < 0.001), and temporally (t = 4.67, p < 0.001) demanding. Participants performed significantly better with the high-end system (t = −2.64, p = 0.017), and the low-end device required significantly more effort (t = 7.15, p < 0.001) and frustration (t = 14.28, p < 0.001). These consistently low p-values highlight a strong contrast in user experience between devices.
4.1.3.2 Task 3.2 – balance
Low-end PT-AR participants reported moderate mental demand (M = 4.8, SD = 3.25), high physical demand (M = 7.6, SD = 3.07), and high temporal demand (M = 7.6, SD = 1.85). Performance was low (M = 2.0, SD = 0.89), while effort (M = 9.7, SD = 0.46) and frustration (M = 9.6, SD = 0.49) were exceptionally high, as shown in Figure 13.
Participants using the high-end system experienced low mental demand (M = 1.0, SD = 1.20), moderate physical demand (M = 3.2, SD = 2.27), and moderate temporal pressure (M = 4.8, SD = 1.83). Performance was rated higher (M = 6.4, SD = 1.96), with moderate effort (M = 5.8, SD = 1.40) and frustration (M = 4.3, SD = 1.55), though responses varied, as shown in Figure 13.
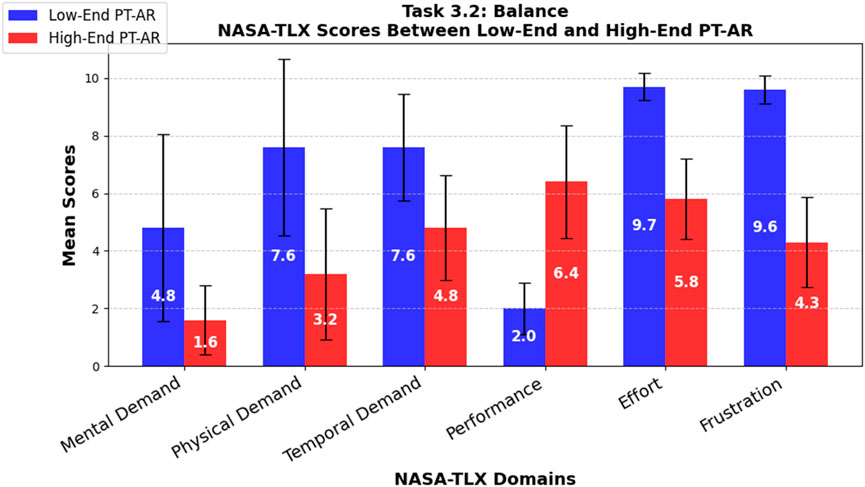
Figure 13. Task 3.2 – balance.
All NASA-TLX domains showed statistically significant differences. The low-end PT-AR was more mentally (t = 2.92, p < 0.009) and physically (t = 3.64, p < 0.002) demanding, and it imposed significantly more temporal pressure (t = 3.40, p = 0.003). High-end users performed significantly better (t = −6.46, p < 0.001), and the low-end system required substantially more effort (t = 8.37, p < 0.001) and caused greater frustration (t = 10.31, p < 0.001). These findings further support the conclusion that the high-end PT-AR system provides a notably more comfortable and effective user experience during full-body coordination tasks.
4.2 Simulation sickness symptoms
None of the devices provided a symptom-free experience. When completing user tasks with the Low-end PT-AR system, participants experienced various simulator sickness symptoms. The strongest symptoms included general discomfort (M = 1.8; SD = 0.87), difficulty focusing (M = 1.5; SD = 0.67), and difficulty concentrating (M = 1.4; SD = 0.66). Other symptoms reported were occasional sweating (M = 0.9; SD = 0.54), eye strain (M = 0.9; SD = 0.54), slight blurred vision (M = 0.4; SD = 0.92), fatigue (M = 0.4; SD = 0.49), fullness of head (M = 0.4; SD = 0.49), rare dizziness with eyes open and closed (M = 0.2; SD = 0.40), stomach awareness (M = 0.1; SD = 0.30), and burping (M = 0.1; SD = 0 0.30), as shown in Figure 14.
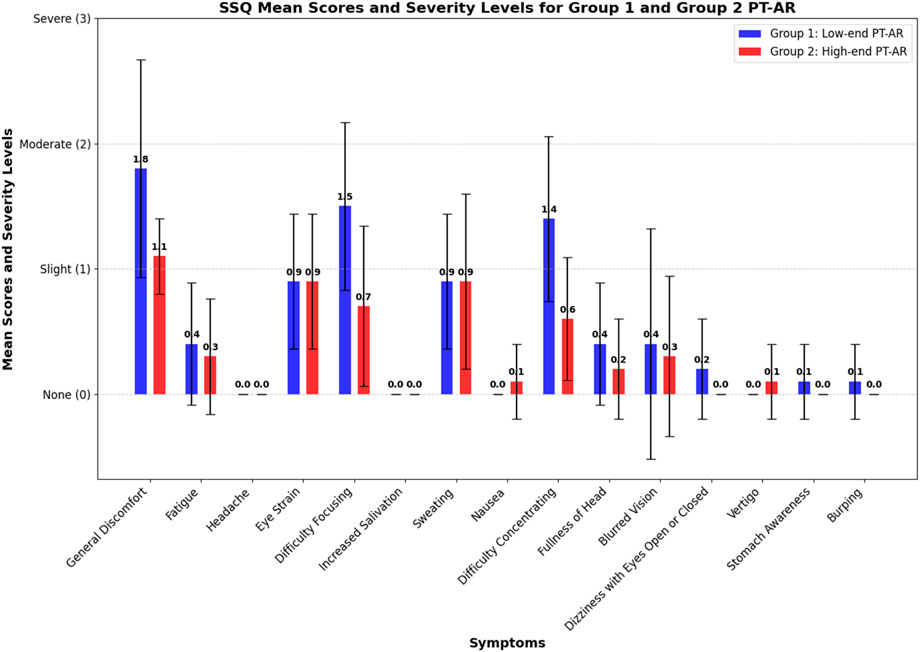
Figure 14. SSQ Mean scores and Severity Levels.
In contrast, when using the High-end PT-AR system, participants experienced fewer and less severe symptoms. The most common symptoms were general discomfort (M = 1.1; SD = 0.30), eye strain (M = 0.9; SD = 0.54), and sweating (M = 0.9; SD = 0.70). Participants also reported difficulty focusing (M = 0.7; SD = 0.64)), difficulty concentrating (M = 0.60; SD = 0.49), slight fatigue (M = 0.3; SD = 0.46), blurred vision (M = 0.3; SD = 0.64), fullness of head (M = 0.2; SD = 0.40), and rare occurrences of nausea (M = 0.1; SD = 0.30) and vertigo (M = 0.1; SD = 0.30), as shown in Figure 14.
Comparing the two systems, the High-end PT-AR scored significantly lower (p < 0.05) in general discomfort (t = 2.40; p = 0.026), difficulty focusing (t = 2.73; p = 0.013), and difficulty concentrating (t = 3.07; p = 0.006). Other symptoms did not show significant (p > 0.05) differences. Nausea and vertigo were uncommon and only reported by the High-end PT-AR group. None of the participants experienced headache or increased salivation. Overall, the High-end PT-AR system provided a significantly better user experience by reducing the severity and frequency of simulator sickness symptoms, particularly in terms of general discomfort, difficulty focusing, and difficulty concentrating. These symptoms are typically Oculomotor Symptoms, a result of conflicting signals from the visual and vestibular system. This highlights the superior ergonomic design, user comfort and display and sensor technology of the High-end PT-AR system compared to the Low-end PT-AR system.
4.3 Direct observations and user insights
The qualitative findings, drawn from observation protocols and brief semi-structured interviews, revealed recurring patterns in user behavior, challenges, and perceptions across tasks. This section summarizes those findings.
4.3.1 Observational findings
The following observations were drawn from field notes based on the observation protocol in Supplementary Appendix SC. The section summarizes recurring patterns in user behavior, task performance, and physical responses across device types and task categories.
4.3.1.1 General observations
Participants’ initial reactions to viewing the environment through the PT-AR headsets varied notably by device type. Across both groups, most individuals appeared curious and slightly disoriented. They looked around slowly and cautiously, sometimes with mouths slightly open or hands raised toward their faces, gestures suggesting a mismatch between visual input and bodily awareness. Differences emerged in how quickly participants felt ready to begin. High-end users acclimated more rapidly, often exploring the space with minimal hesitation. Low-end users took longer to orient themselves, frequently pausing and scanning their surroundings with caution.
Participants’ verbal reflections aligned with these patterns. Some low-end users described the experience as “like watching a movie,” indicating a sense of detachment. In contrast, high-end users offered more complex descriptions, such as “fake, but real at the same time,” capturing the uncanny mix of realism and artificiality.
4.3.1.2 Task 1 – walking exercise
Clear differences were observed between the low-end and high-end groups in confidence, behavior, and performance. Low-end users often looked down to monitor foot placement and moved with noticeable caution. They showed more hesitation and coordination difficulty while walking. A few unintentionally brushed against the doorframe with an arm or shoulder, though most did not recall these contacts during interviews. Four such incidents were recorded, though additional minor touches may have gone unnoticed due to their subtlety.
4.3.1.3 Task 2 – dexterity and spatial coordination
In fine-motor activities like text searching and handwriting, both groups engaged similarly, but performance varied. High-end users interacted with objects more accurately, though they reached cautiously and frequently inspected items such as tables (Task 2.1), pencils (Task 2.2), or phones (Task 2.3) to confirm what they were seeing. Nearly all reported some visual distortion (see Figure 15C). Low-end users did not mention visual glitches but often hesitated before grasping objects. They sometimes needed multiple attempts to pick up items like pencils or cups. Placement accuracy was lower; for instance, cups were often placed outside marked zones and had to be adjusted. In reading and writing tasks (Task 2.1), low-end users leaned in more and made more lateral head movements than the high-end group.
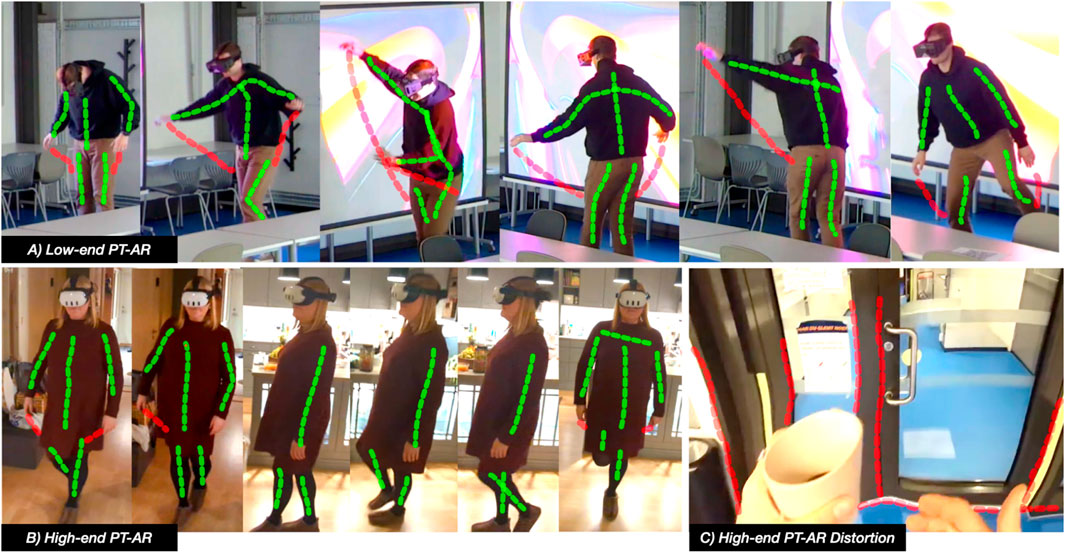
Figure 15. (A) Low-end PT-AR disorientation during Task 3, with green dotted lines indicating posture and red dotted lines showing misalignment from ideal hand position. (B) High-end PT-AR orientation. (C) Image distortion highlighted with red dotted lines through High-end PT-AR.
Both groups struggled to read smartphone screens during the time management task (Task 2.3). Low-end users cited poor clarity, while high-end users noted visual distortion when viewing the screen up close.
4.3.1.4 Task 3 – body coordination and balance
Full-body tasks were especially difficult for the low-end group. In the walk-and-turn task (3.1), participants showed signs of disorientation, using rapid hand motions and compensatory gestures to maintain balance (see Figure 15A). In the balance task (3.2), four out of ten low-end users reached out to the researcher for support, and seven had to restart after losing balance.
High-end users performed with greater stability and confidence across both tasks. Although they also showed focus and effort (see Figure 15B), they maintained better control and completed the sequences with fewer interruptions. These results suggest that higher-end systems provide better support for complex movement tasks.
4.3.1.5 Observation of discomfort
No visible signs of motion or cybersickness (e.g., dizziness, sweating, or verbally expressed discomfort) were observed during task execution. However, both groups made minor headset adjustments during tasks, such as repositioning the device for a better fit. One low-end participant briefly lifted the headset during Task 2.2 but later reported it was unintentional. At the end of the sessions, participants in both groups took deep, audible breaths after removing the headset, suggesting a shared sense of relief.
4.3.2 Interview insights
The brief post-experiment interviews offered valuable insights into participants’ subjective experiences with PT-AR displays, complementing quantitative measures and behavioral observations. Responses were analyzed thematically based on Supplementary Appendix SC’s interview guide and organized by general impressions, task-specific reflections, and reported discomfort.
4.3.2.1 Initial impressions
Across both groups, participants struggled to articulate their experiences but described recurring sensations such as artificiality, disconnection, and unfamiliarity. Many referred to the environment as “weird,” “unnatural,” or “fake.”
Low-end users often likened the experience to “watching a movie,” which, upon further discussion, appeared to stem from camera noise and a sluggish frame rate. Although the frame rate was technically stable, slight delays between movement and screen rendering may have contributed to this cinematic impression. High-end users echoed the sense of artificiality but described it as “fake, but real at the same time,” pointing to the immersive but uncanny nature of the display. Across both groups, participants frequently mentioned reduced visual clarity and a disconnect between what they saw and how their bodies felt in the space.
4.3.2.2 Task 1 – walking exercise
Low-end participants reported uncertainty, frustration, and lack of body awareness, citing screen lag, reduced field of view, and difficulty judging object proximity, such as misperceiving the doorframe. When asked about contact incidents, three participants were unaware it had occurred; one noticed but misjudged the doorframe’s location.
High-end users reported greater ease but noted initial disorientation and limited peripheral vision. One described the headset as a “helmet.” Most did not report significant issues, though several described walking with the device as “weird,” without being able to explain further.
4.3.2.3 Task 2 – dexterity and spatial coordination
In Pouring and Placement (Task 2.1), Low-end users struggled to locate and grasp the cup, describing misalignment between their fingers and the object as “I catched the air, It was not exactly where it should have been.” These sensations disrupted their confidence and frustrated them. High-end users did not report such issues but mentioned occasional visual artifacts or distortions in the surrounding environment. Concerning Text Searching and Writing (Task 2.2), Low-end participants reported visual clarity issues attributed to video noise and possibly to the smartphone’s autofocus. Participants who leaned in closely to the given name list or made excessive head movements while searching were often unaware they had done so. One participant briefly lifted the headset to see better, explained that the movement was not intentional, and joked that she did not try cheating. High-end users, as with other tasks, found screen distortion distracting. Reflecting on Time Management (Task 2.3), both groups expressed challenges reading the smartphone screen. Low-end users cited screen blurriness, visual lag, and trouble accurately tapping on app icons. High-end users primarily mentioned distortion when holding the phone up close but did not report touch accuracy issues.
4.3.2.4 Task 3 – body coordination and balance
Concerning Walk-and-Turn (Task 3.1), most low-end users reported disorientation and difficulty maintaining balance, and reported frustration because of the unpredictability of each step. Some explained that they were trying to come up with a strategy to stop and focus but still misstepped. High-end participants described the task as more difficult with the headset than without but described it as manageable. Many emphasized the need to concentrate on holding the balance but did not report significant balance issues.
During Balance (Task 3.2), low-end participants expressed high frustration and found it hard to remain stable, even for a few seconds. Many could not articulate the sensation but described it as not feeling the weight on their feet on the ground. Some were unaware they had reached out for support by grabbing the researcher next to them; others did so intentionally and restarted the task. Most expressed disbelief and frustration about not being able to stand on one foot. High-end users reported milder challenges, describing the task as “more difficult than expected” but still manageable.
4.3.2.5 Discomfort, cyber or simulation sickness
No participants reported severe cybersickness or motion sickness symptoms. However, many described tiredness and warmth, often accompanied by sweating, and expressed relief after completing the tasks. These responses were especially pronounced in the low-end group. High-end participants also reported mild to moderate mental exhaustion, occasional sweating, and eye strain. When asked, some attributed the sweating not to the challenging tasks themselves but to the enclosed nature of the headset.
In summary, Low-end participants faced significant challenges in mobility tasks (Tasks 1 and 3), although their performance in stationary tasks was comparable to that of High-end participants. High-end participants, despite facing slight difficulties because of image distortion artifacts in tasks requiring depth sensing, such as dexterity tasks (Task 2), generally outperformed Low-end participants, especially in mobility tasks (Tasks 1 and 3).
5 Discussion
Both quantitative and qualitative data showed that PT-displays negatively impact participants’ comfort, orientation, and interaction within the physical world. High-end PT-AR unsurprisingly outperformed Low-end in most tasks. However, winning the comparison does not necessarily guarantee widespread user adoption, nor does it imply that the technology is ready for mainstream adoption as a daily driver. All High-end participants reported certain levels of negative side effects. Yet, all tasks were elementary and performed in a controlled, ideal environment, with exposure durations kept below 15 min, under the threshold where cybersickness symptoms typically increases. Our controlled setting reduced the challenges and complexities that PT-AR users might face in real-world scenarios, such as uneven terrain, variable lighting conditions, and ground-level obstacles. These real-life factors can impose significantly greater demands on users’ ability to adapt and manage effectively. Regarding our participants’ skills and abilities, including the oldest participant, aged 77, the NASA-TLX mean scores were anticipated to range between 1 and 2, with low variability, when performing the tasks without any AR headset. However, these low scores were not attained, even with the high-end device, indicating an increased task load associated with using PT-AR technology. All observed user interactions exhibited some degree of hesitation and uncertainty during task execution. Nevertheless, the self-reported negative effects varied across users and devices, making this a complex phenomenon to analyze and understand.
5.1 PT impact on task execution
PT-displays negatively affect mental and physical demand, effort, frustration, and performance. However, High-end PT-AR, in general, has a lower impact, considering mental and physical demand, effort, and frustration while increasing task performance scores. The walking exercise (Task 1) demonstrated a high-performance score across all devices, although there were noticeable issues with the Low-end PT-AR device. For instance, participants occasionally bumped into door frames and frequently checked their feet to orient themselves. This behavior may have been caused by the device’s limited field of view (FOV) and higher render latency compared to the high-end specs. Accordingly, these issues were absent from High-end PT-AR participants. The differences in dexterity and spatial coordination (Task 2) were more pronounced and noticeable among participants using the low-end device. These participants had to “look” more closely at physical objects and adjust their grip to locate and hold the objects, indicating a lack of accurate depth perception and challenges with effective hand-eye coordination. High-end devices produced different artifacts. Participants had depth sensing but with distorted reality around them. When a user places an object close to the headset, image distortion occurs during the rendering of the stereoscopic image giving an impression of a “blending reality.” This artifact was most prominent, and disturbing when participants had to set an alarm clock on their smartphones (Task 2.3). They needed to hold the phone close to the headset to read the screen; as a result, the rectangular shape of the smartphone and its screen often got unnaturally stretched and distorted, making participants hesitate and falling out of immersion.
PT-display’s impact to the extreme became visible during the most challenging, frustrating tasks, such as the full body coordination tasks (Task 3), which turned into a comical struggle, a “drunk simulator” for the Low-end PT-AR participants. All PT-displays affected of motion-to-photon latency, a time delay between detecting motion, processing the analogue visual data to digital, and rendering the updated video stream on the display. This latency, even if measured in milliseconds, can break the natural communication between the vestibular and visual systems, causing balance and coordination issues. These adverse effects were also recorded in the participants’ effort, performance, and frustration scores, mostly affecting Low-end and significantly lower effecting High-end participants. Motion-to-photon latency is a technological limitation that can be mitigated through hardware advancements. It is important to note that our low-end device utilized the Pixel 6, which features a 90 Hz display. While lower than the 120 Hz display of the high-end device, it is 50% higher than typical mid-range smartphones with 60 Hz screens. Beyond refresh rate, other crucial factors must be considered, such as faster connections and higher bandwidth between sensors and computational units to reduce and minimize processing delays. Achieving this requires specific chipset optimization for AR, which is typically neither required nor utilized by smartphones, thereby widening the performance gap between MAR and proprietary AR offerings, as also demonstrated by our data. This makes us wonder how technology will improve in the future or if the limit of low(est) latency has already been reached and achieved by Meta and Apple.
5.2 General discomfort: simulation, cyber, or CybAR sickness?
Most participants reported symptoms of general discomfort, difficulty focusing, and difficulty concentrating, with these symptoms exhibiting significantly higher severity levels than others, regardless of the devices used. The Low-end group experienced notably higher severity compared to the High-end group; however, the differences in severity across symptoms followed a similar pattern. Interestingly, these three symptoms were not the typical indicators of simulation or cyber sickness, such as nausea, headaches, eyestrain, blurred vision, or dizziness (Kaufeld et al., 2022; Saredakis et al., 2020; Rebenitsch and Owen, 2016).
In contrast, our SSQ results showed that nausea was very uncommon, being reported as “slight” by only one in the High-end group. Similarly, dizziness with both open and closed eyes was reported twice, rated as “slight” by the Low-end group. Headaches were not reported, regardless of the devices used. Other symptoms such as eye strain were equally reported on both device groups, while blurred vision was only reported by a few users. Accordingly, the symptom patterns identified in our study do not align with the most prominent symptoms of simulation or VR studies, though they are present in the SSQ list.
This could be because task execution in AR did not take longer than 8 min max, so participants did not have time to develop the typical or severe symptoms. According to Martirosov et al. (2022) time spent in the virtual environment affects symptom development negatively. Another reason could be while PT-AR is technically VR, locomotion and movement is hugely different. As noted by Saredakis et al. (2020), users that navigating in VR using a controller are more prone to cybersickness than those using natural body movements. In our experiment, PT-AR users in Tasks 1 and 3 moved by walking naturally. The artificial perception (camera vision) of the real physical world could also affect users’ biological systems differently than in VR. PT-AR participants perceive visual and auditory cues related to their natural movement, albeit the slight latency and image distortion glitches. This aligns with the findings of Pöhlmann et al. (2023), who demonstrated that multisensory audio-visual motion cues effectively mitigated cybersickness symptoms in VR. These cues are inherently integrated into PT-AR, providing a similar advantage from the outset.
Overall, task duration, PT-AR attributes such as motion-to-photon latency, misalignment between eye and hand coordination, artificial focus, and depth perception may have contributed to a distinct set of symptom trends, which are novel in the context of PT-AR. Therefore, future research is needed to explore the perception and interaction with the physical world and objects using PT-AR devices. It may also be necessary to establish a new category to investigate PT-AR-specific symptoms, which could be termed as “CybAR sickness.”
5.3 PT displays in AR
As industry giants incorporate PT displays into their flagship XR solutions, it is crucial to understand how this impacts the reality aspects of these technologies. Our results show substantial resolvable issues such as general discomfort, difficulty in focusing, difficulty in concentrating, considering PT-AR in being present, navigating, and interacting in the real world. Regardless of these challenges, more static AR experiences, i.e., users are not required to walk, move around, or interact with objects more than within arm’s reach, are a lesser issue, as shown during the more static, stationary Dexterity tasks in Task 2. The low physical and mental demand resulted in high performance and low frustration scores across both devices. The lack of movement conflicts less with the biological connection between the vestibular and visual systems. Accordingly, our observations correlate with the study of Szentirmai and Murano (2023) proposing such low-effort, low-movement AR experiences. A similar rule applies in VR, where a more “static experience” or the use of teleports can significantly reduce cybersickness. Meta currently categorizes VR games as “Comfortable,” “Moderate,” or “Intense” in its app store, providing users with guidance on potential cybersickness risks associated with each level of movement intensity.
However, the desired future of AR is the promise to become a daily driver, seamlessly enhancing and extending our reality without the need for “taking breaks” and constantly putting on and taking off the headsets, as we already can see in marketing ads, promotions, and tech reviews of XR. Based on our user experiments, observations, and experiences, the technology needs further maturing to make the marketing a reality and achieve mainstream adaptation of XR headsets as daily drivers.
Currently Low-end, head mounted MAR is lacking the most achieving this. The technological limitations are down to the smartphone’s hardware. While the raw computational power is adequate, challenges remain with motion-to-photon latency is currently bellow acceptable thresholds. Beyond AR-focus, hardware development in this direction has no real use or benefit in smartphones. The low-latency Snapdragon XR2 Gen 2 chipset in the Quest 3, developed by Qualcomm, and the M2-R1 chipset in Apple’s Vision Pro are both available; however, smartphone manufacturers must commit to integrating these platforms into their devices to fully leverage their capabilities. If there is a demand from smartphone users to be able to use more seamless AR experiences, the technology can be ported into smartphones. A similar trend emerged during the last wave of VR/AR in 2016, when smartphones were released with unreasonably high resolutions and pixel densities to support cardboard VR applications. MAR has the potential to deliver AR features for users unable or unwilling to use stereoscopic HMDs, or those hesitant to invest in standalone headsets, as noted by Szentirmai (2024). Consequently, MAR could provide a more accessible and cost-effective entry point to AR for a broader audience. However, this will require significant advancements in smartphone technology by reducing motion-to-photon latency. In this domain, Apple holds a theoretical advantage by maintaining complete control over its hardware, software, development kits, and the App Store. Furthermore, all iPhone Pro models from the 12th generation onward are equipped with rear-facing LiDAR sensors, enabling advanced depth sensing capabilities. However, despite this potential, Apple does not officially support head-mounted MAR. Nonetheless, the technology transfer between Vision Pro and iPhone devices could be streamlined if driven by sufficient user demand and corporate intent.
High-end devices like the Meta Quest and Apple Vision Pro are expected to evolve through software updates in the coming years. Accordingly, the future of AR appears promising, with the potential to become more focused on and integrated with reality, where its true value lies. However, for now, seamless interaction with physical environments through PT-displays remains largely confined to promotional videos. It is important to note that the reality aspect and its challenges represent only one side of the full AR experience. AR’s added value, compared to VR, lies in its ability to enhance context awareness and extend reality, enhancing the user’s skills and abilities with multisensory digital content.
As Pöhlmann et al. (2023) suggest, digital cues and aids can help mitigate current technological limitations and reduce negative user impacts. With a deeper understanding of the technological and human factors contributing to discomfort, these issues can potentially be masked, managed, or eliminated through improved application design. This also confirmed by the recent work of Zhang et al. (2024), which demonstrated improved performance in precise object manipulation through digital overlays in AR. Although the findings were encouraging, other issues, such as the high cognitive load from advanced visual cues, highlight the urgent need for further research in these areas.
5.4 Future research
For further research to achieve a seamless PT-AR experience, we need:
• Human-centered studies to consider the users, age, gender, skills, and abilities and explicitly focus on PT-AR technologies and their impact on users’ wellbeing, comfort, and safety.
• Evidence-based design research to suggest generalizable design choices and guidelines to enhance the user experience, usability, and safety of the users through design.
• Tech-centered research focusing on motion-to-photon latency reduction through hardware, eventually implementing prediction algorithms to reduce render latency artificially through software.
• Field studies focusing on environmental issues, indoor-outdoor use, and the impact of lack of environmental effects, such as light, rain, or other issues that can break the experience, as well as finding more mature technological approaches to provide a coherent, safe, high-quality AR experience for indoor and outdoor usage.
• PT-AR-specific Framework for symptom measurement. From the technological point of view, PT-AR is VR, with novel variables such as the artificial sense of presence and natural movement. Accordingly, we need a more PT-focused framework than the NASA-TLX or the SSQ to collect accurate, generalizable data. These methods helped us to claim with confidence there is a negative impact of using PT-AR for being present and interacting with the natural world; however, not specific enough. A better-suited framework and more advanced research methods and taxonomy of the issues are needed to distinguish with confidence between “CybAR” or Cybersickness.
6 Limitations
The small sample size of the participants, divided into two groups using Low-end and High-end devices, is one of the most prominent limitations of our study. The diverse participants, regarding age, skills, and abilities, also added high variability to our quantitative results; however, it benefited us to see how a broader spectrum of users adapt to PT. Complementing our quantitative results, we utilized observational protocols to register mentionable user interactions during the experiments and conducted post-experiment semi-structured interviews to gain qualitative insights. We identified recurring patterns and joint issues regardless of user- or technology diversity. Our task selection was limited to ensure user safety and wellbeing, considering both task difficulty and time spent within the headset. Pilot testing revealed that tasks such as walking on stairs and indoor-outdoor use could be potentially dangerous, and extended time spent in the headset (15+ minutes) could significantly increase the likelihood of experiencing simulation sickness symptoms. Consequently, we adjusted our tasks to everyday activities that all participants could execute outside the headset, including our oldest participant. We minimized task difficulty and time spent in the headset to protect our participants while still being able to measure the impact of PT-AR displays on task execution. Another limitation is that the study focused only on comparing low-end and high-end PT-AR systems. Including OST-AR or a control condition without AR, as briefly explored in the pre-experiment walkthroughs, would have offered a stronger benchmark and helped assess potential placebo effects since both rely on users’ natural visual perception.
7 Conclusion
In conclusion, it is evident that both Low-end and High-end PT AR are currently inadequate and negatively impact everyday tasks, requiring a presence in “reality” and interaction with physical objects, regardless of what the marketing says. We found general discomfort, difficulty focusing and concentrating, and nervous bodily sensations across devices, noted by a diverse user base. The emphasis of the found symptoms is slightly different than the typical simulator or cybersickness responses, which needs further investigation to confirm and comprehend more. It is evident that further research concerning human and technological factors is needed before PT-AR can be seamlessly integrated into our daily lives. The newly discovered phenomenon of “CybAR” sickness and the artificial sense of presence remain critical areas for future research and development in AR and XR.
Data availability statement
The datasets presented in this article are not readily available because All essential data related to user interactions, experiences, and study outcomes are fully detailed within the manuscript. Due to privacy considerations, no additional participant-specific data is publicly available beyond what is disclosed in the manuscript. Requests to access the datasets should be directed to Attila Bekkvik Szentirmai, YXR0aWxhLmIuc3plbnRpcm1haUBudG51Lm5v.
Ethics statement
Ethical approval was not required for the studies involving humans because The study did not include vulnerable populations; all participants were adults who voluntarily consented to participate. Data was anonymized and untraceable, ensuring participant privacy in accordance with both local and external guidelines for research conduct. The study’s design prioritized participant safety and rights, including measures to mitigate potential discomfort and secure informed consent. Data collection followed established protocols to maintain confidentiality and protect participants’ well-being throughout the study. The studies were conducted in accordance with the local legislation and institutional requirements. The participants provided their written informed consent to participate in this study. Written informed consent was obtained from the individual(s) for the publication of any potentially identifiable images or data included in this article.
Author contributions
AS: Writing – original draft, Writing – review and editing. OA: Writing – original draft, Writing – review and editing. AT: Writing – original draft, Writing – review and editing. YI: Writing – original draft, Writing – review and editing.
Funding
The author(s) declare that no financial support was received for the research and/or publication of this article.
Conflict of interest
The authors declare that the research was conducted in the absence of any commercial or financial relationships that could be construed as a potential conflict of interest.
Generative AI statement
The author(s) declare that Generative AI was used in the creation of this manuscript. We acknowledge user task illustrations were created with assistance from DALL-E 2, then refined and composed in Affinity Designer. Data calculations were performed using SciPy, and visualizations were generated with Matplotlib. A combination of Grammarly/GO and ChatGPT-4 was used for proofreading and grammatical refinements.
Publisher’s note
All claims expressed in this article are solely those of the authors and do not necessarily represent those of their affiliated organizations, or those of the publisher, the editors and the reviewers. Any product that may be evaluated in this article, or claim that may be made by its manufacturer, is not guaranteed or endorsed by the publisher.
Supplementary material
The Supplementary Material for this article can be found online at: https://www.frontiersin.org/articles/10.3389/frvir.2025.1533236/full#supplementary-material
References
Andrews, C., Southworth, M. K., Silva, J. N., and Silva, J. R. (2019). Extended reality in medical practice. Curr. Treat. Options Cardiovasc. Med. 21, 18–12. doi:10.1007/s11936-019-0722-7
Attaran, M., and Morfn-Manibo, R. (2018). Your future reality will be digital. ISE Industrial and Syst. Eng. A. T. Work 50 (7), 26–31.
Aukstakalnis, S. (2016). Practical augmented reality: a guide to the technologies, applications, and human factors for AR and VR. Addison-Wesley Professional.
Azuma, R. T. (1997). A survey of augmented reality. Presence Teleoperators and Virtual Environ. 6 (4), 355–385. doi:10.1162/pres.1997.6.4.355
Ballestin, G., Solari, F., and Chessa, M. (2018). “Perception and action in peripersonal space: a comparison between video and optical see-through augmented reality devices,” in 2018 IEEE international symposium on mixed and augmented reality adjunct (ISMAR-Adjunct) (IEEE), 184–189.
Billinghurst, M., Clark, A., and Lee, G. (2015). A survey of augmented reality. Foundations and Trends® Human-Computer Interaction 8 (2-3), 73–272. doi:10.1561/1100000049
Burns, M., and Moskowitz, H. (1977). Psychophysical tests for DWI arrest. U.S. Department of transportation, national highway traffic safety administration. DOT HS -802 424. doi:10.21949/1524965
Chuah, S. H. W. (2018). “Why and who will adopt extended reality technology? Literature review, synthesis, and future research agenda,” in Literature review, synthesis, and future research agenda).
European Commission (2018). General data protection regulation (GDPR). Available online at: https://ec.europa.eu/info/law/law-topic/data-protection_en.
Giri, U., and Agrawal, P. (2020). Effect of virtual reality on motion sickness–An experimental study. Inter. J. of Sci.Research Publications (IJSRP) 10, 9809. doi:10.29322/IJSRP.10.02.2020.p9809
Goh, E. S., Sunar, M. S., and Ismail, A. W. (2019). 3D object manipulation techniques in handheld mobile augmented reality interface: a review. IEEE Access 7, 40581–40601. doi:10.1109/access.2019.2906394
Hart, S. G., and Staveland, L. E. (1988). Development of NASA-TLX (task load index): results of empirical and theoretical research. Advances Psychology 52, 139–183. doi:10.1016/s0166-4115(08)62386-9
Höllerer, T., and Feiner, S. (2004). “Mobile augmented reality,” in Telegeoinformatics: location-based computing and services, 221–260.
Josupeit, J. (2023). Cybersickness as the virtual reality sickness questionnaire (VRSQ) measures it!? an environment-specific revision of the VRSQ. Frontiers Virtual Reality 4, 1291078. doi:10.3389/frvir.2023.1291078
Kaufeld, M., Mundt, M., Forst, S., and Hecht, H. (2022). Optical see-through augmented reality can induce severe motion sickness. Displays 74, 102283. doi:10.1016/j.displa.2022.102283
Kennedy, R. S., Lane, N. E., Berbaum, K. S., and Lilienthal, M. G. (1993). Simulator sickness questionnaire: an enhanced method for quantifying simulator sickness. The International Journal of Aviation Psychology 3 (3), 203–220. doi:10.1207/s15327108ijap0303_3
Kim, H. K., Park, J., Choi, Y., and Choe, M. (2018). Virtual reality sickness questionnaire (VRSQ): motion sickness measurement index in a virtual reality environment. Applied ergonomics 69, 66–73. doi:10.1016/j.apergo.2017.12.016
LaViola Jr, J. J. (2000). A discussion of cybersickness in virtual environments. ACM Sigchi Bulletin 32 (1), 47–56. doi:10.1145/333329.333344
Martirosov, S., Bureš, M., and Zítka, T. (2022). Cyber sickness in low-immersive, semi-immersive, and fully immersive virtual reality. Virtual Reality 26 (1), 15–32. doi:10.1007/s10055-021-00507-4
Martirosov, S., and Kopecek, P. (2017). Virtual reality and its influence on training and education–Literature review. Annals of DAAAM and Proceedings 28, 0708–0717. doi:10.2507/28th.daaam.proceedings.100
Merge Education (2024). Merge AR/VR headset. Available online at: https://mergeedu.com/headset.
Meta (2024). Quest 3. Available online at: https://www.meta.com/no/en/quest/quest-3/.
National Committee for Research Ethics in the Social Sciences and the Humanities (NESH) (2021). Guidelines for research ethics in the social sciences, humanities, law and theology. The Norwegian Natl. Research Ethics Committees. Available online at: https://www.etikkom.no/en/ethical-guidelines-for-research/guidelines-for-research-ethics-in-the-social-sciences--humanities-law-and-theology/.
Park, W. D., Jang, S. W., Kim, Y. H., Kim, G. A., Son, W., and Kim, Y. S. (2017). A study on cyber sickness reduction by oculo-motor exercise performed immediately prior to viewing virtual reality (VR) content on head-mounted display (HMD). Vibroengineering Procedia 14, 260–264. doi:10.21595/vp.2017.19170
Pöhlmann, K. M. T., Li, G., Mcgill, M., Markoff, R., and Brewster, S. A. (2023). “You spin me right round, baby, right round: examining the impact of multi-sensory self-motion cues on motion sickness during a VR reading task,” in Proceedings of the 2023 CHI conference on human factors in computing systems, 1–16.
Porcino, T. M., Clua, E., Trevisan, D., Vasconcelos, C. N., and Valente, L. (2017). “Minimizing cyber sickness in head-mounted display systems: design guidelines and applications,” in 2017 IEEE 5th international conference on serious games and applications for health (SeGAH) (IEEE), 1–6.
Rebenitsch, L., and Owen, C. (2016). Review on cybersickness in applications and visual displays. Virtual Reality 20, 101–125. doi:10.1007/s10055-016-0285-9
Rolland, J. P., and Fuchs, H. (2000). Optical versus video see-through head-mounted displays in medical visualization. Presence 9 (3), 287–309. doi:10.1162/105474600566808
Saredakis, D., Szpak, A., Birckhead, B., Keage, H. A., Rizzo, A., and Loetscher, T. (2020). Factors associated with virtual reality sickness in head-mounted displays: a systematic review and meta-analysis. Frontiers Hum. Neurosci. 14, 96. doi:10.3389/fnhum.2020.00096
Szentirmai, A. B. (2024). “Enhancing accessible reading for all with universally designed augmented reality–AReader: from audio narration to talking AI avatars,” in International conference on human-computer interaction (Nature Switzerland: Springer), 282–300.
Szentirmai, A. B., and Murano, P. (2023). “New universal design heuristics for mobile augmented reality applications,” in International conference on human-computer interaction (Nature Switzerland: Springer), 404–418.
Wohlgenannt, I., Simons, A., and Stieglitz, S. (2020). Virtual reality. Bus. and Inf. Syst. Eng. 62 (5), 455–461. doi:10.1007/s12599-020-00658-9
Xiong, J., Hsiang, E. L., He, Z., Zhan, T., and Wu, S. T. (2021). Augmented reality and virtual reality displays: emerging technologies and future perspectives. Light Sci. and Applications 10 (1), 216. doi:10.1038/s41377-021-00658-8
Keywords: augmented reality, impact of pass-through display, pass-through AR interaction, cybersickness, augmented reality interaction
Citation: Szentirmai AB, Alsos OA, Torkildsby AB and Inal Y (2025) Are you drunk? No, I am CybAR sick! – interacting with the real world via pass-through augmented reality is a sobering discovery. Front. Virtual Real. 6:1533236. doi: 10.3389/frvir.2025.1533236
Received: 23 November 2024; Accepted: 07 April 2025;
Published: 27 May 2025.
Edited by:
Hai-Ning Liang, The Hong Kong University of Science and Technology (Guangzhou), ChinaReviewed by:
Niels Hinricher, Münster University of Applied Sciences, GermanyHu Xin, City University of Macau, Macao SAR, China
Copyright © 2025 Szentirmai, Alsos, Torkildsby and Inal. This is an open-access article distributed under the terms of the Creative Commons Attribution License (CC BY). The use, distribution or reproduction in other forums is permitted, provided the original author(s) and the copyright owner(s) are credited and that the original publication in this journal is cited, in accordance with accepted academic practice. No use, distribution or reproduction is permitted which does not comply with these terms.
*Correspondence: Attila Bekkvik Szentirmai, YXR0aWxhLmIuc3plbnRpcm1haUBudG51Lm5v