 Yi-Ting Huang
 Chih-Chieh Hsu1
 Tzu-Hsuan Wang
- 1Department of Interaction Design, National Taipei University of Technology (Taipei Tech), Taipei, Taiwan
- 2Doctoral Program in Design, College of Design, National Taipei University of Technology (Taipei Tech), Taipei, Taiwan
As virtual reality (VR) games are data-heavy, not only do they take time to load, but wearing a VR headset while waiting can also cause anxiety and agitation in players. This study thus focused on the design of VR loading interfaces, which is an underexplored area in VR research. We investigated how different levels of interaction and visual stimulation affect users’ psychological and behavioral responses. Drawing on theories of time perception and the stimulus-organism-response (SOR) model, we designed loading interfaces for a VR headset integrated with a physiological data collection module. Questionnaire surveys were also used to collect data from 58 participants on their emotions, time perceptions, and cognitive load experience with interactive and non-interactive VR loading interfaces. The results showed that interactive interfaces shortened users’ perception of waiting times, and increased positive emotions and decreased negative emotions while users waited for the game to load. Additionally, users of interactive interfaces were less negatively affected by visual stimulation, whereas in non-interactive interfaces, visual stimulation improved time perception and emotional response. These findings expand the application of SOR theory to VR waiting experiences and highlight the importance of interactivity and visual elements in optimizing the waiting experience, thus contributing to a better understanding of user needs in VR environments.
1 Introduction
To illustrate the theory of relativity, Einstein said, “Put your hand on a hot stove for a minute, and it seems like an hour; sit with a pretty girl for an hour, and it seems like a minute” (Garson, 2014). This statement reflects how external factors influence an individual’s perception of time. This phenomenon is especially evident in virtual reality (VR) environments. The immersive nature of VR typically reduces bodily awareness and enhances user engagement when they are actively participating in the environment, leading to a phenomenon known as time compression (Mullen and Davidenko, 2021; van der Ham et al., 2019), in which users underestimate the passage of time. However, time distortion can include expansion as well as compression. According to Niknam et al. (2024), time perception is influenced by user engagement and the dynamic nature of the VR environment. Active users typically experience time compression, whereas passive users, especially in dynamic VR environments, may feel detached from their surroundings, resulting in time expansion.
When VR games are loading, users are restricted by the headsets but are not actively engaged. This can intensify the distortion of time perception, triggering strong negative emotions (Heidrich et al., 2020; Igarzábal et al., 2021). However, emotional impact is not limited to negativity. When users experience enjoyment, relaxation, or satisfaction while waiting for the game to load, they tend to pay less attention to the passage of time and thus perceive it as moving faster (Witowska et al., 2020). This aligns with the concept of flow state, where individuals enter an optimal experience characterized by deep immersion, pleasure, and diminished awareness of time (Csikszentmihalyi and Csikszentmihalyi, 1992; Igarzábal et al., 2021; Pedroli et al., 2018). Thus, when people fully engage in an enjoyable activity, they become less conscious of time (Block and Gruber, 2014). This means VR waiting experiences could be improved through the careful design of loading interfaces.
Since the “Year of VR” in 2016, VR devices have been rapidly commercialized (Cellan-Jones, 2016; Smith, 2016), and the integration of related technologies is expected to bring revolutionary changes to the gaming industry (Sarkar et al., 2024; Vorrink et al., 2024). Despite recent progress in evaluating VR user experiences across different regions and industries (Rhiu et al., 2020), there remains a significant gap in our understanding of VR waiting experiences (Heidrich et al., 2020). In particular, it seems important to identify factors affecting time perception (van der Ham et al., 2019), cognitive load, which is a widely-used evaluation metric for human-computer interactions (HCI) (Chiossi et al., 2022; Kleygrewe et al., 2024; Kosch et al., 2023), and emotions (Batistatou et al., 2022; Bosman et al., 2024; Dey et al., 2022; Dubovi, 2022; Jacucci, 2017). These variables require further examination within the context of VR loading interfaces. In user interface design, the loading interface often provides feedback to users during wait times after an operation is performed. In traditional media, some loading interfaces incorporate animations. It has been found that faster animations can reduce perceived wait times and enhance user satisfaction (Myers, 1985; Söderström et al., 2018).
The highly interactive and immersive nature of VR allows users to notice more visual details for a more dynamic experience; however, it also increases the cognitive load on users (Fisher et al., 2018). The characteristics of VR hardware and non-interactive loading interfaces contribute to user distress. For example, users have reported feeling “trapped” inside the headset during waiting experiences (Igarzábal et al., 2021). Indeed, in some large-scale VR games, the waiting time for players to enter the game is usually more than 1 min, which can cause cognitive friction for users.
While it is clear that optimizing VR waiting experiences has substantial potential for improving VR experiences (Lang, 2020), current research on loading interfaces is scarce, particularly regarding the specific effects of different levels of visual stimulation on users’ internal and external states. This study aimed to fill this research gap, including investigating how various levels of visual stimulation intensity in VR gaming environments affect users. Thus, our research questions are as follows:
RQ1: How do the interactivity of the VR interface and the length of the waiting time affect time perception and emotions?
RQ2: Is there a relationship between the intensity of visual stimulation and users’ time perception, emotions, and cognitive load during waiting?
We applied the attentional gate model and stimulus-organism-response (SOR) theory to develop our conceptual model. The attentional gate model highlights the critical role of attention in time perception (Block and Gruber, 2014). SOR theory posits that external stimuli can influence individuals to respond in a specific way (Mehrabian and Russell, 1974). SOR theory has been widely applied to the analysis of behavioral dynamics in extended reality (XR) technologies such as virtual tourism and sightseeing applications (Kim et al., 2020; Latifi et al., 2024; Surovaya et al., 2020; Zhu et al., 2023). It is a useful framework for determining how different levels of visual stimulation intensity affect internal states and external responses. This study extends the scope of SOR theory in pursuit of a more detailed understanding of the interactions among stimuli, individuals, and responses in the context of VR loading interfaces. Our findings on the psychological mechanisms of VR interactive interfaces suggest practical guidelines for game design to optimize player experiences during game loading.
2 Literature review and hypothesis development
2.1 Overview of research on VR user experiences
Since 2016, VR technology has rapidly matured as a subset of XR, exhibiting accelerated and diversified applications across industries (Chen et al., 2020; Velev and Zlateva, 2017). However, the success of VR technology relies not only on advancements in hardware and software but also on user perception and interaction experiences. Research has shown that presence and comfort influence XR experiences (Mondellini et al., 2022). Therefore, user experience in VR can be assessed through indicators such as presence, workload, usability, flow, and latency.
Existing studies offer valuable insights into topics such as interface design, cognitive load, time perception, and emotional impact. For instance, Bi et al. (2024) examined how scene-switching and time visualization methods (e.g., electronic clock vs. bomb countdown) affect creativity during brainstorming activities, highlighting how time distortion in VR environments can influence user experience and task fluidity. Hartfill et al. (2024) found that cognitive load decreases when users perceive more control over their virtual avatars, contributing to time compression. Meanwhile, research by Che et al. (2025), van Weelden et al. (2024), and De Witte et al. (2024) suggests that higher levels of immersion do not always enhance user experience, as excessive immersion can lead to increased cognitive load or discomfort. Bartyzel et al. (2025) and Kim et al. (2025) analyzed user performance, workload, and subjective experiences in VR training, offering valuable insights for future VR training system designs.
Given the expanding scope of this field, a comprehensive understanding of user experience is crucial (Rhiu et al., 2020). We adopted the Preferred Reporting Items for Systematic Reviews and Meta-Analyses (PRISMA) protocol (see http://prisma-statement.org) to systematically review current research on VR user experience. Figure 1 describes our screening process. Our objective was to analyze studies examining the impact of VR design on user experience (UX), cognitive load, emotion, and time perception. As Suh and Prophet (2018) recommended, limiting the search to a single database ensures reproducibility, rigor, and transparency while mitigating inconsistencies caused by variations in search functions and algorithms.
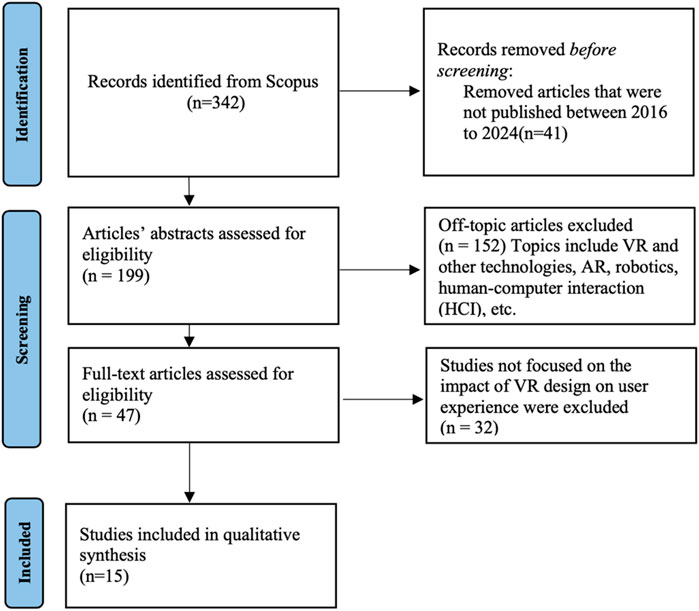
Figure 1. PRISMA flow diagram of selection procedure for systematic literature review.
We conducted a keyword search in the Scopus bibliographic database using the following search terms: (“VR” OR “virtual reality”), with (“UX” OR “user experience” OR “usability”), (“interface” OR “user interface”), (“emotion*“), (“cognitive load” OR “cognit*” OR “workload”), (“time perception”), and (“design”). The initial search was performed on 19 November 2024. As 2016 is widely recognized as the year in which VR started (Chen et al., 2020; Velev and Zlateva, 2017), only literature published in English from 2016 was included. To ensure relevance, there was a focus on the subject areas of computer science and social science. Note that this review excluded surveys, editorials, conference papers, and documents without abstracts or full texts. Initially, 342 documents met the search criteria. After non-compliant documents were removed, 61 underwent a full-text review, resulting in 15 relevant UX studies for VR design.
Table 1 summarizes selected literature discussing user experiences in VR. These studies span various countries and industries, including entertainment, healthcare, education, gaming, and social applications. Topics include research on visual stimulation intensity in VR environments (Asish et al., 2022; Batistatou et al., 2022; Chiossi et al., 2022; Latini et al., 2024), multimodal interfaces (Dzardanova et al., 2024; Jacucci, 2017; Yuan et al., 2023), auditory stimulation (Bosman et al., 2024; Picard et al., 2023), physiological signals (Qu et al., 2022; Raees and Ullah, 2020), dissimilar avatars (Cheymol et al., 2023), and the number of users in VR environments (Birt and Vasilevski, 2021). Despite significant progress, many research gaps remain in interface design. For example, researchers have investigated waiting experiences in mobile apps (Chen and Li, 2022; Cheng et al., 2023; Pibernik et al., 2023) and customer service robots (Wintersberger et al., 2020); however, waiting experiences in VR devices have yet to be examined (Heidrich et al., 2020). As previously mentioned, existing HCI models may be insufficient to fully explain the complexities of VR environments. UX research can contribute to refining our understanding by empirically investigating ways to enhance user satisfaction, reduce cognitive load and adverse effects, inform VR system development and design, establish standardized evaluation methods, and explore multimodal sensory interactions (Mondellini et al., 2022). Therefore, UX research should be considered essential in the development of any VR application.
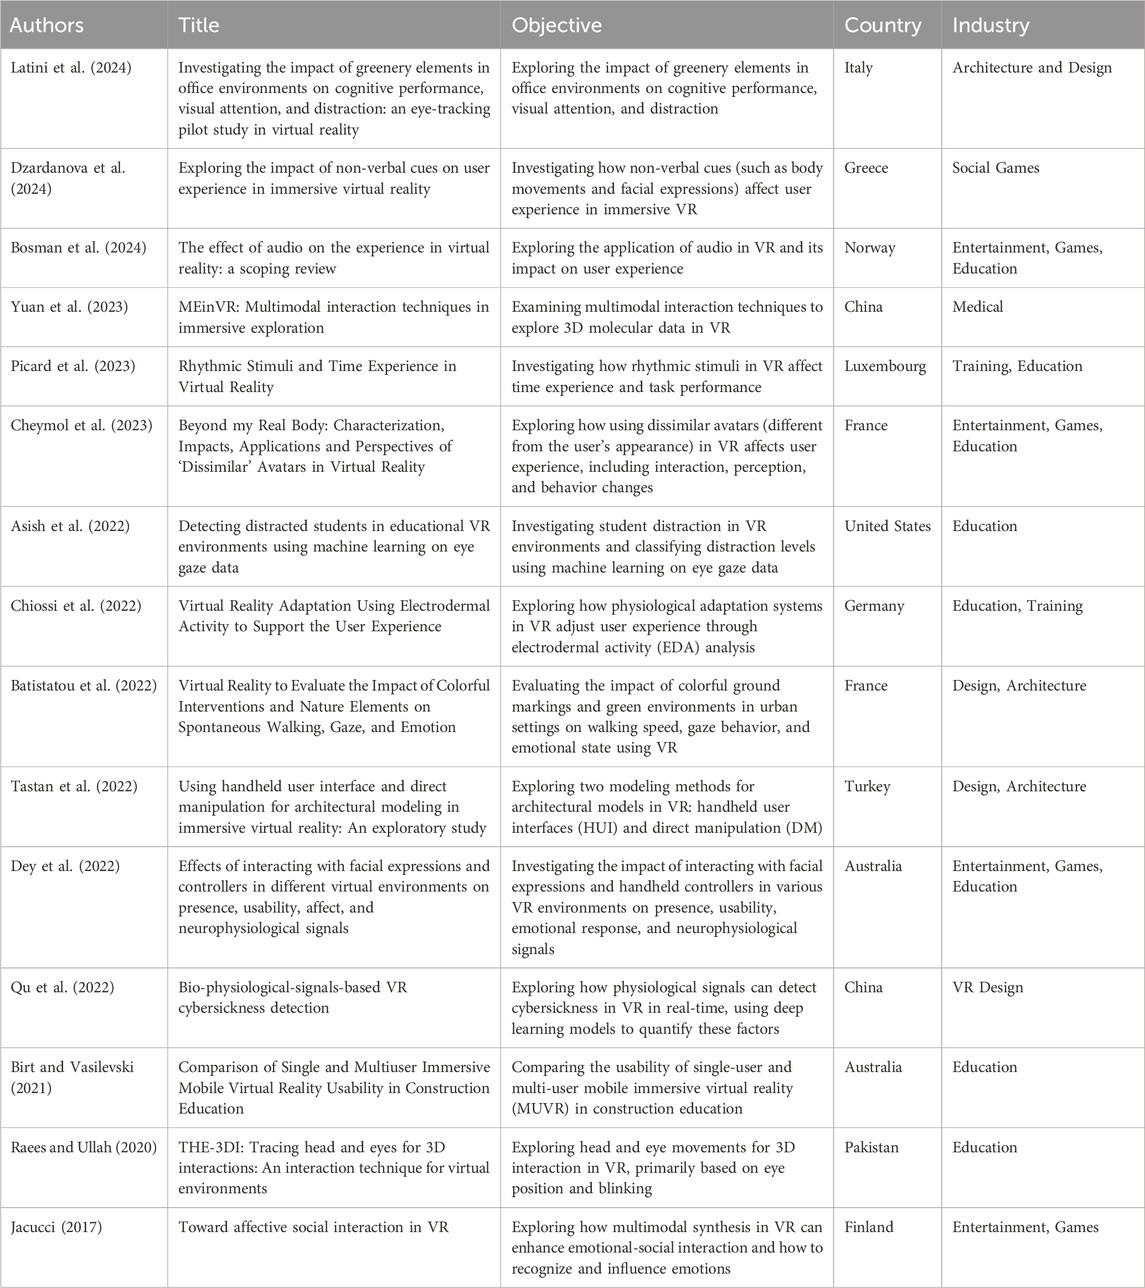
Table 1. Selected studies on VR user experience.
2.2 Stimulus-organism-response (SOR) theory
SOR theory is a psychological model widely applied in consumer behavior research. Its core concept posits that a stimulus influences an individual, leading to a response (Mehrabian and Russell, 1974). According to Jacoby (2002), the stimulus (S) represents the environment an individual encounters at a specific moment, while the organism (O) encompasses various internal states such as attitudes, beliefs, values, motivations, personality, knowledge, experiences, emotions, tendencies, and cognition. Vieira (2013) further explains that the response (R) reflects an individual’s willingness or intention to enter or exit a particular environment. Later, Bitner (1992) incorporated cognition and physiology to expand the SOR theory to the service domain. Past studies have used SOR theory to elucidate behavioral dynamics in XR technologies (Mala Kalaiarasan et al., 2024) and to examine the impact of VR on service perception, emotions, and behavior. Examples include virtual presentations of tourist hotels (Surovaya et al., 2020), virtual tourism experiences (Kim et al., 2020; Latifi et al., 2024; Zhu et al., 2023), and museum exhibition experiences (Chang et al., 2018). Thus, SOR theory is an appropriate framework for the exploration of users’ perceptions and responses to VR stimuli. The current study is the first to apply this framework to VR game-loading interfaces.
Figure 2 shows the research framework of the current study.
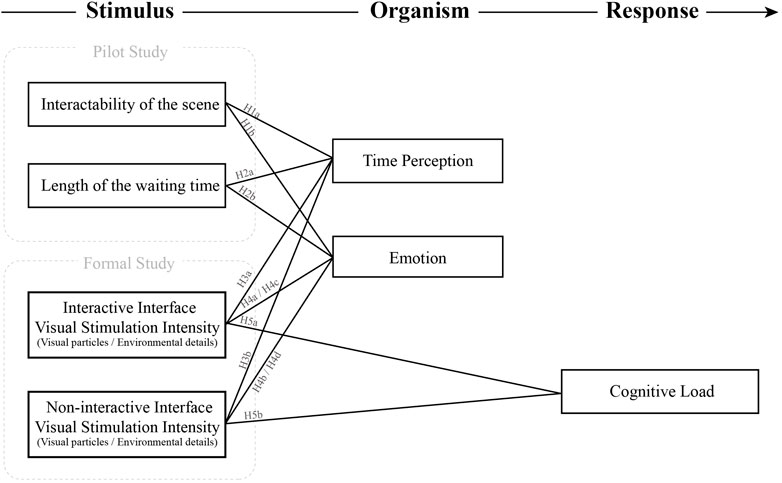
Figure 2. Research framework.
This study used SOR theory to explore the psychological and behavioral dynamics of waiting experiences in VR games. Similar to previous studies that used specific designs as environmental stimuli (Chang et al., 2018; Kim et al., 2020), this study considers scene interactivity, waiting length, visual stimulation intensity, and background environments. Following Godefroit-Winkel et al. (2022) and Su et al. (2020), this study viewed individual perception as an internal processing outcome, reflecting users’ subjective time experience and perceived emotions in response to various stimuli in VR environments. Additionally, this study includes cognitive load as a behavioral response, as measured by physiological signals collected using the VR headset. Suh and Prophet (2018) also considered cognitive overload a reaction in their systematic review of the applications of SOR theory to immersive technologies.
2.3 Interface design and time perceptions when waiting
2.3.1 Interactivity of VR interface
Games are highly interactive by nature. Interactive gamified visual stimuli within a loading interface are more likely to reduce players’ perception of time spent waiting than does a general design (Li et al., 2020). The Japanese game company NAMCO published “Ridge Racer” in 1993, which included the function of playing mini-games in the loading interface. NAMCO in fact applied for a patent for this function (U.S. Patent No. U.S. 5,718,632A). In the game “Bayonetta,” a practice field function was added to the loading interface. Additionally, interface interactivity stimulates different emotional responses in users (Jacucci, 2017; Šķilters et al., 2023). For example, the Google Doodles on the Google search engine homepage have evolved to include various interactive games. These doodles commemorate events and individuals, increasing their interactivity (Britten, 2020), while conveying emotions through gameplay (de Carvalho et al., 2013).
As VR games represent a relatively new technology, there remains much room for improvement. Among the various VR applications, most of the loading interfaces are similar to those designed for traditional computer games. That is, they are primarily two-dimensional (2D) and non-interactive. For example, the game “Robo Recall” presents 2D characters on its loading interface (Lang, 2020). While game companies are attempting to diversify this content, the immersive properties of this media have not yet been fully exploited for loading interfaces. The current paper explores the potential for three-dimensional (3D) interactive loading interfaces to enhance the user experience. Evidence of this potential has been demonstrated by previous studies; for instance, 3D product models and advertising videos have been inserted into the loading interface of some VR games, allowing users to walk around and interact with the 3D models (Liu, 2017). Wu et al. (2022) also added 3D models to the loading interface of a VR game.
Time perception refers to an individual’s subjective perception of time without external measuring tools, influenced by environment, attention, and biological clocks (Lamotte et al., 2012; Matthews and Meck, 2016). Research on time perception and judgment is typically categorized into two approaches: prospective timing, where participants know that they need to estimate time, and retrospective timing, where time estimation is unexpectedly requested after a stimulus or activity ends (Matthews and Meck, 2016). This study focuses on prospective timing, which relies on experienced duration (Block and Zakay, 1997) and is influenced by perception, attention, and memory processes—key aspects examined in this review (Block and Zakay, 1997).
One of the most widely-applied models for prospective time estimation is the attentional gate model (AGM) (Block and Zakay, 1996; Zakay and Block, 1997; Zakay and Block, 1995), which posits that time perception is shaped by cognitive resource allocation. AGM hypothesizes the existence of a cognitive counter in the brain that records time pulses emitted by a pacemaker, with these pulses representing the passage of time. That is, attention functions as a gate that regulates the number of pulses passing through. When attention is focused on time itself, the gate remains open, leading to a slower perception of time. Conversely, when attention is diverted to other stimuli, the gate closes, causing time to appear to pass more quickly (Zakay and Block, 1995; Zakay and Hornik, 1991).
According to Zakay et al. (1983), attentional allocation is crucial in subjective time estimation. When attention is directed toward non-temporal information (e.g., visual or auditory stimuli), perceived waiting time tends to shorten. In recent years, many studies in the field of HCI have leveraged this theory, designing rich non-temporal visual and auditory stimuli in loading interfaces to divert user attention and reduce perceived wait times (Chen and Li, 2020; Kurusathianpong and Tangmanee, 2018; Lee et al., 2017; Zhang et al., 2023). Mullen and Davidenko (2021) found that VR environments can induce a time compression effect, potentially due to a reduction in bodily awareness within VR. Unruh et al. (2021) further validated the applicability of AGM in VR, demonstrating that the presence of a virtual avatar can distract users from tracking time, resulting in time compression. These studies indicate that multiple factors, including bodily awareness, attentional allocation, and the design of non-temporal information, influence time perception in VR.
In recent years, the design of human-computer loading interfaces has primarily been founded on studies that have demonstrated that modifying the visual and auditory non-temporal stimuli in loading interfaces can direct users’ attention toward these sensory inputs, effectively shortening their subjective perception of waiting time (Zakay and Hornik, 1991). That is, users’ perceived wait duration can be altered by introducing appropriate stimuli during waiting periods. These findings provide the theoretical foundation for this study, enabling an exploration of how temporal psychology can be leveraged to reduce subjective time perception during waiting experiences in VR games.
As early as the 1990s, scholars proposed that 10 s is the threshold for an acceptable waiting time in human-computer interactions (Nielsen, 1994). However, in the gaming field, waiting times are often longer than 10 s (Lozano, 2022). Compared to traditional computer equipment, VR devices need to render images at higher resolutions and frame rates (Zhou and Popescu, 2024), leading to longer loading times. This can cause negative emotions, such as frustration (Heidrich et al., 2020).
Based on the above review and the identified research gaps, this study proposes the following hypotheses:
H1a: Interactive loading interfaces will result in shorter time perception than non-interactive loading interfaces.
H1b: Interactive loading interfaces elicit more positive emotional responses than non-interactive loading interfaces.
H2a: As waiting time increases, the difference in time perception between interactive and non-interactive loading interfaces will become more pronounced.
H2b: As waiting time increases, the difference in emotional responses between interactive and non-interactive loading interfaces will become more substantial.
2.3.2 Time perception and visual stimulation intensity
Compared to the physical world, people generally perceive time to pass faster in VR environments (van der Ham et al., 2019), which means waiting experiences can feel more boring in these environments (Igarzábal et al., 2021). To minimize VR loading time, studies have focused on reducing data transfer usage (Alhilal et al., 2024), while others have adjusted rendering smoothness (Liang et al., 2023; Zhou and Popescu, 2024). Researchers have also found that adding interactive elements to VR loading interfaces can alleviate negative emotions associated with waiting (Heidrich et al., 2020). In their study exploring time perception in VR with various sensory stimuli, Picard et al., 2023 discovered that rhythmic stimulation in VR environments accelerates time perception. Liao et al. (2020) found that adjusting visual and auditory zeitgebers—temporal cues in VR environments that influence biological rhythms and time perception, such as lighting and ticking sounds—can significantly affect users’ sense of time. Additionally, cognitive load plays a crucial role in shaping time perception. Their study utilized the dual-task theory to evaluate the impact of cognitive load on both time perception and presence in VR environments. Regarding visual stimulation intensity, some scholars found that richer environmental details in VR provide more engaging visual stimulation, helping players to lose track of time (Lofca et al., 2023).
Mostajeran et al. (2023) compared the effects of an abstract forest with a more realistic one on players’ time perceptions. They found that players spent more time observing details in the realistic forest. This suggests that realistic details in a VR environment attract more attention and thus reduce the perception of time passing. Other studies have investigated how visual dynamics can reduce time perception, showing that fast-moving stimuli lengthen time perception compared to stationary stimuli (Brown, 1995; Kanai et al., 2006; Landeck et al., 2023; Skylark, 2011). For example, Jording et al. (2022) found that flashing particles similar to the rapid changes of the starry night sky successfully reduced players’ perception of time passing.
When designing VR content, it is essential to consider how to minimize pressure on users’ cognitive resources to reduce time perception. This study explored the visual elements that reduce time perception in VR and their effects on players during game loading. Based on the above literature review, we propose the following hypotheses:
H3a: Different levels of visual stimulation intensity in interactive loading interfaces will affect time perception differently.
H3b: Different levels of visual stimulation intensity in non-interactive loading interfaces will affect time perception differently.
2.4 Visual stimulation intensity and emotions when waiting
Emotions are crucial in user research due to their influence on behavior, perception, and cognition to varying degrees (Somarathna et al., 2023), as well as on distortion of users’ time perception (Cui et al., 2023). Gable et al. (2022) found that the motivational direction of emotions affects time perception. For example, emotions associated with approach motivation, such as anger, can accelerate time perception due to strong goal orientation. Conversely, emotions linked to avoidance motivation can extend time perception, showing how emotions regulate time perception through their motivational direction. Emotional responses have been shown to enhance presence in VR (Baños et al., 2004; Riva et al., 2007) and significantly impact the enjoyment and quality of the VR experience (Wienrich et al., 2018).
Past VR research has focused on how sensory environments influence emotional arousal. For example, Batistatou et al. (2022) found that participants experienced more pleasant emotions in green environments. van der Ham et al. (2019) noted that appropriate sound design could enhance users’ positive emotions or reinforce specific emotional states, aiding deeper connections with VR content and narratives. Liao et al. (2020) confirmed the impact of multisensory (visual and auditory) stimuli on emotions. Jacucci (2017) studied how multimodal synthesis (such as haptic and facial expression stimuli) can recognize and influence participants’ emotions. Previous studies have explored the effective use of VR as an emotion induction mechanism (Bosman et al., 2024; Dey et al., 2022; Somarathna et al., 2023); however, few studies have focused on emotional changes during VR waiting times. Waiting in VR is often more unpleasant for gamers because they are awkwardly confined by the headset (Zwiezen, 2020). As such, users cannot divert their attention to escape the loading screen, potentially triggering negative emotional experiences (Heidrich et al., 2020).
Particularly in large VR games, waiting times often exceed users’ comfortable threshold of 10 s. In these games, it can take more than a minute for a player to enter. This prolonged waiting creates cognitive friction, where users face unexpected outcomes from seemingly intuitive interfaces or functions. The mismatch between expected and actual results leads to frustration (Ericson, 2022), often triggering negative emotions during these long waiting experiences. Cheng et al. (2024) found that interactions with features like doodles and emojis in VR can enhance positive emotions. This suggests that different interaction features can evoke varying emotional states. Based on the aforementioned literature, it seems different stimuli trigger different emotional values. Thus, this study proposes the following hypotheses:
H4a: In interactive interfaces, different visual stimulation intensities during waiting will lead to differences in positive emotions.
H4b: In non-interactive interfaces, different visual stimulation intensities during waiting will lead to differences in positive emotions.
H4c: In interactive interfaces, different visual stimulation intensities during waiting will lead to differences in negative emotions.
H4d: In non-interactive interfaces, different visual stimulation intensities during waiting will lead to differences in negative emotions.
2.5 Visual stimulation intensity and cognitive load when waiting
Cognitive load refers to the limited capacity of human cognitive resources, which can be seen as working memory. Executing tasks occupies working memory. A well-designed system allows users to focus on the task and spend less mental effort on irrelevant aspects (Sweller, 1988). Kleygrewe et al. (2024) pointed out that users’ VR experience and gaming frequency influence their cognitive resource consumption in VR. Compared to typical HCI scenarios, VR covers the user’s visual field, creating unique effects on human vision. Compared to the experience of using a 2D graphic website, VR exposes users to more sensory stimuli, requiring them to allocate more attention and cognitive resources to the game (Fisher et al., 2018) This affects the size of the cognitive load experienced by users.
There are still research gaps regarding cognitive load in the HCI field. As more systems compete for users’ attention, a better understanding of cognitive workload becomes critical in HCI research (Kosch et al., 2023). As the processing of visual stimuli requires a certain amount of cognitive resources, different types and complexities of visual messages lead to varying levels of cognitive load (Valtchanov and Ellard, 2015). Cognitive load has often been used as a metric to explore the level of impact of visual stimulation on users. For example, engaging visual details in VR environments may cause additional cognitive load (Cruz et al., 2023). When cognitive load is increased, users often experience symptoms similar to visual fatigue (Gowrisankaran et al., 2012). When green elements are present in a VR environment, users experience lower cognitive load and more efficient information searching, improving overall performance (Latini et al., 2024). Chiossi et al. (2022) also found that reducing visual complexity can improve cognitive load. Additionally, previous research has shown that users facing higher cognitive load during waiting perceive time as passing more quickly (Chen and Li, 2022; Lallemand and Gronier, 2012). The literature thus confirms that visual resources such as visual stimulation intensity and spatial vision utilize working memory. Interactive environments may divert users’ attention, affecting cognitive load (Shelton et al., 2021). Therefore, improving visual presentation efficiency and reducing cognitive resource usage are crucial from a design perspective. This study thus uses cognitive load as an evaluation index to explore the impact of visual stimulation on users. Based on the above theories, this study proposes the following hypotheses:
H5a: In interactive loading interfaces, different visual stimulation intensities will lead to differences in cognitive load.
H5b: In non-interactive loading interfaces, different visual stimulation intensities will lead to differences in cognitive load.
Methods for measuring cognitive load are generally classified into physiological indicators (Gupta et al., 2019; Lee, 2014; Souchet et al., 2022) and self-report assessments (Shelton et al., 2021). Physiological measurements capture cognitive load through eye-tracking, heart rate variability (HRV), electroencephalography (EEG), respiration, and electrodermal activity (EDA), providing objective insights into cognitive states (Paas et al., 2003; Whelan, 2007).
Self-report assessments primarily rely on questionnaires, the most well-known being the NASA Task Load Index (NASA-TLX) developed by Hart and Staveland (1988). Originally designed to evaluate pilots’ mental and physical workload, this questionnaire includes six dimensions: mental demand, physical demand, temporal demand, performance, effort, and frustration (Hart and Staveland, 1988). In VR cognitive load research, NASA-TLX has been widely used for subjective workload measurement (Bi et al., 2024; Che et al., 2025; Chiossi et al., 2025; De Witte et al., 2024; Hartfill et al., 2024; Kim et al., 2025; van Weelden et al., 2024; Vorwerg-Gall et al., 2023). Derived versions include the Raw Task Load Index (RTLX) (Hart, 2006), which has been broadly validated (Lovasz-Bukvova et al., 2021; Rodríguez-Fernández et al., 2024), and the Simulation Task Load Index (SIM-TLX), which incorporates task complexity and situational stress to better align with VR cognitive load measurement (Harris et al., 2020; Urbano et al., 2024).
Some scholars have raised concerns about the applicability of self-report questionnaires. Buchner et al. (2025) argued that contextual constraints limit self-report measures, whereas physiological measurements enable non-intrusive cognitive state assessment (Halbig and Latoschik, 2021). Foy and Chapman (2018) similarly highlighted that self-reports suffer from subjectivity, lack of real-time synchronization, and an inability to simultaneously capture subjective ratings during simulation-based training. Additionally, Kosch et al. (2023) suggested that the widespread use of NASA-TLX in HCI applications may be more a result of historical precedent and convenience rather than because it is the optimal measurement tool. They argued that the questionnaire is prone to individual biases and lacks tailored design and empirical validation for HCI environments. In contrast, physiological signal measurements provide a more comprehensive approach to capturing real-time feedback (Zagermann et al., 2016). Furthermore, physiological indicators of cognitive load represent genuine physiological responses to real-world stimuli, aligning with the SOR theory framework adopted in this study (Suh and Prophet, 2018).
This study thus used the HP Reverb G2 Omnicept, a VR headset with physiological signal measurement capabilities. Cognitive load was measured on a scale from 0 to one through a machine-learning model built on data from 738 subjects, as detailed in HP’s white paper (Company, 2021). In reports from the HP research team, their classification accuracy reaches 79.08% (Siegel et al., 2021). In recent years, many VR studies have utilized this headset for cognitive load measurement (Ahmadi et al., 2023; Lataifeh et al., 2024; Reddy et al., 2022). Reddy et al. (2022) validated the feasibility of using non-invasive sensors, such as the HP Reverb G2 Omnicept, for estimating cognitive load in VR. Their study also identified pupil diameter variation and fixation count as reliable indicators for assessing task complexity and cognitive load.
3 Pilot study: effects of interactive VR loading interface on time perception and emotions
3.1 Research methods
The pilot study involved semi-structured interviews with five game development experts to design the experimental system. Subsequently, researchers recruited 20 participants to explore the differences in users’ time estimates and emotions between interactive and non-interactive loading interfaces under varying waiting times.
3.1.1 Expert interviews
The experimental design was based on the real-world needs and purposes of game development. The research team consulted with five industry experts with over 5 years of experience, including game developers, senior game planners, independent game producers, game studio managers, and game programmers. The interviews were conducted one-on-one between July and August 2022, each lasting about an hour. Researchers explained the purpose of the study and the interview outline to the experts, ensuring the protection of their privacy. The discussions focused on the impact of interface interactivity on players’ time perceptions, cognitive load, and emotional changes. Researchers monitored the conversations to keep them on track and asked follow-up questions based on the experts’ ideas. The interview focused on two main topics: (1) the effects of stimuli on time perception and (2) interactivity and time perception. Fixed questions included the following: What factors (e.g., visuals, sound, animations) influenced your perception of time during the waiting process? In what scenarios did you feel that the waiting time was longer? Did interactive environments make time feel faster or slower during the waiting process? How would you describe your experience? In addition to these predefined questions, the researchers conducted follow-up inquiries based on participants’ behaviors and feedback to gain deeper insights.
3.1.2 Experimental design
After the expert interviews, researchers developed the experimental system using the Unity 2018.4.36f1 game engine and SteamVR for VR content development. Researchers programmed the system using the C# language, utilizing open-source resources or those freely available within the Unity and SteamVR development environments. A VR archery game served as the main experiment. Figure 3 presents a schematic illustration of the experimental interfaces.
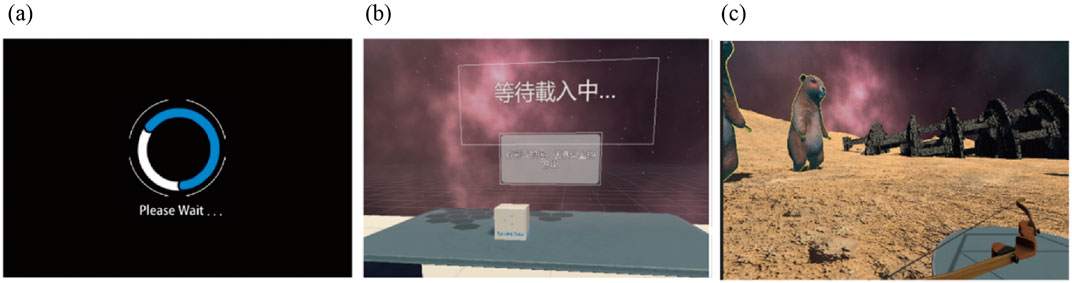
Figure 3. Experimental design of loading interfaces. (a) Non-interactive loading interface, (b) Interactive loading interface, (c) The main game of experiment.
The Research Ethics Committee approved the two-phase study design (pilot study and formal study), questionnaire survey, and informed consent form. Participants were fully informed about the research process and objectives and were asked to sign an informed consent form to confirm their understanding and agreement. In this phase, 20 participants were recruited, including 6 males and 14 females, aged between 20 and 29. All participants had essential gaming experience and normal or corrected vision with no diagnosed visual impairments or eye diseases.
Experts generally agreed that interactive loading interfaces should be simple and intuitive to reduce users’ time perception and enhance the user experience. For example, while incorporating games during waiting times can alleviate impatience, the complexity of game interactions should match the waiting duration to avoid increasing cognitive load and interfering with game flow. Interactions should remain lightweight to maintain user immersion. Experts also noted that overly-complex interactive elements could increase cognitive load and negatively impact the gaming experience. They pointed out that excessive visual feedback, complicated user interface designs, too many flashes, and voice prompts could lead to higher cognitive load.
3.1.3 Experimental procedure
Based on the experts’ perspectives, the independent variables for the experimental stimuli were the type of loading interface (interactive or non-interactive) and the length of waiting time (15 s, 30 s, and 60 s). The dependent variables were waiting emotions and perceptions of waiting time. The 20 participants were tested using a within-subjects design, with the Latin Square Design randomly determining the order of the experimental stimuli. After the participants listened to the experiment instructions, researchers gave each participant a VR headset to experience the game loading interfaces in different sequences based on their assigned order. After each waiting period, participants played the archery game. This process was repeated multiple times.
For dependent variable measurement, subjective time perception was assessed using a closed-ended questionnaire based on the work of Seawright and Sampson (2007), where participants responded by selecting predefined options. Emotional responses were measured using a subjective emotion questionnaire compiled in Chinese by Jou et al. (2006), adapted initially from Levine et al. (1994). The scale includes 14 emotion-check words, evenly divided into seven positive emotions (joyful, happy, pleased, contented, delighted, proud, fine) and seven negative emotions (sad, depressed, blue, gloomy, sorrowful, displeased, downhearted).
Responses were recorded using a 7-point Likert scale. The scoring method involved separately averaging each participant’s ratings for positive and negative words, with negative scores inverted (multiplied by −1) before averaging. The resulting scores were labeled “positive emotion score” and “negative emotion score,” where higher values reflect more substantial positive or negative emotional experiences, respectively.
3.2 Validation
For both types of interfaces, researchers set the waiting times at 15 s, 30 s, and 60 s. The experimental data for this phase are shown in Table 2. As the waiting time increased, players’ perceptions of waiting time also increased. However, time perceptions for the interactive interface were lower than those for the non-interactive interface. Therefore, H1a was supported. Additionally, different loading interfaces significantly affected time perceptions at 15 and 60 s (p < 0.05). Therefore, H2a was supported. That is, the longer the waiting time, the more significant the difference in time perceptions for interactive interfaces compared to non-interactive interfaces.
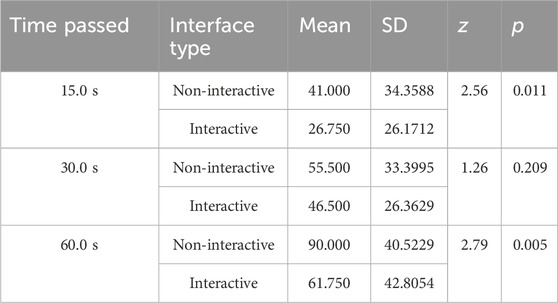
Table 2. Comparison of waiting time perceptions.
The author then explored the impact of different loading times (15 s, 30 s, and 60 s) and interface interactivity (non-interactive vs. interactive) on the subjects’ emotions, the results of which are shown in Table 3. For 15 s of waiting time, the difference in interface type triggered positive emotions. The statistical analysis shows that the Z value was −2.153 with a p-value of 0.0313, while negative emotions showed a Z value of −3.209 with a p-value of 0.0013. For 30 s of waiting time, the Z value for positive emotions was −3.416 with a p-value of 0.0006 and that of negative emotions was −3.258 with a p-value of 0.0011. Finally, for 60 s of waiting time, the Z-value for positive emotions was −3.727 with a p-value of 0.0002 and that of negative emotions was −3.658 with a p-value of 0.003.
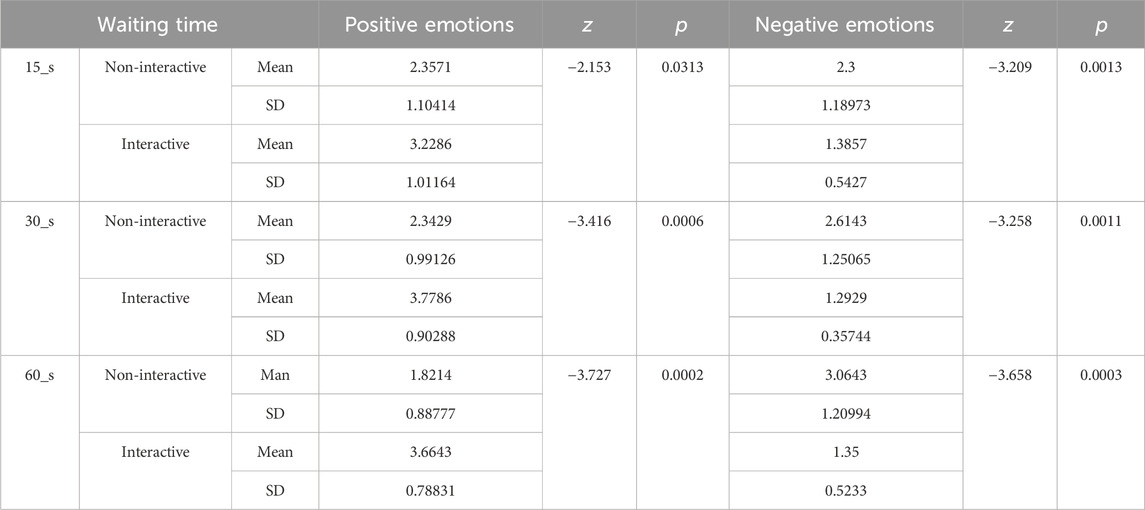
Table 3. User emotions for varying waiting times and interface types.
These results support H1b, which states that the interactive interface will engender more positive emotions and less negative emotions than the non-interactive interface. In addition, these results also support H2b, which states that the longer the waiting time, the greater the difference in emotion for the interactive interface compared to the non-interactive interface.
3.3 Conclusions
The main objective of the pilot study was to investigate the relationship between time perceptions and emotions for different waiting times and interactive vs. non-interactive loading interfaces. The results of the study revealed the following: (1) an interactive loading interface can shorten perceptions of waiting time; (2) an interactive loading interface is highly effective at shortening perceptions of waiting time for long waiting periods (60 s), and the interactive interface generally elicited shorter perceptions of waiting time than did the non-interactive interface; and (3) an increase in waiting time leads to an increase in perceptions of waiting time, and the longer the waiting time, the more positive emotions decrease and the more negative emotions increase. In addition, using an interactive interface is more likely to maintain positive emotions and reduce negative emotions than using a non-interactive interface.
Through observation of the participants, this study found that after waiting for a certain period, the participants started to pay attention to external factors such as the environment and objects in the loading interface. Some respondents thought that the difference between interactive and non-interactive interfaces was insignificant in terms of time predictions. Post-experiment interviews suggested that this might be related to users’ familiarity with the long waiting times of VR games. This study also found that the level of players’ engagement in the previous game may have affected their waiting experience in the next game.
4 Formal study: effects of visual stimulation intensity on time perceptions, cognitive load, and emotions
4.1 Research methods
The formal study incorporated additional visual stimulation elements to further explore their effects on time perceptions, emotions, and cognitive load.
4.1.1 Experimental design
In the formal research phase, we included more elements of visual stimulation that can affect time perceptions. VR users need to exert more attention and cognitive resources than players of traditional games (Fisher et al., 2018). Thus, in order to further understand the effects of visual stimuli on VR waiting experiences, this study categorized the following experimental stimuli based on relevant studies on the psychology of time: interactivity, visual stimulation (Jording et al., 2022), and details of the background environment (Mostajeran et al., 2023). As shown in Figure 4, we superimposed the different elements in four groups for each type of interface: environmental details (None) x visual stimulation (None), environmental details (None) x visual stimulation (Yes), environmental details (Yes) x visual stimulation (None), and environmental details (Yes) x visual stimulation (Yes).
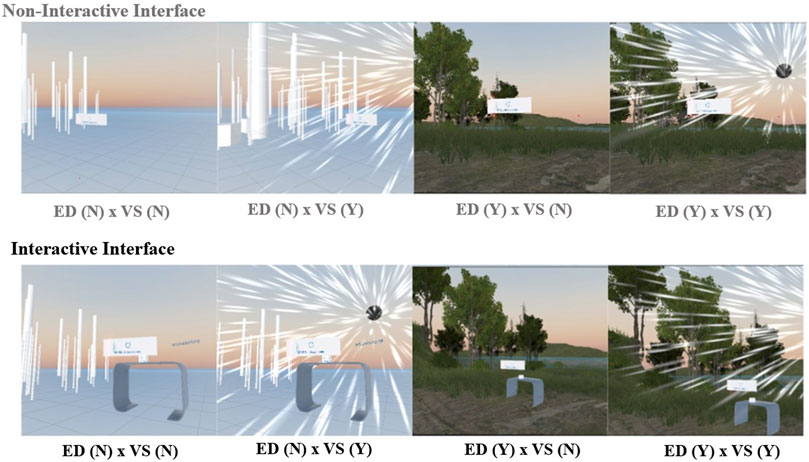
Figure 4. Interfaces with varying visual stimulation intensities: (top) non-interactive loading interface, (bottom) interactive loading interface.
4.1.2 Instrument and participants
The study collected data on dependent variables through questionnaires and physiological signals. The questionnaire survey included assessments of both time perception (Seawright and Sampson, 2007) and emotions (Jou et al., 2006), using the same two questionnaires as those employed in the pilot study. Cognitive load was measured using physiological signals collected by the HP Reverb G2 Omnicept headset, with values ranging from 0 to 1. We analyzed trends in dependent variables using mean analysis and tested for statistical significance with a repeated measure one-way ANOVA.
Before testing the hypothesis, we utilized G* Power 3.1 to estimate the minimum sample size (Faul et al., 2009). The software was set with the following parameters: number of groups = 1, number of measurements = 8, effect size (Cohen’s f) = 0.25, significance level (α) = 0.05, statistical power (1-β) = 0.95, and nonsphericity correction (ε) = 0.75. The test type selected in G* Power was F test (ANOVA: Repeated measures, within factors; default correlation among repeated measures = 0.5), as our study design involved within-subject comparisons. The results indicated that the recommended sample size was n = 28. A recent VR study on time perception by Niknam et al. (2024) also used similar parameters for sample size estimation. In the formal stage of the study, 38 subjects were recruited, aged between 20 and 34 years. After 4 subjects who did not complete the experiment were removed from the sample, 34 valid samples (14 male and 20 female participants) remained. All participants had experience playing video games. They gave written informed consent and were equipped with the HP Reverb G2 Omnicept Edition VR headset before the experiment. Figure 5 presents images of the experimental process. Figures 6, 7 detail the visuals observed by participants within the VR headset and the experimental procedure they experienced.
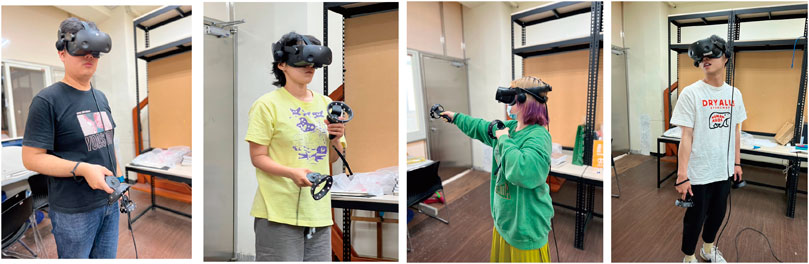
Figure 5. Images of experimental procedure.
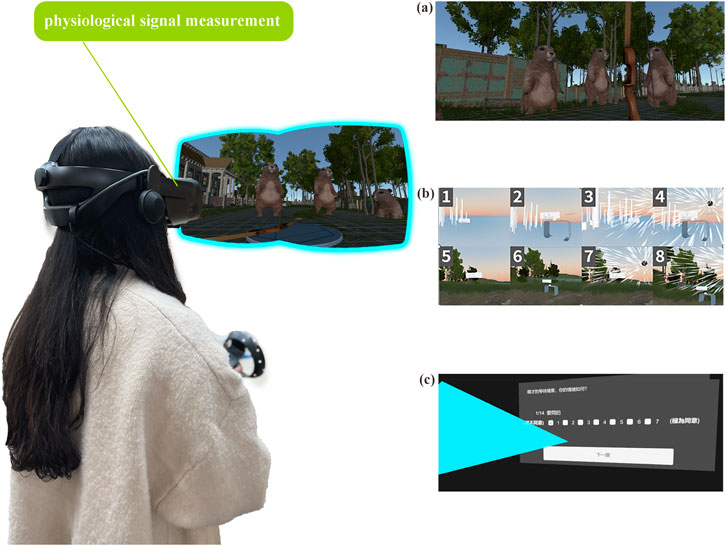
Figure 6. Concept map of experimental process experienced by subjects. (a) Main game level 1, (b) Different waiting experimental stimulants, (c) Time perception and emotion questionnaire.

Figure 7. Diagram of experimental process.
4.1.3 Experimental procedure
Before the experiment, researchers explained the game operation to the subjects, who signed informed consent forms and were equipped with the HP Reverb G2 Omnicept Edition VR headset. The experiment used a within-subjects design with a Latin Square Design to control the sequence of stimulation. Researchers explained the game rules before the experiment to ensure subjects understood them. All subjects experienced Level 1 of the main game (30 s) and a waiting page (60 s, sequence determined by Latin Square Design), as shown in Figures 6, 7. After completing all experiments and questionnaires while wearing the VR headset to avoid interruptions, subjects participated in open-ended interviews. Each session lasted approximately 1 h per subject.
4.2 Results of visual stimulation intensity on time perceptions and cognitive load
In this stage, the authors analyzed the influence of stimuli of different intensities on the interactive and non-interactive loading interfaces by averaging the trends of the dependent variables. The results presented in Table 4 show that the lowest cognitive load was found for environmental details (None) x visual stimulation (None) in the non-interactive interface (0.521), and the lowest cognitive load was found for environmental details (None) x visual stimulation (Yes) and environmental details (Yes) x visual stimulation (None) in the interactive interface (0.54).
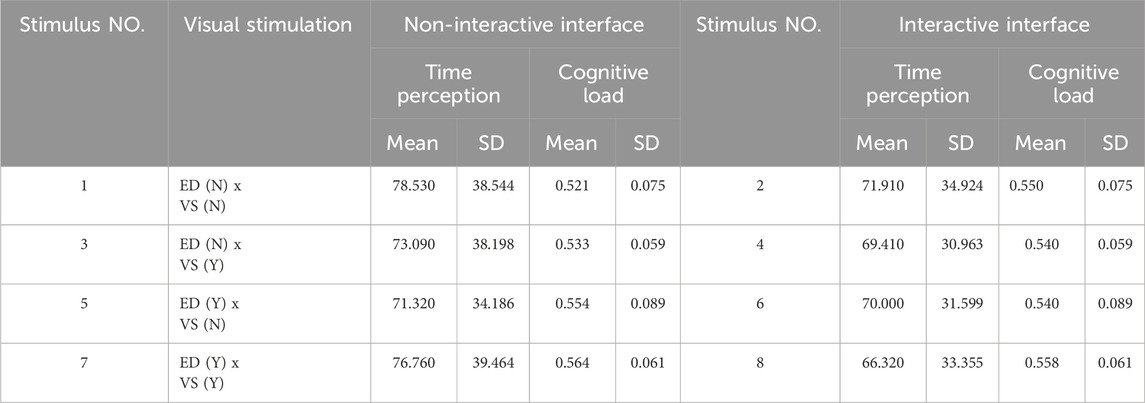
Table 4. Statistical analysis of effects of interface interactivity and visual stimulation on time perceptions and cognitive load.
The effects of different visual stimulation intensities on time perceptions (F (3,31) = 0.447, p = 0.721) and cognitive load (F (3,31) = 0.503, p = 0.683) were not significantly different for the interactive interface. Therefore, H3a and H5a were not supported. In the case of the non-interactive interface, visual stimulation intensity was not significantly different for time perceptions (F (3,31) = 0.902, p = 0.451); thus, H3b was not supported. However, cognitive load reached a significant difference (F (3,31) = 2.892, p = 0.039), thereby supporting H5b.
4.3 Results of visual stimulation intensity on emotions
The emotion questionnaire consisted of 14 questions on positive and negative emotions. The questionnaire used a 7-point Likert scale, and reliability was confirmed with a Cronbach’s α coefficient of 0.758. The results show that different visual stimulation factors affected positive and negative emotions for both the interactive and non-interactive interfaces. The means of positive and negative emotions were respectively 2.85 and 2.25 in the absence of visual stimulation without environmental details; however, when both visual stimulation and environmental details were present, positive emotions decreased slightly to 3.08, and negative emotions increased slightly to 2.17, which implies that visual stimulation intensity may affect participants’ emotions. Detailed data are shown in Table 5. In the case of the interactive interface, visual stimulation intensity did not reach a significant difference for positive emotions (F (3,31) = 1.15, p = 0.328), which means H4a was not supported. Negative emotions (F (3,31) = 3.109, p = 0.039) reached a significant difference, providing support for H4c. For the non-interactive interface, visual stimulation intensity was not significant for both positive (F (3,31) = 1.425, p = 0.24) and negative (F (3,31) = 1.655, p = 0.182) emotions; thus, H4b and H4d were not supported.
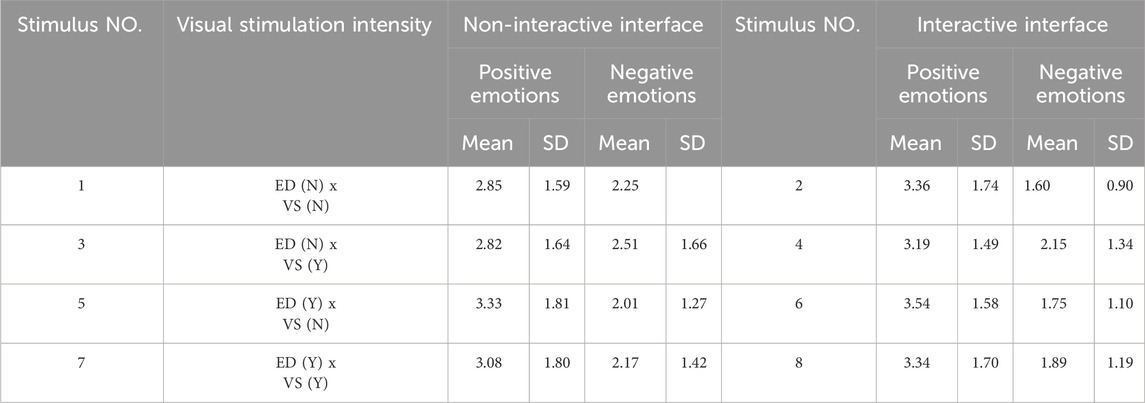
Table 5. Analysis of effects of interface interactivity and visual stimulation on emotions.
5 Discussion and conclusion
5.1 Discussion
Based on SOR and time perception theories, this study explores how sensory stimulation in VR game loading interfaces affects individuals’ internal states (time perceptions and emotions) and responses (cognitive load). Previous studies on loading interfaces often used simulations. They thus lacked comprehensive research on waiting scenarios in real VR games, typically focusing on 360-degree image interactions or optimizing algorithms to enhance viewing smoothness (Bendre et al., 2024; Sun et al., 2018; Zeynali et al., 2024). This study fills the research gap on loading interfaces in VR environments.
As Suh and Prophet (2018) and Kourouthanassis et al. (2015) have suggested, sensory stimulation is crucial for enhancing user experiences in immersive environments. Visual stimulation in immersive technologies evokes cognitive and emotional states, leading to behavioral changes. This study considers the effects of visual stimulation and interactivity, combining the characteristics of VR and interactive waiting experiences in the gaming industry. This study expands the research field of loading interfaces by exploring the impact of interactivity and visual stimulation during waiting times.
5.1.1 Impact of interactivity on time perceptions and emotions
This study found that increasing scene details and interactive elements effectively stimulates players’ desire to explore, reduces time perception, triggers positive emotional effects, and lessens negative emotions such as impatience (as found by Bhaskaran et al. (2022)). However, the length of waiting times must be considered in the design of interactive loading interfaces. When waiting times are short, the impact on time perceptions might be negligible. However, adding interactive elements can significantly reduce players’ negative feelings when waiting times are longer (e.g., 60 s).
In current VR game loading interfaces, many games have waiting times of up to 1 minute. Many of these present only black screens for these waiting periods (e.g., Iron Man in VR and Batman Arkham VR). Some games, such as Sniper Elite VR and ARK Park’s PSVR, allow players to look around in a 3D environment that does not contain interactive objects. This rotatable viewpoint is similar to the non-interactive interface of our experimental system. Recently, a number of games have introduced more interactive designs. For example, Smalland VR (2023) features particle effects and text prompts during loading, and Bulletstorm VR (2023) includes gameplay videos on the loading screen. These examples highlight the gaming industry’s emphasis on improving player experience during waiting periods and demonstrate the practical contributions of this study to VR user experience.
5.1.2 Impact of visual stimulation intensity
As Liu (2017) pointed out, visual stimulation in immersive virtual environments affects human perception and behavior in distinctly different ways. This study found that in non-interactive interfaces, increased levels of visual stimulation reduced participants’ time perceptions and increased their cognitive load. However, this effect was more stable in interactive interfaces. Previous research suggests that managing cognitive load is crucial when dealing with multiple messages and emotion regulation (Lang, 2020; Lang et al., 2007). Additionally, research has shown that adjusting visual complexity can help users to stay more focused during VR tasks (Chiossi et al., 2022). As a result, in VR interactive interfaces, the effects of visual stimulation on time perceptions and cognitive load may be less pronounced after a certain threshold has been reached, as players’ attentional resources are focused on the interactive elements.
Even though the experimental results of the present study did not reach statistical significance in terms of the effect of visual stimulation on time perceptions between the non-interactive and interactive interfaces, we still observed changes in time perceptions as visual stimulation increased. Other possible factors may have had a more significant effect on time perceptions, making the effect of visual stimulation smaller. This phenomenon may be due to the weak contrast between the visual stimulation and non-interactive interfaces as well as the possible anchoring effect of the fixed loading interface in the experimental design (Kahneman et al., 1982), which makes the data susceptible to the effect of repeated testing as well as the effect of the expected time.
Visual stimuli in the interactive interface were found to significantly affect negative emotions. When players interacted with the interface, the effect of other visual stimuli on their negative emotions was amplified. Although the impact of visual stimulation on positive emotions did not reach statistical significance in both non-interactive and interactive interfaces, the average values of positive emotions still showed that visual variety is an effective tool for eliciting pleasure, as found in a study by Batistatou et al. (2022).
Notably, because participants experienced both interactive and non-interactive interfaces, we observed and gathered from interviews that, compared to their experiences with interactive interfaces, participants felt more disappointed when they discovered that visually detailed scenes lacked interactive elements. This finding can be explained by motivation theory, which posits that intrinsic motivation arises from curiosity and interest in activities perceived as satisfying and stimulating (Deci and Ryan, 1985). The interactive loading interface designed in this study may enhance or activate players’ intrinsic motivation, triggering their desire for further interaction with the visual stimuli.
It is worth noting that the choice of visual stimuli should be adjusted to the specific game environment and individual player differences. Some respondents “preferred scenes with details” because the details made them curious and encouraged a sense of exploration and anticipation. The design of visual particles, especially fast-moving particles (Jording et al., 2022; Novotny and Laidlaw, 2024), may generate positive or negative emotions according to personal preferences. Our results discovered that interactivity was reliably found to reduce time perceptions and mitigate negative emotions across player preferences.
5.2 Conclusion
This study applied SOR theory to validate the feasibility of designing interactive loading interfaces for VR games and the effectiveness of incorporating psychological stimuli related to waiting into game-loading interfaces. The results confirmed that such effects directly result from the stimuli on the individual’s internal and external states. By adding interactive elements and environmental details during waiting times, this research significantly improved players’ waiting experiences and mitigated the adverse effects caused by prolonged waiting periods. Moreover, physiological data measurements indirectly showed that the responses triggered during VR game waits might align with similar paradigms found in past research.
Compared to the non-interactive loading interface, the interactive loading interface resulted in shorter time perceptions, increased positive emotions, and decreased negative emotions. As waiting times increased, the interactivity of the interface increased the variance in time perceptions and emotional responses. In the interactive interface, players’ attention was focused on the interactive elements; therefore, after a certain threshold, the effect of visual stimuli on time perceptions and cognitive load decreased. For the non-interactive interface, increases in visual stimulation were associated with increases in cognitive load.
Visual stimulation elicited both positive and negative emotions. Players’ interactions also seemed to amplify the effects of visual stimuli on negative emotions. Interactions may also satisfy players’ intrinsic motivation and trigger expectations for further interactions with other visual stimuli; thus, attention should be paid to players’ expectations when designing interfaces with visual stimulation.
5.3 Limitations and suggestions for future study
First, this study focused on the direct impact of stimuli on internal and external variables within SOR theory instead of treating individual internal responses as mediating variables. Future research should consider the effects of time perceptions and emotions on cognitive load. Additionally, to enable the participants to master the game quickly, the game levels in this study were designed to be less challenging. This may have affected players’ intrinsic motivation. Further research is necessary to examine the consistency of the findings across different game genres. In terms of experimental design, we used repeated testing. However, the long experimental time may have triggered the anchoring and practice effects of repeated experimental testing (Liu et al., 2024). Experimental times and randomization should be carefully considered in future studies.
Additionally, this study did not measure a baseline for the dependent variables before the experiment, which may affect the interpretation of results. Participants’ initial states (e.g., emotion and cognitive load) could influence their perception of time, as psychological factors such as anxiety or focus level may impact time perception independently of the VR environment manipulation. Future studies should consider incorporating baseline measurements—such as static waiting tasks or time estimation in a quiet environment—before the experiment to ensure that subsequent changes in measurement can be attributed to the VR interface manipulation rather than individual differences.
Furthermore, future research could adopt a more comprehensive approach in terms of cognitive load measurement. While some scholars question the reliability of subjective measures (Buchner et al., 2025; Kosch et al., 2023), many studies suggest combining subjective and objective assessments to provide a more holistic analysis (Ayres et al., 2021). For instance, existing research widely employs NASA-TLX alongside physiological measurements, including electrodermal activity (EDA) (Armougum et al., 2019; Chiossi et al., 2022; Kim et al., 2025), heart rate variability (HRV) (Che et al., 2025; Reddy et al., 2022), electroencephalography (EEG) (Chiossi et al., 2025; van Weelden et al., 2024), and electrocardiography (ECG) (Weiß and Pfeiffer, 2024). Future research should integrate baseline measurements with multimodal cognitive load assessment to enhance data reliability and interpretability. Furthermore, the selected measurement methods may have failed to capture subtle differences in time perceptions due to visual stimulation; future research could include more refined measurement methods or more sensitive experimental designs to detect the effects of visual stimulation on time perceptions.
Because individual player preferences may have affected players’ responses to the stimuli presented on the loading interface, we suggest that the population of subjects be further categorized to increase the accuracy of the findings. Numerous VR studies have focused on the interaction effects of multimodal sensory experiences on user experience (Dzardanova et al., 2024; Jacucci, 2017; Yuan et al., 2023). Future experiments could consider incorporating auditory (Bosman et al., 2024; Picard et al., 2023) and tactile interactions as stimuli. Finally, since the stimuli in waiting scenarios are influenced by individual player experiences, we suggest that future studies could further segment the participant groups to derive more accurate conclusions.
Data availability statement
The data is not available for public access due to the following restrictions: the dataset includes sensitive information that could compromise the privacy of research participants. Data access is therefore restricted to the research team and under strict ethical standards to ensure data protection and confidentiality. Requests to access the datasets should be directed to Tzu-Hsuan Wang, d2lubmllOTg3NEBnbWFpbC5jb20=.
Ethics statement
The studies involving humans were approved by Research Ethics Committee of National Taiwan University. The studies were conducted in accordance with the local legislation and institutional requirements. The participants provided their written informed consent to participate in this study. Written informed consent was obtained from the individual(s) for the publication of any potentially identifiable images or data included in this article.
Author contributions
Y-TH: Conceptualization, Funding acquisition, Methodology, Supervision, Writing – review and editing. C-CH: Conceptualization, Data curation, Formal Analysis, Investigation, Writing – original draft. T-HW: Project administration, Validation, Visualization, Writing – review and editing.
Funding
The author(s) declare that financial support was received for the research and/or publication of this article. This research made possible by the Taiwan MOE Teaching Practice Research Programme, Project number MOE-113-TPRHA-0025-006Y1.
Acknowledgments
This research was funded by the Taiwan MOE Teaching Practice Research Programme.
Conflict of interest
The authors declare that the research was conducted in the absence of any commercial or financial relationships that could be construed as a potential conflict of interest.
Generative AI statement
The author(s) declare that no Generative AI was used in the creation of this manuscript.
Publisher’s note
All claims expressed in this article are solely those of the authors and do not necessarily represent those of their affiliated organizations, or those of the publisher, the editors and the reviewers. Any product that may be evaluated in this article, or claim that may be made by its manufacturer, is not guaranteed or endorsed by the publisher.
References
Ahmadi, M., Michalka, S. W., Lenzoni, S., Najafabadi, M. A., Bai, H., Sumich, A., et al. (2023). “Cognitive load measurement with physiological sensors in virtual reality during physical activity,” in Proceedings of the 29th ACM symposium on virtual reality software and technology (Christchurch, New Zealand). doi:10.1145/3611659.3615704
Alhilal, A., Wu, Z., Tsui, Y. H., and Hui, P. (2024). “FovOptix: human vision-compatible video encoding and adaptive streaming in VR cloud gaming,” in MMSys 2024 - proceedings of the 2024 ACM multimedia systems conference.
Armougum, A., Orriols, E., Gaston-Bellegarde, A., Marle, C. J.-L., and Piolino, P. (2019). Virtual reality: a new method to investigate cognitive load during navigation. J. Environ. Psychol. 65, 101338. doi:10.1016/j.jenvp.2019.101338
Asish, S. M., Kulshreshth, A. K., and Borst, C. W. (2022). Detecting distracted students in educational VR environments using machine learning on eye gaze data. Comput. Graph. (Pergamon) 109, 75–87. doi:10.1016/j.cag.2022.10.007
Ayres, P., Lee, J. Y., Paas, F., and van Merriënboer, J. J. G. (2021). The validity of physiological measures to identify differences in intrinsic cognitive load. Front. Psychol. 12, 702538. doi:10.3389/fpsyg.2021.702538
Baños, R. M., Botella, C., Alcañiz, M., Liaño, V., Guerrero, B., and Rey, B. (2004). Immersion and emotion: their impact on the sense of presence. Cyberpsychology and Behav. 7 (6), 734–741. doi:10.1089/cpb.2004.7.734
Bartyzel, P., Igras-Cybulska, M., Hekiert, D., Majdak, M., Łukawski, G., Bohné, T., et al. (2025). Exploring user reception of speech-controlled virtual reality environment for voice and public speaking training. Comput. and Graph., 126, 104160. doi:10.1016/j.cag.2024.104160
Batistatou, A., Vandeville, F., and Delevoye-Turrell, Y. N. (2022). Virtual reality to evaluate the impact of colorful interventions and nature elements on spontaneous walking, gaze, and emotion. Front. Virtual Real. 3. doi:10.3389/frvir.2022.819597
Bendre, P. A., Kumar, S., and A., F.A. (2024). Enhancing 360- degree video streaming via selective inpainting for bandwidth optimization. 2024 IEEE 21st Consumer Communications & Networking Conference (CCNC).
Bhaskaran, S., Marappan, R., Veeramanickam, M. R. M., Bharathiraja, N., Hariharan, S., and Pradeepa, K. (2022). Sentiment Analysis Model using Text and Emoticons for Pharmaceutical & Healthcare Industries. Proceedings - 2022 2nd International Conference on Innovative Sustainable Computational Technologies, CISCT 2022.
Bi, N., Chi, Y.-C., Lin, Y.-Y., Lee, M.-J., and Chen, B.-Y. (2024). Blow your mind: exploring the effects of scene-switching and visualization of time constraints on brainstorming in virtual reality. Proc. ACM Hum.-Comput. Interact. 8 (CSCW2), 1–23. doi:10.1145/3687026
Birt, J., and Vasilevski, N. (2021). Comparison of single and multiuser immersive mobile virtual reality usability in construction education. Educ. Technol. Soc. 24 (2), 93–106. Available online at: https://www.jstor.org/stable/27004934
Bitner, M. J. (1992). Servicescapes: the impact of physical surroundings on customers and employees. J. Mark. 56 (2), 57–71. doi:10.1177/002224299205600205
Block, R. A., and Gruber, R. P. (2014). Time perception, attention, and memory: a selective review. Acta Psychol. 149, 129–133. doi:10.1016/j.actpsy.2013.11.003
Block, R. A., and Zakay, D. (1996). Models of psychological time revisited. Time mind Editor H. Helfrich (Kirkland, WA: Hogrefe & Huber), 171–195.
Block, R. A., and Zakay, D. (1997). Prospective and retrospective duration judgments: a meta-analytic review. Psychonomic Bull. and Rev. 4 (2), 184–197. doi:10.3758/BF03209393
Bosman, I. D. V., Buruk, O. O., Jørgensen, K., and Hamari, J. (2024). The effect of audio on the experience in virtual reality: a scoping review. Behav. Inf. Technol. 43 (1), 165–199. doi:10.1080/0144929X.2022.2158371
Britten, B. (2020). “Google doodles and collective memory-making,” in Handbook of visual communication: theory, methods, and media, 334–348. Available online at: https://www.scopus.com/inward/record.uri?eid=2-s2.0-85105366196&partnerID=40&md5=dca95764c70bf47a31b04cff3b7c3808.
Brown, S. W. (1995). Time, change, and motion: the effects of stimulus movement on temporal perception. Percept. and Psychophys. 57 (1), 105–116. doi:10.3758/BF03211853
Buchner, S. L., Kintz, J. R., Zhang, J. Y., Banerjee, N. T., Clark, T. K., and Hayman, A. P. (2025). Assessing physiological signal utility and sensor burden in estimating trust, situation awareness, and mental workload. J. Cognitive Eng. Decis. Mak., 15553434241310084. doi:10.1177/15553434241310084
Cellan-Jones, R. (2016). The year when VR goes from virtual to reality. BBC News. Available online at: https://www.bbc.com/news/technology-35205783.
Chang, H. L., Hu, H. C., Wang, K., Tsaih, R. H., and Pu, L. (2018). “How design features lead to visitors' visit intention through virtual reality experience: the case of national palace museum,” in Proceedings of the 22nd pacific asia conference on information systems - opportunities and challenges for the digitized society: are we ready? PACIS 2018.
Che, X., Tang, R., Lin, J., Hui, Q., Zhang, Y., Li, J., et al. (2025). Three-dimensional (3D) stimuli are always better than two-dimensional (2D) multi-tasking? A high cognitive load in 3D-MATB-II. Behav. Brain Res., 477, 115322. doi:10.1016/j.bbr.2024.115322
Chen, C., Liu, K., Yang, H., and Wu, M. (2020). “The development characteristics of virtual reality after the year of VR,” in Proceedings - 2020 international conference on innovation design and digital technology, ICIDDT 2020.
Chen, C.-H., and Li, S. (2020). The effect of visual feedback types on the wait indicator interface of a mobile application. Displays 61, 101928. doi:10.1016/j.displa.2019.101928
Chen, C. H., and Li, S. (2022). A study on the errors in time perception and waiting experiences of user interface design for mobile devices. J. Des. 27 (4), 1–19. Available online at: https://www.scopus.com/inward/record.uri?eid=2-s2.0-85165996544&partnerID=40&md5=b4fbf539ce6653d5f84fccd454a1c0c5.
Cheng, A., Ma, D., Qian, H., and Pan, Y. (2023). The effects of mobile applications’ passive and interactive loading screen types on waiting experience. Behav. and Inf. Technol. 43, 1652–1663. doi:10.1080/0144929X.2023.2224901
Cheng, S., Sheng, D., Gao, Y., Dong, Z., and Han, T. (2024). “Enhancing positive emotions through interactive virtual reality experiences: an EEG-based investigation,” in Proceedings - 2024 IEEE conference on virtual reality and 3D user interfaces, VR 2024.
Cheymol, A., Fribourg, R., Lecuyer, A., Normand, J. M., and Argelaguet, F. (2023). Beyond my real body: characterization, impacts, applications and perspectives of 'dissimilar' avatars in virtual reality. IEEE Trans. Vis. Comput. Graph. 29 (11), 4426–4437. doi:10.1109/TVCG.2023.3320209
Chiossi, F., Ou, C., Gerhardt, C., Putze, F., and Mayer, S. (2025). Designing and evaluating an adaptive virtual reality system using EEG frequencies to balance internal and external attention states. Int. J. Human-Computer Stud., 196, 103433. doi:10.1016/j.ijhcs.2024.103433
Chiossi, F., Welsch, R., Villa, S., Chuang, L., and Mayer, S. (2022). Virtual reality adaptation using electrodermal activity to support the user experience. Big Data Cognitive Comput. 6 (2), 55. Article 55. doi:10.3390/bdcc6020055
Cruz, J., Coluci, V., and Moraes, R. (2023). ORUN-VR2: a VR serious game on the projectile kinematics: design, evaluation, and learning outcomes. Virtual Real., 1–22. doi:10.1007/s10055-023-00824-w
Csikszentmihalyi, M., and Csikszentmihalyi, I. S. (1992). Optimal experience: psychological studies of flow in consciousness. Cambridge, United Kingdom: Cambridge University Press.
Cui, X., Tian, Y., Zhang, L., Chen, Y., Bai, Y., Li, D., et al. (2023). The role of valence, arousal, stimulus type, and temporal paradigm in the effect of emotion on time perception: a meta-analysis. Psychonomic Bull. Rev. 30 (1), 1–21. doi:10.3758/s13423-022-02148-3
Deci, E. L., and Ryan, R. M. (1985). Intrinsic Motivation and Self-Determination in Human Behavior. Berlin: Springer. doi:10.1007/978-1-4899-2271-7
de Carvalho, B. J. A., Soares, M. M., das Neves, A. M. M., and Medeiros, R. P. (2013). Interactive doodles: a comparative analysis of the usability and playability of Google trademark games between 2010 and 2012. Design, user experience, and usability. Health. Learn. Play. Cult. Cross-Cultural User Exp. doi:10.1007/978-3-642-39241-2_56
De Witte, B., Reynaert, V., Hutain, J., Kieken, D., Jabbour, J., and Possik, J. (2024). Immersive learning of factual knowledge while assessing the influence of cognitive load and spatial abilities. Comput. and Educ. X Real. 5, 100085. doi:10.1016/j.cexr.2024.100085
Dey, A., Barde, A., Yuan, B., Sareen, E., Dobbins, C., Goh, A., et al. (2022). Effects of interacting with facial expressions and controllers in different virtual environments on presence, usability, affect, and neurophysiological signals. Int. J. Hum. Comput. Stud. 160, 102762. doi:10.1016/j.ijhcs.2021.102762
Dubovi, I. (2022). Cognitive and emotional engagement while learning with VR: The perspective of multimodal methodology [Article]. Comput. Educ. 183. doi:10.1016/j.compedu.2022.104495
Dzardanova, E., Nikolakopoulou, V., Kasapakis, V., Vosinakis, S., Xenakis, I., and Gavalas, D. (2024). Exploring the impact of non-verbal cues on user experience in immersive virtual reality. Comput. Animat. Virtual Worlds 35 (1), e2224. doi:10.1002/cav.2224
Faul, F., Erdfelder, E., Buchner, A., and Lang, A.-G. (2009). Statistical power analyses using G* Power 3.1: tests for correlation and regression analyses. Behav. Res. methods 41 (4), 1149–1160. doi:10.3758/brm.41.4.1149
Fisher, J. T., Keene, J. R., Huskey, R., and Weber, R. (2018). The limited capacity model of motivated mediated message processing: taking stock of the past. Ann. Int. Commun. Assoc. 42 (4), 270–290. doi:10.1080/23808985.2018.1534552
Foy, H. J., and Chapman, P. (2018). Mental workload is reflected in driver behaviour, physiology, eye movements and prefrontal cortex activation. Appl. Ergon. 73, 90–99. doi:10.1016/j.apergo.2018.06.006
Gable, P. A., Wilhelm, A. L., and Poole, B. D. (2022). How does emotion influence time perception? A review of evidence linking emotional motivation and time processing. Front. Psychol. 13, 848154. doi:10.3389/fpsyg.2022.848154
Garson, O. T. (2014). Relativity: A hot stove and a pretty girl. Quote Investigator. Available online at: https://quoteinvestigator.com/2014/11/24/hot-stove/.
Godefroit-Winkel, D., Schill, M., and Diop-Sall, F. (2022). Does environmental corporate social responsibility increase consumer loyalty? Int. J. Retail and Distribution Manag. 50 (4), 417–436. doi:10.1108/ijrdm-08-2020-0292
Gowrisankaran, S., Nahar, N. K., Hayes, J. R., and Sheedy, J. E. (2012). Asthenopia and blink rate under visual and cognitive loads. Optometry Vis. Sci. 89 (1), 97–104. doi:10.1097/OPX.0b013e318236dd88
Gupta, K., Hajika, R., Pai, Y. S., Duenser, A., Lochner, M., and Billinghurst, M. (2019). “In AI we trust: investigating the relationship between biosignals, trust and cognitive load,” in VR proceedings of the 25th ACM symposium on virtual reality software and technology (Parramatta, NSW, Australia). doi:10.1145/3359996.3364276
Halbig, A., and Latoschik, M. E. (2021). A systematic review of physiological measurements, factors, methods, and applications in virtual reality. Front. Virtual Real. 2. doi:10.3389/frvir.2021.694567
Harris, D., Wilson, M., and Vine, S. (2020). Development and validation of a simulation workload measure: the simulation task load index (SIM-TLX). Virtual Real. 24 (4), 557–566. doi:10.1007/s10055-019-00422-9
Hart, S. G. (2006). Nasa-task load index (NASA-TLX); 20 Years later. Proc. Hum. Factors Ergonomics Soc. Annu. Meet. 50 (9), 904–908. doi:10.1177/154193120605000909
Hart, S. G., and Staveland, L. E. (1988). Development of NASA-TLX (task load index): results of empirical and theoretical research. In, P. A. Hancock, and N. Meshkati (Eds.), Advances in psychology (Vol. 52, pp. 139–183). North-Holland. doi:10.1016/S0166-4115(08)62386-9
Hartfill, J., Bormann, F., Riebandt, K., Kühn, S., and Steinicke, F. (2024). Objective agency measurement of different hand appearances in virtual reality with intentional binding. Virtual Real. 29 (1), 14. doi:10.1007/s10055-024-01085-x
Heidrich, D., Wohlan, A., and Schaller, M. (2020). “Perceived speed, frustration and enjoyment of interactive and passive loading scenarios in virtual reality,” in Lecture notes in computer science (including subseries lecture notes in artificial intelligence and lecture notes in bioinformatics).
Igarzábal, F. A., Hruby, H., Witowska, J., Khoshnoud, S., and Wittmann, M. (2021). What happens while waiting in virtual reality? A comparison between a virtual and a real waiting situation concerning boredom, self-regulation, and the experience of time. Technol. Mind, Behav. 2 (2). doi:10.1037/tmb0000038
Jacoby, J. (2002). Stimulus-organism-response reconsidered: an evolutionary step in modeling (consumer) behavior. J. consumer Psychol. 12 (1), 51–57. doi:10.1207/s15327663jcp1201_05
Jacucci, G. (2017). Toward affective social interaction in VR. Interactions 24 (4), 6–8. doi:10.1145/3097462
Jording, M., Vogel, D. H. V., Viswanathan, S., and Vogeley, K. (2022). Dissociating passage and duration of time experiences through the intensity of ongoing visual change. Sci. Rep. 12 (1), 8226. doi:10.1038/s41598-022-12063-1
Jou, J. Y. H., Huang, Y.-Y., Chen, H.-N., and Yang, J.-M. (2006). The effect of affective states and the delays at different phases of a service delivery on the perceived waiting time. Sun Yat-Sen Manag. Rev. (2), 487. doi:10.6160/2006.06.07
Kahneman, D., Slovic, P., and Tversky, A. (1982). Judgment Under Uncertainty: Heuristics and Biases. Cambridge: University Press. Available online at: https://books.google.com.tw/books?id=_0H8gwj4a1MC.
Kanai, R., Paffen, C. L. E., Hogendoorn, H., and Verstraten, F. A. J. (2006). Time dilation in dynamic visual display. J. Vis. 6 (12), 8. doi:10.1167/6.12.8
Kim, M. J., Lee, C.-K., and Jung, T. (2020). Exploring consumer behavior in virtual reality tourism using an extended stimulus-organism-response model. J. Travel Res. 59 (1), 69–89. doi:10.1177/0047287518818915
Kim, S., Kang, Y., and Lazaro, M. J. (2025). Development and validation of spatial disorientation scenarios using virtual reality and motion simulator. Appl. Ergon. 125, 104457. doi:10.1016/j.apergo.2024.104457
Kleygrewe, L., Hutter, R. I. V., Koedijk, M., and Oudejans, R. R. D. (2024). Virtual reality training for police officers: a comparison of training responses in VR and real-life training. Police Pract. Res. 25 (1), 18–37. doi:10.1080/15614263.2023.2176307
Kosch, T., Karolus, J., Zagermann, J., Reiterer, H., Schmidt, A., and WoÅ°niak, P. W. (2023). A survey on measuring cognitive workload in human-computer interaction. ACM Comput. Surv. 55 (13s), 1–39. doi:10.1145/3582272
Kourouthanassis, P., Boletsis, C., Bardaki, C., and Chasanidou, D. (2015). Tourists responses to mobile augmented reality travel guides: The role of emotions on adoption behavior. Pervasive and Mobile Computing. 18, 71–87. doi:10.1016/j.pmcj.2014.08.009
Kurusathianpong, P., and Tangmanee, C. (2018). “Comparison of perceived waiting time between two lengths of progress indicator and two styles of graphics animation with perceived uncertainty as a covariate,” in 2018 seventh ICT international student project conference (ICT-ISPC).
Lallemand, C., and Gronier, G. (2012). Enhancing user experience during waiting time in HCI: contributions of cognitive psychology. DIS’2012.
Lamotte, M., Izaute, M., and Droit-Volet, S. (2012). Awareness of time distortions and its relation with time judgment: a metacognitive approach. Conscious. Cognition 21(2), 835–842. doi:10.1016/j.concog.2012.02.012
Landeck, M., Alvarez Igarzábal, F., Unruh, F., Habenicht, H., Khoshnoud, S., Wittmann, M., et al. (2023). Journey through a virtual tunnel: simulated motion and its effects on the experience of time. Front. Virtual Real. 3. doi:10.3389/frvir.2022.1059971
Lang, B. (2020). An untapped opportunity to reduce the friction of using VR headsets. Road to VR. Available online at: https://www.roadtovr.com/reducing-vr-friction-pre-headset-selection-loading/. (Accessed on June 17, 2020).
Lataifeh, M., Ahmed, N., Elbardawil, S., and Gordani, S. (2024). Assessing the legibility of Arabic road signage using eye gazing and cognitive loading metrics. Computers 13 (5), 123. doi:10.3390/computers13050123
Latifi, T., Li, J., Blum, S. C., and Fowler, D. (2024). Determinants of users’ intention to visit a destination: a virtual reality quality framework. J. Qual. Assur. Hosp. Tour., 1–25. doi:10.1080/1528008X.2024.2440010
Latini, A., Marcelli, L., Di Giuseppe, E., and D'Orazio, M. (2024). Investigating the impact of greenery elements in office environments on cognitive performance, visual attention and distraction: an eye-tracking pilot-study in virtual reality. Appl. Ergon. 118, 104286. doi:10.1016/j.apergo.2024.104286
Lee, H. (2014). Measuring cognitive load with electroencephalography and self-report: focus on the effect of English-medium learning for Korean students. Educ. Psychol. 34 (7), 838–848. doi:10.1080/01443410.2013.860217
Lee, Y. G., Chen, A. N., and Hess, T. (2017). The online waiting experience: using temporal information and distractors to make online waits feel shorter. J. Assoc. Inf. Syst. 18 (3), 231–263. doi:10.17705/1jais.00452
Levine, S. R., Wyer Jr, R. S., and Schwarz, N. (1994). Are you what you feel? The affective and cognitive determinants of self-judgments. Eur. J. Soc. Psychol. 24 (1), 63–77. doi:10.1002/ejsp.2420240105
Li, W., Wang, M., Li, W., Cai, B., and Shi, Y. (2020). An improvement on the progress bar: make it a story, make it a game Advances in Intelligent Systems and Computing.
Liang, J., Xie, P., Yang, X., and Wu, Y. (2023). “Performance analysis of improvemental LOD technology under VR headsets,” in Third international conference on artificial intelligence, virtual reality, and visualization (AIVRV 2023).
Liao, H., Xie, N., Li, H., Li, Y., Su, J., Jiang, F., et al. (2020). “Data-driven spatio-temporal analysis via multi-modal zeitgebers and cognitive load in VR,” in Proceedings - 2020 IEEE conference on virtual reality and 3D user interfaces, VR 2020.
Liu, F. (2017). HTC Vive participates in Shanghai MWC on a large scale! Brings many interesting VR applications such as Transformers 5 shooting game. Available online at: https://lpcomment.com/2017/06/29/htc-mwcs-17-vive/files/2687/htc-mwcs-17-vive.html.
Liu, F., Zhou, Y., and Hu, J. (2024). An attention-based approach for assessing the effectiveness of emotion-evoking in immersive environment [Article]. Heliyon. 10 (3), e25017. doi:10.1016/j.heliyon.2024.e25017
Lofca, K., Jerald, J., Costa, D., and Kopper, R. (2023). “Does adding physical realism to virtual reality training reduce time compression,” in Proceedings - 2023 IEEE conference on virtual reality and 3D user interfaces abstracts and workshops, VRW 2023.
Lovasz-Bukvova, H., Hölzl, M., Kormann-Hainzl, G., Moser, T., Zigart, T., and Schlund, S. (2021). Usability and task load of applications in augmented and virtual reality. Systems, software and services process improvement. Cham.
Lozano, A. (2022). Modalities and aesthetics of waiting in video games. Artnodes 2022 (30). doi:10.7238/artnodes.v0i30.398865
Mala Kalaiarasan, S., Vafaei-Zadeh, A., Hanifah, H., and Ramayah, T. (2024). Can we engage players with extended reality in gaming applications? A Stimulus-Organism-Response framework. Entertain. Comput. 50, 100651. doi:10.1016/j.entcom.2024.100651
Matthews, W. J., and Meck, W. H. (2016). Temporal cognition: connecting subjective time to perception, attention, and memory. Psychol. Bull. 142 (8), 865–907. doi:10.1037/bul0000045
Mondellini, M., Colombo, V., Arlati, S., Lawson, G., and Cobb, S. (2022). Human factors and ergonomics. In Roadmapping extended reality (pp. 229–256). doi:10.1002/9781119865810.ch10
Mostajeran, F., Fischer, M., Steinicke, F., and Kühn, S. (2023). Effects of exposure to immersive computer-generated virtual nature and control environments on affect and cognition. Sci. Rep. 13 (1), 220. doi:10.1038/s41598-022-26750-6
Mullen, G., and Davidenko, N. (2021). Time compression in virtual reality. Timing and Time Percept. 9 (4), 377–392. doi:10.1163/22134468-bja10034
Myers, B. A. (1985). The importance of percent-done progress indicators for computer-human interfaces. ACM SIGCHI Bull. 16 (4), 11–17. doi:10.1145/1165385.317459
Niknam, S., Picard, S., Rondinelli, V., and Botev, J. (2024). Some times fly: the effects of engagement and environmental dynamics on time perception in virtual reality proceedings of the 30th ACM symposium on virtual reality software and technology. Germany: Trier. doi:10.1145/3641825.3687726
Novotny, J., and Laidlaw, D. H. (2024). Evaluating Text Reading Speed in VR Scenes and 3D Particle Visualizations. IEEE Transactions on Visualization and Computer Graphics, 30 (5), 2602–2612. doi:10.1109/TVCG.2024.3372093
Paas, F., Tuovinen, J. E., Tabbers, H., and Van Gerven, P. W. M. (2003). Cognitive load measurement as a means to advance cognitive load theory. Educ. Psychol. 38 (1), 63–71. doi:10.1207/S15326985EP3801_8
Pedroli, E., Greci, L., Colombo, D., Serino, S., Cipresso, P., Arlati, S., et al. (2018). Characteristics, usability, and users experience of a system combining cognitive and physical therapy in a virtual environment: positive bike. Sensors 18 (7), 2343. doi:10.3390/s18072343
Pibernik, J., Dolić, J., Mandić, L., and Kovač, V. (2023). Mobile-application loading-animation design and implementation optimization. Appl. Sci. Switz. 13 (2), 865. doi:10.3390/app13020865
Picard, S., and Botev, J. (2023). “Rhythmic stimuli and time experience in virtual reality,” in Lecture notes in computer science (including subseries lecture notes in artificial intelligence and lecture notes in bioinformatics).
Qu, C., Che, X., Ma, S., and Zhu, S. (2022). Bio-physiological-signals-based VR cybersickness detection [Article]. CCF Trans. Pervasive Comput. Interact. 4 (3), 268–284. doi:10.1007/s42486-022-00103-8
Raees, M., and Ullah, S. (2020). THE-3DI: tracing head and eyes for 3D interactions: an interaction technique for virtual environments. Multimedia Tools Appl. 79 (1-2), 1311–1337. doi:10.1007/s11042-019-08305-6
Reddy, G. S. R., Spencer, C. A., Durkee, K., Cox, B., Fox Cotton, O., Galbreath, S., et al. (2022). Estimating cognitive load and cybersickness of pilots in VR simulations via unobtrusive physiological sensors. 251, 269. doi:10.1007/978-3-031-06015-1_18
Rhiu, I., Kim, Y. M., Kim, W., and Yun, M. H. (2020). The evaluation of user experience of a human walking and a driving simulation in the virtual reality. Int. J. Industrial Ergonomics 79, 103002. doi:10.1016/j.ergon.2020.103002
Riva, G., Mantovani, F., Capideville, C. S., Preziosa, A., Morganti, F., Villani, D., et al. (2007). Affective interactions using virtual reality: the link between presence and emotions. Cyberpsychology and Behav. 10 (1), 45–56. doi:10.1089/cpb.2006.9993
Rodríguez-Fernández, A., den Berg, A. v., Cucinella, S. L., Lobo-Prat, J., Font-Llagunes, J. M., and Marchal-Crespo, L. (2024). Immersive virtual reality for learning exoskeleton-like virtual walking: a feasibility study. J. NeuroEngineering Rehabilitation 21 (1), 195. doi:10.1186/s12984-024-01482-y
Sarkar, A., Bansal, M., Lea, D., and Bura, D. (2024). Artificial Intelligence for Virtual Reality 1 Virtual reality: A simulated experience: a comprehensive view. De Gruyter. Editors J. Hemanth, M. Bhatia, and I. De La Torre Diez, 1–14. doi:10.1515/9783110713817-001
Seawright, K., and Sampson, S. (2007). A video method for empirically studying wait-perception bias. J. Operations Manag. 25, 1055–1066. doi:10.1016/j.jom.2006.10.006
Shelton, B., Nesbitt, K., Thorpe, A., and Eidels, A. (2021). Gauging the utility of ambient displays by measuring cognitive load. Cognition, Technol. Work 23 (3), 459–480. doi:10.1007/s10111-020-00639-8
Siegel, E., Wei, J., Gomes, A., Oliviera, M., Sundaramoorthy, P., Smathers, K., et al. (2021). HP Omnicept cognitive load database (HPO-CLD)–developing a multimodal inference engine for detecting real-time mental workload in VR. HP Labs.
Šķilters, J., Zariņa, L., Luguzis, A., Baliņa, S., Umbraško, S., and Apse, L. (2023). Color-emotion mappings and their demographic dependencies in digital environment: online test evidence using MS paint 7 color palette. Baltic J. Mod. Comput. 11 (3), 354–382. doi:10.22364/bjmc.2023.11.3.01
Skylark, W. (2011). How do changes in speed affect the perception of duration? J. Exp. Psychol. Hum. Percept. Perform. 37, 1617–1627. doi:10.1037/a0022193
Smith, J. (2016). 2016’s five best virtual reality headsets. ZDNET. Available online at: https://www.zdnet.com/article/2016s-five-best-virtual-reality-headsets/
Söderström, U., Bååth, M., and Mejtoft, T. (2018). “The Users' Time Perception: the effect of various animation speeds on loading screens,” in Proceedings of the 36th European conference on cognitive ergonomics. Utrecht, Netherlands. doi:10.1145/3232078.3232092
Somarathna, R., Bednarz, T., and Mohammadi, G. (2023). Virtual reality for emotion elicitation - a review. IEEE Trans. Affect. Comput. 14 (4), 2626–2645. doi:10.1109/TAFFC.2022.3181053
Souchet, A. D., Philippe, S., Lourdeaux, D., and Leroy, L. (2022). Measuring visual fatigue and cognitive load via eye tracking while learning with virtual reality head-mounted displays: a review. Int. J. Human–Computer Interact. 38 (9), 801–824. doi:10.1080/10447318.2021.1976509
Su, L., Hsu, M. K., and Boostrom, R. E. (2020). From recreation to responsibility: increasing environmentally responsible behavior in tourism. J. Bus. Res. 109, 557–573. doi:10.1016/j.jbusres.2018.12.055
Suh, A., and Prophet, J. (2018). The state of immersive technology research: a literature analysis. Comput. Hum. Behav. 86, 77–90. doi:10.1016/j.chb.2018.04.019
Sun, L., Duanmu, F., Liu, Y., Wang, Y., Ye, Y., and Shi, H. (2018). Multi-path multi-tier 360-degree video streaming in 5G networks Proceedings of the 9th ACM Multimedia Systems Conference, Amsterdam, Netherlands. doi:10.1145/3204949.3204978
Surovaya, E., Prayag, G., Yung, R., and Khoo-Lattimore, C. (2020). Telepresent or not? Virtual reality, service perceptions, emotions and post-consumption behaviors. Anatolia 31 (4), 620–635. [Article]. doi:10.1080/13032917.2020.1808431
Sweller, J. (1988). Cognitive load during problem solving: effects on learning. Cognitive Sci. 12 (2), 257–285. doi:10.1016/0364-0213(88)90023-7
Tastan, H., Tuker, C., and Tong, T. (2022). Using handheld user interface and direct manipulation for architectural modeling in immersive virtual reality: an exploratory study. Comput. Appl. Eng. Educ. 30 (2), 415–434. doi:10.1002/cae.22463
Unruh, F., Landeck, M., Oberdörfer, S., Lugrin, J.-L., and Latoschik, M. E. (2021). The influence of avatar embodiment on time perception-towards vr for time-based therapy. Front. Virtual Real. 2, 658509. doi:10.3389/frvir.2021.658509
Urbano, A., Mortimer, M., Horan, B., Stefan, H., and Antlej, K. (2024). Using SIM-TLX to investigate the potential impacts on cognitive load while undertaking tasks in a virtual workplace. J. Workplace Learn. 36 (7), 585–604. doi:10.1108/JWL-03-2024-0060
Valtchanov, D., and Ellard, C. G. (2015). Cognitive and affective responses to natural scenes: effects of low level visual properties on preference, cognitive load and eye-movements. J. Environ. Psychol. 43, 184–195. doi:10.1016/j.jenvp.2015.07.001
van der Ham, I. J. M., Klaassen, F., van Schie, K., and Cuperus, A. (2019). Elapsed time estimates in virtual reality and the physical world: the role of arousal and emotional valence. Comput. Hum. Behav. 94, 77–81. doi:10.1016/j.chb.2019.01.005
van Weelden, E., Wiltshire, T. J., Alimardani, M., and Louwerse, M. M. (2024). Exploring the impact of virtual reality flight simulations on EEG neural patterns and task performance. Cognitive Syst. Res. 88, 101282. doi:10.1016/j.cogsys.2024.101282
Velev, D., and Zlateva, P. (2017). Virtual reality challenges in education and training. Int. J. Learn. 3 (1), 33–37. doi:10.18178/IJLT.3.1.33-37
Vieira, V. A. (2013). Stimuli–organism-response framework: a meta-analytic review in the store environment. J. Bus. Res. 66 (9), 1420–1426. doi:10.1016/j.jbusres.2012.05.009
Vorrink, N., Wicaksono, H., Fatahi, H., and Valilai, O. (2024). Analyzing VR/AR Technology Capabilities for Enhancing the Effectiveness of Learning Processes with Focus on Gamification. Intell. Syst. Appl. Cham.
Vorwerg-Gall, S., Stamm, O., and Haink, M. (2023). Virtual reality exergame in older patients with hypertension: a preliminary study to determine load intensity and blood pressure. BMC Geriatr. 23 (1), 527. doi:10.1186/s12877-023-04245-x
Weiß, T., and Pfeiffer, J. (2024). Consumer decisions in virtual commerce: predict good help-timing based on cognitive load. J. Neurosci. Psychol. Econ. 17 (2), 119–144. doi:10.1037/npe0000191
Whelan, R. R. (2007). Neuroimaging of cognitive load in instructional multimedia. Educ. Res. Rev., 2(1), 1–12. doi:10.1016/j.edurev.2006.11.001
Wienrich, C., Döllinger, N., Kock, S., Schindler, K., and Traupe, O. (2018). “Assessing user experience in virtual reality–a comparison of different measurements. Design, User Experience,” in Theory and Practice: 7th International Conference, DUXU 2018, Held as Part of HCI International 2018, Las Vegas, NV, USA, July 15-20, 2018.
Wintersberger, P., Klotz, T., and Riener, A. (2020). Tell me more: transparency and time-fillers to optimize Chatbots'Waiting time experience. ACM international conference proceeding series.
Witowska, J., Schmidt, S., and Wittmann, M. (2020). What happens while waiting? How self-regulation affects boredom and subjective time during a real waiting situation. Acta Psychol. 205, 103061. doi:10.1016/j.actpsy.2020.103061
Wu, D. Y., Lin, J. H. T., and Bowman, N. D. (2022). Watching VR advertising together: how 3D animated agents influence audience responses and enjoyment to VR advertising. Comput. Hum. Behav. 133, 107255. Article 107255. doi:10.1016/j.chb.2022.107255
Yuan, Z., He, S., Liu, Y., and Yu, L. (2023). MEinVR: multimodal interaction techniques in immersive exploration. Vis. Inf. 7 (3), 37–48. doi:10.1016/j.visinf.2023.06.001
Zagermann, J., Pfeil, U., and Reiterer, H. (2016). Measuring cognitive load using eye tracking technology in visual computing. Proc. sixth workshop beyond time errors Nov. Eval. methods Vis., 78–85. doi:10.1145/2993901.2993908
Zakay, D., and Block, R. A. (1995). “An attentional-gate model of prospective time estimation,” in Time and the Dynamic control of Behavior. Editors M. Richelle, V. D. Keyser, G. D. Ydeualle, and A. Vandierendonck (Liege: University of Liege Press), 167–178.
Zakay, D., and Block, R. A. (1997). Temporal cognition. Curr. Dir. Psychol. Sci. 6 (1), 12–16. doi:10.1111/1467-8721.ep11512604
Zakay, D., and Hornik, J. (1991). How Much Time Did You Wait in Line?: A Time Perception Perspective, Time and Consumer Behaviour, Proceedings of the VIIth John-Labatt Marketing Research Seminar. Editors J.-C. Chebat and M. V. Venkatesan (Montréal: U.Q.A.M), 1–18.
Zakay, D., Nitzan, D., and Glicksohn, J. (1983). The influence of task difficulty and external tempo on subjective time estimation. Percept. and Psychophys. 34, 451–456. doi:10.3758/BF03203060
Zeynali, A., Hajiesmaili, M. H., and Sitaraman, R. K. (2024). BOLA360: Near-optimal view and bitrate adaptation for 360-degree video streaming. Proceedings of the 15th ACM Multimedia Systems Conference.
Zhang, N., Hu, H.-L., Tso, S. H., and Liu, C. (2023). To switch or not? Effects of spokes-character urgency during the social app loading process and app type on user switching intention. Front. Psychol. 14, 1110808. doi:10.3389/fpsyg.2023.1110808
Zhou, Y., and Popescu, V. (2024). CloVR: fast-startup low-latency cloud VR. IEEE Trans. Vis. Comput. Graph. 30 (5), 2337–2346. doi:10.1109/TVCG.2024.3372059
Zhu, J., Jiang, Y., Jiang, Y., Wang, Y., and Yang, Q. (2023). The effectiveness of social elements in virtual reality tourism: a mental imagery perspective. J. Hosp. Tour. Manag. 56, 135–146. doi:10.1016/j.jhtm.2023.05.024
Zwiezen, Z. (2020). in VR you can't escape the loading screen. Available online at: https://kotaku.com/in-vr-you-cant-escape-the-loading-screen-1844248197.
Keywords: virtual reality, time perception, cognitive load, visual stimulation, loading interface
Citation: Huang Y-T, Hsu C-C and Wang T-H (2025) Effects of interactive loading interfaces for virtual reality game environments on time perception, cognitive load, and emotions. Front. Virtual Real. 6:1540406. doi: 10.3389/frvir.2025.1540406
Received: 05 December 2024; Accepted: 22 April 2025;
Published: 15 May 2025.
Edited by:
Min Li, Xi’an Jiaotong University, ChinaReviewed by:
Marta Mondellini, National Research Council (CNR), ItalyJean Botev, University of Luxembourg, Luxembourg
Copyright © 2025 Huang, Hsu and Wang. This is an open-access article distributed under the terms of the Creative Commons Attribution License (CC BY). The use, distribution or reproduction in other forums is permitted, provided the original author(s) and the copyright owner(s) are credited and that the original publication in this journal is cited, in accordance with accepted academic practice. No use, distribution or reproduction is permitted which does not comply with these terms.
*Correspondence: Tzu-Hsuan Wang, d2lubmllOTg3NEBnbWFpbC5jb20=